MARINE SOLUTIONS:GROWTH THROUGH A SMART MARINE ECOSYSTEM
Roger Holm,President, Marine Solutions & Executive Vice President

© Wärtsilä PUBLIC2
Positive global economic conditions support shipping tonnage demand growth, while political and regulatory uncertainty limit the market recovery
MARINE MARKETS AND DRIVERS
-6%
-4%
-2%
0%
2%
4%
6%
8%
10%
2000
2002
2004
2006
2008
2010
2012
2014
2016
2018(f
)
2020
World seaborne trade and GDP
GDP growth
Seaborne trade growth
-500
0
500
1 000
1 500
2 000
2 500
201
3
201
5
201
7
201
9
202
1
202
3
202
5
202
7
202
9
Historical Forecast
No o
f vessels
Deliveries, removals and net fleet growth
Net fleet growth
Removals
Deliveries
Source: Clarksons Platou
-15%
-10%
-5%
0%
5%
10%
15%
20%
Jan
-2014
Ma
r-2014
Ma
y-2
014
Jul-2
014
Se
p-2
014
Nov-2
014
Jan
-2015
Ma
r-2015
Ma
y-2
015
Jul-2
015
Se
p-2
015
Nov-2
015
Jan
-2016
Ma
r-2016
Ma
y-2
016
Jul-2
016
Se
p-2
016
Nov-2
016
Jan
-2017
Ma
r-2017
Ma
y-2
017
Jul-2
017
Se
p-2
017
Nov-2
017
Jan
-2018
Ma
r-2018
Newbuilding price index Yr/Yr change
Oil Tanker
Dry Cargo
Bulkcarrier
Gas Carrier Newbuilding Price Index
Newbuilding Price Index
Containership Newbuilding Price
0
10 000
20 000
30 000
40 000
50 000
60 000
70 000
Jan
-2014
Ap
r-2014
Jul-2
014
Oct-
2014
Jan
-2015
Ap
r-2015
Jul-2
015
Oct-
2015
Jan
-2016
Ap
r-2016
Jul-2
016
Oct-
2016
Jan
-2017
Ap
r-2017
Jul-2
017
Oct-
2017
Jan
-2018
Ap
r-2018
Clarksons average earnings (USD/Day)
ClarkSea Index
Tanker
Bulker
LPG Carrier
Containership
Containership Newbuilding Price
31 May 2018 Roger Holm

© Wärtsilä PUBLIC3
Despite higher oil prices, US onshore production growth delays the offshore recovery
OFFSHORE MARKETS AND DRIVERS
2016 2017 2018 2019 2020 2021 2022 2023 2024 2025
E&P capex spend, MUSD difference %
Offshore Onshore
0
50000
100000
150000
200000
250000
300000
2014 2015 2016 2017 2018 2019 2020 2021 2022 2023 2024 2025
MU
SD
Offshore E&P capex
Ultra deepwater (1500+ meter)Deep water (125-1500 meter)Shelf (to 125 meter)
Source: Clarksons Platou, Rystad Energy
35%
25%
15%
5%
-5%
-15%
-25%40
45
50
55
60
65
0
10
20
30
40
50
60
70
80
Jan
-2016
Ma
r-2016
Ma
y-2
016
Jul-2
016
Se
p-2
016
Nov-2
016
Jan
-2017
Ma
r-2017
Ma
y-2
017
Jul-2
017
Se
p-2
017
Nov-2
017
Jan
-2018
Ma
r-2018
US
D/b
bl
Oil price and Clarksonsoffshore index
U.K., Brent Blend Spot Average Oil Price (USD/bbl)
Clarksons Offshore Index
31 May 2018 Roger Holm

© Wärtsilä PUBLIC4
General market sentiment is cautiously optimistic
VESSEL CONTRACTING
2 384
1 5791 490
536
920 855933
1 1661 236
1 311
0
500
1 000
1 500
2 000
2 500
3 000
2013
2014
2015
2016
2017
2018
2019
2020
2021
2022
Historical Forecast
Merchant contracting
Tankers Bulk Carrier
Containerships Other Merchant
166
181
113
27
40
85 88 89 90
103
0
20
40
60
80
100
120
140
160
180
200
2013
2014
2015
2016
2017
2018
2019
2020
2021
2022
Historical Forecast
Gas carriers contracting
LPG Carriers LNG Carriers
121131
121
203
152153146
106
121124
0
50
100
150
200
250
2013
2014
2015
2016
2017
2018
2019
2020
2021
2022
Historical Forecast
Cruise and ferry contracting
Passenger Ferries Cruise
734
641
275
10479 89
108
189
272
353
0
100
200
300
400
500
600
700
800
2013
2014
2015
2016
2017
2018
2019
2020
2021
2022
Historical Forecast
Offshore contracting
Survey, Logistics, Rescue & Salvage
Construction Units
Offshore Support Vessels
Mobile Production
Mobile Drilling
Source: Clarksons Platou, Wärtsilä Internal Analysis
No o
f vessels
No o
f vessels
No o
f vessels
No o
f vessels
31 May 2018 Roger Holm
© Wärtsilä PUBLIC5
Drivers and sentiment vary in different vessel segments
SHORT-TERM OUTLOOK
Bulk: Price increases have
slowed interest. Fundamentals
suggest charter market conditions
will improve but volatility remains.
Tankers: Markets remain tough for crude.
Market fundamentals expected to improve.
High levels of demolition recently. Interest in
scrubbers and scrubber ready.
LPG: LPG shipping markets may gradually recover this year, key
factors remain US supply and Chinese and Indian imports, while
recovering newbuilding demand and using LPG as bunker fuel
could have a longer-term impact
LNG: Strong demand growth in Asia. Market
sentiment expects the market to continue to improve.
Increasing interest in small scale LNG and bunkering.
FSRU also going to expand.
Containers: Order
potential improving.
Offshore: The long-term outlook for large mobile
production projects has further improved, helped by
ongoing project cost management efforts. High levels of
demolition have continued providing some support for
utilization in the rig market. Order book remains
significant in the drilling and OSV sectors.
Ferries: Fleet renewal and
potential implementation of
new emission regulations
drive contracting.
Cruise: There is continuing optimism over the prospect
for global expansion of the cruise fleet. Increased interest
towards small expedition ships. There is growing interest
in LNG power. Record order book.
Source: Marine Solutions BI internal analysis, Clarkson Platou
31 May 2018 Roger Holm

© Wärtsilä PUBLIC
Transforming our operations to meet market requirements
6 31 May 2018 Roger Holm
© Wärtsilä PUBLIC7
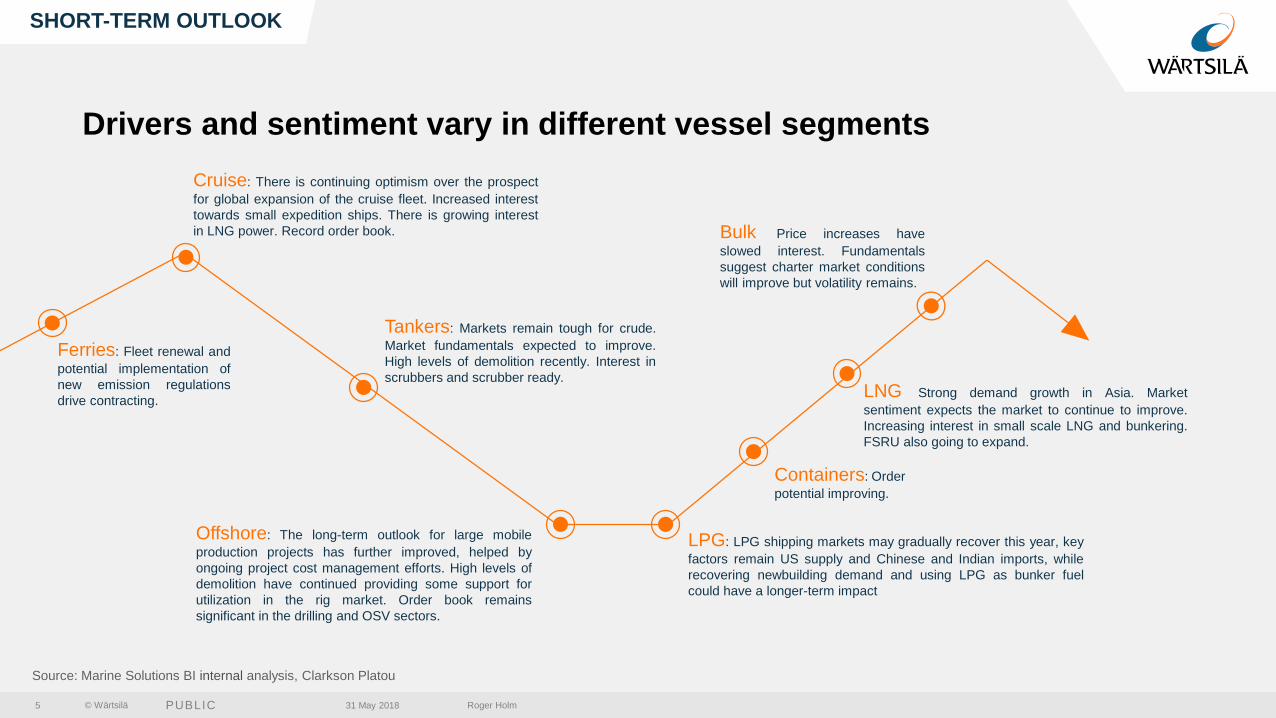
ADAPTING OUR COST BASE
-90
-80
-70
-60
-50
-40
-30
-20
-10
0
2016 2017-800
-700
-600
-500
-400
-300
-200
-100
0
2016 2017
FTEs decreased with ~1,000 FTEsover the past two years
Realignment and operational excellence hassignificantly improved our competitiveness…
Capacity cost decreased with ~120 MEUR over the past two years
ME
UR
FT
Es
31 May 2018 Roger Holm

© Wärtsilä PUBLIC8
Machine stop reduction
40% By enabling Predictive
Maintenance
Defect reduction
15%
Less internal mistakes due to reworking or bad recording
of data.
Ease new products introduction
20% By enabling production data analytics about issues and
production set up
WIP reduction
30% By a better resources utilisation
& flexible planning
Reduction In energy usage
25% By smart energy
management systems
Reduction of survey costs
30% By means of remote survey &
data streaming
CONTINUOUS IMPROVEMENT
* Example from one factory
…and we have new targets for further improvements
Targets for further optimisation (2017–2020)Lead time reduction
achieved (2016–2018)
Production lead time -20%
Main assembly lead time -25%
Standard hours/MW -32%
31 May 2018 Roger Holm

© Wärtsilä PUBLIC9
MARINE SOLUTIONS MARKET POSITION AND COMPETITOR LANDSCAPE
Top playerGas carriers
Cruise & ferry
Offshore
Mid-playerSpecial vessels
ChallengerNavy
Traditional merchant
Top playerGas carriers
Mid-playerSpecial vessels
ChallengerTraditional merchant
Top playerCruise & ferry
Traditional merchant
Ports
Academy
Mid-playerSpecial vessels
ChallengerNavy
Marine power solutions Processing solutions Voyage solutions
• Automation,
navigation
& communication
• Entertainment
systems
• Simulation &
training solutions
• Fleet operations
solutions
• Ship traffic control
solutions
• Special products
• Water & waste
• Flow solutions
• Gas solutions
• Power supply
• Power conversion
• Propulsion,
• Exhaust treatment
31 May 2018 Roger Holm

© Wärtsilä PUBLIC
Leading the industry transformation towards a Smart Marine Ecosystem
10 31 May 2018 Roger Holm
© Wärtsilä PUBLIC
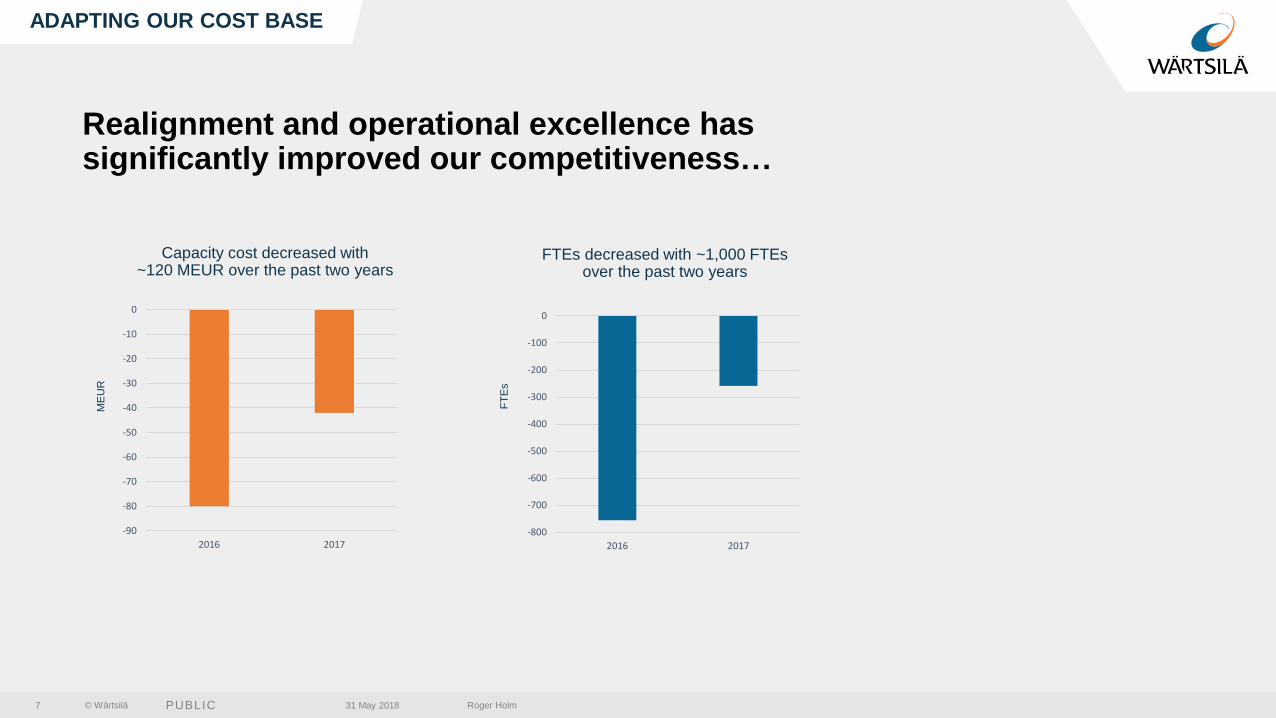
FROM PRODUCTS TO A SMART MARINE ECOSYSTEM
11 31 May 2018 Roger Holm

© Wärtsilä PUBLIC
Offshore
Cruise
Ferry
Gas Carrier
Containership
Fuel efficiency
0.2 BEUR
1.3 BEUR
0.3 BEUR
14.5 BEUR
Time at Terminal
0.7 BEUR
-
1.0 BEUR
2.1 BEUR
0.5 BEUR -
OPPORTUNITIES FOR WÄRTSILÄ AND CUSTOMERS
20 BEUR waste is incurred annually from poor fuel efficiency & time at terminal
Total global shipping fuel bill of roughly 100 BEUR today
12 31 May 2018 Roger Holm

© Wärtsilä PUBLIC
The Smart MarineEcosystem
13 31 May 2018 Roger Holm

© Wärtsilä PUBLIC
Towards a zero emission futureEliminating sources of waste through digitalisation
31 May 2018 Roger Holm14
© Wärtsilä PUBLIC15
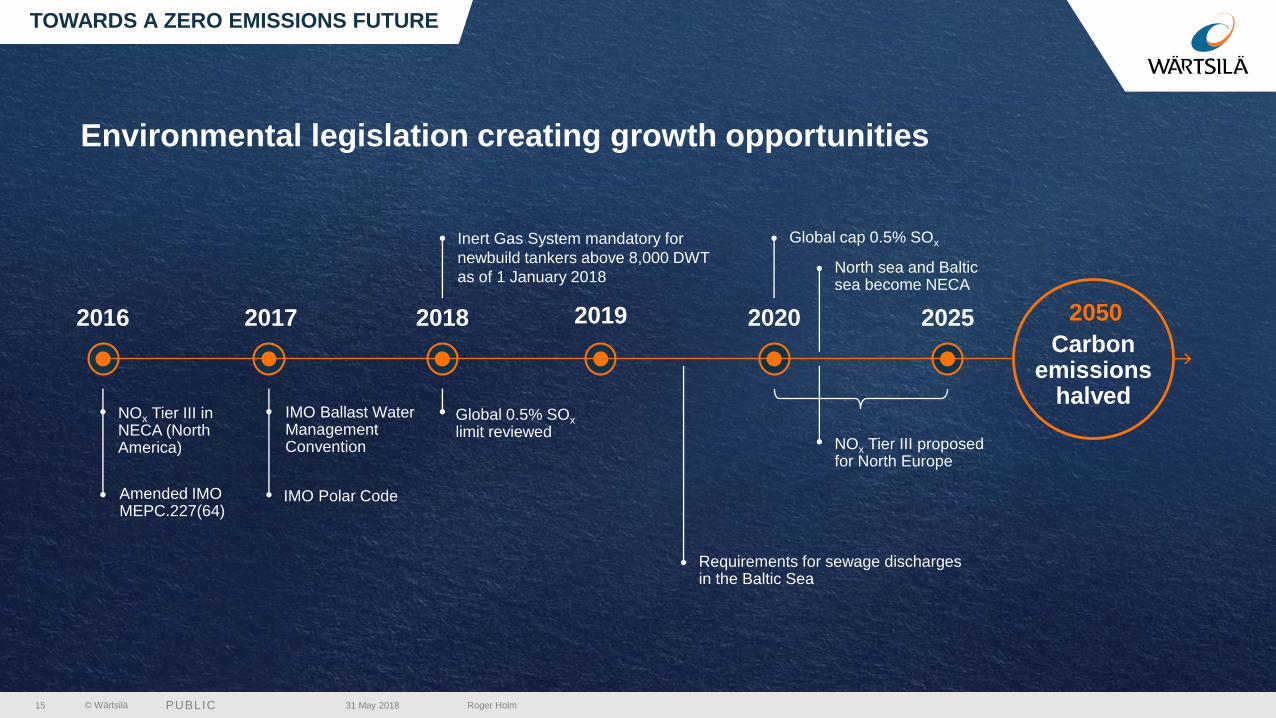
Environmental legislation creating growth opportunities
TOWARDS A ZERO EMISSIONS FUTURE
2016 2017 2019 2020 2025
IMO Ballast Water Management Convention
IMO Polar Code
Global 0.5% SOx
limit reviewed
Amended IMO MEPC.227(64)
NOx Tier III in NECA (North America)
2018
Inert Gas System mandatory for
newbuild tankers above 8,000 DWT
as of 1 January 2018
Global cap 0.5% SOx
North sea and Baltic sea become NECA
Requirements for sewage discharges in the Baltic Sea
NOx Tier III proposed for North Europe
2050
Carbon emissions
halved
31 May 2018 Roger Holm

© Wärtsilä PUBLIC16
SHIPPING TODAY
F O S S I L
F U E L S
P O RT
C O N G E S T I ON
P R E S C R I P T I VEM A I N T E N A N C E
R O U T E B A S E D
O N H U M A N
E X P E RI E NCE
M A N U A L
O P E R AT I O N S
S H O RT T E R M P L A N N I N G
31 May 2018 Roger Holm

© Wärtsilä PUBLIC17
SHIPPING TODAY: WÄRTSILÄ CASE Saving per voyage with just-in-time arrival:
74.5 tons of fuel*
22,200 EUR**
CASE:
5,500 TEU Containership
Distance: 1,150 Nautical Miles
* Assuming average SFOC : 230 g/kwh
** Assuming fuel price: 300 EUR/t
964 MWh actually consumed –
640 MWh simulated consumption
324 MWh potential savings
3.5 days
31 May 2018 Roger Holm

© Wärtsilä PUBLIC18
CONNECTING SMART VESSELS TO SMART PORTS
Smart Energy
Management
Navigation &
Intelligent Automation
Smart
Ports
01000111000 01000111000 01000111000 010001110001
31 May 2018 Roger Holm

© Wärtsilä PUBLIC19 31 May 2018 Roger Holm

© Wärtsilä PUBLIC20
THE VOYAGE OF THE FUTURE REQUIRES AN INDUSTRY TRANSFORMATION
R E A L T I M E S L O T
I N F O R M AT I ON
CO NNE CTE D TO
E C O S YS T E M
O P TI MIS E D O P E RAT I ON
AV O I D C O N G E S T I ON
O P E X S AV I N G S
A R R I V E TO P O RT J U S T
I N T I M E
* Wärtsilä case study from one major port identified the range of 100-200 million euros per year of
total fuel savings and CO2 emission reduction potential in the range of 1-2 millions of tons per year
31 May 2018 Roger Holm

© Wärtsilä PUBLIC
Our customers view on future shipping
21 31 May 2018 Roger Holm

© Wärtsilä PUBLIC
“Making shipping a cleaner, more effective
way of transporting goods.”
The main ecological and economical features
compared to traditional vessels:
• CO2 eq. reduced by more than 42%
• NOx reduction of 80%
• SOx and particles almost entirely eliminated
• Use of VOC as fuel reduces bunkering of 40%
• Reduce machinery running hours of 29%
• Reduce overall fuel consumption of 10%
22
TEEKAY – NEW SHUTTLE SPIRIT
31 May 2018 Roger Holm

© Wärtsilä PUBLIC
“A mutually beneficial partnership.”
Norwegian ro-ro passenger ship
Folgefonn, owned by ferry operator
Norled.
Autodocking is one of the first steps in
fully autonomous shipping.
Wärtsilä’s autodocking technology
delivers notable benefits to operators.
These include:
• improved safety
• less wear and tear
• greater efficiency in docking
PLAY VIDEO ON DIFFERENT SCREEN
23
NORLED – AUTODOCKING
31 May 2018 Roger Holm

© Wärtsilä PUBLIC
“Creating the world’s fastest and
most reactive tug models.”
SeaWays has worked closely with
Transas over the past 10 years.
• 360° TugSim- the most advanced in
the world
• Simulation benefits: realistic
exercises, improved safety, time and
fuel savings
• Training benefits: enables to operate
the company assets with greater
efficiency and vastly reduce fuel burn
and carbon emissions
24
SEAWAYS – TRAINING FACILITIES
31 May 2018 Roger Holm

© Wärtsilä PUBLIC25
"Growth is at no time by mere chance; it is the result of forces
working together."
31 May 2018 Roger Holm

THANK YOU
Recommended