~ i ~
GHANA NEG LE C TED TR OP ICA L DI SEA SE S
P R OGR AMM E
P U BLI C H EA LT H DIV IS IO N
MASTER PLAN FOR NEGLECTED TROPIC AL DISEASES PROGRAMME, GHANA (2016 – 2020)
April 2012

ii
FORWARD
FORWARD
Ghana’s Health Sector desires to see the country free from the following diseases: lymphatic filariasis , onchocerciasis , schistosomiasis, soil transmitted helminthiasis, trachoma, buruli ulcer, yaws, guinea worm, leprosy, leshmaniasis, human african trypanosomiasis among others referred to as the neglected tropical diseases (NTD). These NTDs which are debilitating and stigmatizing NTDs) are of immense public health significance in Ghana as they affect all 10 regions of the country geographically. The Ghana Health Service together with its supporting partners have put together the Neglected Tropical Diseases Programme to work towards the prevention, control, elimination or even eradication of these neglected tropical diseases by 2020. The programme focused on the Preventive Chemotherapy and Transmission Control (PCT) diseases namely lymphatic filariasis, onchocerciasis, schistosomiasis, soil transmitted helminthiasis, trachoma at its inception in 2006. Subsequently, there has been ongoing integration with the other neglected tropical diseases, which rely on innovative and intensive disease management (IDDM) as a strategy. The Ghana NTD Master Plan is a further step in consolidating this integration.
The programme’s objective is to integrate these diseases in the area of mass preventive chemotherapy and IDDM in order to improve mobilization of resources and maximize the efficient use of available resources for greater public health impact.
The Ghana Health Service/Ministry of Health recognizes that there is an enormous task ahead to ensure the realization of these noble individual programme objectives. This challenge in itself provides the desire and zeal to work towards achieving these objectives.
This Master Plan spells out the vision, mission and strategic direction of the Neglected Tropical Diseases Programme of the Ghana Health Service based on the 5 pillars of the Ghana Health sector which are financial and geographic accessibility, quality of care, efficiency, partnership and equitable distribution of resources. It is also aligned to the WHO AFRO strategy for NTD Control in Africa.
I wish to acknowledge the efforts of health and other professionals who worked tirelessly to provide the ideas and suggestions for this document and the support of WHO AFRO and other partners with interest in NTD control.
The hope is that this strategic document having been developed with the full participation of all stakeholders and partners will serve as a tool for resource mobilization and a guide for programme implementation towards the achievement of the goals of prevention, control, elimination or even eradication of the neglected tropical diseases in a sustainable manner.
Dr. Ebenezer Appiah-Denkyira
Director-General
Ghana Health Service

ii
ACKNOWLEDGEMENT
I wish to acknowledge the efforts of the NTD team in Ghana who worked tirelessly to provide the information, suggestions and undertake the actual development of this document. The WHO/AFRO, WHO/GHANA and WHO/Headquarters provided both technical and funding support for the initial workshops and temporary technical advisors who assisted in the development of this document. We acknowledge with thanks this support which has translated into this document.
Earlier versions of this document were drafted during a strategic plan development workshop in Harare, Zimbabwe in November 2010 with the support of WHO AFRO and later in a workshop in Accra, Ghana with technical support of 3 temporary technical advisors recruited by the WHO in April 2011. The Liverpool School of Tropical Medicine’s CNTD provided the funding for the Accra workshop which resulted in the finalization of this document. For this and other support offered by the Liverpool CNTD for NTD Control in Ghana we say thank you. To the technical advisers that came from Nigeria, Tanzanian and Uganda particularly Dr. Ngozi Njepoume who continued to work with the Ghana team in order to finalize this document even after their visit is very much appreciated.
All NTD programs especially Trachoma, Lymphatic Filariasis, Onchocerciasis, Schistosomiasis, Soil Transmitted Helminths, Yaws, Buruli Ulcer and HAT and all staff of the Ghana Health Service and the Ministry of Health for various ways in which they have supported the NTD control effort and strategic plan development.
Special mention is being made of the Director-General of the Ghana Health Service, Director, Public Health and Deputy-Director and Head, Disease Control and Prevention Department for the special interest and contribution to this Master Plan development and NTD control effort.

iii
CONTENTS
FORWARD .................................................................................................................................... II
ACKNOWLEDGEMENT................................................................................................................... II
CONTENTS................................................................................................................................... III
TABLE OF FIGURES ....................................................................................................................... IV
TABLE OF TABLES.......................................................................................................................... V
ACRONYMS IN NTD MASTER PLAN ............................................................................................... VI
1.0: INTRODUCTION ..................................................................................................................... 1
1.1: STRATEGIC DIRECTION ................................................................................................................. 2
1.2: SPECIFIC OUTCOME OBJECTIVES .................................................................................................... 2
1.3: PROGRAMME ACTIVITIES ............................................................................................................. 2
PART ONE: SITUATION ANALYSIS ................................................................................................... 4
2.0. COUNTRY PROFILE ............................................................................................................................ 4
2.1 Geography ......................................................................................................................................... 4
2.1.2: Administrative, Demography and Community Structures .......................................................... 5
2.1.3: Socio-economic Situation and Indicators ...................................................................................... 9
2.1.4: Transport and Communication ................................................................................................... 10
3.1: HEALTH SYSTEM SITUATION ANALYSIS ......................................................................................... 12
3.1.1: Health System Goals & Priorities................................................................................................. 12
3.1.2: The process of priority setting .................................................................................................... 13
3.1.3: Analysis of Overall Health System ............................................................................................... 13
4.0: NEGLECTED TROPICAL DISEASES SITUATION ANALYSES ............................................................... 19
4.1.1 Epidemiology and Burden of Disease ........................................................................................... 19
4.1.2: Trachoma ..................................................................................................................................... 19
4.1.3: Lymphatic Filariasis ..................................................................................................................... 20
4.1.4: Onchocerciasis ............................................................................................................................. 21
4.1.5: Schistosomiasis ............................................................................................................................ 21
4.1.5: Soil-transmitted Helminths ......................................................................................................... 22
4.1.6: Yaws ............................................................................................................................................. 22
4.1.6.1: The Ghana policy on Yaws ........................................................................................................ 23
4.1.7: Human African Trypanosomiasis (HAT) ....................................................................................... 23
4.1.8: Rabies .......................................................................................................................................... 24
4.1.9: Leishmaniasis ............................................................................................................................... 25
4.1.10: Buruli Ulcer ................................................................................................................................ 25
4.1.11: Guinea Worm ............................................................................................................................ 26
4.1.12: Leprosy ...................................................................................................................................... 27
4.2.0: NTD PROGRAMME IMPLEMENTATION ................................................................................................. 28
4.2.1: Gaps and Priorities ...................................................................................................................... 30
PART TWO: NTD STRATEGIC AGENDA ......................................................................................... 31
iv
5.1.: Overall NTD programme Mission and Goals ................................................................................ 31
5.2 Guiding Principles and Strategic Priorities ........................................................................................ 1
PART THREE: OPERATIONAL FRAMEWORK .................................................................................... 1
6.1 NTD Programme Focus ...................................................................................................................... 1
6.2 Strengthening Government Ownership Advocacy Coordination And Partnership ........................... 7
6.3: Enhance planning for results, resource mobilization and financial sustainability ......................... 11
6.4 Preventive Chemotherapy Interventions ............................................ Error! Bookmark not defined.
6.5: Monitoring, Support & Supervision ................................................... Error! Bookmark not defined.
6.6: Pharmacovigilance in NTD control activities ...................................... Error! Bookmark not defined.
6.7: Post Intervention Surveillance and Integration within Primary Health Care ... Error! Bookmark not
defined.
7.0: ANNEXES ............................................................................................................................. 66
8.0: REFERENCES ........................................................................ ERROR! BOOKMARK NOT DEFINED.
TABLE OF FIGURES
Figure 1: Map of Ghana .................................................................................................................................................... 4
Figure 2: Administrative map of Ghana .................................................................................................................... 5
Figure 3: Ghana Population Pyramid By Age And Sex ........................................................................................ 6
Figure 4: Levels Of Service Delivery ........................................................................................................................ 14
Figure 5: Organization of NTD Progrramme ....................................................................................................... 18
Figure 6: Distribution of five preventive chemotherapy diseases .............................................................. 19
Figure 7: Yaws distribution based on cases notified 2005 - 2008 .............................................................. 22
Figure 8: Distribution of places where HAT has ever been reported, 1980-2010 (shaded red) ... 24
Figure 9: Buruli ulcer endemicity map, Ghana ................................................................................................... 26

v
TABLE OF TABLES
Table 1: 2011 National population data projection from 2000 population census (DHSS 2000) ... 6
Table 1.1: National Health Indicators ........................................................................................................................ 9
Table 2: Road Distances from Accra ........................................................................................................................ 11
Table 2.1: Reduction in infant mortality in Ghana (GHS) ............................................................................... 15
Table 3: Mapping of PCT diseases and methods used ..................................................................................... 30
Table 4: Table 4. NTD CO-endemicity by district ............................................................................................... 29
Table 5: NTDs mapping/disease assessment/situation analysis................................................................ 31
Table 6: Summary Information On Endemic NTDs, Target Population and Specific Control Strategies ............................................................................................................................................................................ 32
Table 7: SWOT analysis of NTD programme ....................................................................................................... 32
Table 8: Strategic Framework Summary .................................................................................................................. 6
Table 9: Activities for strengthening government ownership, advocacy, coordination and partnership
Table 10: Planning for results, resource mobilization and financial sustainability ....................Error! Bookmark not defined.
Table 11: Scale up Access to NTD Interventions, treatment and service delivery capacities .Error! Bookmark not defined.
Table 12: Estimation of needs for mapping completion of PCT NTDs ............ Error! Bookmark not defined.
Table 13: Scaling up/scaling down: ICT card Needs .......................... Error! Bookmark not defined.
Table 14: Populations at risk targeted for PCT ...................................... Error! Bookmark not defined.
Table 15: Packages of MDA types ................................................................ Error! Bookmark not defined.
Table 16: Intervention packages for transmission control .............. Error! Bookmark not defined.
Table 17: Case management interventions ............................................. Error! Bookmark not defined.
Table 18: Activities to enhance NTD monitoring and evaluation, surveillance and operations research .................................................................................................................. Error! Bookmark not defined.

vi
ACRONYMS IN NTD MASTER PLAN
ANESVAD A Neustros Enfermos Servimos A Dios (Spanish NGO)
APOC Africa Programme for Onchocerciasis Control
BMC Budget Management Centre
BUD Buruli Ulcer Disease
CHPS Community Health and Planning Service
CM Case Management
CNTD Center for Neglected Tropical Disease
CSOs Civil Society Organizations
DCE District Chief Executive
DDHS District Director of Health Services
DHIMS District Health Management Information System
DHMTs District Health Management Teams
DHSS Demographic and Health Systems Survey
EPI Expanded Programme on Immunization
FDB Food and Drugs Board
GDHS Ghana Demographic and Health Survey
GDP Gross Domestic Product
GES Ghana Education Service
GHS Ghana Health Service
GNI Gross National Index
GOG Government of Ghana
GPRS Ghana Poverty Reduction Strategy
GSS Ghana Statistical Service
GWD Guinea Worm Disease GWEP Guinea Worm Eradication Programme

vii
HAT Human African Trypanosomiasis
HDI Human Development Index
HIRD High Impact Rapid Delivery
HIV Human Immunodeficiency Virus
HIV/AIDS Human Immunodeficiency Virus/Acquired Immune Deficiency Syndrome
HSDS Health Services Delivery System
ICD Institutional Care Division
ICT Information Communication Technology
IDSR Integrated Disease Surveillance and Response
ITI International Trachoma Initiative
LF Lymphatic Filariasis
LSTM Liverpool School of Tropical Medicine
MCH Maternal and Child Health
MDA Mass Drug Administration
MDAs Ministries, Departments, Agencies
MDGs Millennium Development Goals
MLG&RD Ministry of Local Government & Rural Development
MoF Ministry of Finance
MoFA Ministry of Food and Agriculture
MoH Ministry of Health
MoWAC Ministry of Women And Children
MSE Ministry of Science and Environment
MWRWH Ministry of Water Resources Works and Housing
NEPAD New Partnership for African Development
NGOs Non Governmental Organizations
NHIS National Health Insurance Scheme
NIDs National Immunization Days
NTD Neglected Tropical Disease
NTDP Neglected Tropical Diseases Programme
viii
PATTEC Pan African Tsetse and Trypanosomiasis Eradication Campaign
PCT Preventive Chemotherapy and Transmission Control
PHC Primary Health Care
PoW Plan of Work
PPME Policy Planning Monitoring and Evaluation
RHMTs Regional Health Management Teams
SADR Severe Adverse Drug Reaction
SCH Schistosomiasis
SHEP School Health Education Programme
SSTH Schistosomiasis and Soil Transmitted Helminths
STH Soil Transmitted Helminths
SWOT Strengths Weakness Opportunities Threats
TB Tuberculosis
UNICEF United Nations Children Emergency Fund
USAID United States Agency for International Development
WHO World Health Organization
WVG World Vision Ghana
WVI World Vision International

~ 1 ~
INTRODUCTION
Ghana is endemic for a number of neglected tropical diseases namely Lymphatic Filariasis, Onchocerciasis, Trachoma, Schistosomiasis, Soil transmitted helminthiasis, Buruli ulcer, Yaws, Leprosy, Guinea worm, Human African Trypanosomiasis (HAT), Cutaneous leishmaniasis and Rabies. The Ghana government is very much concerned about these diseases and has put in place the national master plan to address the situation in an integrated manner and link NTD plans to include costing and financing requirements. A strategic plan for the Neglected Tropical Diseases Programme (NTDP) has as its vision “Ghana free from ancient diseases and afflictions that have burdened humanity for centuries”.
The goal is to improve on the capacity of the GHS to establish an integrated NTDs programme capable of delivering interventions to prevent, control, eliminate or eradicate the neglected tropical diseases by the year 2020.
The Ghana NTDs Master Plan is a comprehensive multi-year plan (2013-2017) that addresses all the components of the NTD programme spelt out in this document. It includes preventive chemotherapy and case management of NTDs and is based on national strategic priorities and not disease specific. It will rely on integration and co-implementation and captures cost and financial plan for sustainability. This document provides the basis for national, regional and district annual work-plans.
It also forms the basis for harmonizing the joint support of all partners working in NTD, in terms of resource mobilization, information sharing, monitoring and evaluation and periodic reviews.
The Ghana NTD master plan is organized in three parts; situation analysis, NTD strategic agenda and Operational framework. There is also a section on detailed budget plan as well as annexes.
Several disease control programmes in Ghana covering major diseases such as Trachoma, Lymphatic Filariasis, Onchocerciasis, Schistosomiasis and Soil-transmitted Helminths overlap geographically. Furthermore some of these programmes use the same drugs for treatment and use similar strategies of drug delivery. In view of the existence of these common factors, there is need to integrate these related activities in order to maximize available resources and rationalize the operation of the various programmes. Tackling these diseases together will go a long way to increase knowledge in the causes, prevention and treatment of these diseases and produce the desired attitudinal and behavioural changes in a harmonized and cost effective way.

~ 2 ~
STRATEGIC DIRECTION
The strategic direction of the Neglected Tropical Diseases Program is based on the five pillars of the Ghana health sector - financial and geographical accessibility, quality of care, efficiency, partnership and equitable distribution of resources. In addition it includes covering all the strategic elements (which are preventive, curative and rehabilitative/corrective) for the control and elimination of the target diseases. It seeks to integrate in all activities to achievie higher population coverage and significant prevalence reduction than through the single-disease approach. This reduces cost per person treated and burden on human resources. It further lays the foundation for a sustainable model and mobilize more resources and generate more demand for the services.
SPECIFIC OUTCOME OBJECTIVES
The objectives, outputs and activities for this strategic plan are derived from the results of a situational and SWOT analysis. The expected outputs for the objectives are described and have been well harmonized with activities to achieve these outputs. The plan has been put in a Logical Framework Approach.
The objective of this document is to present a clear vision and 5-year strategic plan for the integrated prevention, control, elimination or even eradication of the Preventive Chemotherapy diseases and the Case Management diseases under the NTD programme.
The specific objectives of the programme are:
1. To maintain 100% geographical coverage of all districts by 2017 with integrated mass drug administration for all the preventive chemotherapy diseases while scaling down for those earmarked for elimination
2. To undertake case search and management for all the listed case management diseases in Ghana
3. To document the lessons and best practices of NTD programme in Ghana
PROGRAMME ACTIVITIES
Planning for the NTDP will be held at all levels of programme delivery. To ensure effective ownership and active participation by community members for the control of the Neglected Tropical Diseases Programme, effective social mobilization will be carried out through sensitization and mobilization of the community members for the programme.
Training of health workers, teachers, environmental health officers and community based volunteers will be done at regional, district and community levels jointly for all the diseases. Similar strategies for health promotion activities using mass media, print and interpersonal communication will be used to reach out to endemic communities. Two rounds of joint mass drug administration will be conducted to reach all endemic communities in the

~ 3 ~
country from 2011 to 2016. During the first round of treatment Ivermectin and Albendazole will be given to cover LF, Onchocerciasis and STH. The second round of treatment will be given 6 months after the first round to cover Onchocerciasis, STH and SCH with Ivermectin, Mebendazole and Praziquantel respectively.
Case search and management will be done all year round by trained health workers and volunteers. Rehabilitation and corrective surgery for the NTDP will involve the provision of surgery for patients who will need it and different forms of treatment provided for cases identified.
Joint or coordinated monitoring and evaluation of the entire programme will be done at all levels. Relevant surveys will be carried out for specific diseases.
Advocacy meetings will be held at all levels to increase awareness of NTDs and seek for support. Continuous advocacy will be made for partners to continue to provide safe water and sanitation facilities in all the endemic communities.

~ 4 ~
PART ONE: SITUATION ANALYSIS
The Ghana NTD master strategic plan is developed and implemented within the context of three major environments, namely;
Country Profile The Health system environment, and The NTD Programme Environment.
1.1. COUNTRY PROFILE
1.1.1 GEOGRAPHY
1.1.1.2: Location and Borders
Ghana lies on the West Coast of Africa between Latitudes 5º and 11º North of the Equator and between longitudes 1º East and 3º West of the zero meridian. It is bordered by the Gulf of Guinea in the South, Togo in the East, Cote d’Ivoire in the West and Burkina Faso in the North. The country has an area of 238,537 sq km with 550 kilometres of coastline. Ghana has typical tropical climate with temperatures between 21 and 32 degrees Celcius. There are three clear geographic zones; dry northern savanna, the humid middle forest rainfall zone and the coastal savannah and mangroves. There are six major rivers with several tributaries some of which are fast flowing. One of the rivers, River Volta has been dammed covering 3% of the country. Yaws and Buruli Ulcer are prevalent in the humid forest zone while the rivers and lakes predispose to Onchocerciasis along the fast flowing tributaries and Schistosomiasis in the areas with more stagnant waters. The coastal and dry northern zones are found to be more prevalent with Lymphatic Filariasis.
Figure 1: Map Of Ghana
~ 5 ~
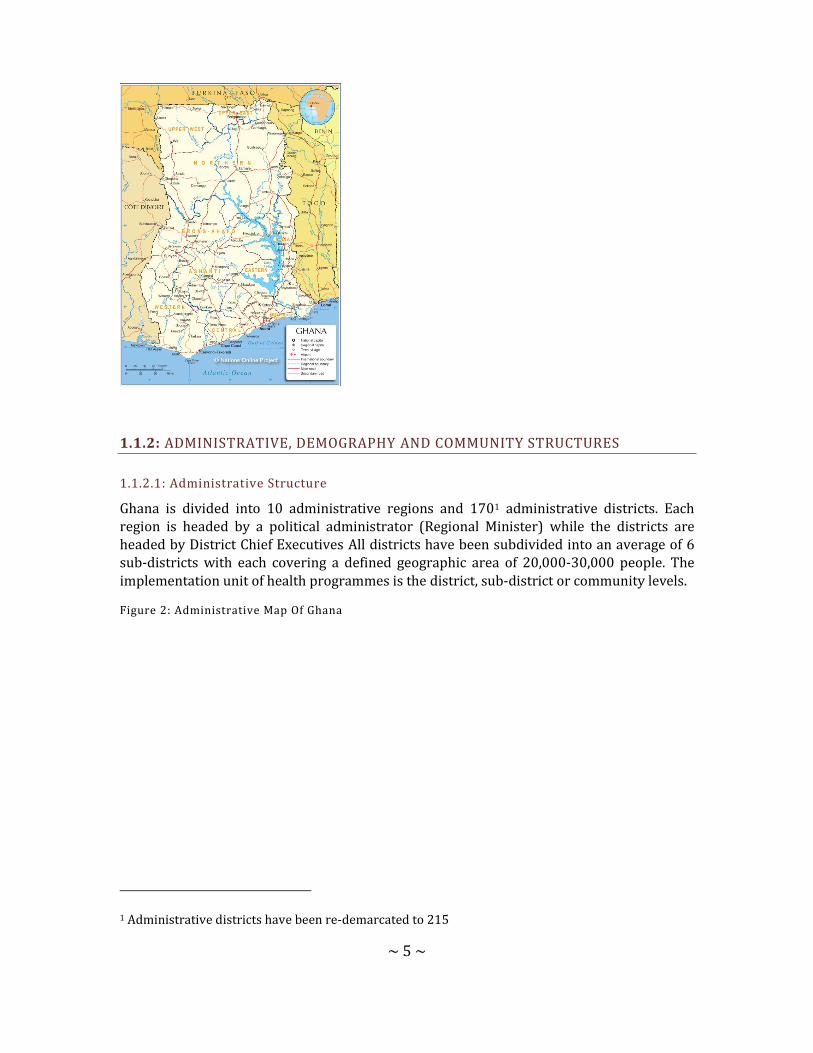
1.1.2: ADMINISTRATIVE, DEMOGRAPHY AND COMMUNITY STRUCTURES
1.1.2.1: Administrative Structure
Ghana is divided into 10 administrative regions and 1701 administrative districts. Each region is headed by a political administrator (Regional Minister) while the districts are headed by District Chief Executives All districts have been subdivided into an average of 6 sub-districts with each covering a defined geographic area of 20,000-30,000 people. The implementation unit of health programmes is the district, sub-district or community levels.
Figure 2: Administrative Map Of Ghana
1 Administrative districts have been re-demarcated to 215
~ 6 ~
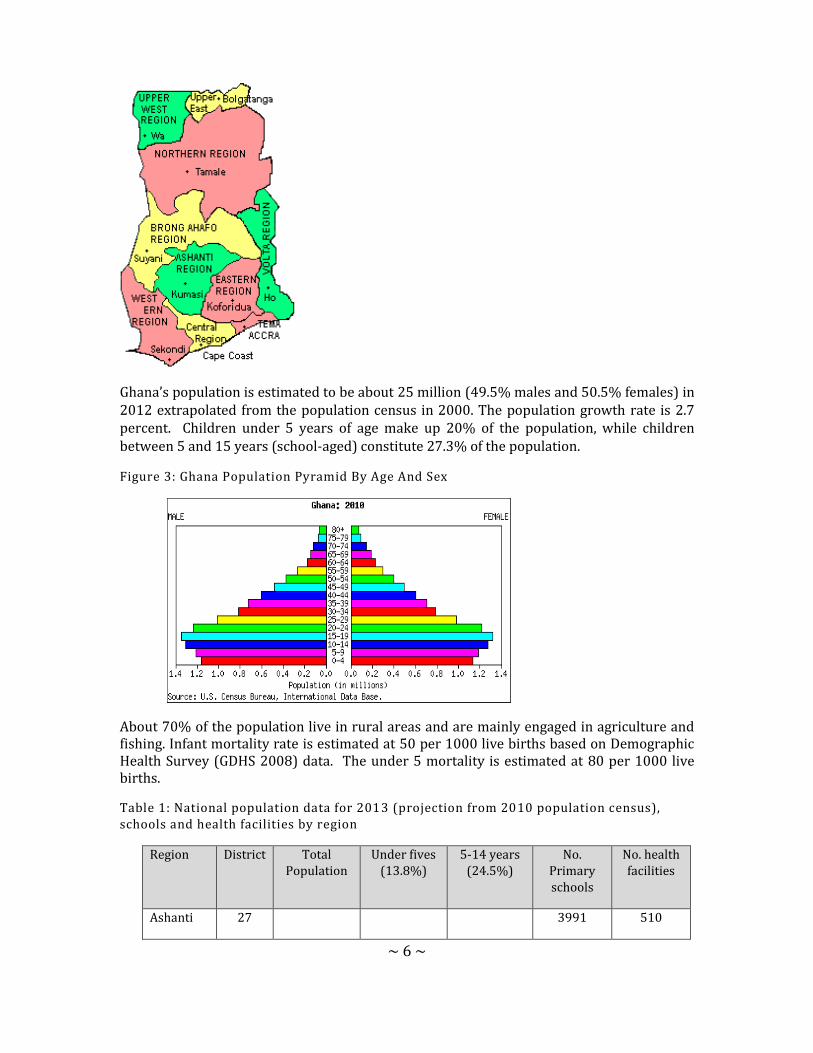
Ghana’s population is estimated to be about 25 million (49.5% males and 50.5% females) in 2012 extrapolated from the population census in 2000. The population growth rate is 2.7 percent. Children under 5 years of age make up 20% of the population, while children between 5 and 15 years (school-aged) constitute 27.3% of the population.
Figure 3: Ghana Population Pyramid By Age And Sex
About 70% of the population live in rural areas and are mainly engaged in agriculture and fishing. Infant mortality rate is estimated at 50 per 1000 live births based on Demographic Health Survey (GDHS 2008) data. The under 5 mortality is estimated at 80 per 1000 live births.
Table 1: National population data for 2013 (projection from 2010 population census), schools and health facilities by region
Region District Total Population
Under fives (13.8%)
5-14 years (24.5%)
No. Primary schools
No. health facilities
Ashanti 27 3991 510

~ 7 ~
5,178,140 714,583 1,268,644
Brong Ahafo
22
2,474,136
341,431
606,163 2369 270
Central 17
2,413,050
333,001
591,197 2030 223
Eastern 21
2,802,551
386,752
686,625 2839 523
Greater Accra
10
4,394,669
606,464
1,076,694 1765 320
Northern 20
2,701,490
372,806
661,865 2174 237
Upper East
9
1,084,675
149,685
265,745 766 178
Upper West
9
742,895
102,520
182,009 661 164
Volta 18
2,281,126
314,795
558,876 2122 356
Western 17
2,521,452
347,960
617,756 2384 329
Total 170
26,594,185
3,669,997
6,515,575 21101 3110
In Ghana communities are the smallest units of human settlements in any given area.
The focus of most control activities of the Neglected Tropical Diseases Control Programme
are the rural communities and urban slums where neglected tropical diseases most
prevalent. These rural communities are in remote and hard to reach areas, where
subsistence farming is the most common occupation. In these parts of the country, basic
amenities are non-existent. Some of these farmers have seasonal farmsteads.
Rural communities have chiefs who rule the inhabitants of the community with a team of
elders, a queen mother and other opinion leaders such as the assemblyman who represents
the community at the district assembly. There may be other women and men’s groups in
these communities with their own leaders who represent these groups as opinion leaders in

~ 8 ~
the communities. Religious groups with their leaders are also very important in rural and
sub-rural settings. Their leaders are influential and influence greatly community issues.
Other groups that may be found in these communities are occupational groups such as
those for farmers, fishermen, different artisans.
Subsistence farming is the main occupation of most rural communities. The crops farmed
are mainly cash crops in non-commercial quantities though many of them sell these at very
cheap prices in order to raise some money for other household expenses. Their farming
activities are rain dependent. The country has two main rainy seasons, the major one
occurring between April and August and the minor one between October and November.
Farming activities are therefore concentrated within these two major time periods.
Communities located along the coast and within some inland river basins also have fishing
as their main occupation. Though fishing occurs all year round, bumper fish harvest of fish
occurs during the major rainy season when the weather in most parts of the country is cold.
A few communities may have skilled workers or artisans who may beinvolved in carpentry,
masonry, sewing among others. However, white-collar jobs tend to be completely absent in
most rural communities. In others there is difficulty in finding an educated person to even
help in undertaking community based health activities that might require some basic skills
in reading and writing.
Most rural communities depend on town criers, public address systems and meetings to
facilitate communication and information sharing.
Rural communities in Ghana have existing community associations or groups which meet
regularly and are represented in higher community level meetings involving opinion
leaders. These social groupings include those for market women, men and women’s social
groups, ethnic groups where different ethnic groups are present, religious groups, and
where present groups of skilled workers. In these communities every adult may be a
member of at least one of these social or religious groups. The presence of these groups
makes it possible to reach members of these communities especially the larger communities
with health information and community based health activities.
Some of the NTD Control Programmes such as Onchocerciasis, Lymphatic Filariasis,
Trachoma, schistosomiasis and soil transmitted helminths., require oral preventive
chemotherapy at the community level. The method adopted for distribution takes
advantage of the community structures available, making sure that community
participation and leadership are key.
Some communities which will be involved in the implementation of these Neglected
Tropical Diseases Programmes have some experience with the implementation the disease
specific programmes such as Community Directed Treatment with Ivermectin (CDTI) in
Onchocerciasis which has been in existence since 1998.
Women either as groups or individuals have played a significant role in mobilizing
communities for community based health programmes such as distribution of medicines
~ 9 ~
and bed nets as well record keeping. Early case detection requires the participation of the
communities as in the case of Buruli Ulcer.
1.1.3: SOCIO-ECONOMIC SITUATION AND INDICATORS
Ghana is the second largest producer of Gold in Africa. It has other exports such
as cocoa, oil, timber, electricity, diamond, bauxite, and manganese also being major sources
of foreign exchange. Also, horticultural products, handicraft, processed food and
manufactured goods are produced. The non-traditional exports, are increasingly
contributing to the Gross National Index (GNI) as well as tourism. An oilfield which is
reported to contain up to 3 billion barrels (480,000,000 m3) of light oil was discovered in
2007. Oil exploration is still ongoing though drilling and export of the first oil was carried
out in 2011.
Ghana’s labor force in 2008 totaled 11.5 million people. The economy continues to rely
heavily on agriculture which accounts for 37.3% of GDP and provides employment for 56%
of the work force. Manufacturing is only a small part of the Ghanaian economy totaling 7.9%
of Gross Domestic Product in 2007.
Surface mining activities which leaves scores of pits that serve as breeding sites for
mosquitoes may predispose individuals to Lymphatic filariasis and Malaria. Dams and
irrigational canals support dry season farming, however, they predispose farmers to guinea
worm and schistosomiasis. The Human Development Index (HDI) rose by 0.8% annually
from 1980 to 2010. The data for 2010 is 0.467 which gives Ghana a rank of 130 over 169
countries compared. Table 1.1 below shows some socio-economic data; for example, the
GDP growth rate in 2009 was 2.1% while GDP stood at $26.2 billion during the same year
(World Bank).
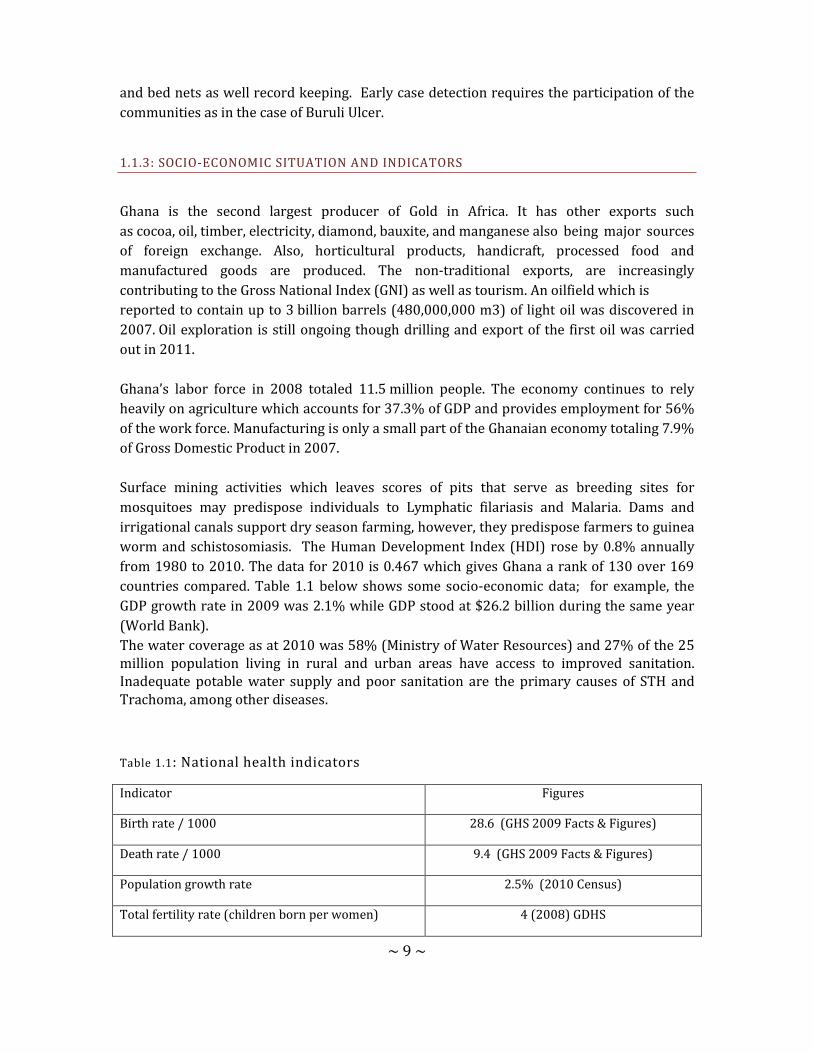
The water coverage as at 2010 was 58% (Ministry of Water Resources) and 27% of the 25 million population living in rural and urban areas have access to improved sanitation. Inadequate potable water supply and poor sanitation are the primary causes of STH and Trachoma, among other diseases.
Table 1.1: National health indicators
Indicator Figures
Birth rate / 1000 28.6 (GHS 2009 Facts & Figures)
Death rate / 1000 9.4 (GHS 2009 Facts & Figures)
Population growth rate 2.5% (2010 Census)
Total fertility rate (children born per women) 4 (2008) GDHS

~ 10 ~
Infant mortality rate/1000 live births 50 (2008) GDHS
Under five mortality rate/1000 80 (2008) GDHS
Maternal mortality ratio/100,000 live births 560 (GHS 2009 Facts & Figures)
Population: % < Age 15 38.3% (2010 pop census)
Population: % Age 15 – 64 57.1% (2010 pop census)
Population: ≥Age 65 years 4.6% (2010 pop census)
Life expectancy at birth male (years) 59 (GHS 2009 Facts & Figures)
Life expectancy at birth female (years) 60.7 (GHS 2009 Facts & Figures)
Stunted children 28% (2008) GDHS
GDP (current US$) (billions) 26.2 (2009)
GDP per capita (current US$) 1,098 (2009)
GDP growth (annual %) 4.7 (2009)
1.1.4: TRANSPORT AND COMMUNICATION
Transport in Ghana is accomplished by road, rail, air and water. Ghana's transportation and communications networks are centered in the southern regions, especially the areas in which gold, cocoa, and timber are produced. Road transportation in Ghana constitutes about 97% of passenger and freight traffic in Ghana. Trunk roads in Ghana are classified as National roads, Regional roads, and Inter-regional roads, all of which form the Ghana road network. All districts are connected to their regional capitals by a network of roads most of which are tarred. The regional capitals are also linked through major road networks to the national capital; some areas, however, remain relatively isolated. Foreign donor support

~ 11 ~
helped to increase the number of new vehicle registrations from 8,000 in 1984 to almost 20,000 in 1989. The distribution of vehicles was skewed in favour of urban areas however, a large percentage of intercity buses are available for commuters to different parts of the country. Transportation is especially difficult in the rural areas and in the vast, underdeveloped northern regions, where vehicles are scarce.
TABLE 2: Road Distances from Accra
Town Distance in km
Town Distance in km
Aburi 38 Kpandu 206
Ada 114 Kintampo 478
Aflo 193 Kumasi 272
Akosombo 101 Lawra 799
Bamboi 474 Navrongo 845
Bawku 828 Nkawkaw 163
Bibiani 265 Nsawam 35
Bole 592 Obuasi 324
Bolgatanga 815 Oda 143
Cape Coast 145 Salaga 643
Damongo 782 Sekondi 218
Elmina 158 Sunyani 403
Ejura 336 Swedru 85
Gambaga 811 Tamale 654
Half-Asini 403 Takoradi 229
Ho 166 Tarkwa 317
Hohoe 221 Techiman 398
Keta 214 Wa 721
Koforidua 85 Winneba 66
Konongo 217 Yeji 499
Until recently the telephone system in Ghana was run by Ghana Telecom. Today there are many mobile telephone companies namely; MTN, Expresso, Tigo, Airtel, Vodafone and Glo. In 2010 there were 15 million mobile telephone subscribers from 218,000 in 2000. There

~ 12 ~
are over 3 million fixed telephone lines and over 5,000 pay phones. Telephone services are available and accessible in almost all parts of the country.
Ghana Broadcasting Corporation has nationwide coverage. There are many private radio stations with over 60 stations in the country. Many district capitals also have radio stations.
TV stations and services are about 10 in number with only the state-owned Ghana TV having national coverage.
There are several registered newspapers, some dailies, others weeklies, bi-weeklies, monthly and quarterly newspapers, most of them privately owned. Some are state owned and most of the others being private owned.
The existing communication system in the country can be relied on to a large extent for programme implementation and disease surveillance. The communication system can help communication with the programmes partners externally and also internally within the regions, districts and sub-districts most of which now have both mobile and fixed line telephone systems in place as well as internet accessibility. The challenge may however be fluctuation in network coverage and accessibility at some rural communities.
Public transportation cannot always be relied on for public health duties in most African countries including Ghana. Partners have supported health programmes by providing project vehicles and also the Ghana Health Service has a pool of vehicles that is available for all health programmes. Competition for and pressure on these pool vehicles greatly reduces their availability to many programme which therefore resort to acquiring their own vehicles to improve efficiency and cost-effectiveness.
1.2: HEALTH SYSTEM SITUATION ANALYSIS
1.2.1: HEALTH SYSTEM GOALS & PRIORITIES
The Ghana National Vision for Health is “Create wealth through health and contribute to the national vision of attaining middle income status by 2015”. “The mission is to contribute to socio-economic development and wealth creation by promoting health and vitality, ensuring access to quality health, population and nutrition services for all people living in Ghana and promoting the development of a local health industry.”

~ 13 ~
The sector goal is to ensure a healthy and productive population that reproduces itself safely. The national top 10 diseases as indicated by the Centre for Health Information and Management [CHIM] 2009 are; Malaria, Diarrhoea, Upper Reparatory Tract Infection, Skin diseases and ulcers, Hypertension, Pneumonia, Anaemia, Intestinal worms, Rheumatism and Ear infections The Ghana Health Service ranks NTDs (Buruli Ulcer, Guinea worm, Leishmaniasis, Lymphatic Filariasis, Leprosy and Schistosomiasis) prevention control and management third in the medium term policies of the health sector.
1.2.1.1: THE PROCESS OF PRIORITY SETTING
The National Health Policy (2006) focuses on behavioral and lifestyle changes. The foreground to the new focus is premised on the fact that most of the burden of diseases are preventable and avoidable and can be curtailed by changing our lifestyles in terms of nutrition, physical activities and observing good hygiene practices. These among others have culminated in the introduction of regenerative health and nutrition interventions. The Ghana Health Service as the forerunner in providing health services to all in the country will be a stronghold in this direction by emphasizing on addressing risk factors through impact–oriented health promotion, healthy lifestyle, and behavioral change activities. To attain the key indicators of the MDGs, the service throws enormous weight behind the High Impact Rapid Delivery (HIRD) programme and further strengthen the capacity of the service to deliver efficient and effective services under the NHIS, work with donors and local assemblies in establishing more functional CHPS zones and also address the seemingly insurmountable problem of erratic resources flow and inequitable distribution of health service resources.
The Ghana Health Service five-year Strategic Framework 2007-11 was formulated based on extensive consultation and collaboration with allied agencies and stakeholders involved in health care delivery in the country. The service is therefore strategically positioned to deliver its mandate and to work towards improving the health of all residents in Ghana and aims to contribute towards government socio-economic development agenda of moving the country into middle income status by the 2015. While largely drawing from the National Health Sector Policy and the third 5yr Programme of Work (PoW) 2007-11, its framework is also developed in line with the objectives of Ghana Poverty Reduction Strategy (GPRS 2), Millennium Development Goals (MDGs) and the New Partnership for African Development (NEPAD) health strategy.
1.2.2: ANALYSIS OF OVERALL HEALTH SYSTEM
The Ghana Health Service (GHS) is the implementing agency of the Ministry of Health (MOH) responsible for health service delivery in the country. Health management in Ghana is decentralized. The Service comprises the Primary level at the district, the secondary level at the region and the tertiary referral level. District Health Management Team (DHMT) led by a District director of health services and reporting to the District Chief Executive (DCE) is

~ 14 ~
responsible for district health service; the Regional Health Management Team (RHMT) led by a Regional Director of Health Services and reporting to the Regional Minister is responsible for the entire regional health service, and the National Headquarters and tertiary level where the Director General of GHS and Chief Executives of Tertiary Hospitals, reporting to the Minister of Health are responsible for the whole country. Complementing this arrangement are institutional/ health facility management teams. Each of these management levels is a budget and management centre (BMC) responsible for each team with definite operational budget.
Primary level (Primary Health Care-PHC) is delivered by the District Health System. It comprises all institutions (clinics, health centres and hospitals), whether private, public or traditional. The health centre is responsible for providing clinical, public health and maternity services to the catchment population. It uses a combination of facility-based services, regular outreaches and mass campaigns in close collaboration with communities, community institutions, leaders and Community based health workers. The district hospital serves as the first referral point in the primary health care system. They provide clinical (out-patient and in-patient), surgical, laboratory and maternity services.
At the secondary level, the regional hospital is the secondary referral point and offers specialized services. The teaching hospitals form the apex of specialized care in the country. The NTDs health intervention programmes have been integrated into the PHC in Ghana.
Figure 4: Levels of Service Delivery
1.2.2.1: Service Delivery
Even though indicators on specific programmes, such as EPI, TB control, malaria, HIV/AIDS and nutrition, show positive trends, the coverage of priority health interventions remains inadequate, leading to slow improvements in health outcomes. Weaknesses of the health system (staffing, funding, capacity etc) further impede the scaling up of proven cost-effective interventions. Most health centers do not provide a full complement of services and the rollout of CHPS which is a proven effective strategy to take health to the doorstep of the community has been extremely slow. In addition, not enough attention has been given to reducing risk factors and complications.

~ 15 ~
With the introduction of the NHIH (National Health Insurance Scheme), access to care has improved considerably, however, the health system is confronted with a lot of challenges such as inadequate infrastructure and equipment, data management, ICT, health care financing and quality of care.
However, it is worthy of note that some health indicators have improved over the last three years as indicated below.
Table 2.1: Reduction In Infant Mortality In Ghana (GDHS)
Indicator / years 1988 1998 2008
Infant mortality / 1000 lives 77 57 50
1.2.2.2: Health Workforce
Production of the human resource has not been matched with need; the number of health workers is inadequate. The Doctor Patient ratio is 1: 13,074 and the Nurse Patient ratio is 1:1109 in 2008.
The human resource planning process does not take into account the standard institutional requirements. This is compounded by GHS inability to define and attract resources to meet the standards and norms for each level of operation.
Chronic staffing imbalance due to attrition and inequitable distribution continue to plague the GHS despite various efforts and initiatives to retain and deploy staff to the rural areas. The situation is further compounded by an ageing workforce negatively affecting the uptake of services. The introduction of NHIS has brought with it challenges leading to increased workload and overreliance on casual staff. There also appears to be lack of coordination between population needs and the management of the human resources available.
The current workforce number and distribution will need to be addressed in order to adequately control the NTDs. Moreover, the existing workforce will require additional capacity development to efficiently and effectively contribute to the control of the NTDs.
There is health investment plan and policy on human resources that guides the recruitment and deployment of health staff.
The GHS has a mix of skilled health workers and professionals. As at July 2007 GHS had employed 30,000 staff accounting for 71% of the total health sector workforce in the country. The cadre of health workers found in the districts and the peripheral health facilities include; doctors, midwives, nurses, pharmacists, dispensary technicians, biomedical scientists, x-ray, technicians, community health nurses, disease control officers, community health officers and health extension officers . Some areas are however affected by inadequate health workers and inequity in distribution.

~ 16 ~
There are also community based volunteers for health. This includes community-based surveillance volunteers, community directed drug distributors. There are also traditional birth attendants who offer service at the community level.
1.2.2.3: Health Information Management
The Centre for Health Information Management is a department under the PPME division and is in charge of health information in the GHS. It receives data routinely from all health facilities (Government, Private, mission, quasi- government).The IDSR 1 has been revised and awaiting endorsement. The IDSR is a strategy to record and report on major diseases in the country. IDSR now captures data on NTDs from the community through the sub-district to the district to the regional level and finally to the national level.
There is a huge challenge with reporting systems within the service. Hence data is often not used in defining district priorities, planning and resource allocation. This creates a gap between data collection and the decision-making process. Inadequate information also hinders effective planning, monitoring and evaluation of health services, and poor data quality leads to inadequate utilization of information for policy decision-making. In spite of numerous efforts to improve communication and coordination within GHS, ICT has been slow to develop, especially at the regional and district levels. Existing technologies for communication are under utilized by GHS managers, and new initiatives to expand ICT throughout the Service are disjointed and poorly-coordinated. In addition, the introduction of new software for data collection by some programmes is creating parallel systems of data collection within the GHS and overburdening staff at the district level.
The recently introduced District Health Management Information System (DHIMS) provides the GHS a chance to standardize, collect and collate essential data at the district level. Community Health Planning Services (CHPS) as a promising strategy which has shown remarkable success in reducing maternal mortality rates, improving family planning acceptor rates, immunization and mass drug administration coverage in poor and underserved areas. If the CHPS concept is fully embraced nationwide as a strategy to bring health care closer to the communities it can serve as the vehicle for implementing most integrated public health interventions that include preventive chemotherapy and case search for the neglected tropical diseases.
1.2.2.4: Medical Products
The GHS procurement division, under the national procurement Act 265 of the 2001 will ensure due process in the procurement of medical products
There is a central medical store where all procured medical items are stored and later distributed to the regional medical stores. A few districts have storage facilities. Coordination, transportation logistics, timely distributions of commodities are some of the challenges anticipated.
~ 17 ~
1.2.2.5: Pharmaco-Vigilance
The Pharmacy department of the Institutional Care Division (ICD), GHS is responsible for the execution of Pharmacovigilance activities. The department collaborates with the Food and Drugs Board (FDB) in the discharge of pharmacovigilance activities. For any SADR the patient quickly reports based on the training offered to the community. Patient is seen by a health worker/ clinician who documents the reaction in the pharmaco-vigilance form and sends report through the DHMT to the Pharmaco-vigilance centre for further investigation.
The NTD drugs in use in the country also undergo similar process.
1.2.2.6: Health Financing
The Government allocation to the health sector is still below the Abuja recommendation of 15%. In 2009, the health sector allocation in Ghana was 12.76%. The bulk of the government allocation is spent on health workers’ salaries, infrastructure and biomedical. Other sources of funding for the health sector are Development Partners, International NGOs, and a few private sector organizations.
The GHS continues to suffer from inadequate budgetary provision and irregular flow of funds hampering planning and implementation of programmes. Decentralization of financial and personnel responsibility have lagged far behind managerial responsibility. Systems of financial management and audit are weak and other government regulations are often not complied with. The inability of districts to capture all available resources during their annual planning process, mainly attributed to continued existence of vertical funding of programs and initiatives is leading to duplications and inefficiencies.
Although annual budget plans on NTDs are prepared and submitted it is not always funded. Sometimes when it is funded the funds are not released on time or at all. Persistent inequities in resource allocation, lack of rational criteria for allocating budgets and inefficiencies in resource management continue to remain within the service. There is no consensus on resource allocation criteria at all levels leading to lack of transparency in disbursement of funds.
The NHIS coverage stood at 39% for women and men 30% (DHS-2008) making health care financing for the individual and household mostly out of pocket.
1.2.2.7: Leadership and Governance
The Minister of Health is the political head of the ministry with a Deputy. The Chief Director is the Administrative head and has various directors heading the divisions. The ministry of health is responsible for policy formulation, coordination, monitoring and resource mobilization.
The Director General is the Head of the Ghana Health Service which is the implementation arm of the ministry of health.
~ 18 ~
Since the establishment of the GHS in 1995 as a health reform strategy, a number of weaknesses have emerged. Existing institutional arrangements do not promote efficiency and are further exacerbated by overlap of functions between the MOH and GHS. The inherent weaknesses in GHS organization and management structures to support GHS to deliver on its mandate persist with continued weakening of the health system. Furthermore the absence of a Legislative Instrument for Act 525 establishing GHS after 10 years of creation is also negatively affecting the operations of GHS.
Currently there is no NTD policy or institutional framework for NTD control, however NTDs are included in the medium term policies and priorities of the health sector strategic plan.
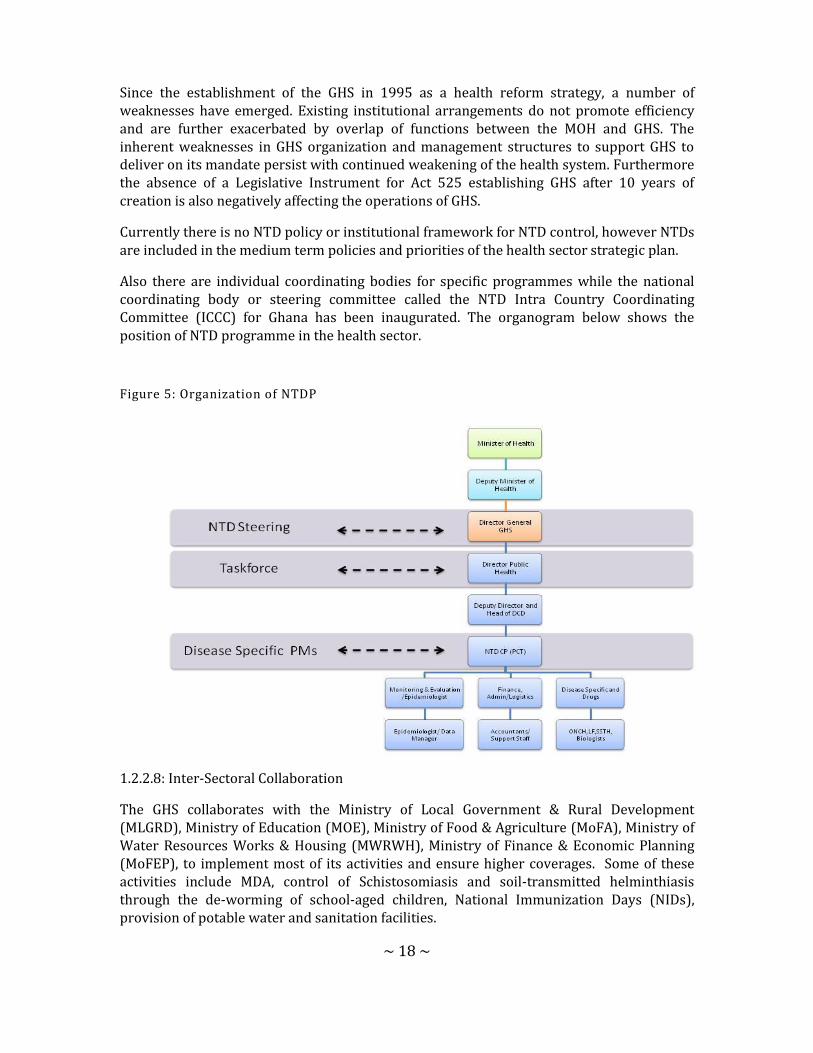
Also there are individual coordinating bodies for specific programmes while the national coordinating body or steering committee called the NTD Intra Country Coordinating Committee (ICCC) for Ghana has been inaugurated. The organogram below shows the position of NTD programme in the health sector.
Figure 5: Organization of NTDP
1.2.2.8: Inter-Sectoral Collaboration
The GHS collaborates with the Ministry of Local Government & Rural Development (MLGRD), Ministry of Education (MOE), Ministry of Food & Agriculture (MoFA), Ministry of Water Resources Works & Housing (MWRWH), Ministry of Finance & Economic Planning (MoFEP), to implement most of its activities and ensure higher coverages. Some of these activities include MDA, control of Schistosomiasis and soil-transmitted helminthiasis through the de-worming of school-aged children, National Immunization Days (NIDs), provision of potable water and sanitation facilities.
~ 19 ~
However, the public and private sector continue to operate separately with little linkages between them. The result is that services are implemented vertically without maximizing the strength of each other. Non-Governmental Organization (NGOs) and Civil Society Organization (CSOs) play a little role in planning and evaluating health services. Even though the importance of other sectors is acknowledged and recognized opportunities for collaboration and working together are weak.
1.3: NEGLECTED TROPICAL DISEASES SITUATION ANALYSIS
1.3.1 EPIDEMIOLOGY AND BURDEN OF DISEASE
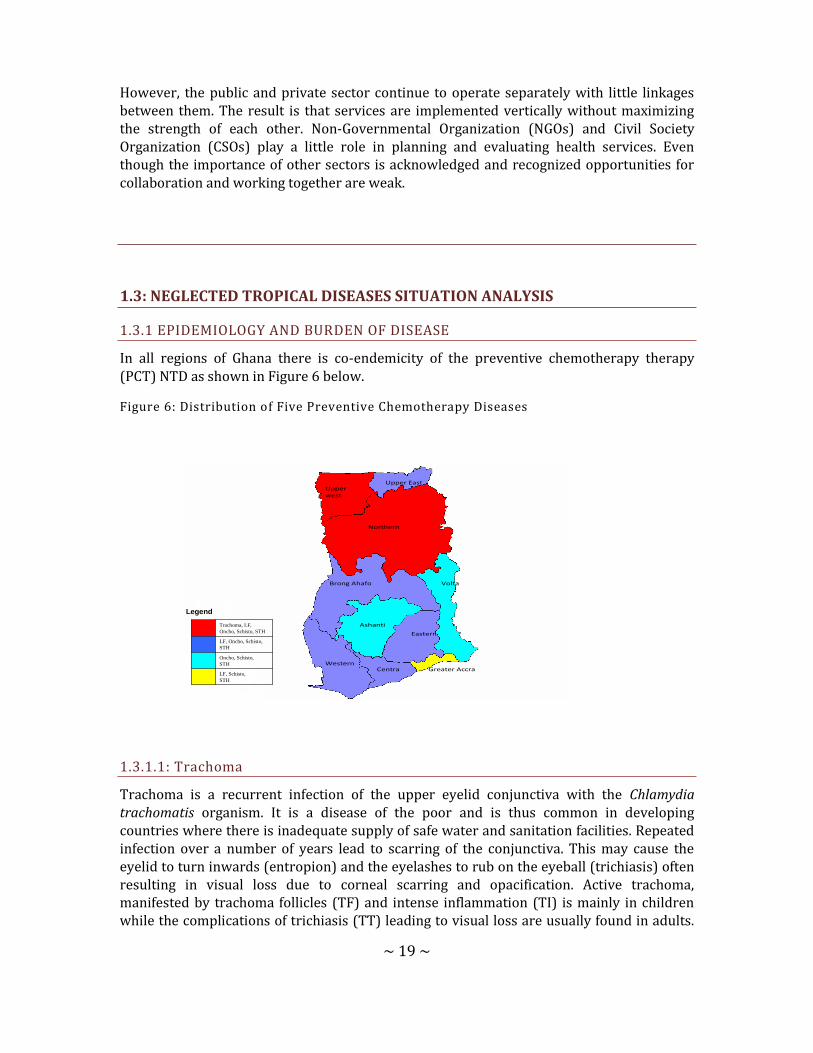
In all regions of Ghana there is co-endemicity of the preventive chemotherapy therapy (PCT) NTD as shown in Figure 6 below.
Figure 6: Distribution of Five Preventive Chemotherapy Diseases
LF, Schisto,
STH
Oncho, Schisto,
STH
LF, Oncho, Schisto,
STH
Trachoma, LF,
Oncho, Schisto, STH
Legend
Upper west
Upper East
Northern
Brong Ahafo
Ashanti
Eastern
WesternCentra
Volta
Greater Accra
1.3.1.1: Trachoma
Trachoma is a recurrent infection of the upper eyelid conjunctiva with the Chlamydia trachomatis organism. It is a disease of the poor and is thus common in developing countries where there is inadequate supply of safe water and sanitation facilities. Repeated infection over a number of years lead to scarring of the conjunctiva. This may cause the eyelid to turn inwards (entropion) and the eyelashes to rub on the eyeball (trichiasis) often resulting in visual loss due to corneal scarring and opacification. Active trachoma, manifested by trachoma follicles (TF) and intense inflammation (TI) is mainly in children while the complications of trichiasis (TT) leading to visual loss are usually found in adults.
~ 20 ~
While active disease affects boys and girls equally, TT is more common among older women than in men of comparable age. Environmental factors such as shortage of potable water, poor personal and environmental hygiene practices are the main risk factors that increase the incidence of the disease. Trachoma typically affects poor and remote communities living in dry, dirty and dusty conditions. Eye discharges that contain the Chlamydia organism causes recurrent transmission through agents like flies, fingers and fomites among family members2
Worldwide it is estimated that about 84 million people are affected by Trachoma with 7.6 million having trichiasis, the potentially blinding stage of the disease. Trachoma is the leading cause of avoidable or preventable blindness, and is estimated to be responsible for at least 3.6% of all blindness worldwide.
Two of the ten regions (Upper West and Northern) in Ghana were suspected to have Trachoma at levels of public health significance. The baseline prevalence surveys conducted in these two regions showed that 9 districts had prevalence rates of 10 percent or more, and 17 districts had prevalence rates less than 10 percent. About 2.6 million people are at risk of trachoma. Prevalence rates of trichiasis were between the ranges of 0.4-8.4%. At the inception of the program, the trichiasis backlog was about 13,234 people and needed lid surgery to prevent blindness. Close to 70 percent of them are women. A prevalence survey conducted in the Upper East region of Ghana showed TF ranging from 0-0.09% and TT ranging from 0.20-0.54% within the districts. This means that, the level of active trachoma is not of public health significance. However, there are some few cases of trichiasis in the Upper East region that would require surgery.
Ghana started the 3 year surveillance towards WHO certification in 2012. In 2015 the Trachoma programme will conduct an epidemiological prevalence survey in all the districts in the Northern and Upper West regions as part of the WHO certification process of declaring Ghana free of blinding trachoma.
1.3.1.2: Lymphatic Filariasis
Lymphatic Filariasis, known as Elephantiasis is caused by a thread-like, parasitic filarial worm Wuchereria bancrofti in Ghana. These worms lodge in the lymphatic system, the network of nodes and vessels that maintain the delicate fluid balance between the tissues and blood and are an essential component for the body's immune defence system. They live for 4-6 years, producing millions of immature microfilariae (minute larvae) that circulate in the blood
In its most obvious manifestations, lymphatic filariasis causes enlargement of the entire leg or arm, the genitals, vulva and breasts. In endemic communities, up to 35% of men have hydrocoeles and up to 4% of the adult population can be affected with lymphoedema. The psychological and social stigma associated with these aspects of the disease is immense. In addition, even more common than the overt abnormalities is hidden, internal damage to the kidneys and lymphatic system caused by the filariae.
~ 21 ~
Lymphatic Filariasis was prevalent in 74 out of the 170 districts in 8 regions of Ghana. Currently four districts have met the criteria for stopping MDA and are no longer treating. The antigen prevalence was estimated to be between 20% to 40% in the north and 10% to 20% in the south. The prevalence of elephantiasis is between 0 – 4% with more females being affected than males. So far the programme has registered about 5,000 cases of elephantiasis and 10,000 cases of hydrocoele in the country as at 2005. These figures are updated annually as the programme pursues its up-scaling plan. The incidence of the acute attacks is about 95.9 per thousand patients with lymphoedema per annum. About 90% of these attacks occur in people with existing lymphoedema with 3 days of total incapacitation with its economic consequences. Occurrence of this condition is highest in the rainy season when most people are most productive on their farms.
1.3.1.3: Onchocerciasis
Onchocerciasis is also caused by the filarial parasite Onchocerca volvolus which invades the subcutaneous tissues of the body. The most common symptoms are itching, atrophy of the skin, lizard skin or hypertrophic skin changes or areas of hypopigmentation known as leopard skin. Microfilaria invasion of the eyes lead to various eye lesions with the associated visual impairment. The end stage of Onchocercal eye lesions is blindness which can occur as early as the age of 20 years.
In Ghana Onchocerciasis has an estimated at-risk population of over 2 million in 3115 communities in 40 endemic districts from nine out of the ten regions. Greater Accra Region is the only region that is not endemic for Onchocerciasis. Recent nationwide re-mapping of Onchocerciasis in 2009 confirmed this information. Inspite of this remapping, the programme still treats all communities historically endemic fors. Recent (2010) epidemiological surveillance activities showed crude prevalence for Onchocerciasis to be between 0.0% to 11.1% with 2 of the 20 sites surveyed having prevalence above the threshold of 5%. Entomological surveillance results showed that black fly infectivity rates in 9 out of 10 sites were below the threshold of 0.5%. One site that had a rate of 6.9%.
1.3.1.4: Schistosomiasis
Urinary Schistosomiasis caused by a blood fluke Schistosoma haematobium, is very widespread in the country. The main symptoms include dysuria, frequency and terminal haematuria. Chronic infections may lead to cancer of the bladder in both males and females. Intestinal Schistosomiasis caused by Schistosoma mansoni is also prevalent in the country. Its symptoms include abdominal pains, bloody diarrhoea and enlargement of the liver and spleen. Chronic infections may cause thickening of the liver, portal hypertension and eventually death.
Available data which dates back to the 1970s indicated that Urinary Schistosomiasis was widespread country-wide. The same data showed that Intestinal Schistosomiasis was restricted and patchy in its distribution. The Volta basin recorded prevalences as high as 80-90% in many communities living along the lake. Similarly, the Volta estuary was endemic

~ 22 ~
with infection rates of 76.2% for S. mansoni and 6.3% for S. haematobium. Generally Schistosomiasis was found to be highly endemic within communities located along rivers in all ten regions of Ghana.
Schistosomiasis was subsequently mapped nation-wide in 2007.. With the finalization of this mapping in 2010, a total of 6,618,064 school-aged children in all 170 districts were identified as being at risk. The NTDP started treatment of school-aged children nation-wide in 2008.
1.3.1.5: Soil-Transmitted Helminths
The major Soil-transmitted Helminths in Ghana are Ascaris lumbricoides, Trichuris trichuria, Necator americanus/Ancylostoma duodenale and Strongyloides stercoralis. Soil transmitted Helminths causes malnutrition, anaemia, growth retardation, cognitive impairment as well as lowering of resistance to infections. Hookworm causes blood loss into the gut and this results in Iron deficiency anaemia and growth retardation. Ascaris lumbricoides can cause intestinal obstruction in children and other complications when adult worms migrate from the small intestine to other parts of the body.
The endemicity of Soil Transmitted Helminthiasis (STH) determined during the mapping exercise showed low prevalence of STH in most of the districts in Ghana. Seventeen 17 districts with an at-risk school-aged population of 357,203 have prevalence of between 0.2 – 0.3 and would require annual treatment with albendazole or mebendazole. However, due to the high rate of recurrence of STH it is also recommended that every school aged child receives at least one dose of albendazole or mebendazole treatment annually.
1.3.1.6: Yaws
Yaws is a treponemal infections associated with acute and chronic morbidity characterized by deformities due to scarring and destruction of bone and cartilage of the face, hands and long bones. Poor personal hygiene, overcrowding, poor water and sanitation in some rural communities is responsible for high prevalence of yaws. Despite global and repeated national efforts at elimination, the prevalence of yaws is estimated at 0.7% of the population of Ghana (National Yaws Elimination Program Annual Report, 2008). All districts in Ghana apart from 9 in Greater Accra report yaws cases but the most affected are rural and deprived communities in Eastern, Volta, Central, Ashanti, Brong Ahafo and Western Regions due to the high humid climate of these forest areas. Pilot studies in Eastern Region in 2008 recorded prevalence between 10 and 20% in some schools (NYEP Annual Report 2008). From annual routine reports children under 15 years constitute about 75% of cases with a small but consistent preponderance of males. Cases are reported all year round.
Figure 7: Yaws Distribution Based On Cases Notified 2005 - 2008

~ 23 ~
Zero(non endemic) <0.1% 0.1-0.3% 0.4-0.7% 0.8-1%
1.3.1.6.1: The Ghana Policy on Yaws
Ghana restated her policy to eliminate yaws in a strategic plan policy document prepared by the National Yaws Elimination Program in 2008. This is consistent with WHO/UNICEF policy of elimination and eventual eradication in 1950 and renewed in 1978 and 2007 in Geneva. The Ghana program strategies to eliminate yaws are as follows.
1. Active and passive surveillance and treatment of cases and contacts 2. Promotion of personal and environmental hygiene practices 3. Advocacy for improved water supply 4. Cross border collaboration with other endemic West African neighbours
1.3.1.7: Human African Trypanosomiasis (HAT)
Human African Trypanosomiasis is caused by Trypanosoma gambiense and Trypanosoma
rhodesiense. It is transmitted by the tsetsefly. The most common symptoms are headache,

~ 24 ~
fever, stiffness of the body and neurologic changes including psychiatric disorders, seizures,
coma and death.
In Ghana HAT has an estimated at risk population of 4,500,000 in five out of the ten regions. Since 1980, over 103 cases have been registered in health institutional records. The last case was detected in year 2000 in Western Region. Screening exercises were carried out in 2005, 2008 and 2011.
The 2011 cross-sectional active screening survey for HAT carried out in 4 districts bordering Cote d’Ivoire in the Brong Ahafo district indicated that there was no active infection in survey participants. Given the results of these screening activities, a surveillance system will be instituted to monitor emergence of new cases.
Figure 8: Distribution of Places Where HAT Has Ever Been Reported, 1980-2010 (Shaded Red)
1.3.1.8: Rabies
Rabies is spread by infected saliva of warm blooded animals that enters the body through a bite or broken skin. The virus travels from the wound to the brain, where it causes swelling, or inflammation. This inflammation leads to symptoms of the disease. The actual time between infection and when you get sick ranges from 10 days - 7 years. The average incubation period is 3 - 7 weeks. Symptoms may include anxiety, stress, hydrophobia and death. Rabies has been present within the dog population of Ghana for decades. Control methods have included dog vaccinated and stray dog removal. There are however few published reports on rabies.
~ 25 ~
Between 1970 and 1974 an average of 72 cases of canine rabies were reported annually in Ghana. Between 2000 and 2004, public health officials reported 123 clinically confirmed human cases. Unfortunately human rabies cases are rarely confirmed using laboratory diagnosis but rather on clinical diagnosis when the patient is in the advanced stage. Rabies prevention and control activities are under the Veterinary Services Department of the Ministry of Food and Agriculture. It involves vaccination of dogs which has been in recent years been erratic. There is limited post exposure prophylaxis.
1.3.1.9: Leishmaniasis
Cutaneous leishmaniasis, the most common form of the disease, causes skin ulcers. Visceral leishmaniasis causes a severe systemic disease that is usually fatal without treatment. Muco-cutaneous leishmaniasis is a rare but severe form affecting the nasal and oral mucosa.
Leishmaniasis is transmitted by the bite of small insects called sand flies. Many leishmanial species infect animals as well as humans. The disease has been identified in the Volta Region where between 2002 to 2004, 8980 cases were registered through case searchi.
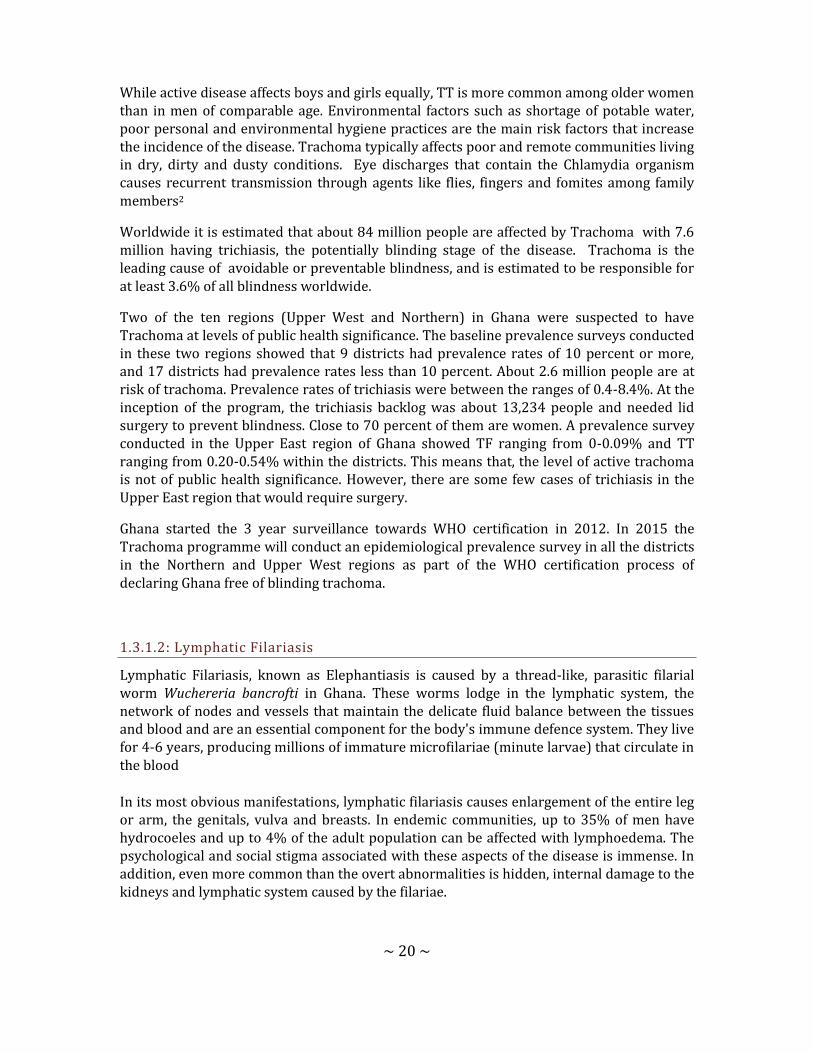
1.3.1.10: Buruli Ulcer
Buruli ulcer, a neglected tropical disease mainly affects children from poor rural communities. In Ghana, an average of 1,000 cases is reported annually. Since 1994 over 15,000 cases have been reported. However, official data underestimate the reality of the human affliction of this disease due to the following: a) most data obtained are exclusively based on passive detection, b) numerous cases are not diagnosed, grossly under-reported c) some cases are misdiagnosed as other conditions
In Ghana, six regions routinely report on the disease, though in 1999, a national survey indicated the presence of the disease in all the regions of the country. The number of known reporting endemic districts has increased. Over 46 out of the 170 districts in the country report on the disease. Surveillance systems are insufficient and inadequate. There is a lack of human resources trained for clinical, diagnostic Prevention of Disability, treatment, and control measures and low/lack of interest.
~ 26 ~
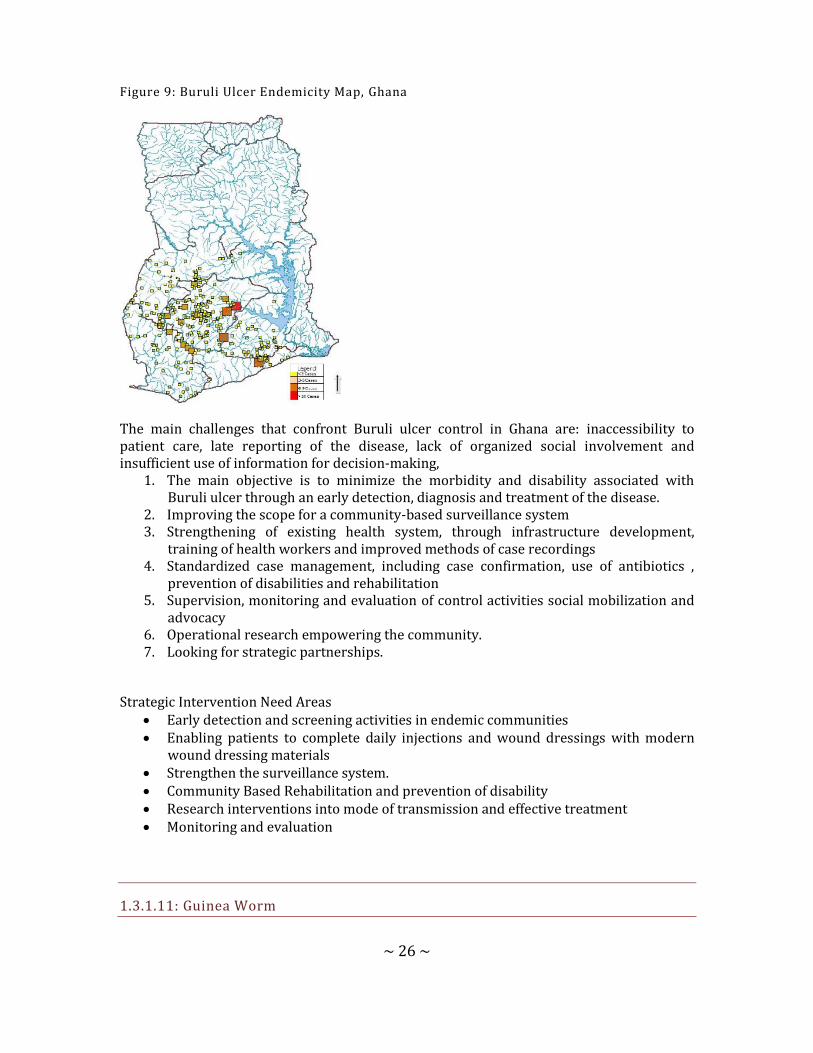
Figure 9: Buruli Ulcer Endemicity Map, Ghana
The main challenges that confront Buruli ulcer control in Ghana are: inaccessibility to patient care, late reporting of the disease, lack of organized social involvement and insufficient use of information for decision-making,
1. The main objective is to minimize the morbidity and disability associated with Buruli ulcer through an early detection, diagnosis and treatment of the disease.
2. Improving the scope for a community-based surveillance system 3. Strengthening of existing health system, through infrastructure development,
training of health workers and improved methods of case recordings 4. Standardized case management, including case confirmation, use of antibiotics ,
prevention of disabilities and rehabilitation 5. Supervision, monitoring and evaluation of control activities social mobilization and
advocacy 6. Operational research empowering the community. 7. Looking for strategic partnerships.
Strategic Intervention Need Areas Early detection and screening activities in endemic communities Enabling patients to complete daily injections and wound dressings with modern
wound dressing materials Strengthen the surveillance system. Community Based Rehabilitation and prevention of disability Research interventions into mode of transmission and effective treatment Monitoring and evaluation
1.3.1.11: Guinea Worm
~ 27 ~
Dracunculiasis or guinea worm disease is a painful and disabling disease caused by a nematode called Dracunculus medinensis. The disease is characterized by the emergence of the female D. medinensis from a blister, usually on the leg, of the infected person.
The Ghana Guinea Worm Eradication Programme was established in 1989 in response to the World Health Assembly’s resolution of 1988 which called guinea worm endemic countries to eradicate it. In that year (1989), a case search which was conducted to ascertain the disease burden counted 179,556 cases. A total of 6,515 localities or communities reported guinea worm disease when the programme started in 1989.
There were sharp reductions in cases for the first four to five years which tapered off starting in 1994, when there were 8,432 cases. Between 1994 and 2004, the programme experienced stagnations and even periodic increases in cases. This stagnation was caused mainly by factors such as the Northern regional ethnic conflict of early 1994, inadequate financial support ( USAID financial support officially ended in 1995) and the lack of focus (financially and technical support) resulting from the Health Reforms embarked upon during the late 90s.
Between the year 2000 and 2004, the programme underwent a series of strategic re-organisation and micro planning including the formation of an inter-agency coordinating committee. These, together with renewed commitment by the government and the partners resulted in progressive reduction in cases from 2005 to 2010. Ghana has now gone through 35 months of zero cases since the 11th of May 2010 when the last case was reported.
While progress has been made Ghana has not yet met the surveillance standards for certification of guinea worm eradication. This strategic plan looks at the remaining challenges and the strategies and resources needed to address them. It describes how the country can adequately prepare for certification.
1.3.1.12: Leprosy
Leprosy is a chronic mildly infectious disease of man caused by Mycobacterium leprae affecting mainly the skin and peripheral nerves. It is associated with nerve damage, contractures of digits of the limbs as well as ocular complications.The National Leprosy Elimination Programme is fully integrated into the general health system. The WHO elimination target of less than one case for 10,000 populations was achieved over a decade ago at the national level and efforts have been put in to sustain that achievement. All 10 regions are non-endemic hence the attention is aimed at achieving elimination at the district level.
In 2011, five hundred and forty-seven (547) new cases were detected, giving a case detection rate of 2.3/100,000 population. The Volta Region recorded the highest number of new cases (76) and Greater Accra recorded the least number (27) of new cases. There were twenty eight (28) child cases among the 547 cases detected in the year giving a percentage of 5.1%. This was an increase in the number of child cases compared to the previous year, indicating active and recent transmission.
The main strategies employed by the programme include early case detection, disability prevention, increase public awareness and increasing the capacity in the management of
~ 28 ~
leprosy. identified cases are provided timely treatment and followed up to ensure full compliance by patientsSee Annex One for Table 4 which shows NTD CO-endemicity by district.
1.3.2: NTD PROGRAMME IMPLEMENTATION
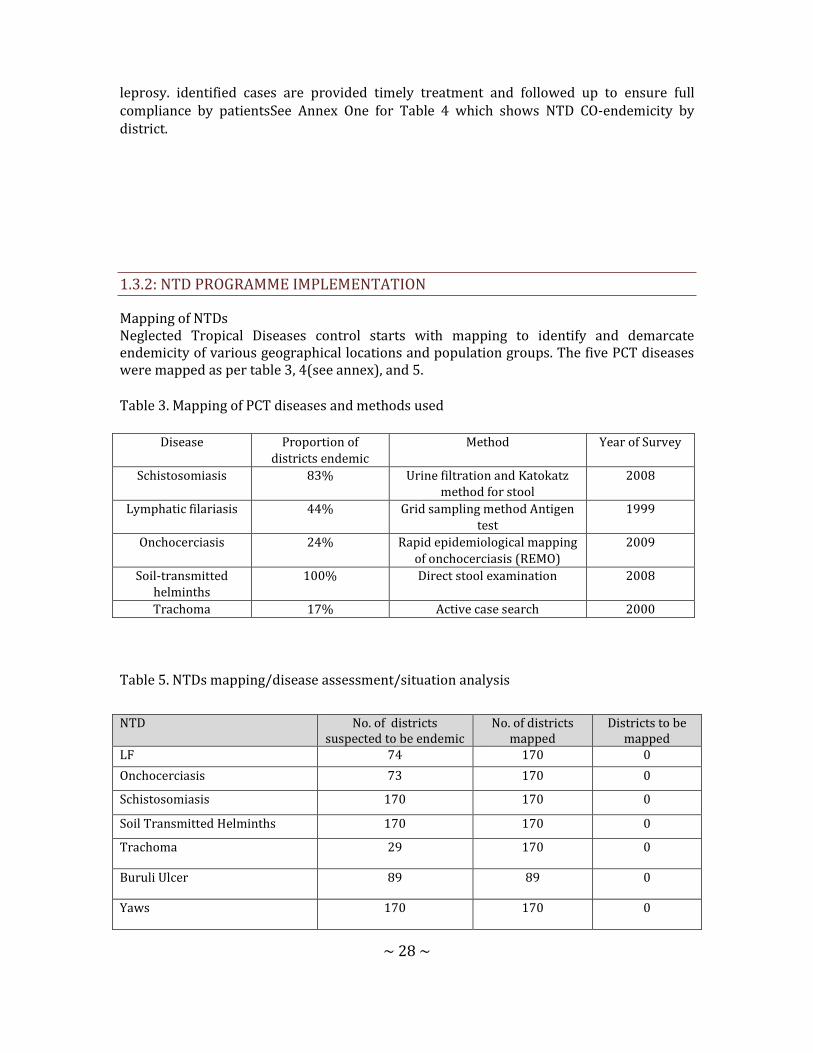
Mapping of NTDs Neglected Tropical Diseases control starts with mapping to identify and demarcate endemicity of various geographical locations and population groups. The five PCT diseases were mapped as per table 3, 4(see annex), and 5.
Table 3. Mapping of PCT diseases and methods used
Disease Proportion of districts endemic
Method Year of Survey
Schistosomiasis 83% Urine filtration and Katokatz method for stool
2008
Lymphatic filariasis 44% Grid sampling method Antigen test
1999
Onchocerciasis 24% Rapid epidemiological mapping of onchocerciasis (REMO)
2009
Soil-transmitted helminths
100% Direct stool examination 2008
Trachoma 17% Active case search 2000
Table 5. NTDs mapping/disease assessment/situation analysis
NTD No. of districts suspected to be endemic
No. of districts mapped
Districts to be mapped
LF 74 170 0
Onchocerciasis 73 170 0
Schistosomiasis 170 170 0
Soil Transmitted Helminths 170 170 0
Trachoma 29 170 0
Buruli Ulcer 89 89 0
Yaws 170 170 0

~ 29 ~
Onchocerciasis control activities started with vector control in 1974 while preventive chemotherapy started in 1998 with the introduction of ivermectin. While the other NTDs have had individual programmes for various length of time, there has not been a well articulated health sector-based intervention programme for rabies. The date the various programmes started, the districts and population covered and the key partners are summarized in Table 6 below.
Table 6: Summary Information On Endemic NTDs, Target Population And Specific Control Strategies
Leprosy 9 9 0
CL 5 5 0
Rabies 170 170 0
Guinea Worm 170 170 0
HAT 14 14 0
NTD Date programme
started
Total No. of
districts targeted
No. of districts covered
*(Geographic coverage)
Total population
in target district
No. of (percentage) Population
covered
Key strategies used
Key partners
LF 2001 74 100% 12 million 12 million MDA, Case Management
USAID, LSTM /CNTD, GOG
Onchocerciasis 1974 73 100% 4 million 8.8 million MDA APOC, GOG Sight Savers, USAID
Schistosomiasis 2008 170 170 (100%) 7 million 7 million MDA USAID, GOG
Trachoma 2001 29 29 2.6 million 2.6 million Surveillance ITI USAID, GOG Sight Savers
Buruli Ulcer 1999 89 42 17,7 million 8.4 million (47%)
Case detection & management
ANESVAD WVG, WHO, GOG
Yaws 2008 170 170 25 million Data not available
Case detection & management
GOG
HAT 2008 14 14 1.1 million Data not available
Case detection & management
GOG, WHO, PATTEC.
Leishmaniasis 2006 5 5 400,000 Data not available
Case detection & management
GOG
Leprosy 1980 9 9 720,000 N/A Case detection & management
GOG
Rabies 1960s 170 170 25 million N/A Case detection & management
GOG
Soil Transmitted Helminthiasis
2007 170 170 6 million 6 million MDA GOG, Deworm the World, WHO,WVI, UNICEF
Guinea Worm 1989 170 170 25 million 25 million Case detection, management &
GOG, WHO,USAID Sasakawa (Global
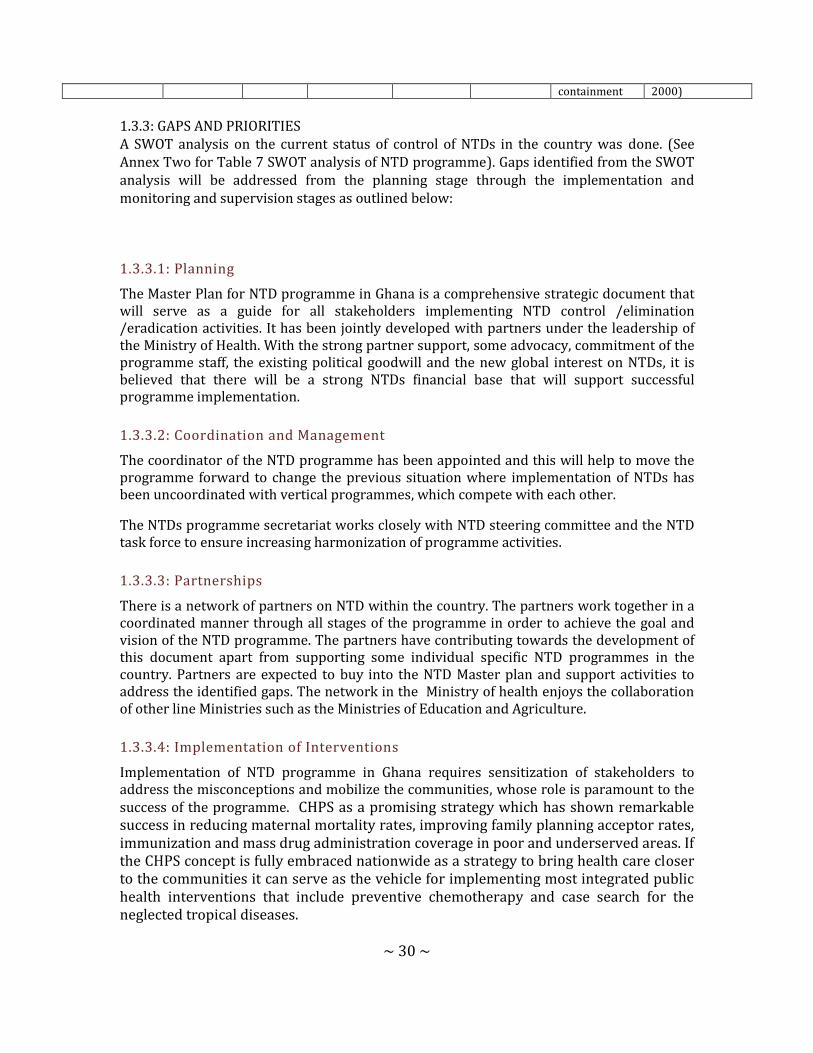
~ 30 ~
1.3.3: GAPS AND PRIORITIES A SWOT analysis on the current status of control of NTDs in the country was done. (See Annex Two for Table 7 SWOT analysis of NTD programme). Gaps identified from the SWOT analysis will be addressed from the planning stage through the implementation and monitoring and supervision stages as outlined below:
1.3.3.1: Planning
The Master Plan for NTD programme in Ghana is a comprehensive strategic document that will serve as a guide for all stakeholders implementing NTD control /elimination /eradication activities. It has been jointly developed with partners under the leadership of the Ministry of Health. With the strong partner support, some advocacy, commitment of the programme staff, the existing political goodwill and the new global interest on NTDs, it is believed that there will be a strong NTDs financial base that will support successful programme implementation.
1.3.3.2: Coordination and Management
The coordinator of the NTD programme has been appointed and this will help to move the programme forward to change the previous situation where implementation of NTDs has been uncoordinated with vertical programmes, which compete with each other.
The NTDs programme secretariat works closely with NTD steering committee and the NTD task force to ensure increasing harmonization of programme activities.
1.3.3.3: Partnerships
There is a network of partners on NTD within the country. The partners work together in a coordinated manner through all stages of the programme in order to achieve the goal and vision of the NTD programme. The partners have contributing towards the development of this document apart from supporting some individual specific NTD programmes in the country. Partners are expected to buy into the NTD Master plan and support activities to address the identified gaps. The network in the Ministry of health enjoys the collaboration of other line Ministries such as the Ministries of Education and Agriculture.
1.3.3.4: Implementation of Interventions
Implementation of NTD programme in Ghana requires sensitization of stakeholders to address the misconceptions and mobilize the communities, whose role is paramount to the success of the programme. CHPS as a promising strategy which has shown remarkable success in reducing maternal mortality rates, improving family planning acceptor rates, immunization and mass drug administration coverage in poor and underserved areas. If the CHPS concept is fully embraced nationwide as a strategy to bring health care closer to the communities it can serve as the vehicle for implementing most integrated public health interventions that include preventive chemotherapy and case search for the neglected tropical diseases.
containment 2000)

~ 31 ~
IEC materials, advocacy packages, training manuals and monitoring tools will be developed and disseminated. Opportunities such as committed partners, free drugs for some of the NTDs, increasing global focus on NTDs will greatly reduce the cost of implementing activities and sustaining the gains.
1.3.3.5: Surveillance, Monitoring And Evaluation
Monitoring and evaluation of some of the NTD is already being done within the national health management information system (HMIS). The NTD programme will therefore take urgent steps to ensure that all diseases are inbuilt into the HMIS of the Ministry of Health as a strategic priority. The newly introduced District Health Management Information System (DHMIS) provides the GHS a chance to standardize, collect and collate essential data at the district level. This will further strengthen the system making it more functional. NTDs will also be incorporated and monitored through the existing IDSR system, and also there will be programme self-monitoring.
PART TWO: NTD STRATEGIC AGENDA
2.1.: OVERALL NTD PROGRAMME MISSION AND GOALS
Mission: “The mission is to contribute to socio-economic development and wealth creation by promoting health, vitality and ensuring access to quality health services for all people living in Ghana.
Vision: A Ghana free of neglected tropical diseases and its complications.
Goal: To prevent, control, eliminate or eradicate the Neglected Tropical Diseases from Ghana by the year 2020.

.2.2 GUIDING PRINCIPLES AND STRATEGIC PRIORITIES
Table 8: Strategic Framework Summary
Strategic Priorities Strategic Objectives Activities
1. Strengthen government ownership, advocacy, coordination, and partnerships
1. To ensure the capacity of the government
of Ghana to effectively and efficiently
scale up and deliver all NTDs interventions
in Ghana.
1. Start to transition and enable NTDP ownership of the
Strategic Social Partnership (SSP) functions. Build capacity of
GHS HQ to develop competencies in SSP to support GHS
programmes.
2. Advocate for the institutionalization of strategic social
partnership (SSP) at GHS HQ level
3. Provide technical support to GHS to set up a small dedicated
unit within GHS to develop SSP Strategy
4. Sensitize and validate NTDP resource mobilization plan with
ICCC and GHS leadership for buy-in.
5. Implement annual NTDP plans to execute the SSP Strategy
6. Develop and institutionalize a systematic methodology to
track, analyze, and communicate NTDP resource allocation,
spending, and performance.
2. To ensure effective and efficient Inter-country coordinating mechanism for NTD programming, partnerships, and coordination
1. Refine the scope and functions of the ICCC and Taskforce
sub-committee on Resource mobilization, with roles and
responsibilities across the committee.
2. Develop meeting schedules, structured agenda(s), reporting
templates and communication channels for the ICCC-sub-
committee meetings
3. Improve coordination mechanism of NTD control at all levels
of the health system.

Conduct national stakeholders and Taskforce meetings.
3. To update and align the existing Communication & Advocacy Strategy with the NTDP Financial Sustainability plan
1. Refine sustainability goals and update the Advocacy Strategy
to align to the Sustainability Goals for the next
implementation phase.
2. Develop business case to the government, partners,
policymakers, and funders (Ministry of Finance and Economic
Planning (MoFEP) and Parliamentary Select Committee on
Health to advocate for increasing the share of government
expenditures for NTDs.
3. Dialogue between NGOs, civil society, and policy makers to
identify partnerships and possibly mobilize resources.
2. Enhance planning for results, resource mobilization and financial sustainability of national NTD Programme.
1. Operationalize the NTD finance strategy
1. The NTD Finance Task Force to oversee the implementation
process and subsequent monitoring and evaluation of the
Finance Strategy.
2. Work to validate the Finance Strategy Performance
Management Plan.
3. Develop a quarterly review meeting with all partners (both
resource and implementation) to assess the performance of
the NTDP Finance Strategy and PMP.
4. Use the outcome of the reviews to identify areas of the
GHS/NTDP financial management system that require
strengthening through refresher trainings.
2. To enhance resource mobilization approaches and strategies at national and regional levels for NTD interventions
1. Strengthen NTDP capacity at both national and regional
levels for sustainability planning & resource mobilization,
strategic budgeting and public financial management (PFM)

reform
2. Introduce sustainability and Strategic Social Partnership
concepts and tools for sustained programming and impact
3. Use 5YR Master Plan (YRMP) and Annual Work Plans (AWPs)
in strategic and yearly budget formulation
4. Identify resources for 5YRMP and annual work plan and
perform financing gap analysis using TIPAC
5. Routinely monitor allocation of funding to NTDs at all levels.
3. Work with Finance Strategy Taskforce to build business cases/proposals to be submitted to identified resource partners.
1. Support partnership management and reporting capabilities
to manage incoming resources and implementing partners
2. With the potential for increased financial resources flowing
into the NTDCPs’ funding pool, efficient implementation and
utilization of these resources will become even more
important in building and maintaining the trust of potential
funders. Therefore, the need for stronger internal controls,
improved recording and reporting, and greater transparency
and overall accountability and governance cannot be
understated.
3. We will provide an institutionalized process of learning
lessons from the quarterly reviews a risk mitigation strategy
to address vertical programming that hinders integration into
overall NTDP.
1. Scale up an integrated preventive chemotherapy, including access to LF, STH, onchocerciasis, schistosomiasis and trachoma interventions
1. Conduct MDA for PCT diseases (LF, oncho, trachoma, STH and schisto)
2. Develop and print materials for MDA
3. Transport medicines and logistics to endemic regions and
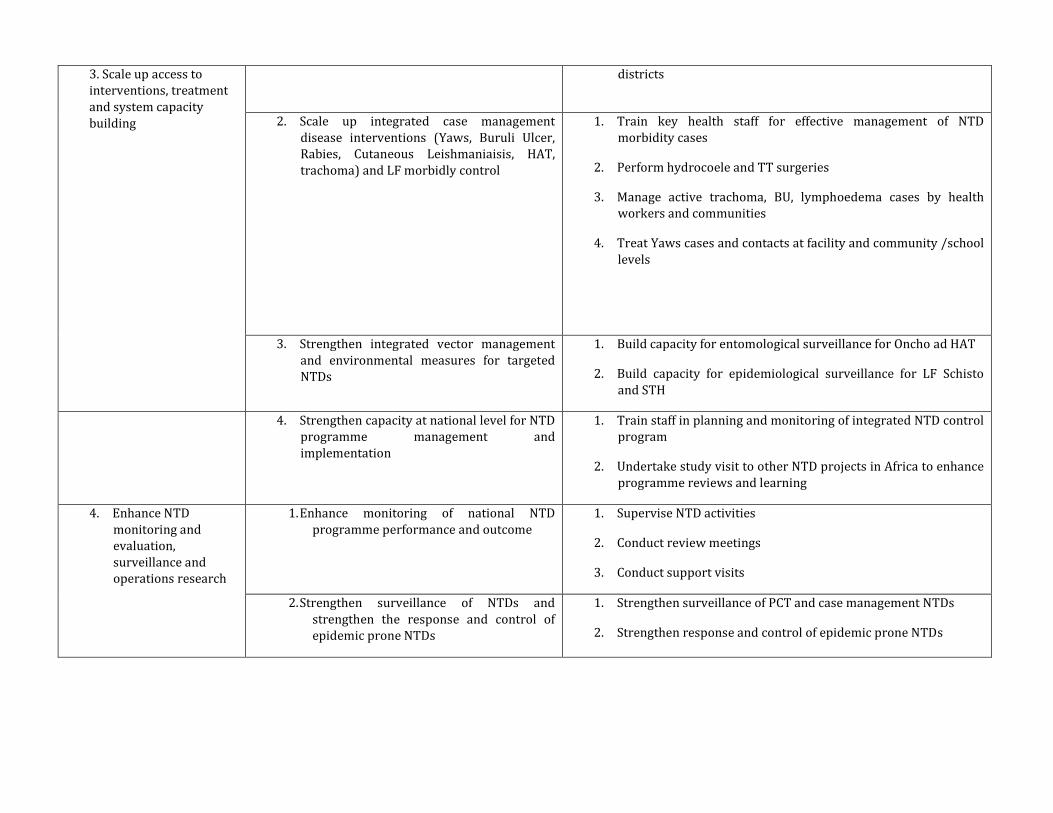
3. Scale up access to interventions, treatment and system capacity building
districts
2. Scale up integrated case management disease interventions (Yaws, Buruli Ulcer, Rabies, Cutaneous Leishmaniaisis, HAT, trachoma) and LF morbidly control
1. Train key health staff for effective management of NTD morbidity cases
2. Perform hydrocoele and TT surgeries
3. Manage active trachoma, BU, lymphoedema cases by health workers and communities
4. Treat Yaws cases and contacts at facility and community /school levels
3. Strengthen integrated vector management and environmental measures for targeted NTDs
1. Build capacity for entomological surveillance for Oncho ad HAT
2. Build capacity for epidemiological surveillance for LF Schisto and STH
4. Strengthen capacity at national level for NTD programme management and implementation
1. Train staff in planning and monitoring of integrated NTD control program
2. Undertake study visit to other NTD projects in Africa to enhance programme reviews and learning
4. Enhance NTD monitoring and evaluation, surveillance and operations research
1. Enhance monitoring of national NTD programme performance and outcome
1. Supervise NTD activities
2. Conduct review meetings
3. Conduct support visits
2. Strengthen surveillance of NTDs and strengthen the response and control of epidemic prone NTDs
1. Strengthen surveillance of PCT and case management NTDs
2. Strengthen response and control of epidemic prone NTDs

3. Support operational research, documentation and evidence to guide innovative approaches to NTD programme interventions
1. Identify and conduct operational research on NTDs for effective programme implementation
4. Establish integrated data management system and support impact analyses for NTD as part of the global NTD data management system and plan
1. Establish integrated data management system
2. To use the DHIMS platform to capture NTD data
5. 4. Enhance NTD monitoring and evaluation, surveillance and operations research
1. Implement an LF exit plan
2. Conduct onchocderciaisis epidemiological and entomological surveys
3. Conduct STH and shcistosomiaisis impact assessment studies.
3. Undertake trachoma surveillance

PART THREE: OPERATIONAL F RAMEWORK
3.1 NTD PROGRAMME FOCUS
Table 9.1 below summarizes the Programme Strategies for control of NTDs endemic in Ghana. The operational plan for control of NTDs in Ghana will be based on individual disease programme goals,specific objectives and control strategies but implementation will be integrated. Programme specific objectives will be drawn from the individual disease programme specific objectives as outlined below. Each individual disease programme will focus on its goals and objectives to ensure that their goals are achieved within the integrated NTDs control approach and hence contribute to the overall National goal.
Table 9.1: Summary of Strategies For Control Of Endemic NTDS
NTD Programme
Global Goals
National Goas
Objectives Strategies Target Populations
Key Indicators
Lymphatic Filariasis Elimination
Elimination of LF by 2020
To eliminate lymphatic filariasis from Ghana by 2020
• To interrupt transmission of LF by 2020
• To provide morbidity and disability for up to 60% of patents with LF morbidity 60%
• To ensure total awareness of prevention and control the country by 2018
• To undertake monitoring and evaluation of all activities
• To establish effective surveillance system in all districts
• Community-Based Mass drug administration
• Conduct hydrocoele surgery
• Management of lymphoedema
• IVM in collaboration with MCP
• Health education
• Communication for change
• Improve documentation of LF treatment and surveillance activities
• Monitoring and evaluation
14 million MDA therapeutic coverage of and geographic coverage
mf prevalence in endemic prevalence
LF antigen prevalence
Percentage of hydrocoele cases operated
Percentage of registered lymphoedema cases managed
Onchocerciasis Elimination
Elimination of oncho by 2025
To eliminate onchocerciasis in?? 60% of endemic districts by 2020
• To interrupt transmission of oncho in 60% of endemic communities
• To create awareness of prevention
.Mass drug administration
Vector control
Communication for change
4.2 million Community microfilaria parasite load
Reduce blackfly infectivity rate to less than 0.5 per 1000 flies

NTD Programme
Global Goals
National Goas
Objectives Strategies Target Populations
Key Indicators
and control in the whole country
• To undertake monitoring and evaluation for onchocerciasis control
• To establish effective surveillance system in all districts
•
Programmatic coverage
Epidemiologic coverage
Geographic coverage of 85% and 100% respectively
Schistosomiasis Cntrol
Sustained control of schistosomiasis by 2020
Reduce schistosomiasis related morbidity to levels of no public health significance 2020
• To treat at 75% all school aged children and high risk populations in endemic areas
• To increase awareness of prevention and control of schistosomiasi
• •
School-based mass drug administration and community-based among high risk population
Communication for change
Collaboration with WASH
Monitoring and evaluation
9 million Proportion of school-aged children treated
Morbidity – haematuria or other morbidity
SCH in prevalence
Improvement in WASH indicators
Soil transmitted helminths Conrol
Ensure treatment coverage of 75% of all school-aged children by 2020 in 100% of endemic countries
Reduce STH related morbidity to levels of no public health significance
Reduce STH related morbidity to levels of no public health significance 2020
To ensure that all school-aged children are treated at least once every year
To increase awareness on STH transmission and control
School-based mass drug administration in endemic areas
Health education
Collaboration with WASH
Monitoring and evaluation
7.1 million Proportion of school-aged children treated
Reduced morbidity
Improvement in wash indicators
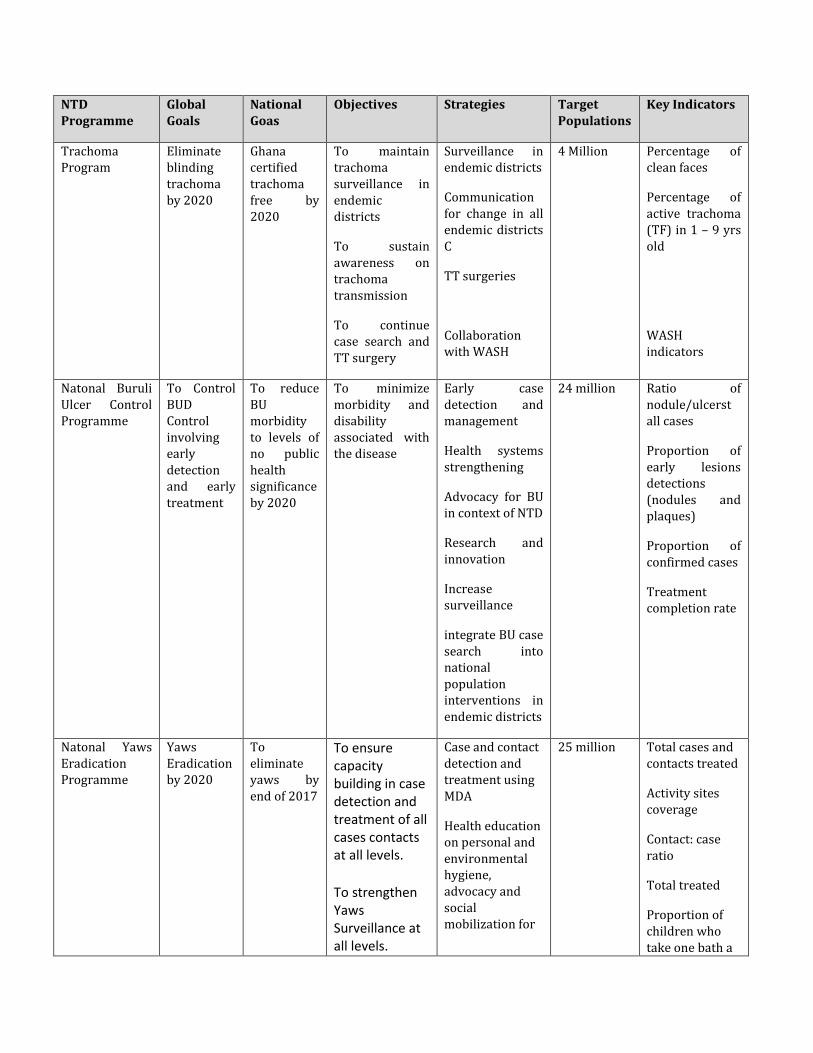
NTD Programme
Global Goals
National Goas
Objectives Strategies Target Populations
Key Indicators
Trachoma Program
Eliminate blinding trachoma by 2020
Ghana certified trachoma free by 2020
To maintain trachoma surveillance in endemic districts
To sustain awareness on trachoma transmission
To continue case search and TT surgery
Surveillance in endemic districts
Communication for change in all endemic districts C
TT surgeries
Collaboration with WASH
4 Million Percentage of clean faces
Percentage of active trachoma (TF) in 1 – 9 yrs old
WASH indicators
Natonal Buruli Ulcer Control Programme
To Control BUD Control involving early detection and early treatment
To reduce BU morbidity to levels of no public health significance by 2020
To minimize morbidity and disability associated with the disease
Early case detection and management
Health systems strengthening
Advocacy for BU in context of NTD
Research and innovation
Increase surveillance
integrate BU case search into national population interventions in endemic districts
24 million Ratio of nodule/ulcerst all cases
Proportion of early lesions detections (nodules and plaques)
Proportion of confirmed cases
Treatment completion rate
Natonal Yaws Eradication Programme
Yaws Eradication by 2020
To eliminate yaws by end of 2017
To ensure capacity building in case detection and treatment of all cases contacts at all levels.
To strengthen Yaws Surveillance at all levels.
Case and contact detection and treatment using MDA
Health education on personal and environmental hygiene, advocacy and social mobilization for
25 million Total cases and contacts treated
Activity sites coverage
Contact: case ratio
Total treated
Proportion of children who take one bath a

NTD Programme
Global Goals
National Goas
Objectives Strategies Target Populations
Key Indicators
To create awareness on the new WHO Yaws eradication strategy.
To ensure regular logistic supply for the management of cases and contacts.
Water provision
Cross border collaboration
day
Number of water sources
HAT Elimination
Reduce morbidity and mortality due to HAT by 2020
Eliminate HAT by 2020
To undertake HAT surveillance
To undertake case detection and treatment
To increase awareness of health staff on case detection
To eradicate the tsetse fly vector
Sentinel surveillance
Build capacity of health workers for case detection
Effective vector control through inter-agency collaboration control
1.1 million Case detection rate
Case management rate
Number of sentinel sites reporting
Leishmaniasis
Reduce morbidity due to Cutaneous Leishmaniasis
Eliminate Cutaneous Leishmaniasis in in endemic districts
To undertake surveillance for Cutaneous Leishmaniasis
To undertake case detection and treatment
To increase awareness of health staff for case detection
Sentinel surveillance
Building capacity of health workers for case detection
increase public awareness in endemic areas
Effective vector control through inter-agency collaboration
0.5 million Case detection rate
Number of health workers trained
Leprosy Elimination Eliminate leprosy in
To undertake case detection
Case search in 0.7 million case detection
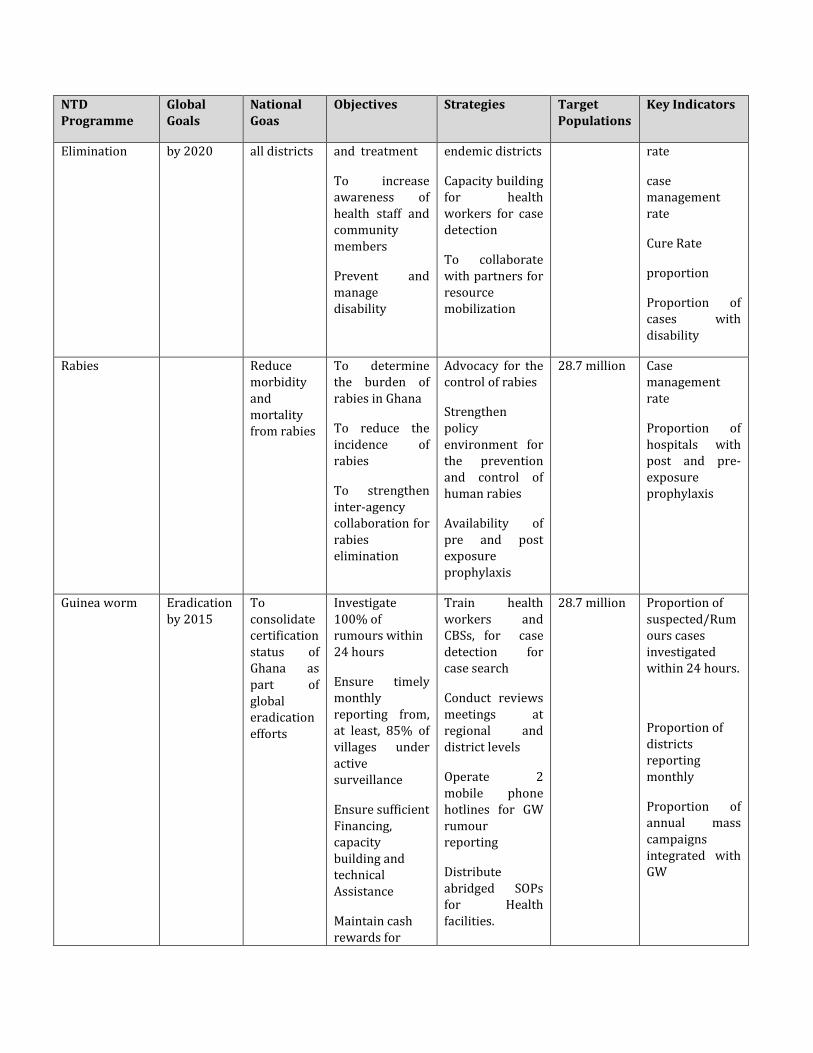
NTD Programme
Global Goals
National Goas
Objectives Strategies Target Populations
Key Indicators
Elimination by 2020 all districts and treatment
To increase awareness of health staff and community members
Prevent and manage disability
endemic districts
Capacity building for health workers for case detection
To collaborate with partners for resource mobilization
rate
case management rate
Cure Rate
proportion
Proportion of cases with disability
Rabies Reduce morbidity and mortality from rabies
To determine the burden of rabies in Ghana
To reduce the incidence of rabies
To strengthen inter-agency collaboration for rabies elimination
Advocacy for the control of rabies
Strengthen policy environment for the prevention and control of human rabies
Availability of pre and post exposure prophylaxis
28.7 million Case management rate
Proportion of hospitals with post and pre-exposure prophylaxis
Guinea worm Eradication by 2015
To consolidate certification status of Ghana as part of global eradication efforts
Investigate 100% of rumours within 24 hours
Ensure timely monthly reporting from, at least, 85% of villages under active surveillance
Ensure sufficient Financing, capacity building and technical Assistance
Maintain cash rewards for
Train health workers and CBSs, for case detection for case search
Conduct reviews meetings at regional and district levels
Operate 2 mobile phone hotlines for GW rumour reporting
Distribute abridged SOPs for Health facilities.
28.7 million Proportion of suspected/Rumours cases investigated within 24 hours.
Proportion of districts reporting monthly
Proportion of annual mass campaigns integrated with GW
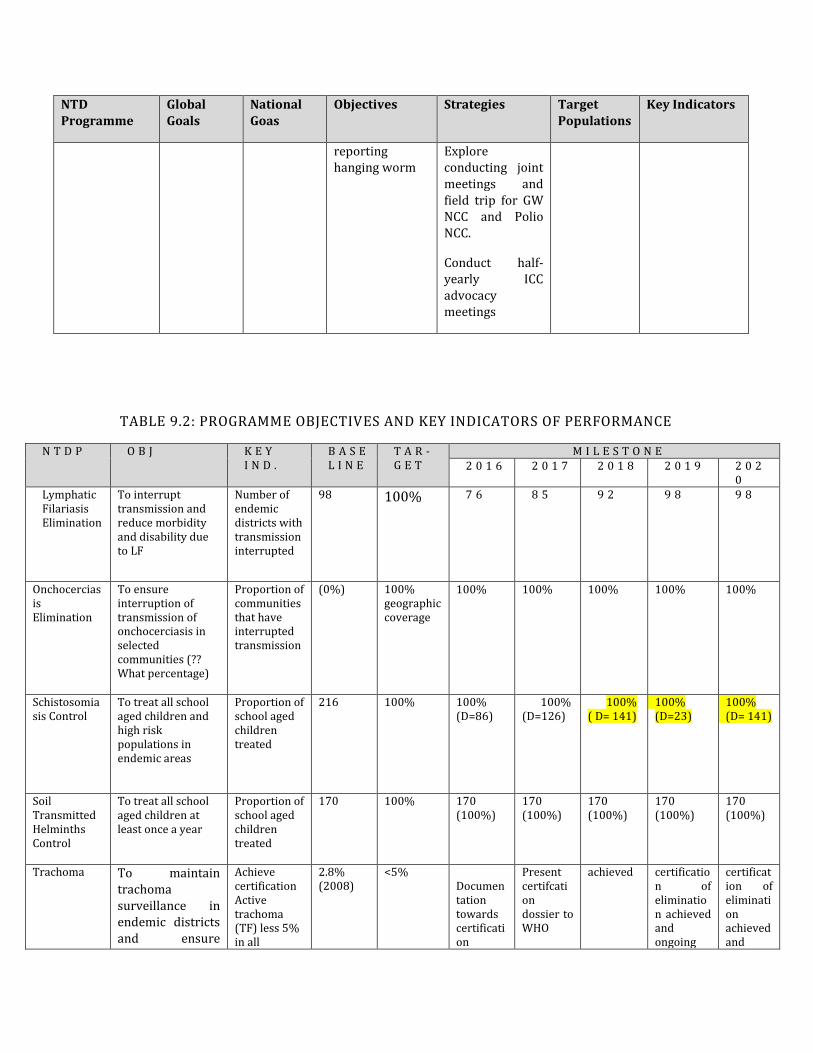
NTD Programme
Global Goals
National Goas
Objectives Strategies Target Populations
Key Indicators
reporting hanging worm
Explore conducting joint meetings and field trip for GW NCC and Polio NCC.
Conduct half-yearly ICC advocacy meetings
TABLE 9.2: PROGRAMME OBJECTIVES AND KEY INDICATORS OF PERFORMANCE
N T D P O B J K E Y I N D .
B A S EL I N E
T A R -G E T
M I L E S T O N E 2 0 1 6 2 0 1 7 2 0 1 8 2 0 1 9 2 0 2
0 Lymphatic Filariasis Elimination
• To interrupt transmission and reduce morbidity and disability due to LF
• Number of endemic districts with transmission interrupted
•
98 100%
7 6 8 5 9 2 9 8 9 8
• Onchocerciasis Elimination
• •
• To ensure interruption of transmission of onchocerciasis in selected communities (?? What percentage)
•
• Proportion of communities that have interrupted transmission
• (0%) • 100% geographic coverage
100% 100% 100% 100% 100%
• Schistosomiasis Control
• To treat all school aged children and high risk populations in endemic areas
• •
• Proportion of school aged children treated
•
• 216 • 100% • 100% • (D=86)
100% (D=126)
100% ( D= 141)
• 100% (D=23)
• 100% • (D= 141)
• Soil Transmitted Helminths Control
• To treat all school aged children at least once a year
• •
• Proportion of school aged children treated
• 170 • 100% • 170 (100%)
• 170 (100%)
• 170 (100%)
• 170 (100%)
• 170 (100%)
• Trachoma •
To maintain trachoma surveillance in endemic districts and ensure
• Achieve certification
• Active trachoma (TF) less 5% in all
• 2.8% • (2008)
• <5% • Documentation towards certification
• Present certifcation dossier to WHO
• achieved • certification of elimination achieved and ongoing
• certification of elimination achieved and

N T D P O B J K E Y I N D .
B A S EL I N E
T A R -G E T
M I L E S T O N E
certification of elimination
•
endemic districts
• •
surveillance
ongoing surveillance
• Buruli Ulcer • To Minimize Morbidity And Disability Associated With The Disease
• Proportion of lesions detscted (nodules/plaques)
•
• 40% (2011)
• 100% • 40% • 60% • 80% • 100% • 100%
• Yaws • Elimination By 2015
• Yaws prevalence
•
• 0.7% (2008)
• 0% • 0.6% • 0.5% • 0.35% • 0.1% • 0%
• HAT • To maintain HAT surveillance
• Number of sentinel sites reporting
• 6 • 80% • 6 • 50% • 60% • 70% • 80%
• Leishma-niasis
• • To build health
system capacity to detect cases
• • Number of
districts where with capacity to detect cases
• 0 • 17 • 5 10 15 20 25
• Rabies • Reduce morbidity and mortality from rabies
• Proportion of hospitals with post and pre-exposure prophylaxis
• 50% (2009)
• 100% • 60% • 65% • 70% • 75% • 80%
• Leprosy • To undertake case detection and treatment
•
• Proportion disability grade 2 cases
•
• 161 • (2010)
• 216 • 162 • 163 • 164 • 165 • 0%
• Guinea worm • To maintain post certification surveillance
•
• Proportion of rumours reported and investigated in 24 hours
•
• 94% (2015)
• 100% • 100% • 100% • 100% • 100% • 100%
3.2 STRENGTHENING GOVERNMENT OWNERSHIP, ADVOCACY, COORDINATION AND PARTNERSHIP
The key activities that will help achieve the strategic objective for strengthening government ownership, advocacy, coordination and partnerships are as described in Table 10 below.

Table 10: Activities For Strengthening Government Ownership, Advocacy, Coordination And Partnership
Activity Details (Sub-activity) Timeframe Resources needed
Strategic Objective 1: Enhance monitoring of national NTD programme performance and outcome.
Strengthening NTD Performance
Update M&E Strategic plan Q1 2016 NTDP team and partners, Conference package Transport
Development of M&E tools 2013 Stationery, Transport, Venue & refreshment
Pre-testing of M&E Tools 2013 Data collectors, Drivers, Transport, Stationery
Orientation of staff 2013 Transport, Venue & refreshment
Supervision of NTD activities
Monitoring drugs and logistics supply
2013 - 2017 Personnel, Drivers, District staff, Transport, Vehicle maintenance
Monitoring training of CDDs and health workers
2013 - 2017 Personnel, Drivers, District staff, Transport, Vehicle maintenance
Monitoring treatment processes and adverse events management
2013 - 2017 Personnel, Drivers, Regional staff, Transport, Vehicle maintenance
Monitoring drug management & inventory
2013 - 2016 Personnel, Drivers, District staff, Transport, Vehicle maintenance
Review Meetings National Half-year Reviews
2013 - 2017 National participants, Regional participants, Drivers, Transport, Venue & refreshment
Regional Quarterly Reviews
2013 - 2017 Regional participants, District Participants, Drivers, Transport, Venue & refreshment
District Quarterly Reviews 2013 - 2017 Transport, Venue & refreshment,
Sub-district monthly reviews
2013 - 2017 Refreshment, Transport for CDDs,
Support visits for all NTDs
National Quarterly visits 2013 - 2017 Monitors, Drivers, Transport,
Regional Quarterly Visits 2013 - 2017 Monitors, Drivers, Transport,
District Quarterly Visits 2013 - 2017 Monitors, Drivers, Transport
Strategic Objective 2: Strengthen the surveillance of NTDs and strengthen the response and control of epidemic-prone NTDs.

Strengthen surveillance of PCT and case management NTDs
Epidemiological & Morbidity Surveillance of Schisto, STH
2013 - 2017 Supervisors, Technicians, Nutritionist, Drivers, District staff, Transport, Vehicle maintenance, Logistics/materials
Epidemiological & Morbidity Surveillance of Onchocerciasis
2013 - 2017 Supervisors, Technicians, Drivers, Regional Staff, District staff, Transport, Vehicle maintenance, Logistics/materials
Epidemiological Surveillance of Lymphatic Filariasis
2013 - 2017 Supervisors, Technicians, Drivers, Regional staff, District staff, Transport, Vehicle maintenance, Logistics/materials
Implement an exit plan for lymphatic filariasis (Treatment Assessment Surveys)
2013 - 2017 Supervisors, Technicians, Drivers, Regional staff, District staff, Transport, Vehicle maintenance, Logistics/materials
Passive Surveillance of Lymphatic filariasis after stopping MDA
2013 - 2017 Personnel, Transport, logistics/Materials
Yearly sentinel surveys for Yaws
2013 - 2017 Resource person, Drivers, Stationery, Transport
Mid-term evaluation of Yaws 2014 Field teams, Consultants, Drivers, Stationery, Transport
Final evaluation of Yaws 2017 Field teams, Consultants, Drivers, Stationery, Transport
Training of health workers for trachoma surveillance
2013 Facilitators, Participants, Transport, Venue & refreshment
Trachoma active case search 2013 - 2017 Health workers, Transport, Materials, Community health volunteers
School surveys for trachoma 2013 - 2017 Health workers, Transport, Materials, Community health volunteers
Rabies surveillance 2013 - 2017 Personnel, Transport, Materials
Leprosy surveillance 2013 - 2017 Personnel, Transport, Materials
Leishmaniasis surveillance 2013 - 2017 Personnel, Transport, Materials
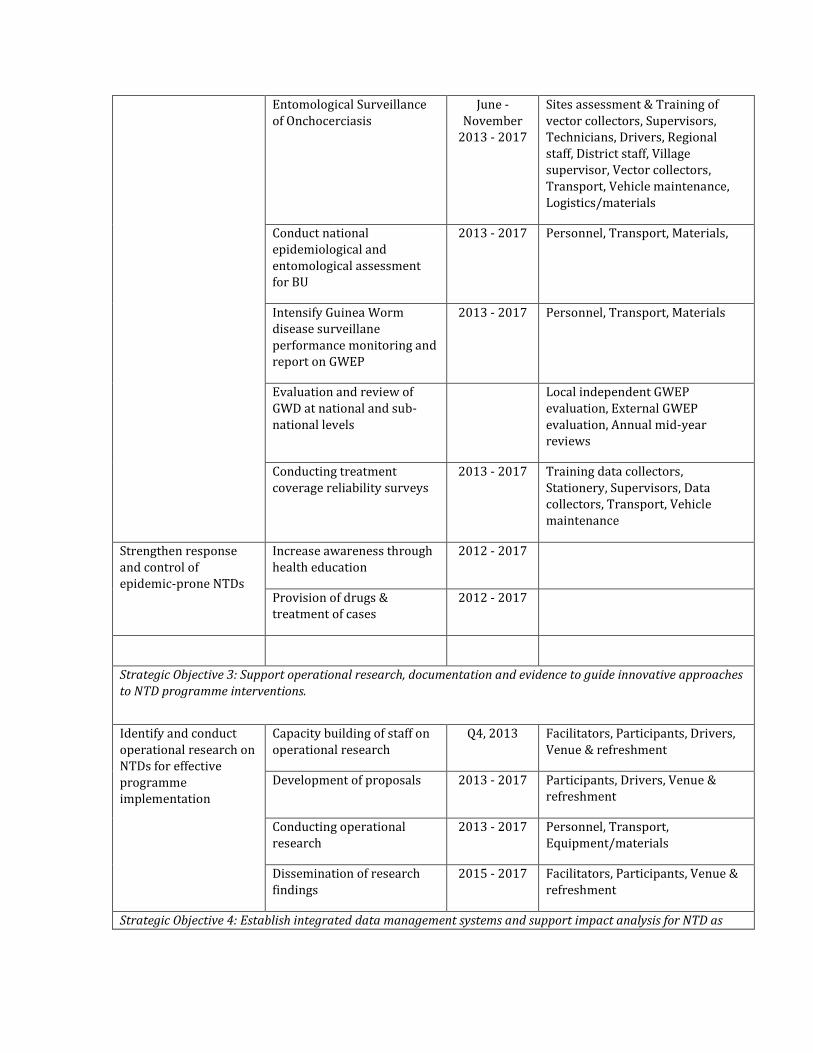
Entomological Surveillance of Onchocerciasis
June - November
2013 - 2017
Sites assessment & Training of vector collectors, Supervisors, Technicians, Drivers, Regional staff, District staff, Village supervisor, Vector collectors, Transport, Vehicle maintenance, Logistics/materials
Conduct national epidemiological and entomological assessment for BU
2013 - 2017 Personnel, Transport, Materials,
Intensify Guinea Worm disease surveillane performance monitoring and report on GWEP
2013 - 2017 Personnel, Transport, Materials
Evaluation and review of GWD at national and sub-national levels
Local independent GWEP evaluation, External GWEP evaluation, Annual mid-year reviews
Conducting treatment coverage reliability surveys
2013 - 2017 Training data collectors, Stationery, Supervisors, Data collectors, Transport, Vehicle maintenance
Strengthen response and control of epidemic-prone NTDs
Increase awareness through health education
2012 - 2017
Provision of drugs & treatment of cases
2012 - 2017
Strategic Objective 3: Support operational research, documentation and evidence to guide innovative approaches to NTD programme interventions.
Identify and conduct operational research on NTDs for effective programme implementation
Capacity building of staff on operational research
Q4, 2013 Facilitators, Participants, Drivers, Venue & refreshment
Development of proposals 2013 - 2017 Participants, Drivers, Venue & refreshment
Conducting operational research
2013 - 2017 Personnel, Transport, Equipment/materials
Dissemination of research findings
2015 - 2017 Facilitators, Participants, Venue & refreshment
Strategic Objective 4: Establish integrated data management systems and support impact analysis for NTD as
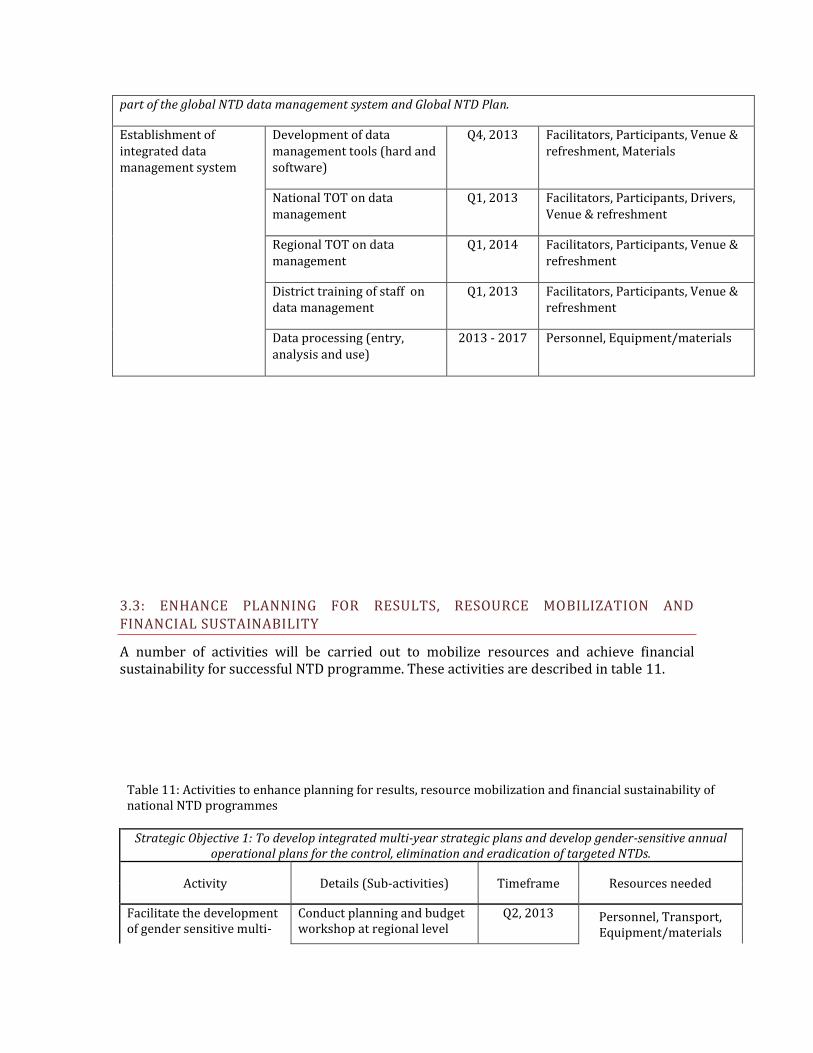
part of the global NTD data management system and Global NTD Plan.
Establishment of integrated data management system
Development of data management tools (hard and software)
Q4, 2013 Facilitators, Participants, Venue & refreshment, Materials
National TOT on data management
Q1, 2013 Facilitators, Participants, Drivers, Venue & refreshment
Regional TOT on data management
Q1, 2014 Facilitators, Participants, Venue & refreshment
District training of staff on data management
Q1, 2013 Facilitators, Participants, Venue & refreshment
Data processing (entry, analysis and use)
2013 - 2017 Personnel, Equipment/materials
3.3: ENHANCE PLANNING FOR RESULTS, RESOURCE MOBILIZATION AND FINANCIAL SUSTAINABILITY
A number of activities will be carried out to mobilize resources and achieve financial sustainability for successful NTD programme. These activities are described in table 11.
Table 11: Activities to enhance planning for results, resource mobilization and financial sustainability of national NTD programmes
Strategic Objective 1: To develop integrated multi-year strategic plans and develop gender-sensitive annual operational plans for the control, elimination and eradication of targeted NTDs.
Activity Details (Sub-activities) Timeframe Resources needed
Facilitate the development of gender sensitive multi-
Conduct planning and budget workshop at regional level
Q2, 2013 Personnel, Transport, Equipment/materials

year NTD plans at regional and district levels
Conduct planning and budget workshop at district level
Q2, 2013
Formulate and implement GWE final Push Strategic Plan at national and regional levels
Production and dissemination of Final Push GWE Strategic Plan
2013 - 2017
Implementation of Push Strategic Plan
Strategic Objective 2: Enhance resource mobilization approaches and strategies at national and sub-national levels for NTD interventions.
Conduct in-country fund raising for the control and elimination of NTDs
Advocate support for NTDs from telecommunication companies
January - December
Personnel Transport
Communication
Develop proposals for sourcing in-country funds
Q2, 2014
Develop documentaries Q4, 2013
Mount photo exhibitions for awareness campaigns on NTDs
January - December
Improve international partnership for NTD support in Ghana
Advocate for improved support for NTDs at international conferences, seminars, etc.
January - December
Strategic Objective 3: Strengthen the integration and linkages of NTD programme and financial plans into sector-wide and national budgetary and financing mechanisms.
Ensure availability of budget lines for NTD control and elimination at national, regional and district level plans
Ensure availability of budget lines at national, regional and district levels through advocacy meetings, seminars, workshops, etc
January - December
Personnel Transport
Equipment/materials Develop integrated plans and budgets for all the NTDs in Ghana
Conduct National Task Force meetings
Q2 & Q4
Strategic Objective 4: Support countries to develop and update national NTD policies and elaborate guidelines and tools to guide effective policy and programme implementation.
Develop and print integrated NTD protocols and guidelines for the control of NTDs in Ghana
Conduct 5-day meeting to develop integrated NTD tools
Q3, 2013 Personnel Transport
Equipment/materials Print integrated NTD protocols and guidelines
Q3, 2013 Funds
Conduct training meetings for health workers in the use of NTD tools and guidelines
National, regional, district Q2, 2013 Personnel Transport
Equipment/materials
Disseminate NTD tools and guidelines at all health facilities
Conduct dissemination meetings
Q3, 2013 Personnel Transport
Equipment/materials

3.4: SCALING UP ACCESS TO NTD INTERVENTIONS, TREATMENT AND SERVICE DELIVERY
CAPACITIES
This section addresses the following interventions; Preventive Chemotherapy Case Management Transmission Control which includes vector and reservoir control as well as
improvement in sanitation and water quality and supply 3.4.1: Preventive Chemotherapy Interventions
3.4.1.1 Disease Mapping
Mapping of the PCT diseases (LF, Onchocerciasis, Trachoma, Schistosomiasis and Soil
transmitted Helminthiasis) has been completed and forms the basis of all interventions
undertaken in the regions and districts. LF intervenes in 74 districts while Onchocerciasis is
endemic in 73 districts. The case management diseases have all been mapped. Activities
mainly undertaken include case search and passive case management, even though the
Yaws programme periodically undertake mass treatment in selected schools and
communities.
Table 12: Estimation of Needs for Completion of Mapping of PCT Diseases
3.4.1.2 Mass Drug Administration
Table 13: Populations At-risk Targeted by PCT Interventions
NTD No. of endemic districts
Total No. of
Implementation Units
Total population
at-risk
Adults 15 years and
above
School-aged Children
5-14 years
No. in special targeted age
category
NTD No. of endemic districts No. of districts mapped LF 74 170
Onchocerciasis 73 170
Schistosomiasis 170 170
Soil Transmitted Helminths 170 170
Trachoma 29 170

(IUs)
LF 74 170 12,265,335 6,463,832 3,348,436 NA
Onchocerciasis 73 170 8,181,704 4,311,758 2,233,605 NA
Schistosomiasis 170 170 7,003,757 3,690,980 1,912,026 NA
Soil Transmitted Helminths
170 170 7,003,757 3,690,980 1,912,026 NA
Trachoma 29 170 3,058,880 1,612,030 835,074 NA
Table 14: Packages of Mass Drug Administration
Intervention Package No.
Target Disease Combination
MDA Types
Delivery Channels
Timing of delivery
No. of districts (list of names in footnote)
Requirements Other mass disease control interventions in the district
I Lymphatic Filariasis
Onchocerciasis
Trachoma
MDA 1 Community-based/campaigns/CDTI
Month 1 Week 3
Annex 1
Training of health personnel
Training of teachers and community volunteers
Social mobilisation
Production of tools
Logistics for drug distribution and management
EPI Campaigns
ITN distribution
MDA 4 Community-based
Month 1 Week 1
II Onchocerciasis
Schistosomiasis (high prevalence)
Schistosomiasis (low prevalence)
STH (high prevalence)
STH (low prevalence)
MDA 3 Community-based campaigns/CDTI
Month 6
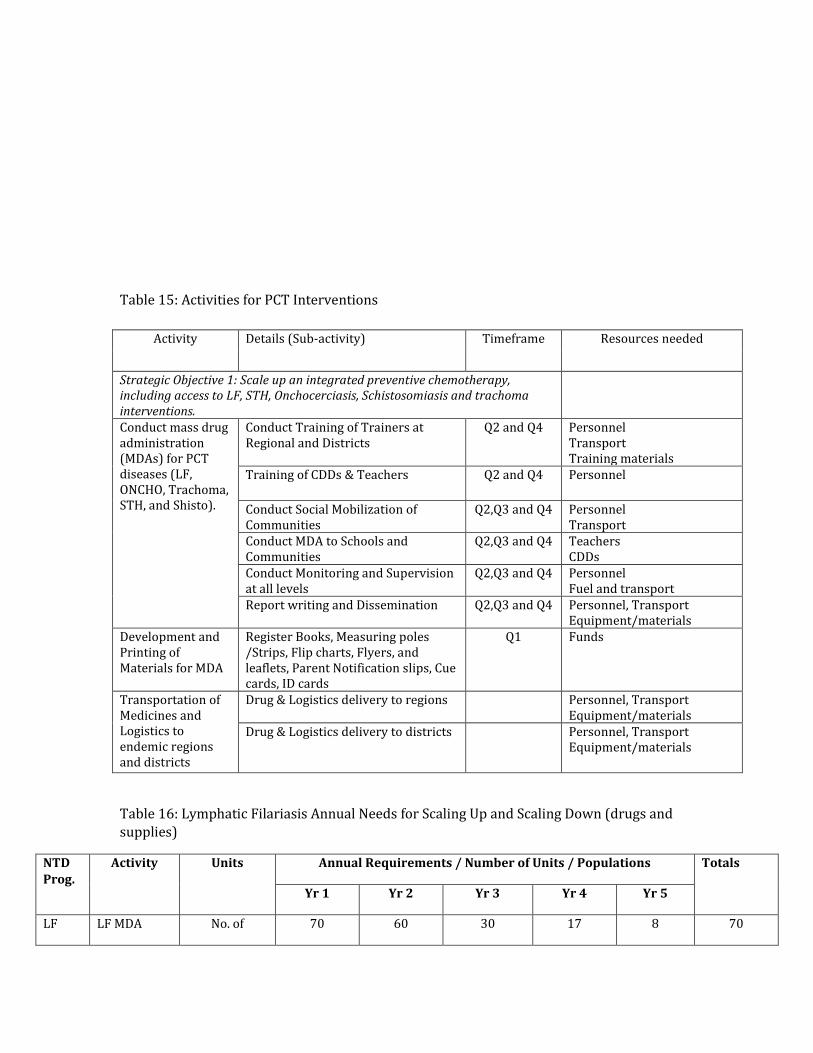
Table 15: Activities for PCT Interventions
Activity Details (Sub-activity) Timeframe Resources needed
Strategic Objective 1: Scale up an integrated preventive chemotherapy, including access to LF, STH, Onchocerciasis, Schistosomiasis and trachoma interventions.
Conduct mass drug administration (MDAs) for PCT diseases (LF, ONCHO, Trachoma, STH, and Shisto).
Conduct Training of Trainers at Regional and Districts
Q2 and Q4 Personnel Transport Training materials
Training of CDDs & Teachers Q2 and Q4 Personnel
Conduct Social Mobilization of Communities
Q2,Q3 and Q4 Personnel Transport
Conduct MDA to Schools and Communities
Q2,Q3 and Q4 Teachers CDDs
Conduct Monitoring and Supervision at all levels
Q2,Q3 and Q4 Personnel Fuel and transport
Report writing and Dissemination Q2,Q3 and Q4 Personnel, Transport Equipment/materials
Development and Printing of Materials for MDA
Register Books, Measuring poles /Strips, Flip charts, Flyers, and leaflets, Parent Notification slips, Cue cards, ID cards
Q1
Funds
Transportation of Medicines and Logistics to endemic regions and districts
Drug & Logistics delivery to regions Personnel, Transport Equipment/materials
Drug & Logistics delivery to districts Personnel, Transport Equipment/materials
Table 16: Lymphatic Filariasis Annual Needs for Scaling Up and Scaling Down (drugs and supplies)
NTD Prog.
Activity Units Annual Requirements / Number of Units / Populations Totals
Yr 1 Yr 2 Yr 3 Yr 4 Yr 5
LF LF MDA No. of 70 60 30 17 8 70

Elimi-nation
Districts
No. of Pop at risk targeted
11,680,174 9,001,611 6,630,163 5,201,332 3,164,736 35,678,016
Ivermectin 28,032,418 21,603,866 15,912,391 12,483,197 7,595,366 85,627,238
Albendazole 9,344,139 7,201,289 5,304,130 4,161,066 2,531,789 28,542,413
Baseline Survey
No. districts - - - - - -
Transmission Assessment Surveys
No. of districts 4 7 6 4 4
ICT cards (1,000 per IU or EU)
4000 7000 6000 4000 4000 25000
Post-MDA Surveillance
No. Districts 4 14 36 43 26 4
Table 17: Schistosomiasis Annual Needs for Scaling Up and Scaling Down (drugs and supplies)
NTD Prog.
Activity Units Annual Requirements / Number of Units / Populations Totals
Yr 1 Yr 2 Yr 3 Yr 4 Yr 5
Schisto-somiasis
MDA No. of districts 125 58 125 58 125 491
At risk pop targeted
4,823,368 2,869,525 4,934,305 2,935,524 5,047,794 20,610,517
Praziquantel needs
12,058,420 7,173,813 12,335,764 7,338,810 12,619,486 51,526,293
Baseline Survey
No. of districts 0 0 0 0 0 0
Impact evaluation surveys
No. of districts 25 25 25 25 25 125
Surveillance
No. of districts 0 0 0 0 0 0
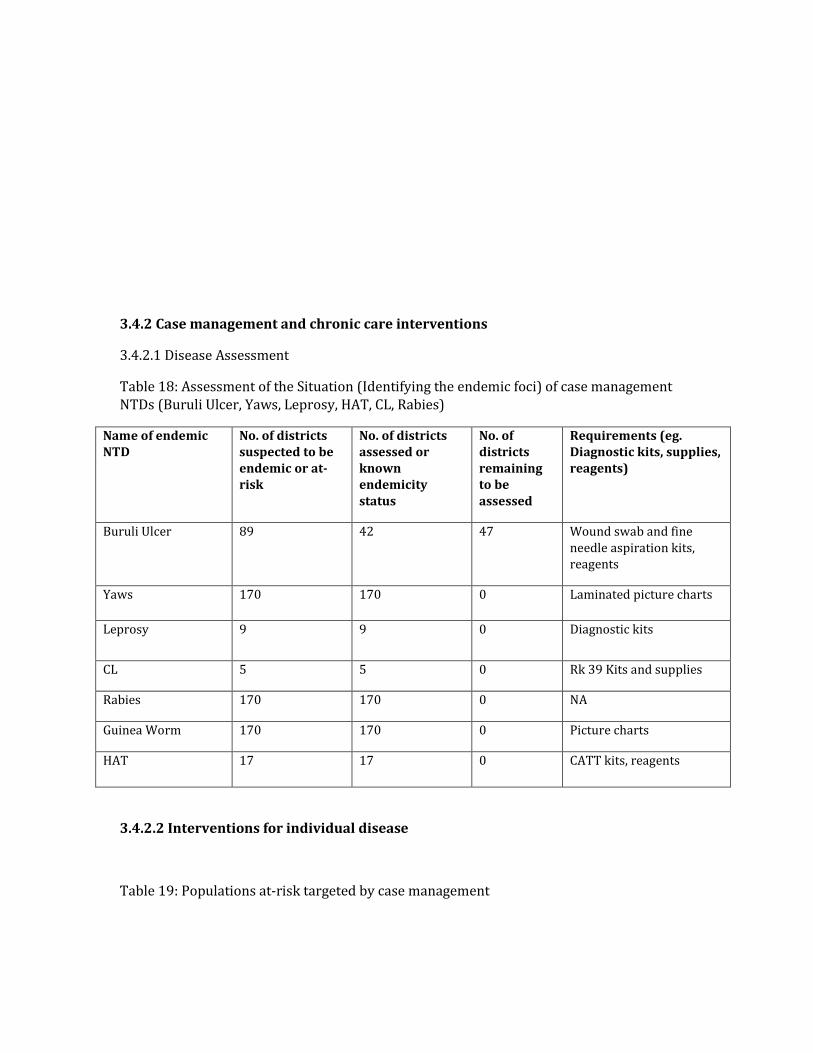
3.4.2 Case management and chronic care interventions
3.4.2.1 Disease Assessment
Table 18: Assessment of the Situation (Identifying the endemic foci) of case management NTDs (Buruli Ulcer, Yaws, Leprosy, HAT, CL, Rabies)
Name of endemic NTD
No. of districts suspected to be endemic or at-risk
No. of districts assessed or known endemicity status
No. of districts remaining to be assessed
Requirements (eg. Diagnostic kits, supplies, reagents)
Buruli Ulcer 89 42 47 Wound swab and fine needle aspiration kits, reagents
Yaws 170 170 0 Laminated picture charts
Leprosy 9 9 0 Diagnostic kits
CL 5 5 0 Rk 39 Kits and supplies
Rabies 170 170 0 NA
Guinea Worm 170 170 0 Picture charts
HAT 17 17 0 CATT kits, reagents
3.4.2.2 Interventions for individual disease
Table 19: Populations at-risk targeted by case management

Name of endemic NTD
No. of districts suspected to be endemic or at-risk
No. of endemic districts selected for intervention
Estimated population at risk
Types of intervention to be delivered and requirements (needs)
Buruli Ulcer
89 89 17.7 million Early detection, case management, surgery, rehabilitation, surveillance, skin graft machine, knives, mesh graft
Yaws 170 170 25 million Case detection and management and contact treatment, school screening, syringes and needles, antibiotics
Leprosy 9 9 720,000 Case detection and management, orthopedic appliances, clutch, drugs
CL 5 5 400,000 Case detection and management
Rabies 170 170 25 million Surveillance, vaccines for pre and post exposure prophylaxis
Guinea Worm
170 170 25 million Surveillance and rumour investigation
HAT 14 14 1.1 million Case detection and management
3.4.2.2 Intervention packages for groups of diseases
Table 20: Intervention packages for group of case management diseases and chronic care
Intervention package
NTDs targeted Method of intervention delivery
Requirement Other non-NTD opportunities for integration
Surgery LF hydrocele, TT, Buruli ulcer category II and III
Hospital based Elective surgery Surgical outreach services
Training of medical doctors and nurses Surgical kits, dermatomes and mesh graft for skin grafting hospitals with good surgical facilities
Capacity building for basic surgery at the district level
Rehabilitation Buruli ulcer Physiotherapy Training of physiotherapy assistants, nurses and family members follow up visits

Table 21: Activities for case management interventions
Strategic Objective 2: Scale up integrated case-management-based diseases interventions (Yaws, BUD, Rabies, HAT, Leishmaniasis etc) including LF morbidity control
Activity Details (Sub-activities) Time frame / frequency
Resources needed
Train key health staff for effective management of NTD morbidity cases
Train doctors to perform hydrocele surgeries
Personnel, Transport Equipment/materials
Train other health workers on lymphoedema management
Q3, 2013 Personnel, Transport Equipment/materials
Train community health agents on lymphodema management
Q3, 2013 Personnel, Transport Equipment/materials
Build capacity at national, regional and district institutional levels in BU case management
Human Resource Development Drugs & Logistics
Perform hydrocele surgeries
Conduct Hydrocele surgeries Q1-Q4 2013-2017 Personnel, Transport
Medicine and Supplies Perform TT surgeries
Conduct TT surgeries Q1-Q4 2013-2017
Personnel, Transport Medicine and Supplies
Manage Active Trachoma, BUD, leprosy and lymphodema cases by HW and communities
Including rehabilitation of severely affected BU patients
Q1-Q4 8 2013-2017
Surgical supplies & instruments, wound dressing
materials, drugs
Training of HW on Case and Contacts treatment of Yaws at all levels
Trainer of Trainers at National Level
Q4, 2013 Trainers, Facilitators Participant from regions Transport, Drivers, Venue & Refreshments, Stationery & Supplies
Scale up training of HW for Yaws case and contact treatment
2013-2017 Trainers/Facilitators Participant from Districts Transport Fuel per gallons Drivers, Venue and Refreshments Stationery and Supplies
Treatment of Yaws cases and contacts at facilities and communities/schools (Sub District Level)
planned weekly treatments surveys to schools and communities by Health workers
1,Day/week for 40 weeks per year
Fuel, Transport and Allowance for Health workers, Supplies (Benzathine, Needles, etc
3.4.3 Transmission Control Interventions Table 22: Intervention Control for Transmission Control
Intervention packages
Targeted NTDs Methods of intervention delivery
Requirements Other NTD opportunities for integration
Vector control LF, Leishmaniasis, Malaria
Insecticide treated nets, indoor
ITN, DDT, plastering of walls
Malaria vector control, Integrated
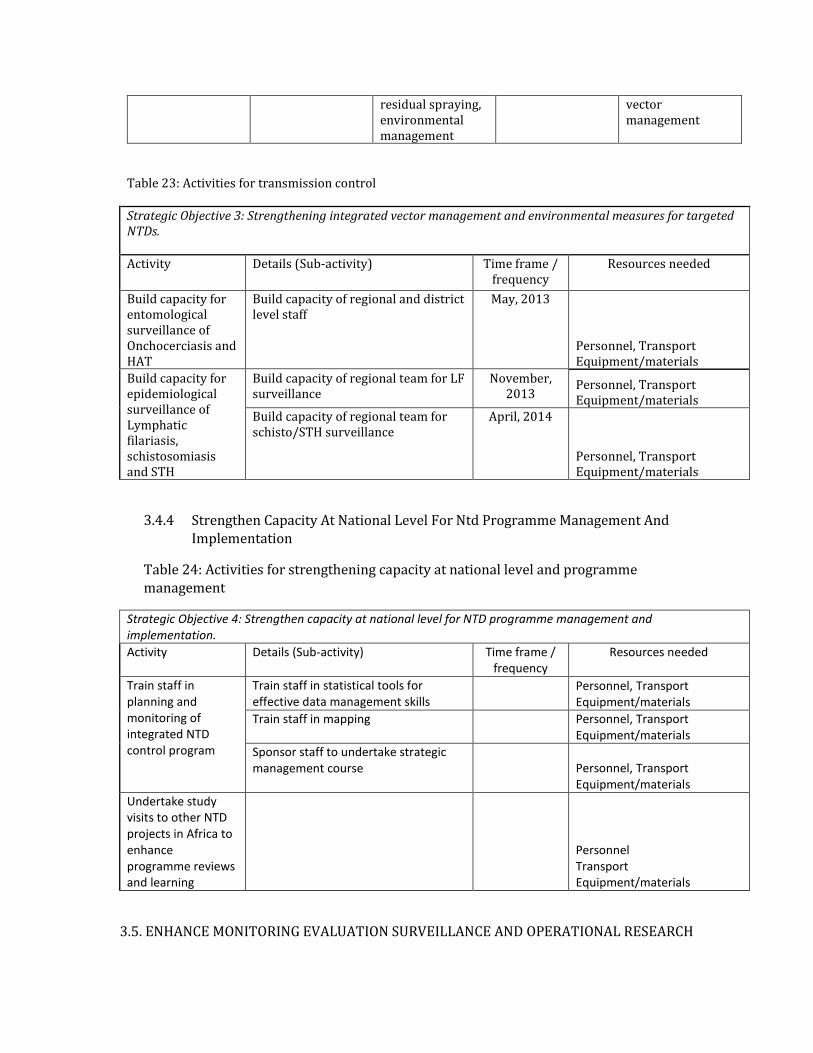
residual spraying, environmental management
vector management
Table 23: Activities for transmission control
Strategic Objective 3: Strengthening integrated vector management and environmental measures for targeted NTDs.
Activity Details (Sub-activity) Time frame / frequency
Resources needed
Build capacity for entomological surveillance of Onchocerciasis and HAT
Build capacity of regional and district level staff
May, 2013
Personnel, Transport Equipment/materials
Build capacity for epidemiological surveillance of Lymphatic filariasis, schistosomiasis and STH
Build capacity of regional team for LF surveillance
November, 2013
Personnel, Transport Equipment/materials
Build capacity of regional team for schisto/STH surveillance
April, 2014
Personnel, Transport Equipment/materials
3.4.4 Strengthen Capacity At National Level For Ntd Programme Management And Implementation
Table 24: Activities for strengthening capacity at national level and programme management
Strategic Objective 4: Strengthen capacity at national level for NTD programme management and implementation.
Activity Details (Sub-activity) Time frame / frequency
Resources needed
Train staff in planning and monitoring of integrated NTD control program
Train staff in statistical tools for effective data management skills
Personnel, Transport Equipment/materials
Train staff in mapping Personnel, Transport Equipment/materials
Sponsor staff to undertake strategic management course
Personnel, Transport Equipment/materials
Undertake study visits to other NTD projects in Africa to enhance programme reviews and learning
Personnel Transport Equipment/materials
3.5. ENHANCE MONITORING EVALUATION SURVEILLANCE AND OPERATIONAL RESEARCH

3.5.1 Monitoring and evaluation
Integrated monitoring of all the programme’s activities will be undertaken for all the NTDs with the objective of strengthening performance of these programmes. This will take the form of supervisory visits, review meetings and support visits. Planned evaluation of the programme will be done according to recommended schedules of specific programme guidelines or as planned by the integrated programme. These activities depending on the nature will be done quarterly, half-yearly or annually. Others will be done at mid-term or end of term of this 5-year strategic plan. The results obtained from these evaluations will be used to inform the programme direction.
Supervision across all levels of the GHS, from the national level to the regional, district, sub-district and community levels, will contribute to staff commitment and accountability for programme success. The indicators to be monitored and evaluated include the therapeutic and geographic coverage of the interventions among others.
Disease specific epidemiological assessments will be conducted for programmes. However where possible an integrated epidemiological assessment will be used. These activities will contribute to strengthening surveillance, operational research and also help with integrated data management.
Table 25: Activities to enhance NTD monitoring and evaluation, surveillance and operational research
Activity Details (Sub-activity) Timeframe Resources needed
Strategic Objective 1: Enhance monitoring of national NTD programme performance and outcome.
Strengthening NTD Performance
Develop an M&E Strategic plan
Q4, 2013 Facilitators, Participants, Drivers Transport, Venue & refreshment
Development of M&E tools Q4, 2012 Stationery, Transport, Venue & refreshment
Pre-testing of M&E Tools Q1, 2014 Data collectors, Drivers, Transport Stationery
Orientation of staff Q1, 2014 Transport, Venue & refreshment Supervision of NTD
activities Monitoring drugs and logistics supply
2013-2017
Personnel, Drivers, District staff Transport, Vehicle maintenance
Monitoring training of CDDs and health workers
2013-2017
Monitoring treatment processes and adverse events management
2013-2017
Monitoring drug management & inventory
2013-2017
Review Meetings National Half-year Reviews 2013-2017 National & Regional participants Drivers, Transport, Venue & refreshment
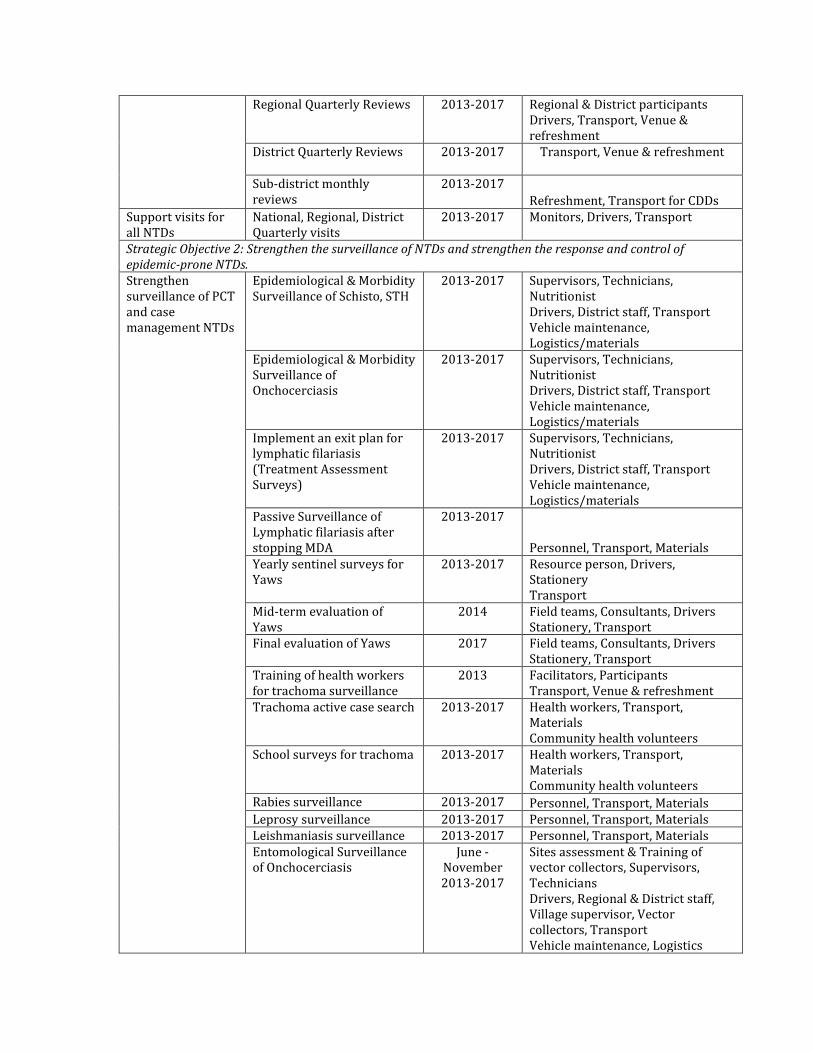
Regional Quarterly Reviews 2013-2017 Regional & District participants Drivers, Transport, Venue & refreshment
District Quarterly Reviews
2013-2017 Transport, Venue & refreshment
Sub-district monthly reviews
2013-2017
Refreshment, Transport for CDDs Support visits for all NTDs
National, Regional, District Quarterly visits
2013-2017 Monitors, Drivers, Transport
Strategic Objective 2: Strengthen the surveillance of NTDs and strengthen the response and control of epidemic-prone NTDs. Strengthen surveillance of PCT and case management NTDs
Epidemiological & Morbidity Surveillance of Schisto, STH
2013-2017 Supervisors, Technicians, Nutritionist Drivers, District staff, Transport Vehicle maintenance, Logistics/materials
Epidemiological & Morbidity Surveillance of Onchocerciasis
2013-2017 Supervisors, Technicians, Nutritionist Drivers, District staff, Transport Vehicle maintenance, Logistics/materials
Implement an exit plan for lymphatic filariasis (Treatment Assessment Surveys)
2013-2017 Supervisors, Technicians, Nutritionist Drivers, District staff, Transport Vehicle maintenance, Logistics/materials
Passive Surveillance of Lymphatic filariasis after stopping MDA
2013-2017
Personnel, Transport, Materials Yearly sentinel surveys for Yaws
2013-2017 Resource person, Drivers, Stationery Transport
Mid-term evaluation of Yaws
2014 Field teams, Consultants, Drivers Stationery, Transport
Final evaluation of Yaws 2017 Field teams, Consultants, Drivers Stationery, Transport
Training of health workers for trachoma surveillance
2013 Facilitators, Participants Transport, Venue & refreshment
Trachoma active case search 2013-2017 Health workers, Transport, Materials Community health volunteers
School surveys for trachoma 2013-2017 Health workers, Transport, Materials Community health volunteers
Rabies surveillance 2013-2017 Personnel, Transport, Materials Leprosy surveillance 2013-2017 Personnel, Transport, Materials Leishmaniasis surveillance 2013-2017 Personnel, Transport, Materials Entomological Surveillance of Onchocerciasis
June - November 2013-2017
Sites assessment & Training of vector collectors, Supervisors, Technicians Drivers, Regional & District staff, Village supervisor, Vector collectors, Transport Vehicle maintenance, Logistics

/materials
Conduct national epidemiological and entomological assessment for BU
2013-2017
Personnel, Transport, Materials Intensify Guinea Worm disease surveillance performance monitoring and report on GWEP
2013-2017
Personnel, Transport, Materials Evaluation and review of GWD at national and sub-national levels
Local independent GWEP evaluation External GWEP evaluation Annual mid-year reviews
Conducting treatment coverage reliability surveys
2013-2017 Training data collectors, Stationery Supervisors, Data collectors Transport, Vehicle maintenance
Strengthen response and control of epidemic-prone NTDs
Increase awareness through health education
2013-2017
Provision of drugs & treatment of cases
2013-2017
Strategic Objective 3: Support operational research, documentation and evidence to guide innovative approaches to NTD programme interventions. Identify and conduct operational research on NTDs for effective programme implementation
Capacity building of staff on operational research
Q4, 2013 Facilitators, Participants Drivers, Venue & refreshment
Development of proposals 2013-2017 Participants, Drivers Venue & refreshment
Conducting operational research
2013-2017 Personnel, Transport Equipment/materials
Dissemination of research findings
2015 - 2016 Facilitators, Participants Venue & refreshment
Strategic Objective 4: Establish integrated data management systems and support impact analysis for NTD as part of the global NTD data management system and Global NTD Plan. Establishment of integrated data management system
Development of data management tools (hard and software)
Q4, 2013 Facilitators, Participants Venue & refreshment, Materials
National & Regional TOT on data management
Q1, 2014 Facilitators, Participants Drivers, Venue & refreshment
District training of staff on data management
Q1, 2014 Facilitators, Participants Venue & refreshment
Data processing (entry, analysis and use)
2013-2017 Personnel, Equipment/materials
3.5.2 PHARMACOVIGILANCE IN NTD CONTROL
There is Pharmacovigilance unit within the Ministry of Health which is located in the Institutional Care Unit of the Ghana Health Service and the Pharmacovigilance Unit of the

Food and Drugs Board. These units work closely with all disease control activities under the Public Health Division and Hospitals at all levels of the Ghana Health Service to ensure the safety and efficacy of all pharmaceutical products used in the programme. All beneficiaries of the programme are to report any serious adverse effect they experience through the established channel. Trainings will be conducted for the health staff on management of serious adverse events. A focal person will be identified on the NTD programme to coordinate and liaise with these pharmacovigilance units.
Pharmacovigilance Units of the Food and Drugs Authority and the Institutional Care Division of the Ghana Health Service undertake pharmacovigilance monitoring in Ghana. Both are based at the national level with forms distributed to all levels of the Ghana Health Service for adverse events monitoring and ensure the safety and efficacy of all pharmaceutical products. Clear channels of communication are available for reporting and recording adverse events experienced during the treatment period. Programme coordinators are available at all levels of the programme to coordinate and liaise with the pharmacovigilance units through the national programme. For effective monitoring, training and effective coordination of these activities will be reinforced.
Table 26: Activities for strengthening pharmaco-vigilance in NTD programme
Strategic Objective 1: Strengthening monitoring of national NTD programme performance and outcome
Activity Details (Sub-activity) Time frame / frequency
Resources needed
Sensitization of health workers on the importance of pharmaco-vigilance
Sensitization workshops for health workers
2013-2017 Personnel, per diem, stationery, transport, communication, venue
Radio talk shows 2013-2017 Funds
Train health workers to use pharmaco- vigilance tools
2013-2017 Personnel, per diem, stationery, transport, communication, venue
Monitoring pharmaco-vigilance activities
Monitoring drug/ insecticide supply and use
2013-2017 Personnel, per diem, stationery, transport, communication, venue
Monitoring adverse events and management following treatment
2013-2017 Personnel, per diem, stationery, transport, communication, venue
Monitoring quality of drugs / insecticides on Ghana market
2013-2017 Personnel, per diem, stationery, transport, communication, venue
3.5.3 Post Intervention Surveillance And Integration Within Primary Health Care (PHC)
Health care delivery in Ghana is based on the Primary Health Care system (PHC). The NTD multi-year plan of action will be implemented within the existing health system. However, not all parts of the country are adequately covered and in almost all the regions there are areas, which are inaccessible at certain times of the year. NGOs, Mission facilities, Private and Development Partners partner with Government in providing access to primary health care. It is noteworthy that they have helped in various health programmes such as Expanded Programme of Immunization (EPI), Guinea Worm Eradication, Onchocerciasis control, elimination of Lymphatic Filariasis, elimination of Trachoma,

Soil Transmitted Helminths and other child survival programmes. These health intervention programmes have been successfully integrated into the PHC in Ghana.
Structures already exist from the national to the community level that will support implementation of the NTD programme. For example, a community strategy, the Community Health Planning Services (CHPS), is a concept developed to bridge the gap of health delivery between accessible and inaccessible areas. It is already in place and is currently being implemented in some parts of the country.
All communities living in NTD endemic areas will be the targets and the frontline health workers will be the primary focal persons. Information will flow from the communities through the primary health care centers to the sub district, district, regional to the national level.
Based on the Primary Health Care approach this strategic framework aims at improving the performance of the health sector through a combination of interventions to be carried out at individual, household and community supported by outreach and health facilities services. It seeks to scale up the coverage of promotive, preventive, treatment and rehabilitative services proven to have significant impact on mortality, morbidity and disability reduction.
Table 27: Activities for surveillance and sustainability
Strategic Objective: Strengthening monitoring of national NTD programme performance and outcome
Activity Details (Sub-activity) Time frame / frequency
Resources needed
Strengthen surveillance during and post interventions of NTDs within PHC
Establishment of sentinel sites 2013 Personnel, allowances, consumables
Meeting to develop surveillance tools 2013 Personnel, per diem, stationery, transport, communication, venue
Identify and train surveillance focal persons
2013-2017 Personnel, per diem, stationery, transport, communication, venue
Post intervention surveillance 2013-2017 Personnel, per diem, transport
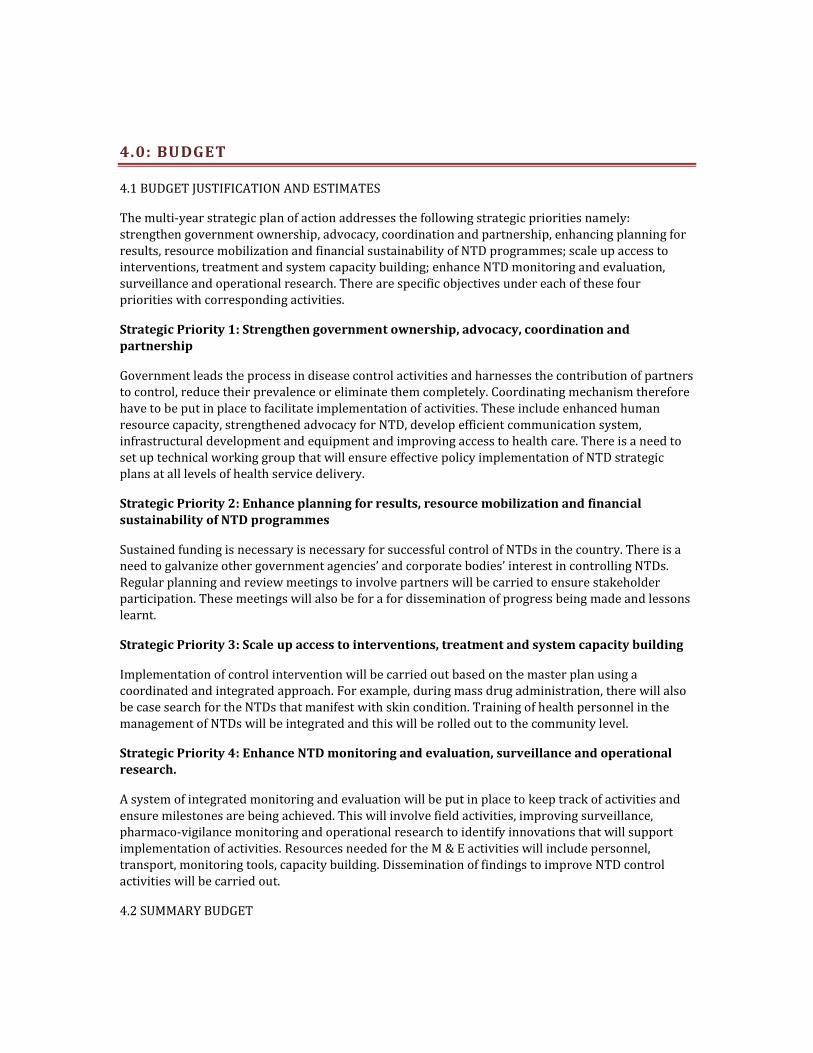
4.0: BUDGET
4.1 BUDGET JUSTIFICATION AND ESTIMATES
The multi-year strategic plan of action addresses the following strategic priorities namely: strengthen government ownership, advocacy, coordination and partnership, enhancing planning for results, resource mobilization and financial sustainability of NTD programmes; scale up access to interventions, treatment and system capacity building; enhance NTD monitoring and evaluation, surveillance and operational research. There are specific objectives under each of these four priorities with corresponding activities.
Strategic Priority 1: Strengthen government ownership, advocacy, coordination and partnership
Government leads the process in disease control activities and harnesses the contribution of partners to control, reduce their prevalence or eliminate them completely. Coordinating mechanism therefore have to be put in place to facilitate implementation of activities. These include enhanced human resource capacity, strengthened advocacy for NTD, develop efficient communication system, infrastructural development and equipment and improving access to health care. There is a need to set up technical working group that will ensure effective policy implementation of NTD strategic plans at all levels of health service delivery.
Strategic Priority 2: Enhance planning for results, resource mobilization and financial sustainability of NTD programmes
Sustained funding is necessary is necessary for successful control of NTDs in the country. There is a need to galvanize other government agencies’ and corporate bodies’ interest in controlling NTDs. Regular planning and review meetings to involve partners will be carried to ensure stakeholder participation. These meetings will also be for a for dissemination of progress being made and lessons learnt.
Strategic Priority 3: Scale up access to interventions, treatment and system capacity building
Implementation of control intervention will be carried out based on the master plan using a coordinated and integrated approach. For example, during mass drug administration, there will also be case search for the NTDs that manifest with skin condition. Training of health personnel in the management of NTDs will be integrated and this will be rolled out to the community level.
Strategic Priority 4: Enhance NTD monitoring and evaluation, surveillance and operational research.
A system of integrated monitoring and evaluation will be put in place to keep track of activities and ensure milestones are being achieved. This will involve field activities, improving surveillance, pharmaco-vigilance monitoring and operational research to identify innovations that will support implementation of activities. Resources needed for the M & E activities will include personnel, transport, monitoring tools, capacity building. Dissemination of findings to improve NTD control activities will be carried out.
4.2 SUMMARY BUDGET


Funding for Operational Cost (expressed as US$)
Strategic Priority
2012 2013 2014 2015 2016 Total 5 years
Total Gap Total Gap Total Gap Total Gap Total Gap Total Gap
1
Coordination,
Partnership & Advocacy
1,045,050
1,045,050
1,817,138
1,817,138
1,612,369
1,612,369
1,739,878
1,739,878
1,715,139
1,715,139
7,929,574
7,929,574
2 Resource Mobilization
201,865
201,865
1,509,702
1,509,702
244,138
244,138
256,495
256,495
268,320
268,320
2,480,521
2,480,521
3
Scale-up interventions
(PC diseases)
3,142,800
3,142,800
3,538,217
3,538,217
3,715,127
3,715,127
3,843,002
3,843,002
4,035,153
4,035,153
18,274,299
18,274,299
Scale-up interventions
(CM diseases)
838,011
838,011
1,121,349
1,121,349
777,654
777,654
802,992
802,992
843,142
843,142
4,383,148
4,383,148
Scale-up interventions
(IVM, sanitation)
79,965
79,965
173,543
173,543
88,161
88,161
92,569
92,569
97,198
97,198
531,437
531,437
4 M & E, Research
118,920
118,920
5,517,969
5,517,969
5,464,819
5,464,819
5,715,160
5,715,160
6,034,182
6,034,182
22,851,051
22,851,051
Sub-total
5,426,611
5,426,611
13,677,917
13,677,917
11,902,270
11,902,270
12,450,098
12,450,098
12,993,134
12,993,134
56,450,030
56,450,030
Capital cost and annual compensation of national personnel
Item
Total 5 years

2,012 2,013 2,014 2,015 2,016
Total Gap Total Gap Total Gap Total Gap Total Gap Total Gap
Capital cost + Annual
compensation
121,760
121,760
453,860
453,860
475,500
475,500
105,400
105,400
100,000
100,000
1,256,520
1,256,520
Drug donation (expressed as number of tablets)
Drug
2,012
2,013
2,014
2,015
2,016 Total 5 years
Total Gap Total Gap Total Gap Total Gap Total Gap Total Gap
Ivermectin (3mg tablets)
41,360,508
41,360,508
42,311,800
42,311,800
43,284,971
43,284,971
44,280,525
44,280,525
45,298,977
45,298,977 216,536,781
216,536,781
DEC (100mg tablets) -
- -
- - - - - - - - -
Praziquantel (600mg
tablets)
10,284,431
10,284,431
10,451,529
10,451,529
9,520,621
9,520,621
16,560,008
16,560,008
9,963,606
9,963,606
56,780,196
56,780,196
Albendazole (400mg tab)
for LF
9,513,067
9,513,067
9,731,867
9,731,867
9,955,700
9,955,700
10,184,681
10,184,681
10,418,929
10,418,929
49,804,244
49,804,244
Albendazole (400mg
tab)/Mebendazole (500mg
tab) for STH
9,162,342
9,162,342
9,373,075
9,373,075
9,588,656
9,588,656
9,809,195
9,809,195
10,034,807
10,034,807
47,968,075
47,968,075

TEO (5mg tubes) -
- -
- - - - - - - - -
Azithromycin POS (30ml
bottles) -
- -
- - - - - - - - -
Azithromycin (250mg
tablets) -
- -
- - - - - - - - -
Total drug cost -
- -
- - - - - - - - -

5.0 REFERENCES
1 Disease Control Annual Report, 2010
1 Disease Control Strategy 1, Ghana- 2010-2015
Two-Year Strategic Plan for Integrated Neglected Tropical Diseases Control in Ghana, 2007-2008
Annual Implementation Report for Ghana Neglected Tropical Diseases Control Programme, 2008
Annual Implementation Report for Ghana Neglected Tropical Diseases Control Programme, 2009
Annual Implementation Report for Ghana Neglected Tropical Diseases Control Programme, 2010
Re-mapping of Onchocerciasis in Ghana (REMO) Report, 2009-2010
Report on Schistosomiasis and Soil Transmitted Helminthiasis Mapping in Ghana, 2008
Mapping LF in Ghana
Buruli Ulcer Disease Annual Reports
Yaws Annual Reports
Leprosy Eradication Programme Annual Reports
Human African Trypanosomiasis Survey Report
Disease Control Department, Ghana Health Service Annual Reports
Public Health Division, Annual Reports
Centre for Health Information Management (CHIM) Annual Reports
Demographic and Health Survey, 2003
Demographic and Health and Survey, 2008
Facts and Figures, The Health Sector in Ghana, 2009
Five Year Strategic Framework for Service Delivery, 2007-2011, Ghana Health Service, 2008
National Health Sector Policy Third 5 Year Programme of Work (PoW) 2007-2011
Ghana Poverty Reductioin Strategy (GPRS 2)
Hayman DTS, Johnson N, Horton DL. Et al. Evolutionary history of Rabies in Ghana. Plos Negl Trop Dis 5(4):e1001.doi:10.1371/journal.pntd.0001001
www.ghanadistricts.com
www.wikepedia.com
www.who.int

6.0: ANNEXES
6.1: ANNEX ONE:
TABLE 4 NTD CO-ENDEMICITY (BACKGROUND INFORMATION)
Administrative Unit
Administrative Unit
Populations (Census, year) Disease Specific Data
No. Region District (170)
Total pop. (Projected from 2000 Census by GSS)
5 ≤ 14 years (27.3% of Total Population)
Disease
LF Oncho SCH STH Trachoma
Buruli Ulcer Yaws HAT Leprosy Leish. Rabies
1 Ashanti Adansi North 151787
41,438 1 1 1 1 0 0 1 0 0 0 0
2 Ashanti Adansi South 147675
40,315 0 1 1 1 0 1 1 0 0 0 0
3 Ashanti Sekyere South 109967
30,021 0 0 1 1 0 0 1 0 0 0 0
4 Ashanti Afigya Kwabre 50939
13,906 0 0 1 1 0 0 1 0 0 0 0
5 Ashanti
Ahafo Ano North 97214
26,539 0 0 1 1 0 1 1 0 0 0 0
6 Ashanti
Ahafo Ano South 180549
49,290 0 0 1 1 0 1 1 0 0 0 0
7 Ashanti Amansie Central 88081
24,046 0 1 1 1 0 1 1 0 0 0 0
8 Ashanti Amansie East 216333
59,059 0 0 1 1 0 1 1 0 1 0 0

9 Ashanti Amansie West 146899
40,103 0 0 1 1 0 1 1 0 0 0 0
10 Ashanti
Asante Akim North 170882
46,651 0 0 1 1 0 1 1 0 0 0 0
11 Ashanti
Asante Akim South 130878
35,730 0 1 1 1 0 1 1 0 1 0 0
12 Ashanti Atwima Mponua 123160
33,623 0 0 1 1 0 0 1 0 0 0 0
13 Ashanti
Atwima Nwabiagya 197873
54,019 0 0 1 1 0 0 1 0 0 0 0
14 Ashanti Bosomtwe 69256
18,907 0 0 1 1 0 0 1 0 0 0 0
15 Ashanti Bosome Freho 55633
15,188 0 1 1 1 0 0 1 0 0 0 0
16 Ashanti
Atwima Kwanwoma 72409
19,768 0 0 1 1 0 0 1 0 0 0 0
17 Ashanti Ejisu Juaben 167773
45,802 0 0 1 1 0 1 1 0 0 0 0
18 Ashanti
Ejura Sekyedumase 109594
29,919 0 0 1 1 0 0 1 1 0 0 0
19 Ashanti
Kumasi Metropolis 1581142
431,652 0 0 1 1 0 0 1 0 0 0 0
20 Ashanti Kwabre 222482 60,738 0 0 1 1 0 1 1 0 0 0 0
21 Ashanti
Obuasi Municipal 197398
53,890 0 0 1 1 0 1 1 0 0 0 0
22 Ashanti Offiinso 107025 29,218 0 1 1 1 0 0 1 0 0 0 0
23 Ashanti Offinso North 80339
21,933 0 1 1 1 0 0 1 0 0 0 0
24 Ashanti Sekyere East 87555
23,903 0 0 1 1 0 1 1 0 0 0 0
25 Ashanti Sekyere West 125101
34,153 0 0 1 1 0 0 1 0 0 0 0
26 Ashanti
Mampong Muncipal 99671
27,210 0 0 1 1 0 0 1 1 0 0 0
27 Ashanti Sekyere Central 93813
25,611 0 0 1 1 0 0 1 1 0 0 0
28 Brong Ahafo
Asunafo North 123282
33,656 0 0 1 1 0 1 1 0 0 0 0
29 Brong Ahafo
Asunafo South 94053
25,676 0 0 1 1 0 1 1 0 0 0 0
30 Brong Ahafo Asutifi 105510
28,804 0 0 1 1 0 1 1 0 0 0 0
31 Brong Ahafo
Atebubu-Amanteng 103215
28,178 0 1 1 1 0 0 1 0 1 0 0
32 Brong Ahafo
Berekum 116438
31,788 0 0 1 1 0 0 1 0 0 0 0
33 Brong Ahafo Dormaa 134811
36,803 0 0 1 1 0 0 1 0 0 0 0
34 Brong Ahafo
Dormaa East 52892
14,440 0 0 1 1 0 0 1 0 0 0 0
35 Brong Ahafo
Jaman North 87062
23,768 0 0 1 1 0 0 1 0 0 0 0
36 Brong Ahafo
Jaman South 98178
26,803 0 0 1 1 0 0 1 0 0 0 0
37 Brong Ahafo
Kintampo North 106845
29,169 0 1 1 1 0 0 1 0 0 0 0
38 Brong Ahafo
Kintampo South 76451
20,871 0 1 1 1 0 0 1 0 0 0 0

39 Brong Ahafo
Nkoranza South 102614
28,014 0 1 1 1 0 1 1 0 0 0 0
40 Brong Ahafo
Nkoranza North 58265
15,906 0 1 1 1 0 1 1 0 0 0 0
41 Brong Ahafo Pru 100762
27,508 0 1 1 1 0 0 1 0 0 0 0
42 Brong Ahafo Sene 102614
28,014 0 0 1 1 0 0 1 0 1 0 0
43 Brong Ahafo
Sunyani Municipal 110884
30,271 1 0 1 1 0 1 1 0 0 0 0
44 Brong Ahafo
Sunyani West 112869
30,813 1 0 1 1 0 1 1 0 0 0 0
45 Brong Ahafo Tain 106140
28,976 0 1 1 1 0 0 1 0 0 0 0
46 Brong Ahafo
Tano North 78573
21,450 0 0 1 1 0 1 1 0 0 0 0
47 Brong Ahafo
Tano South 75542
20,623 0 1 1 1 0 1 1 0 0 0 0
48 Brong Ahafo
Techiman Municipal 218051
59,528 1 0 1 1 0 0 1 0 0 0 0
49 Brong Ahafo
Wenchi East 101971
27,838 0 0 1 1 0 0 1 0 0 0 0
50 Central
Abura-Asebu-Kwamankese 108623
29,654 1 0 1 1 0 0 1 0 0 0 1
51 Central Agona East 77484
21,153 1 0 1 1 0 0 1 0 0 0 1
52 Central Agona West 114165
31,167 1 0 1 1 0 0 1 0 0 0 1
53 Central
Ajumako-Enyan-Essian 110880
30,270 1 0 1 1 0 1 1 0 0 0 1

54 Central
Asikuma-Odoben-Brakwa 107782
29,424 1 0 1 1 0 0 1 0 0 0 1
55 Central Assin North 129454
35,341 1 1 1 1 0 1 1 0 0 0 1
56 Central Assin South 107410
29,323 1 1 1 1 0 1 1 0 0 0 1
57 Central Efutu 53329 14,559 1 0 1 1 0 0 1 0 0 0 1
58 Central Awutu Senya 151603
41,388 1 0 1 1 0 0 1 0 0 0 1
59 Central Cape Coast 142398
38,875 1 0 1 1 0 0 1 0 0 0 1
60 Central Gomoa East 127773
34,882 1 0 1 1 0 1 1 0 0 0 1
61 Central Gomoa West 107084
29,234 1 0 1 1 0 0 1 0 0 0 1
62 Central
Komenda-Edina-Eguafo-Abirem 135563
37,009 1 0 1 1 0 0 1 0 0 0 1
63 Central Mfanstiman 184294
50,312 1 0 1 1 0 0 1 0 0 0 1
64 Central
Twifo-Heman-Lower Denkyira 133049
36,322 1 1 1 1 0 0 1 0 0 0 1
65 Central
Upper Denkyira East 78018
21,299 0 1 1 1 0 1 1 0 1 0 1
66 Central
Upper Denkyira West 52731
14,396 0 1 1 1 0 1 1 0 0 0 1
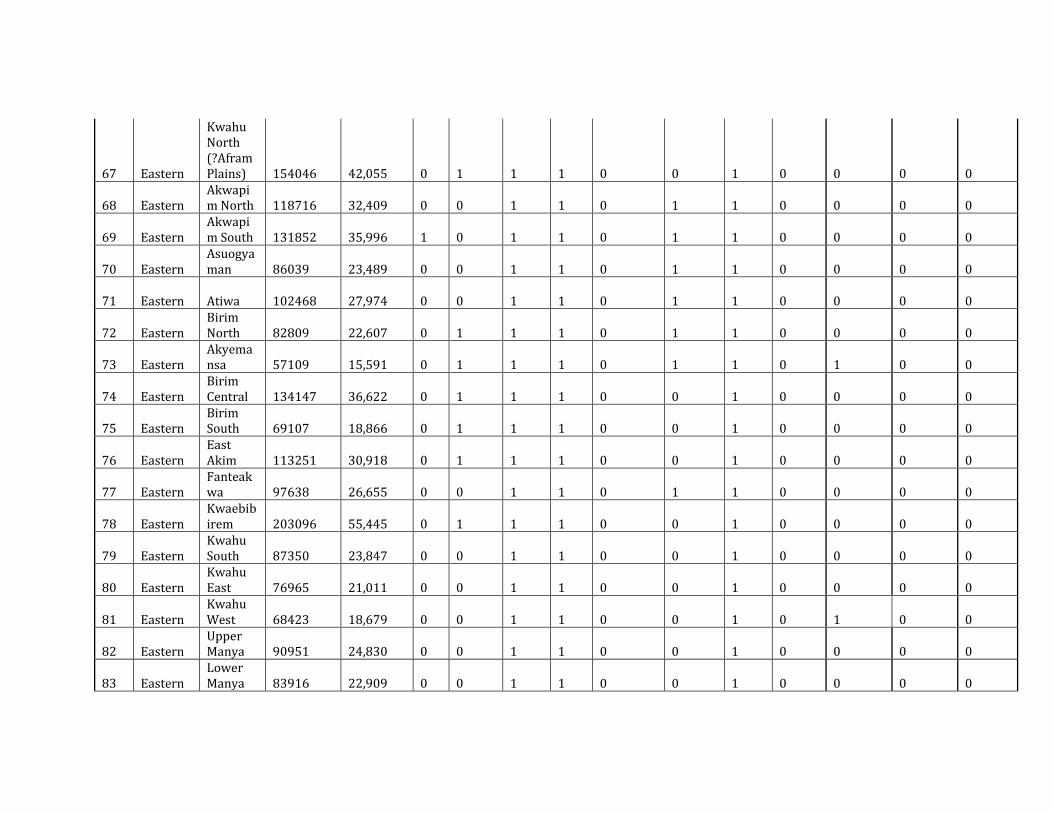
67 Eastern
Kwahu North (?Afram Plains) 154046
42,055 0 1 1 1 0 0 1 0 0 0 0
68 Eastern Akwapim North 118716
32,409 0 0 1 1 0 1 1 0 0 0 0
69 Eastern Akwapim South 131852
35,996 1 0 1 1 0 1 1 0 0 0 0
70 Eastern Asuogyaman 86039
23,489 0 0 1 1 0 1 1 0 0 0 0
71 Eastern Atiwa 102468 27,974 0 0 1 1 0 1 1 0 0 0 0
72 Eastern Birim North 82809
22,607 0 1 1 1 0 1 1 0 0 0 0
73 Eastern Akyemansa 57109
15,591 0 1 1 1 0 1 1 0 1 0 0
74 Eastern Birim Central 134147
36,622 0 1 1 1 0 0 1 0 0 0 0
75 Eastern Birim South 69107
18,866 0 1 1 1 0 0 1 0 0 0 0
76 Eastern East Akim 113251
30,918 0 1 1 1 0 0 1 0 0 0 0
77 Eastern Fanteakwa 97638
26,655 0 0 1 1 0 1 1 0 0 0 0
78 Eastern Kwaebibirem 203096
55,445 0 1 1 1 0 0 1 0 0 0 0
79 Eastern Kwahu South 87350
23,847 0 0 1 1 0 0 1 0 0 0 0
80 Eastern Kwahu East 76965
21,011 0 0 1 1 0 0 1 0 0 0 0
81 Eastern Kwahu West 68423
18,679 0 0 1 1 0 0 1 0 1 0 0
82 Eastern Upper Manya 90951
24,830 0 0 1 1 0 0 1 0 0 0 0
83 Eastern Lower Manya 83916
22,909 0 0 1 1 0 0 1 0 0 0 0

84 Eastern
New Juaben Municipal 154999
42,315 0 1 1 1 0 0 1 0 0 0 0
85 Eastern
Suhum Kraboa Coaltar 188661
51,504 1 0 1 1 0 1 1 0 0 0 0
86 Eastern West Akim 174709
47,696 1 0 1 1 0 1 1 0 0 0 0
87 Eastern Yilo Krobo 97512
26,621 0 0 1 1 0 1 1 0 0 0 0
88 Greater Accra
Accra Metropolis 2107192
575,263 1 0 1 1 0 0 1 0 0 0 0
89 Greater Accra
Ledzokuku krowo 336995
92,000 1 0 1 1 0 0 1 0 0 0 0
90 Greater Accra
Dangbe East 137186
37,452 0 0 1 1 0 0 1 0 0 0 0
91 Greater Accra
Dangbe West 142633
38,939 0 0 1 1 0 0 1 0 0 0 0
92 Greater Accra Ga East 307062
83,828 1 0 1 1 0 1 1 0 0 0 0
93 Greater Accra Ga West 206728
56,437 1 0 1 1 0 1 1 0 0 0 0
94 Greater Accra Ga South 297239
81,146 1 0 1 1 0 1 1 0 0 0 0
95 Greater Accra Tema 403935
110,274 0 0 1 1 0 0 1 0 0 0 0
96 Greater Accra
Ashiaman 201072
54,893 0 0 1 1 0 0 1 0 0 0 0
97 Greater Accra Adenta 141095
38,519 0 0 1 1 0 0 1 0 0 0 0
98 Northern Bole 68469
18,692 1 1 1 1 0 0 1 0 1 0 0

99 Northern
Bunkpurugu Yunyoo 109858
29,991 1 0 1 1 0 0 1 0 0 0 0
100 Northern
Central Gonja 92892
25,360 1 0 1 1 0 0 1 0 0 0 0
101 Northern Kpandai 101716
27,768 1 1 1 1 0 0 1 0 1 0 0
102 Northern
East Gonja 122491
33,440 1 1 1 1 0 0 1 0 0 0 0
103 Northern
East Mamprusi 114343
31,216 1 0 1 1 0 0 1 0 0 0 0
104 Northern
Gushiegu 104532
28,537 1 0 1 1 0 0 1 0 0 0 0
105 Northern Karaga 56287
15,366 1 0 1 1 0 0 1 0 0 0 0
106 Northern
Nanumba North 119572
32,643 1 1 1 1 0 0 1 0 0 0 0
107 Northern
Nanumba South 65414
17,858 1 0 1 1 0 0 1 0 1 0 0
108 Northern Saboba 63952
17,459 1 0 1 1 0 0 1 0 0 0 0
109 Northern
Chereponi 56374
15,390 1 0 1 1 0 0 1 0 0 0 0
110 Northern
Savelugu-Nanton 115352
31,491 1 1 1 1 0 0 1 0 0 0 0
111 Northern
Sawla-Tuna-Kalba 94552
25,813 1 0 1 1 0 0 1 0 1 0 0
112 Northern
Tamale Metropolis 376799
102,866 1 0 1 1 0 0 1 0 0 0 0
113 Northern
Tolon-Kumbungu 170312
46,495 1 0 1 1 0 0 1 0 0 0 0

114 Northern
West Gonja 85747
23,409 1 0 1 1 1 0 1 0 1 0 0
115 Northern
West Mamprusi 147479
40,262 1 0 1 1 0 0 1 0 0 0 0
116 Northern Yendi 167325
45,680 1 0 1 1 0 0 1 0 0 0 0
117 Northern
Zabzugu-Tatale 101547
27,722 1 0 1 1 0 0 1 0 0 0 0
118 Upper East
Bawku Municipal 212555
58,028 1 0 1 1 0 0 1 0 0 0 1
119 Upper East
Bawku West 88946
24,282 1 1 1 1 0 0 1 0 0 0 1
120 Upper East
Bolgatanga Municipal 152658
41,676 1 0 1 1 0 0 1 0 1 0 1
121 Upper East Bongo 85944
23,463 1 0 1 1 0 0 1 0 1 0 1
122 Upper East Builsa 83174
22,707 1 0 1 1 0 0 1 0 1 0 1
123 Upper East
Garu-Tempane 127220
34,731 1 0 1 1 0 0 1 0 0 0 1
124 Upper East
Kassena-Nankana 80258
21,910 1 0 1 1 0 0 1 0 0 0 1
125 Upper East
Kassena-Nankana West 84701
23,123 1 0 1 1 0 0 1 0 0 0 1
126 Upper East
Talensi-Nabdam 99832
27,254 1 0 1 1 0 0 1 0 0 0 1
127 Upper West Jirapa 63550
17,349 1 0 1 1 0 0 1 1 0 0 1
128 Upper West
Lambussie 49148
13,417 1 0 1 1 0 0 1 1 0 0 1
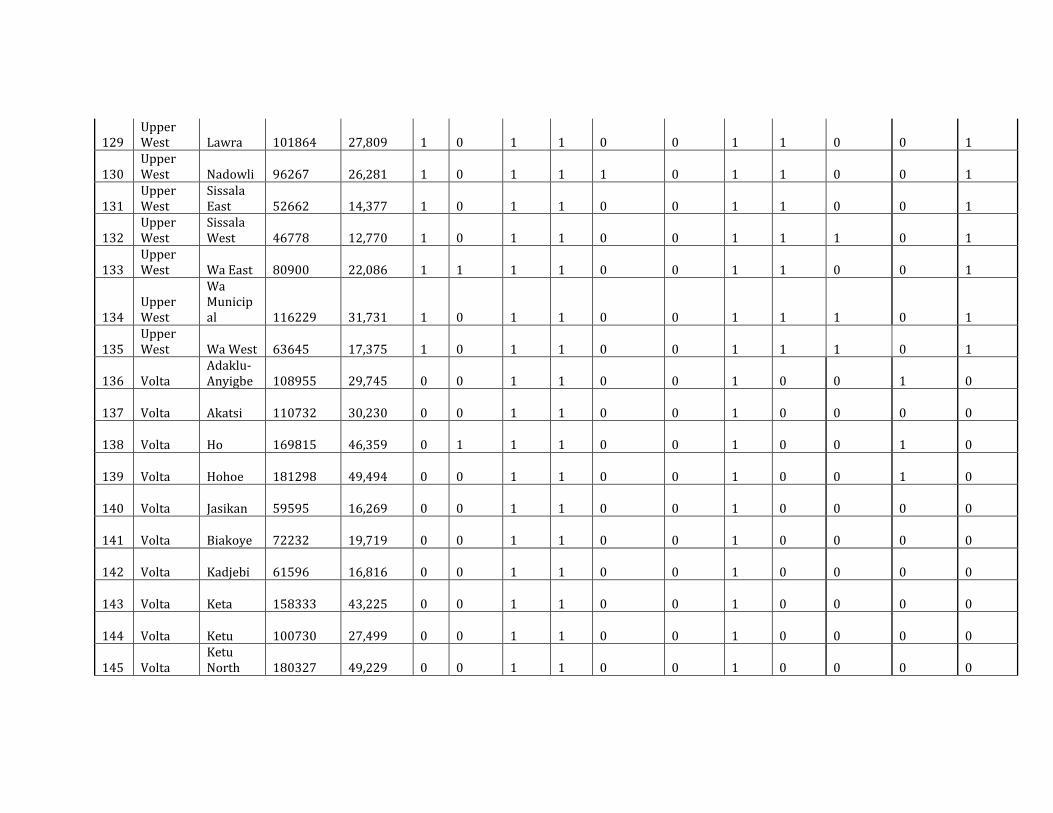
129 Upper West Lawra 101864
27,809 1 0 1 1 0 0 1 1 0 0 1
130 Upper West Nadowli 96267
26,281 1 0 1 1 1 0 1 1 0 0 1
131 Upper West
Sissala East 52662
14,377 1 0 1 1 0 0 1 1 0 0 1
132 Upper West
Sissala West 46778
12,770 1 0 1 1 0 0 1 1 1 0 1
133 Upper West Wa East 80900
22,086 1 1 1 1 0 0 1 1 0 0 1
134 Upper West
Wa Municipal 116229
31,731 1 0 1 1 0 0 1 1 1 0 1
135 Upper West Wa West 63645
17,375 1 0 1 1 0 0 1 1 1 0 1
136 Volta Adaklu-Anyigbe 108955
29,745 0 0 1 1 0 0 1 0 0 1 0
137 Volta Akatsi 110732 30,230 0 0 1 1 0 0 1 0 0 0 0
138 Volta Ho 169815 46,359 0 1 1 1 0 0 1 0 0 1 0
139 Volta Hohoe 181298 49,494 0 0 1 1 0 0 1 0 0 1 0
140 Volta Jasikan 59595 16,269 0 0 1 1 0 0 1 0 0 0 0
141 Volta Biakoye 72232 19,719 0 0 1 1 0 0 1 0 0 0 0
142 Volta Kadjebi 61596 16,816 0 0 1 1 0 0 1 0 0 0 0
143 Volta Keta 158333 43,225 0 0 1 1 0 0 1 0 0 0 0
144 Volta Ketu 100730 27,499 0 0 1 1 0 0 1 0 0 0 0
145 Volta Ketu North 180327
49,229 0 0 1 1 0 0 1 0 0 0 0

146 Volta Kpando 75155 20,517 0 0 1 1 0 0 1 0 0 1 0
147 Volta Krachi East 89506
24,435 0 0 1 1 0 0 1 0 0 0 0
148 Volta Krachi West 99939
27,283 0 1 1 1 0 0 1 0 0 0 0
149 Volta Nkwanta South 91903
25,090 0 1 1 1 0 0 1 0 0 0 0
150 Volta Nkwanta North 87298
23,832 0 1 1 1 0 0 1 0 0 0 0
151 Volta North Tongu 154456
42,166 0 0 1 1 0 0 1 0 0 0 0
152 Volta South Dayi 58657
16,013 0 0 1 1 0 0 1 0 0 1 0
153 Volta South Tongu 76774
20,959 0 0 1 1 0 0 1 0 0 0 0
154 Western Ahanta West 126322
34,486 1 0 1 1 0 1 1 0 0 0 0
155 Western Aowin-Suaman 158179
43,183 1 0 1 1 0 0 1 1 0 0 0
156 Western Bia 146674 40,042 0 1 1 1 0 1 1 1 0 0 0
157 Western
Bibiani-Anhwia-Bekwai 137098
37,428 0 0 1 1 0 0 1 1 0 0 0
158 Western Jomoro 147843 40,361 1 0 1 1 0 0 1 1 0 0 0
159 Western Juabeso 178671 48,777 0 1 1 1 0 1 1 1 0 0 0
160 Western
Mpohor-Wassa East 162776
44,438 1 0 1 1 0 0 1 1 0 0 0
161 Western
Axim Municipal 81572
22,269 1 0 1 1 0 0 1 0 0 0 0

162 Western Ellembele 108127
29,519 1 0 1 1 0 0 1 0 0 0 0
163 Western Sefwi Wiawso 106795
29,155 0 0 1 1 0 1 1 0 0 0 0
164 Western
Sefwi Akontombra 90974
24,836 0 0 1 1 0 0 1 0 0 0 0
165 Western Shama 127442 34,792 1 0 1 1 0 1 1 0 0 0 0
166 Western Sekondi Takoradi 362719
99,022 1 0 1 1 0 0 1 0 0 0 0
167 Western
Wassa-Amenfi East 116999
31,941 0 0 1 1 0 1 1 1 0 0 0
168 Western
Wassa-Amenfi West 194205
53,018 0 0 1 1 0 1 1 1 0 0 0
169 Western Tarwa Nsueam 142125
38,800 1 0 1 1 0 0 1 0 0 0 0
170 Western
Prestea Huni Valley 166842
45,548 1 0 1 1 0 0 1 0 0 0 0
24,238,999
6,617,247 74 41 170 170 0 47 170 20 9 5 35
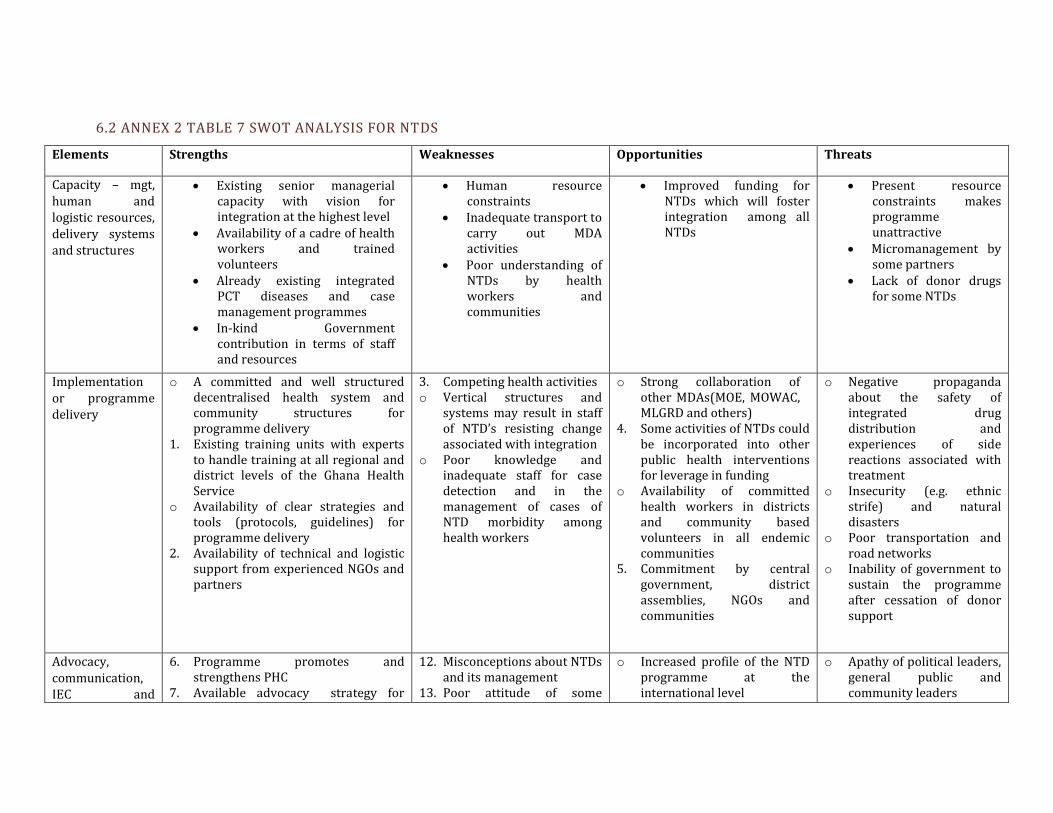
6.2 ANNEX 2 TABLE 7 SWOT ANALYSIS FOR NTDS
Elements Strengths Weaknesses Opportunities Threats
Capacity – mgt, human and logistic resources, delivery systems and structures
Existing senior managerial capacity with vision for integration at the highest level
Availability of a cadre of health workers and trained volunteers
Already existing integrated PCT diseases and case management programmes
In-kind Government contribution in terms of staff and resources
Human resource constraints
Inadequate transport to carry out MDA activities
Poor understanding of NTDs by health workers and communities
Improved funding for NTDs which will foster integration among all NTDs
Present resource constraints makes programme unattractive
Micromanagement by some partners
Lack of donor drugs for some NTDs
Implementation or programme delivery
o A committed and well structured decentralised health system and community structures for programme delivery
1. Existing training units with experts to handle training at all regional and district levels of the Ghana Health Service
o Availability of clear strategies and tools (protocols, guidelines) for programme delivery
2. Availability of technical and logistic support from experienced NGOs and partners
3. Competing health activities o Vertical structures and
systems may result in staff of NTD’s resisting change associated with integration
o Poor knowledge and inadequate staff for case detection and in the management of cases of NTD morbidity among health workers
o Strong collaboration of other MDAs(MOE, MOWAC, MLGRD and others)
4. Some activities of NTDs could be incorporated into other public health interventions for leverage in funding
o Availability of committed health workers in districts and community based volunteers in all endemic communities
5. Commitment by central government, district assemblies, NGOs and communities
o Negative propaganda about the safety of integrated drug distribution and experiences of side reactions associated with treatment
o Insecurity (e.g. ethnic strife) and natural disasters
o Poor transportation and road networks
o Inability of government to sustain the programme after cessation of donor support
Advocacy, communication, IEC and
6. Programme promotes and strengthens PHC
7. Available advocacy strategy for
12. Misconceptions about NTDs and its management
13. Poor attitude of some
o Increased profile of the NTD programme at the international level
o Apathy of political leaders, general public and community leaders

supporting policies
implementation 8. Availability of some mass media and
IEC materials 9. Established clear access channels of
communication for political leaders and clear community entry techniques
10. Complete mapping of all PCT NTDs and some case management conditions
11. Partner support
communities 14. Political bottlenecks and
passive attitude of some district assemblies
15. Improper timing of health promotion and advocacy events
o NTDs not seen as diseases of priority by some health staff
o GPRS II, MDGs, GHP, NEPAD Health Strategy, AU Health Strategy, Ghana Health Sector Strategic Plan back NTD Programme implementation
16. Committed partners (e.g. GHS, GES, central and local government, Drug companies, multilaterals, Support Centres, Communities, NGOs)
o Availability of parliamentary select committee for health and gender and children
o Inadequate funds and resources to implement advocacy strategy
o Challenge of managing complications of NTDs and recurrence of some surgically managed cases
o Operational research issues such as recrudescence of onchocerciasis, high prevalence of LF in certain districts inspite of several years of MDAs, efficacy of available case management treatment
Incentives and motivation
o Availability of effective and well tolerated donated drugs with minimal side effects for preventive chemotherapy and case management
17. Competing health activities and incentives between programmes
o Demand for incentives by community drug distributors
o Increasing number of partners showing interest in supplying drugs and other resources
o More economy and efficiency of human and other resources of NTD’s
18. Committed community members and integration with other disease programmes
o De-motivation of volunteers by other NGO activities
o Micro-management of programme by some partners
o Possibility of government’s inability to sustain the programme after cessation of donor support


Recommended