Mauritius Salt Intake Study 2012 Report Page 1
Mauritius Salt Intake Study 2012
(MSIS 2012)
Chief/Principal/Co-Investigators
Dr K. Pauvaday, Dr A. Deelchand, Mr. D. Gaoneadry, Dr Caussy, Mr. N. Jeeanody,
Dr. (Miss) N. Joonas, Mr. S. Kowlessur
Ministry of Health and Quality of Life, Mauritius
Dr (Mrs.) M. Manraj
University of Mauritius
Dr D. Magliano, Associate Professor J. Shaw, Professor P. Zimmet
Baker IDI Heart & Diabetes Institute, Melbourne, Australia
Professor J. Tuomilehto
National Public Health Institute, Helsinki, Finland
September 2012

Mauritius Salt Intake Study 2012 Report Page 2
TABLE OF CONTENTS
1 Executive Summary 3
2 Introduction 4
3
4
5
6
Methodology
3.1 Study Design ……………………….……………………………………………
3.2 Target Population …………………………………………………………….…
3.3 Sampling Method …………………………………………………………….…
3.4 Response Rate …..………………………………………………………………
3.5 Ethical Clearance …………………………………….………………..……
3.6 Data Collection ……. ………………..…………………………..………………
3.7 Survey Procedures …………………………………….………………..……….
3.7.1 Registration …………………………………….…….……………..……
3.7.2 Blood Pressure Measurements……………………………………….
3.7.3 Blood Sampling …………………………………………………
3.7.4 Anthropometric measurements………………………………………..
3.7.5 Filling of Questionnaires ………………………………………
3.7.6 Urine Collection …………………………………………………………
3.7.7 Data Entry and Analysis ………………………………………………
Findings …………………………………………………...…………..……………
Discussions……………………………………………...…………..……………
References ………………………………………………………………………….
7
7
7
7
7
8
8
8
8
9
9
9
10
10
11
12
15
16
7 Annexes ……………………………………………………………...……………… 19
8 Acknowledgments 25
Mauritius Salt Intake Study 2012 Report Page 3
1. EXECUTIVE SUMMARY
According to the Non-communicable Disease (NCD) Survey 2009,the prevalence of
hypertension was 37.9% in the adult population in Mauritius. Deaths due to circulatory
diseases and diabetes represent 56.5% of total deaths (Health statistics Report 2011). A
high level of salt intake is known to be associated with high blood pressure and a greater
risk of cardiovascular diseases. Knowledge of salt consumption levels and main sources of
salt in the diet in the population are therefore important to inform and develop a country-
specific salt reduction strategy.
Baseline data on salt intake in the Mauritian population has been generated in this cross-
sectional study of 125 individuals through assessment of 24-hour urinary sodium excretion.
The amount of salt intake per day has been obtained by dividing the sodium eliminated
during 24 hours in mmol by a conversion factor of 17.1 (one gramme NaCl being
equivalent to 17.1 mmol of sodium or 393.4 mg of sodium).
This study has revealed that the salt intake in the population is higher than generally
recommended. The overall age-sex standardized mean salt intake was estimated at
7.9 g daily (WHO recommended level of daily salt intake is less than 5.0 gm/day). It was
also found that 83.2% of adults aged 30-59 years consumed 5 or more grams of salt
daily and that salt intake level was higher among men.
Interventions to reduce population-wide salt intake have been shown to be highly cost-
effective to diminish the burden of cardiovascular diseases. Hence, this study provides
much needed baseline data on salt intake in the Mauritian population and this will help to
develop a national strategy for decreasing salt intake in the population.

Mauritius Salt Intake Study 2012 Report Page 4
2. INTRODUCTION
Sodium is an essential nutrient in man; it is the principal cation in extracellular fluid and
plays an important role in water balance as well as in the generation of the membrane
potential of cells. Physiological needs amounts to only 8–10 mmol/d (184–230 mg/d)
(Dahl, 1972). Our ancestors had exposure only to sodium naturally occurring in food and
water (Denton, 1982.). They were on a low salt diet of no more than 20–40 mmol
sodium/day. Therefore humans are exquisitely adapted to the physiological retention and
conservation of the limited salt naturally present in foods. They are not optimally adapted
to the excretion (via the kidneys) of large quantities of sodium, which exceed many times
physiological needs, that has become necessary with the addition of salt to foods late in
human evolution (Denton, 1982).
Many epidemiological studies have demonstrated that high salt intake is associated with an
increased risk of high blood pressure. In the InterSalt Study, the association between
blood pressure and salt intake was studied in 52 communities with a wide range of
salt intake (INTERSALT Cooperative Research Group, 1988). Four communities
studied had a low salt intake (≤ 3 g/day) and the rest had an intake of 6–12 g/day of
salt. The study showed that there was a positive relationship between salt intake and blood
pressure. There was also a positive and highly significant relationship between the increase
in blood pressure with age and salt intake.
Thus most populations appear to have mean sodium intakes well in excess of 100 mmol/d
(2.30 g/d). Sodium intakes in men are greater than those in women, most likely reflecting
the higher food consumption (energy intake) among men. In industrialized countries, it was
found that about 75% of sodium consumed as common salt (sodium chloride) in the diet
came from manufactured foods and foods eaten away from home, 10–12% was naturally
occurring in foods and the remaining 10–15% was from the discretionary use of salt in
home-cooking or at the table (Elliot & Brown, 2007; Mattes & Donnelly, 1991).
A large amount of evidence from epidemiological (Elliot et al, 1996), migration (Poulter et
al, 1990), intervention (Forte et al, 1989; Sacks et al, 2001), genetic (Lifton, 1996) and
animal (Denton et al, 1995; Elliott et al, 2007) studies suggest that salt intake plays an
important role in regulating population blood pressure (BP).It is believed that the
mechanism by which the kidney causes hypertension involves a physiological defect in
sodium excretion (Guyton et al, 1972; MacGregor et al, 1982; Johnson et al, 2005).

Mauritius Salt Intake Study 2012 Report Page 5
Recent studies in animal models (Susic et al, 2010) have demonstrated that salt excess
adversely affects cardiovascular and renal structure and function independently of pressure
elevation, suggesting that the systemic and/or local tissue Renin-Angiotensin-Aldosterone-
System (RAAS) plays an important role in causing the adverse effects of salt excess on
the heart and the kidneys.
Many lines of investigation, including genetic studies, epidemiological studies and
interventional studies, have provided evidence for a causal relationship between salt intake
and cardiovascular disease. Several prospective studies have investigated the association
between dietary sodium and the risk of cardiovascular disease. A significantly positive
association between sodium intake and stroke has been reported in at least two of these
studies; one in overweight adults in the United States of America (He et al., 1999) and the
other in a Japanese cohort (Nagata et al., 2004). In a study of Finnish men and women,
urinary sodium excretion was significantly positively associated with mortality from
cardiovascular disease but not with mortality from stroke (relative risk = 1.3 in men)
(Tuomilehto et al., 2001).
In the WHO World Health Report 2002 (WHO, 2002) it was estimated that globally 62% of
cerebrovascular disease and 49% of ischaemic heart disease were attributable to elevated
blood pressure (systolic ≥ 140 mmHg). Heart diseases were the leading cause of death for
persons over 60 years of age and the second cause of death for persons aged 15–59
years. The report reviewed strategies to reduce the risks associated with CVD and stated
that in all settings population-wide salt reduction strategies were the most cost-
effective.
In 2005, 35 million people died from chronic diseases; this represented 60% of the total
number of deaths (58 million) in that year. Of all deaths from chronic diseases, 30% were
due to cardiovascular disease (CVD). Approximately 8% of chronic disease deaths
occurred in low- and middle-income countries. Additionally, it is known that 80% of heart
disease, stroke, and type 2 diabetes and 40% of cancer can be prevented through
inexpensive and cost-effective interventions (WHO, 2005).
The efficacy of reduced sodium intake in lowering blood pressure is well established. In a
Cochrane systematic review (including 17 trials in individuals with elevated blood pressure
and 11 trials in individuals with normal blood pressure) a modest reduction in salt intake for
a duration of 4 weeks or more was found to have a significant and, from a population
viewpoint, important effect on blood pressure (He & Mac Gregor, 2004).

Mauritius Salt Intake Study 2012 Report Page 6
In Mauritius, in 2011, 56.5% of deaths were due to circulatory diseases and diabetes..
Furthermore the prevalence of hypertension was 37.9% in the adult population in Mauritius
according to the NCD Survey 2009. Given the relationship between the amount of dietary
salt (sodium chloride) consumed and cardiovascular diseases, salt reduction strategies at
national level would be essential to reduce the burden of cardiovascular diseases.
Knowledge of salt consumption levels and the main sources of salt in the diet are important
to inform and develop a population based salt reduction strategy.
The objective of this study was to measure the average salt intake in a representative
sample of the Mauritian population using the single 24-hour urine collection method. Timed
24-hour urinary sodium excretion was used as it is considered the “gold standard” method
to estimate salt intake.
Mauritius Salt Intake Study 2012 Report Page 7
2. METHODOLOGY
3.1 Study Design
The study design consisted of a cross-sectional community-based survey.
3.2 Target Population
The target population was Mauritians aged 30 to 59 years
3.3 Sampling Method
10 clusters representing well-demarcated geographical regions defined by the
Cartography Division of Statistics Mauritius (Ex CSO) were randomly selected in
Mauritius. In each of the 10 randomly selected regions, 30 persons (15 men, 15
women) aged 30 to 59 years were invited. Their names were randomly selected
from the listing of 150 households in each region.
3.4 Response Rate
216 of the 300 invited persons attended the 10 survey sites. The attendance rate
was 72%. An eligibility screening form was used with those who attended the survey
site. A total of 182 persons were found to be eligible. Pregnant women and those on
hypertension and cardiac disease drugs have been excluded. However, only 175 of
the eligible respondents agreed to participate, with a response rate of 96%.

Mauritius Salt Intake Study 2012 Report Page 8
The criteriae for exclusion were:-
All those, who according to their date of birth are aged < 30 years or > 59 years
as at the month during which the survey will be conducted.
Pregnant women
Hypertensive patients on medication
Cardiac patients on medication
Patients undergoing dialysis.
Patients with renal impairment.
3.5 Ethical Clearance
Approval for conducting the survey and for the contents of the questionnaire was
obtained from the Ethics Committee of the Ministry of Health and Quality of Life.
Participation was voluntary, and consent was obtained prior to participation.
Confidentiality and anonymity were assured throughout the survey.
3.6 Data Collection
Data was collected from 17 May to 9 June 2012.
3.7 Survey Procedures
3.7.1 Registration
The names of the participants were registered and a survey serial number was
allocated to each subject.
Mauritius Salt Intake Study 2012 Report Page 9
3.7.2 Blood Pressure Measurements
Blood pressure was measured for all participants. They were requested to be in a seated
position. Calibrated Electronic Blood Pressure Monitor (Omron Blood Pressure Apparatus –
SEM 1) was used to measure blood pressure of participants. Two measurements were
taken and the average was used.
3.7.3 Blood sampling
Blood specimens were collected from participants for fasting blood glucose, urea,
creatinine and lipids by venepunture.
3.7.4 Anthropometric measurements
Anthropometric measurements were taken at the survey site. Height, weight and waist
circumference were measured by trained staff. For all anthropometric measurements
subjects were requested to wear light clothing and no shoes for height and weight
measurements.
Weight - This was measured to the nearest 0.1 kg and scales used were calibrated with a
standard weight each day.
Height - Measurements was done using a Stadiometer to the nearest 0.5 cm. Two
measurements were taken and the average was used. In case of difference by more than
0.5 cm, a third measurement was taken and the average used.
Waist Circumference - Waist circumference was measured around the waist, mid-way
between the last rib bone and the iliac bone, about 2.5 cm above the umbilicus. The
measurement was taken to the nearest 0.5 cm after normal expiration.
Mauritius Salt Intake Study 2012 Report Page 10
3.7.5 Filling of Questionnaires
Questions were asked in a standard manner using the appropriate language (usually
Creole), and answers recorded legibly in pencil.
3.7.6 Urine Collection
For the accurate measurement of sodium on a 24-hour urine sample, it was important that
a complete and accurate collection be made.
Urine collection was carried out by the participants at their residence during 24 hours.
Subjects were instructed by the trained survey team on the method of urine collection. They
were counseled on the importance of collecting a complete sample, and were provided with
a collection jar and other accessories (funnel, beaker, etc.) for the 24-hour period:
equivalent to a capacity of 4–5 litres. Participants were phoned during the 24 hours to
ensure that urine collection was being carried out without any problem.
The procedures for the urine collection were as follows:
Immediately before starting the collection, the participant was asked to
void his or her bladder; the time of start was recorded at this point.
All urine voided from that moment onwards was collected until the
same time the following day.
At about the same time the next day, the participant was asked to
empty his or her bladder completely, and the final urine specimen was
collected. At this point the collection time was recorded.

Mauritius Salt Intake Study 2012 Report Page 11
In order to calculate an individual’s sodium excretion over 24 hours three parameters were
measured:
1. sodium concentration (mmol per litre)
2. total volume of urine collected (ml), and
3. collection time (hours and minutes).
The urine samples collected were placed in cool box and sent to the laboratory within 2
hours of collection.
3.7.7 Data Entry and Analysis
All completed questionnaires were edited, then captured and data was cleaned and
analyzed using SPSS. Laboratory results of the blood tests and urine were merged
separately ensuring that each result corresponded to the respective respondent’s
questionnaire.
Assuming that the sodium eliminated in the urine comes from the diet, the excretion would
correspond to the dietary salt (NaCl) intake. According to the internationally established
protocol and in line with WHO recommendations, the amount of salt intake per day is
estimated by dividing the sodium eliminated per day in mmol by a conversion factor of 17.1
(l g NaCl is equivalent to 17.1 mmol of sodium or 393.4 mg of sodium).

Mauritius Salt Intake Study 2012 Report Page 12
4. FINDINGS
Characteristics of participants and salt intake.
Characteristics
24-hour mean salt
intake (unadjusted
grams)
Standard
Deviation (grams)
Number of
respondents per
category
Sex 125
Male 8.8 3.9 58
Female 7.3 2.5 67
Race/Ethnicity 125
Indian 8.0 3.2 112
Creole 7.5 2.2 9
Other 9.7 5.9 4
Age in years 125
30 – 34 7.8 2.7 27
35 – 39 8.2 3.0 29
40 – 44 9.8 4.0 20
45 – 49 8.2 4.1 20
50 – 54 6.9 2.4 17
55 – 59 6.7 2.3 12
Occupation 125
Housewife 6.8 2.7 33
Manual/skilled worker 8.4 3.4 49
Skilled clerical 9.2 2.9 9
Administrative/Technical 8.0 3.0 8
Professional/ Managerial 8.7 1.4 4
Retired/Illness 6.8 2.3 5
Unemployed 13.2 6.4 3
Self employed 8.6 3.2 14
Characteristics
24-hour mean salt
intake (unadjusted
grams)
Standard
Deviation (grams)
Number of
respondents per
category
Education level 125
Primary 9.0 4.0 41
Secondary 1-3 7.7 2.7 15
Secondary 4-6 7.5 2.9 53
Tertiary 8.3 2.3 7

Mauritius Salt Intake Study 2012 Report Page 13
None 7.3 2.4 9
Income 125
Less than 5000 9.0 2.2 5
5000-10,000 8.0 3.2 40
10001-15000 7.9 3.2 34
15001-20000 6,6 3.3 14
More than 20,000 8.5 2.6 29
Unknown 13.3 10.3 3
Assuming a volume of less than 700 ml of urine sample and a volume of more than 3000
ml to be doubtful, only 125 lab results have been considered as being valid. The mean
volume of urine samples of which the lab test results have been considered for data
analysis is 1650 (± 644 ml).
The mean sodium in the 24-hour urine was found to be 138.5 mmol/L with a Standard
Deviation of 56.4 mmol/L. The median value stood at 135.1 mmol/L. The unadjusted mean
salt found in the urine excretion was found to be 8.1 grams (median 7.9 grams). To obtain
national estimates for the parameters to be studied, the results have been standardized by
age and gender. The age-standardised mean salt in urine was 8.5 g for men and 7.4 for
women. The overall age-sex standardized mean salt in urine was 7.9 grams.
It is therefore estimated that the overall age-sex standardized mean consumption of
salt per day in the Mauritian population was 7.9 grams.
Urine sodium excretion and estimated 24 hour salt consumption
Sodium in 24-hour urine
(mmol/L)
Estimated 24 hr
consumption of salt
(NaCl) (grams)
Mean (unadjusted) (g) 138.5 8.1
Std. Error of Mean 5.1 0.3
Median 135.1 7.9
Std. Deviation 56.4 3.3
Variance 183.0 10.7
Minimum 17.2 1.0
Maximum 350.6 20.5
Mauritius Salt Intake Study 2012 Report Page 14
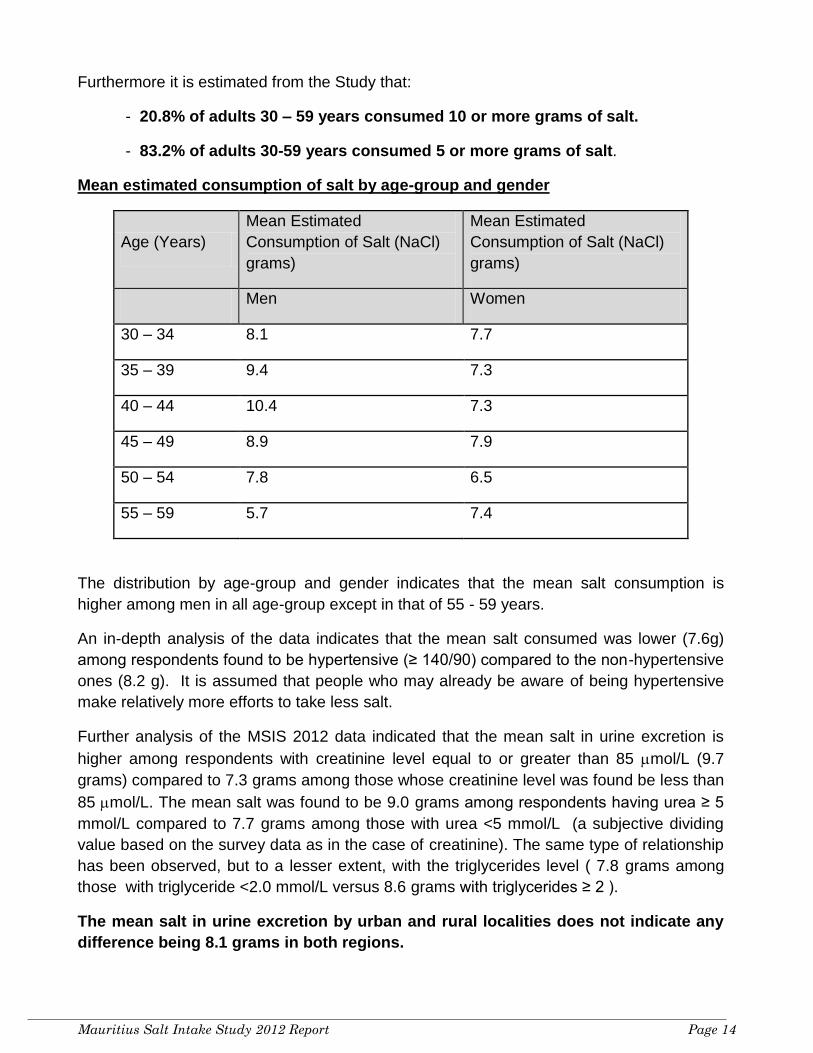
Furthermore it is estimated from the Study that:
- 20.8% of adults 30 – 59 years consumed 10 or more grams of salt.
- 83.2% of adults 30-59 years consumed 5 or more grams of salt.
Mean estimated consumption of salt by age-group and gender
Age (Years)
Mean Estimated
Consumption of Salt (NaCl)
grams)
Mean Estimated
Consumption of Salt (NaCl)
grams)
Men Women
30 – 34 8.1 7.7
35 – 39 9.4 7.3
40 – 44 10.4 7.3
45 – 49 8.9 7.9
50 – 54 7.8 6.5
55 – 59 5.7 7.4
The distribution by age-group and gender indicates that the mean salt consumption is
higher among men in all age-group except in that of 55 - 59 years.
An in-depth analysis of the data indicates that the mean salt consumed was lower (7.6g)
among respondents found to be hypertensive (≥ 140/90) compared to the non-hypertensive
ones (8.2 g). It is assumed that people who may already be aware of being hypertensive
make relatively more efforts to take less salt.
Further analysis of the MSIS 2012 data indicated that the mean salt in urine excretion is
higher among respondents with creatinine level equal to or greater than 85 mol/L (9.7
grams) compared to 7.3 grams among those whose creatinine level was found be less than
85 mol/L. The mean salt was found to be 9.0 grams among respondents having urea ≥ 5
mmol/L compared to 7.7 grams among those with urea <5 mmol/L (a subjective dividing
value based on the survey data as in the case of creatinine). The same type of relationship
has been observed, but to a lesser extent, with the triglycerides level ( 7.8 grams among
those with triglyceride <2.0 mmol/L versus 8.6 grams with triglycerides ≥ 2 ).
The mean salt in urine excretion by urban and rural localities does not indicate any
difference being 8.1 grams in both regions.
Mauritius Salt Intake Study 2012 Report Page 15
7. Discussions
This is the first time that a population Salt Intake Study is being carried out in Mauritius. It
is now clearly established that the age – sex standardized mean population salt intake
which is 7.9 g is above the WHO recommended level of 5 g/day.
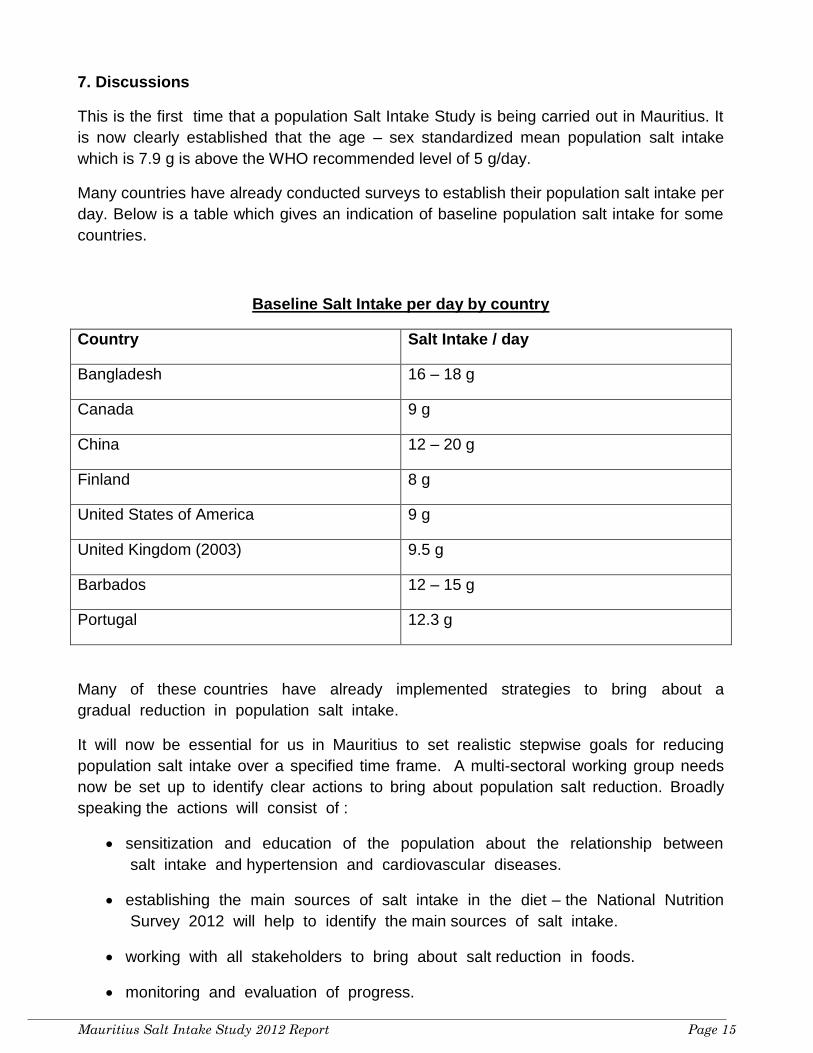
Many countries have already conducted surveys to establish their population salt intake per
day. Below is a table which gives an indication of baseline population salt intake for some
countries.
Baseline Salt Intake per day by country
Country Salt Intake / day
Bangladesh 16 – 18 g
Canada 9 g
China 12 – 20 g
Finland 8 g
United States of America 9 g
United Kingdom (2003) 9.5 g
Barbados 12 – 15 g
Portugal 12.3 g
Many of these countries have already implemented strategies to bring about a
gradual reduction in population salt intake.
It will now be essential for us in Mauritius to set realistic stepwise goals for reducing
population salt intake over a specified time frame. A multi-sectoral working group needs
now be set up to identify clear actions to bring about population salt reduction. Broadly
speaking the actions will consist of :
sensitization and education of the population about the relationship between
salt intake and hypertension and cardiovascular diseases.
establishing the main sources of salt intake in the diet – the National Nutrition
Survey 2012 will help to identify the main sources of salt intake.
working with all stakeholders to bring about salt reduction in foods.
monitoring and evaluation of progress.

Mauritius Salt Intake Study 2012 Report Page 16
REFERENCES
Bates CJ (1991). Biochemical Markers of Nutrient Intake. In: Margetts BM, Nelson M, eds.
Design concepts in nutritional epidemiology. Oxford, Oxford Medical Publications, Pg 192–
265.
Bingham SA (1987). The dietary assessment of individuals; methods, accuracy, new
techniques and recommendations. Nutr Abstr Rev A, 57:706–742.
Brown I.J, Tzoulaki I, Candeias V, Elliott P (2009). Salt intakes around the world:
implications for public health. Int J. Epidemiol 38:791–813.
Dahl LK (1972). Salt and hypertension. Am J Clin Nutr; 25:231–244.
Denton D (1982). The Hunger for Salt: An Anthropological, Physiological and Medical
Analysis. Berlin: Springer.
Denton D, Weisinger R, Mundy NI et al. (1995). The effect of increased salt intake on
blood pressure of chimpanzees. Nature Medicine; 1:1009-16.
Elliot P & Brown I (2007) Sodium intakes around the world. Background document
prepared for the Forum and Technical meeting on Reducing Salt Intake in Populations
(Paris 5-7th October 2006). WHO Press
Elliott P, Walker L.L; Little M.P, et al (2007). Change in Salt Intake Affects Blood Pressure
of Chimpanzees: Implications for Human Populations. Circulation 116: 1563-1568
Elliott P, Stamler J, Nichols R et al. for the Intersalt Cooperative Research Group (1996).
Intersalt revisited: further analyses of 24-hour sodium excretion and blood pressure within
and across populations. BMJ; 312:1249-53.
Elliott P, Stamler R (1988). Manual of operations for "INTERSALT" an international
cooperative study on the relation of sodium and potassium to blood pressure. Control Clin
Trials, (suppl):1S-118S.
Forte JG, Pereira MJ, de Padua F, Rose G (1989). Salt and blood pressure: a community
trial. J Human Hypertens 3:179-84.
Guyton AC, Coleman TG, Cowley AV Jr, et al (1972). Arterial pressure regulation.
Overriding dominance of the kidneys in long-term regulation and in hypertension. Am J
Med.; 52:584 –594.
Health Statistics Report 2010 & 2011; Health Statistical Unit, Ministry of Health & Quality of
Life
Mauritius Salt Intake Study 2012 Report Page 17
He J, Ogden LG, Vupputuri S, Bazzano LA, Loria C, Whelton PK (1999) Dietary sodium
intake and subsequent risk on cardiovascular disease in overweight adults. JAMA 282
(21): 2027-2034
He FJ, & MacGregor GA (2004). Effect of longer-term modest salt reduction on blood
pressure. Cochrane Database Syst. Rev.; 3: CD004937
Hunter D (1998). Biochemical indicators of dietary intake. In: Willett W, ed. Nutritional
Epidemiology. Oxford, Oxford University Press, Pg 174–243.
Intersalt Cooperative Research Group (1988) Intersalt: an international study of electrolyte
excretion and blood pressure. Results for 24 hour urinary sodium and potassium excretion.
BMJ 297(6644):319-28.
Johnson R.J, Rodriguez-Iturbe B, Nakagawa T, et al (2005). Subtle renal injury is likely a
common mechanism for salt-sensitive essential hypertension. Hypertension 45; 326-330
Lifton RP (1996). Molecular genetics of human blood pressure variations. Science;
272:676-80.
MacGregor G (1999). Nutrition and blood pressure. Nutr Metab Cardiovasc Dis; 9: Suppl:
6-15.
MacGregor GA, Markandu ND, Best FE, et al (1982). Double-blind randomized crossover
trial of moderate sodium restriction in essential hypertension. Lancet; 1:351–355.
Mattes RD, Donnelly D (1991). Relative contributions of dietary sodium sources. J Am Coll
Nutr, 10:383–393.
Mauritius Diet and Health Survey, 1992, NCD Office, Ministry of Health & Quality of Life,
Mauritius.
Nagata C, Takatsuka N, Shimizu N, Shimizu H (2004) Sodium intake and risk of death from
stroke in Japanese men and women. Stroke 35 (7): 1543-1547
National Adult Nutrition Survey Report 2011, Irish Universities Nutrition Alliance.
Poulter N, Khaw KT, Hopwood BEC et al (1990). The Kenyan Luo migration
study:observations on the initiation of a rise in blood pressure. BMJ 300: 967-72.
Report of the Mauritius Non Communicable Diseases Survey 2009: Trends in Diabetes and
Cardiovascular Disease Risk in Mauritius.
Report of the National Nutrition Survey 1985. Ministry of Health & Quality of Life, Mauritius.
Report of the National Nutrition Survey 1995. Ministry of Health & Quality of Life, Mauritius.
Report of the National Nutrition Survey 2004. Ministry of Health & Quality of Life, Mauritius.
Sacks FM, Svetkey LP, Vollmer WM, et al. (2001). Effects on blood pressure of reduced
dietary sodium and the Dietary Approaches to Stop Hypertension (DASH) diet. DASH-
Sodium Collaborative Research Group. N Engl J Med.; 344:3–10.
Mauritius Salt Intake Study 2012 Report Page 18
Stamler J et al. for the INTERMAP Research Group (2003). INTERMAP: Background,
aims, design, methods and descriptive statistics (non-dietary). J Hum Hypertens, 17:591–
608.
Susic D., Varagic J, and Frohlich E.D (2010). Cardiovascular effects of inhibition of renin-
angiotensin-aldosterone system components in hypertensive rats given salt excess. Am J
Physiol Heart Circ Physiol 298: H1177–H1181
Tuomilehto J, Jousilahti P, Rastenyte D, et al (2001) Urinary sodium excretion and
cardiovascular mortality in Finland: a prospective study. Lancet: 357;848-51.
World Health Report 2002 & 2003
World Health Report 2005

Mauritius Salt Intake Study 2012 Report Page 19
Annexes
Comments on charts (Exploratory Data Analysis)
Annex I(a) - the distribution of the number of grams of salt in urine follows a more
or less normal curve as it is the case with most biological parameters.
Annex I(b) - the scatter plots indicate that higher salt intake is associated with
higher triglycerides level.
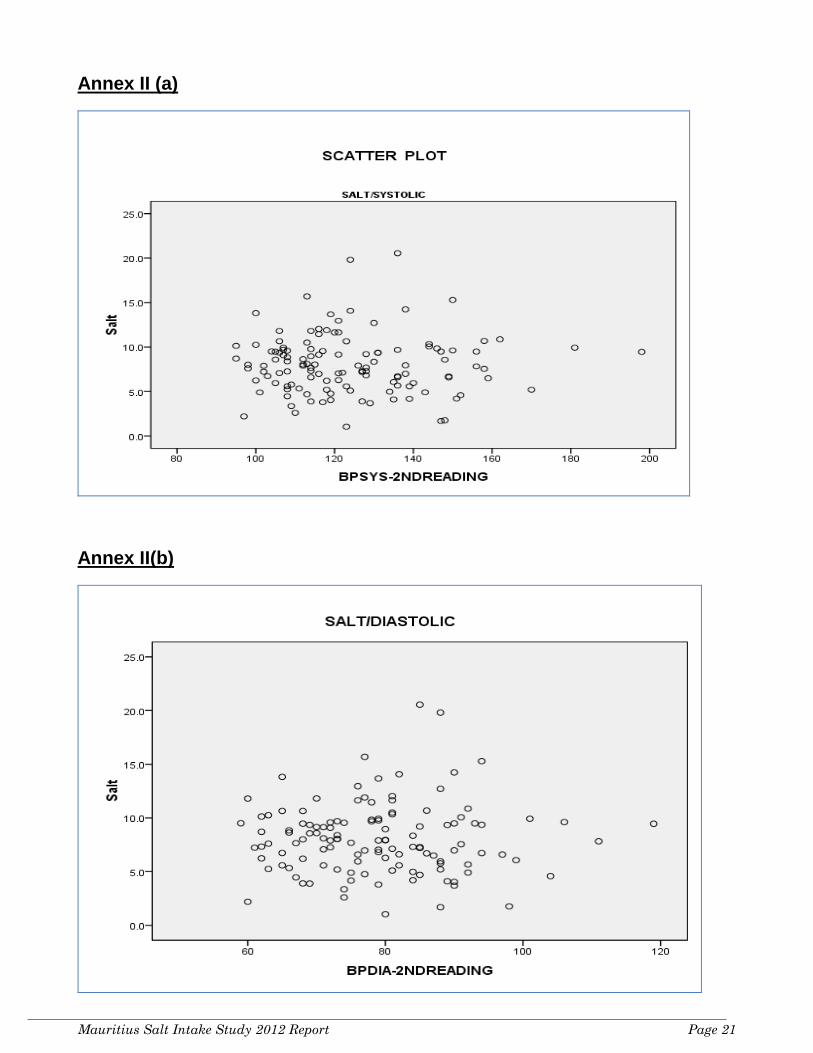
Annex II(a) - the scatter diagram does not indicate any relationship between salt
intake and systolic blood pressure level in this study.
Annex II(b) - the scatter diagram does not indicate any relationship between salt
and diastolic blood pressure level.
Annex III(a) - the diagram indicates that higher levels of creatinine are associated
with higher salt intake.
Annex III(b) - the diagram indicates that higher levels of urea are associated with
higher salt intake.
Annex IV
List of Urine Collection Sites
Annex V
List of Survey Staff

Mauritius Salt Intake Study 2012 Report Page 20
Annex I(a)
Annex I (b)
Mauritius Salt Intake Study 2012 Report Page 21
Annex II (a)
Annex II(b)

Mauritius Salt Intake Study 2012 Report Page 22
Annex III(a)
Annex III (b)

Mauritius Salt Intake Study 2012 Report Page 23
Annex IV - List of Urine Collection Sites
Mauritius Salt Intake Study 2012
SN Urine Collection Site
1 Goodlands SWC
2 Mesnil Govt School
3 Plaine Magnien - France Boyer de la Giroday SSS
4 Belle Mare CC
5 Calebasses Village Hall
6 St Croix Women Centre
7 Quatre Bornes - Marie Marot Minicipal Centre
8 Bassin Rd - Municipal Complex
9 L'Agrement St Pierre Village Hall
10 Gros Cailloux CC

Mauritius Salt Intake Study 2012 Report Page 24
Annex V: List of Survey staff
Chief Investigators Officers for taking blood specimen
Registration Officers Data Entry Officers
Dr K. Pauvaday Mrs J. Ramdewar Mr J. Gaonjur Mrs G.D.Bundhoo Dr A. Deelchand Mrs T. Appalasamy Mrs A. Ramkhelawon Mrs B.T.B Rozbully Principal Investigator
Mr A. Karathee Mrs A. Chellapen Officers for measuring height, weight, waist Hip
Mr N. Jeeanody Mr D. Koolash Mr R. Bookal Ms P. Chekhori General Administrator/ Investigator
Mrs G. Jhoty Mrs Y. Gunness Mr V. Sewnundhun
Mr D. Gaoneadry Mrs Lallmohamed Mrs L. Audit Mrs S. Konayernkunowdu Survey Project Manager / Investigator
Mrs O. Teeluck Mrs R. Rumjaune Survey Officer
Mr S. Kowlessur Mrs P. Sowaruth Mr Kissondoyal Mrs Z. Dedarally Laboratory Coordinator Mrs V. Coopen Survey Site Administrators Survey Transport Officer Dr (Miss) N. Joonas Interviewers Mr V. Sookeera Mr S. Rengasamy Data Manager Mr Toofany Mrs B. Purmessur Attendants / General Worker Mrs V. Mootoosamy Mr N.G.K. Bachoo Mrs M. Jeetunsiv Mr. Dussoye Senior Survey Site Coordinator
Ms S. Sudhoye Mrs J. Jhoomuck Mr P. Jeetun
Mr J. Heecharan Mrs R. Bheecarry Mrs R. Seeruttun Mr Tohul Senior Survey Officer Mrs S. Souky Mrs M. Heecharan Mr S. Emammally Mr Y. Seeruttun Mrs V. Doorgah Mr M. Caremben Laboratory Staff Data Editing Officers Mr I. Neetye Mr Bahadoor Mrs S.Hunma Mr G. Rujjoo Mrs W. Fakun Ms O. Gaonjur Mr D.Ragoo Mr A.C. Musthun Mrs R. Punchcoory Mr N. Koonjoobeeharry Mr K Futloo Officers for taking blood pressure
Mrs Hossenbaccus Mrs L. Mohit Mr M Chuttoo
Mr V. Seethiah Mrs Gowreesunkur Mr M. Rumooa Mr A Bonarien
Mrs N. Ramneehorah Mrs Ragavoodoo Mr P. Gaoneadry Mr Brojolall
Mrs M. Dookee Mrs V. Bhoonderowa Mrs S. Sobrun Mr S Gokool Mr V. Bangalee Mr Jowaheer Mrs S. Bissoon Mr R Simhadri Mrs Z. Choychoo Mrs Lauthan Mrs N. Purusram Mr D Dubarry Mrs N. Seetal Mrs Goolaub Mrs M. Bholah Mr S Padaruth Mr V. Goolam Mrs R. Narayadu Mr Breezmohun Mr J M Ramsamy Mr A. Summun Mr M. Hossensaib Mr. A. Jeetoo Mrs D Seetaram
Mrs H. Putty Mrs B. Baurhoo Attendants (HQ, MOH &QL)
Mr N Jokhoo
Mrs Z. Juhoor Mrs S. Dulloye Mr M. Murugasapillai Ms PolaGooria Mrs Dhurowa

Mauritius Salt Intake Study 2012 Report Page 25
Acknowledgments
This Mauritius Salt Intake Study 2012 could not have been undertaken without the
involvement of a large number of individuals who each made unique and often
unrecognized contributions to its realization.
The initiative of the Honourable L. Bundhoo, Minister of Health and Quality of Life for his
tremendous interest, support and commitment is highly commendable and appreciated.
We would like to thank Baker IDI Heart and Diabetes Institute, Australia and National Public
Health Institute, Finland for their invaluable support and collaboration throughout the
project.
We also thank Mrs. J. Veerapen, Senior Chief Executive; Mr. O. Juddoo, Permanent
Secretary; and Dr N. Gopee, Director General Health Services for their continuous
encouragement, guidance, support and collaboration.
We extend our sincere thanks and gratitude to all who assisted with the implementation
and execution of the Survey. This includes the Ministry of Health Officials, namely:
Regional Health Directors, Regional Health Services Administrators, Regional Nursing
Administrators, Mrs. Joganah, Chief Nutritionist, Dr. Manraj, Consultant Pathology
Services, Mr. Jeewooth, Manager Financial Operations, Mrs. Jankee, Chief Pharmacist;
Mr. Gowreesungker, Head Transport and Maintenance & Workshop Services, Mr.
Shewraj, Director Nursing, Mr. Padaruth, Manager Procurement & Supply, Mr. P. Ghallu,
Senior Procurement & Supply Officer, Mr S. Bahadoor, Dispenser, Mr. Rengasamy,
Transport Supervisor; Nursing and Para Medical Staff, staff of the Laboratory Department
and Drivers who worked on the project; those responsible for motivating participants, all
those staff who worked for the Survey and many others not mentioned herej.
Our special thanks go to Mr. J. Heecharan, and Mr. Y. Seeruttun and other staff of the NCD
and Health Promotion Unit for the pivotal role in the organization and coordination of the
project activities and we warmly welcome their continued dedication and spirit of team
work.
We would also like to thank the officials of the Ministry of Social Security, National
Solidarity & Reform Institutions; Ministry of Education & Human Resources; Ministry of
Gender Equality, Child Development and Family Welfare; Ministry of Youth and Sports; and
staff of the Statistics Mauritius (Ex-CSO) for making the project a success.
Our special gratitude and thanks to all the participants and their relatives who were
instrumental in providing valuable information without which the project would not have
been possible.
Recommended