Frankfurt (Germany), 6-9 June 2011
MEDEIROS JR – FEDERAL UNIVERSITY OF RIO GRANDE DO NORTE
BRAZIL
MAXIMISING PENETRATION OF ACTIVE
POWER BY DISTRIBUTED GENERATION ON
A REAL SYSTEM

Frankfurt (Germany), 6-9 June 2011
Introduction
Maximizing Distributed Generation – solving a conflict by
means of an optimization problem
Adopted solution
Problem Formulation, Particle Swarm Optimization
Simulations
Network Characteristics, Results
Conclusions
Medeiros JR – Brazil - Session 5 – Paper 0093
Contents

Frankfurt (Germany), 6-9 June 2011
Energy security and environmental: renewable sources (RS)
Brazil Electricity: hydraulic - others RS – auctions of biomass
and wind energy
Self-energy producers, from sugar cane bagasse.
Distributed Generation (DG): Technical and economic impacts
in distribution networks (DN)
Multiple accesses – individual contributions
Particle Swarm Optimization (PSO)
Medeiros JR – Brazil - Session 5 – Paper 0093
Introduction

Frankfurt (Germany), 6-9 June 2011
Active power injections – unity power factor at the Point of Common
Coupling
No additional onus to Distribution Company: global losses with DG
limited (base case)
From the Utility’s point of view, unit production costs of the different
producers are not relevant.
Optimum: highest total active power delivered by the set of auto-
producers, without violating operational limits of the distribution
network.
Medeiros JR – Brazil - Session 5 – Paper 0093
The Optimization Problem

Frankfurt (Germany), 6-9 June 2011
Medeiros JR – Brazil - Session 5 – Paper 0093
Problem Formulation
Partial objective functions
DG:
Losses:
Voltage:
𝑓𝑙𝑜𝑠𝑠𝑒𝑠 = 𝐿𝑜𝑠𝑠𝑒𝑠− 𝐿𝑜𝑠𝑠𝑒𝑠𝐶𝐵 2
𝐿𝑜𝑠𝑠𝑒𝑠𝐶𝐵 (2)
𝑓𝑉 = (𝑉𝑖
𝑛
𝑖=1
−𝑉𝑟𝑒𝑓 )2/𝑉𝑟𝑒𝑓 3
n: Number of buses;
Pgi: Generated active power at
the bus i;
Pnom, gi: Rated active power of
DG at bus I;
Losses – Losses calculated at
each iteration of the whole
algorithm;
LossesBC – Losses of the base
case;
Vi – Voltages of the bus i
calculated at each iteration of the
algorithm;
Vref – Reference voltage (equals
the average of limit values).
𝑓𝑑𝑔 = (1
𝑛
𝑖=1
−𝑃𝑔𝑖 /𝑃𝑛𝑜𝑚 , 𝑔𝑖) 1

Frankfurt (Germany), 6-9 June 2011
Medeiros JR – Brazil - Session 5 – Paper 0093
Problem Formulation

Frankfurt (Germany), 6-9 June 2011
Medeiros JR – Brazil - Session 5 – Paper 0093
Problem Formulation
fpenalty:
Were:- Losses: losses, for each particle at each iteration;- LossesCB: losses of base case;-V : voltage calculated from node i for each particle at each iteration;-Vmax and Vmin: maximal and minimal acceptable voltages for node i;-I: current calculated from branch j for each particle at each iteration;- b: number of branches;- Imax: thermal limit for branch j.

Frankfurt (Germany), 6-9 June 2011
Proposed
Algorithm
Medeiros JR – Brazil - Session 5 – Paper 0093
Frankfurt (Germany), 6-9 June 2011
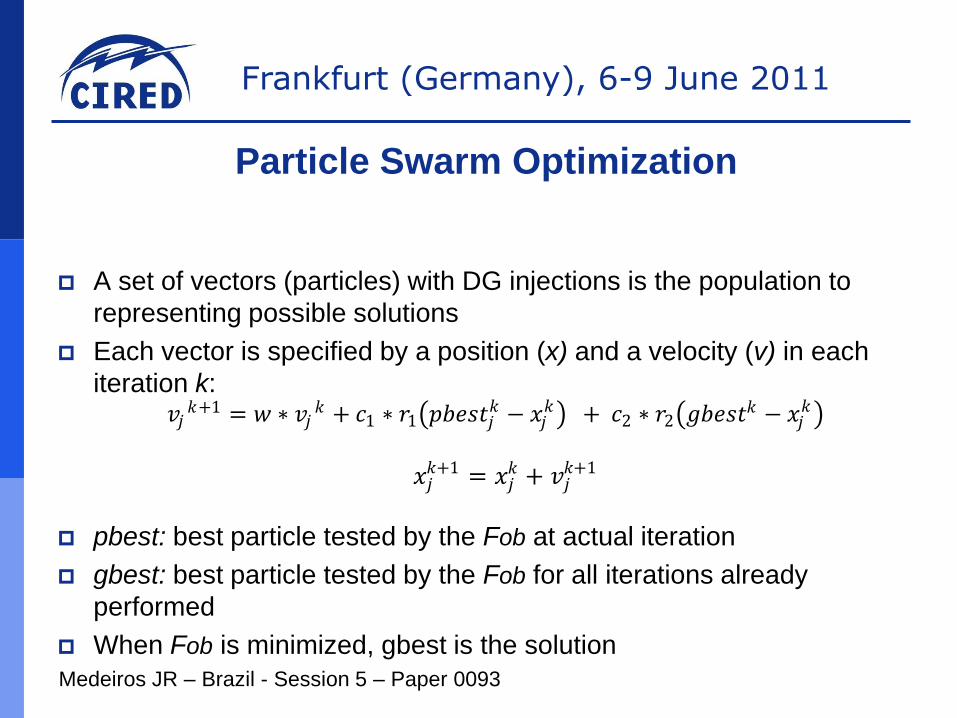
A set of vectors (particles) with DG injections is the population to
representing possible solutions
Each vector is specified by a position (x) and a velocity (v) in each
iteration k:
pbest: best particle tested by the Fob at actual iteration
gbest: best particle tested by the Fob for all iterations already
performed
When Fob is minimized, gbest is the solution
Medeiros JR – Brazil - Session 5 – Paper 0093
Particle Swarm Optimization
𝑣𝑗𝑘+1 = 𝑤 ∗ 𝑣𝑗
𝑘 + 𝑐1 ∗ 𝑟1 𝑝𝑏𝑒𝑠𝑡𝑗𝑘 − 𝑥𝑗
𝑘 + 𝑐2 ∗ 𝑟2 𝑔𝑏𝑒𝑠𝑡𝑘 − 𝑥𝑗
𝑘
𝑥𝑗𝑘+1 = 𝑥𝑗
𝑘 + 𝑣𝑗𝑘+1

Frankfurt (Germany), 6-9 June 2011
HV distribution system 69 kV – R. G. do Norte, Brazil.
Results of Simulation
Network A: 25 nodes, 42 branches, weakly meshed, total supply of 457 MW.

Frankfurt (Germany), 6-9 June 2011
Results of Simulation
Network B: IEEE 14 bus test system

Frankfurt (Germany), 6-9 June 2011
Table 1: Maximal penetration of DG for Network ADG7-70 MW and DG56-105 MW (rated)
Simulations 1 2 3 med
iterations 7 9 8 8
Percentage of DG (DG/DG rated)
DG7
66,5
%
68,1
%
67,9
%
67,5
%
DG56
100,0
%
99,6
%
100,0
%
99,9
%
Relative losses
to base case
97,8
%
99,8
%
99,7
%
99,1
%
Table 2: Maximal penetration of DGNetwork ADG7-70MW and DG18-105MW (rated)
Simulations 1 2 3 med
iterations 9 8 9 9
Percentage of DG (DG/DG rated)
DG7
58,5
%
61,3
%
61,4
%
60,4
%
DG18
58,4
%
58,7
%
58,7
%
58,6
%
Relative losses
to base case
97,1
%
99,1
%
99,9
%
98,7
%
Results of Simulation

Frankfurt (Germany), 6-9 June 2011
Simulations 1 2 3 med
iterations 4 5 5 5
Percentage of DG (DG/DG rated)
DG3
82,1
%
80,0
%
85,5
%
82,6
%
DG4
57,9
%
54,2
%
51,8
%
54,6
%
Relative losses to
base case
71,6
%
72,6
%
72,2
%
72,1
%
Table 3: Maximal penetration of GDNetwork BDG3-20MW and DG4-30MW (rated)
Results of Simulation

Frankfurt (Germany), 6-9 June 2011
This study provides a methodology to specify the maximal
absorption capacity of generators in previously defined nodes of a
system. It can be used in studies of planning of the operation and
expansion of the grid, as well as a reference to other studies.
Metaheuristic algorithms may produce different results at each
simulation. However, the methodology embedded in the PSO
proposal presents small errors between the various simulation’s
repetitions.
Medeiros JR – Brazil - Session 5 – Paper 0093
Conclusions

Frankfurt (Germany), 6-9 June 2011
Thank you for attention
Recommended