Measuring Student Proficiency in Grades 3-8
English Language Arts and Mathematics
July 29, 2016
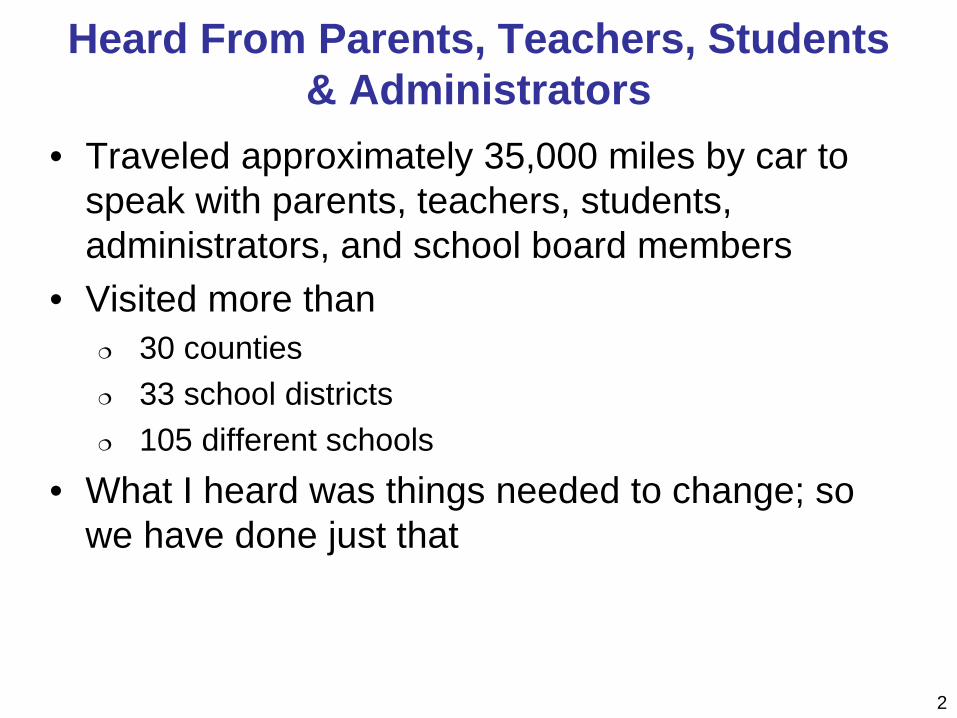
Heard From Parents, Teachers, Students & Administrators
• Traveled approximately 35,000 miles by car to speak with parents, teachers, students, administrators, and school board members
• Visited more than 30 counties 33 school districts 105 different schools
• What I heard was things needed to change; so we have done just that
2
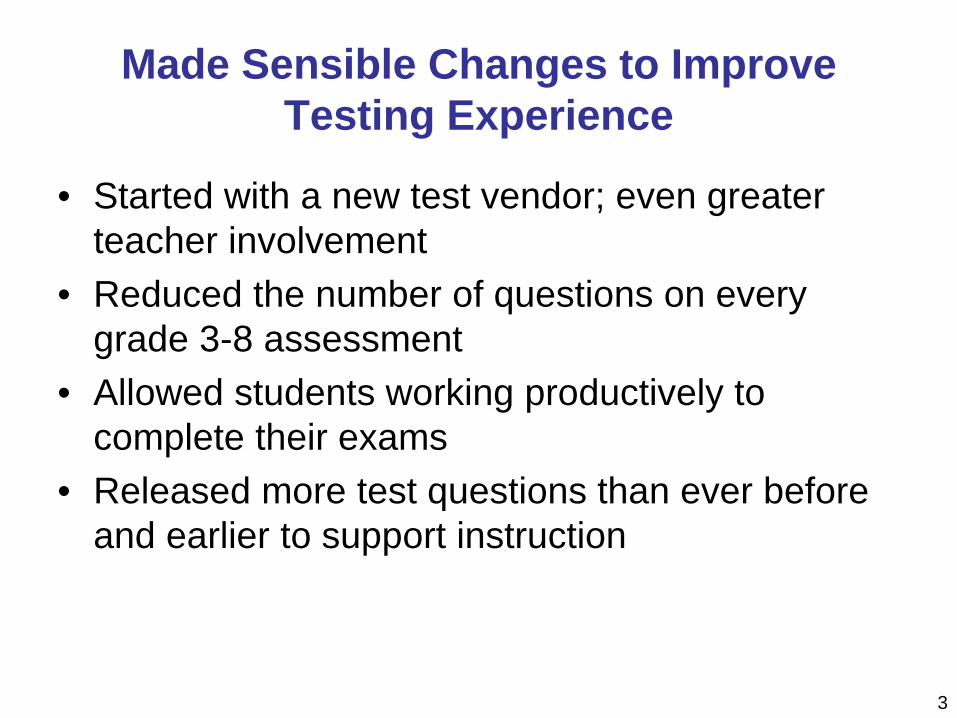
Made Sensible Changes to Improve Testing Experience
• Started with a new test vendor; even greater teacher involvement
• Reduced the number of questions on every grade 3-8 assessment
• Allowed students working productively to complete their exams
• Released more test questions than ever before and earlier to support instruction
3
Changes Made As a Result of a Deliberate Process
• Started multi-year process with the Board of Regents report in June 2015
• Listened to feedback from parents, teachers, administrators and students
• Made recommendations as part of Governor’s Task Force
• Presented changes to the Board of Regents in December 2015
• Implemented the changes in time for the spring 2016 exams 4
2016 Test Different Than Previous Years
• The content of the 2016 Tests and 2015 Tests is comparable.
• The items used on the 2016 Tests and 2015 Tests is similarly rigorous
• However, because of the changes made to the 2016 exam and testing environment, the 2016 tests scores are not an “apples-to-apples” comparison with previous years
5
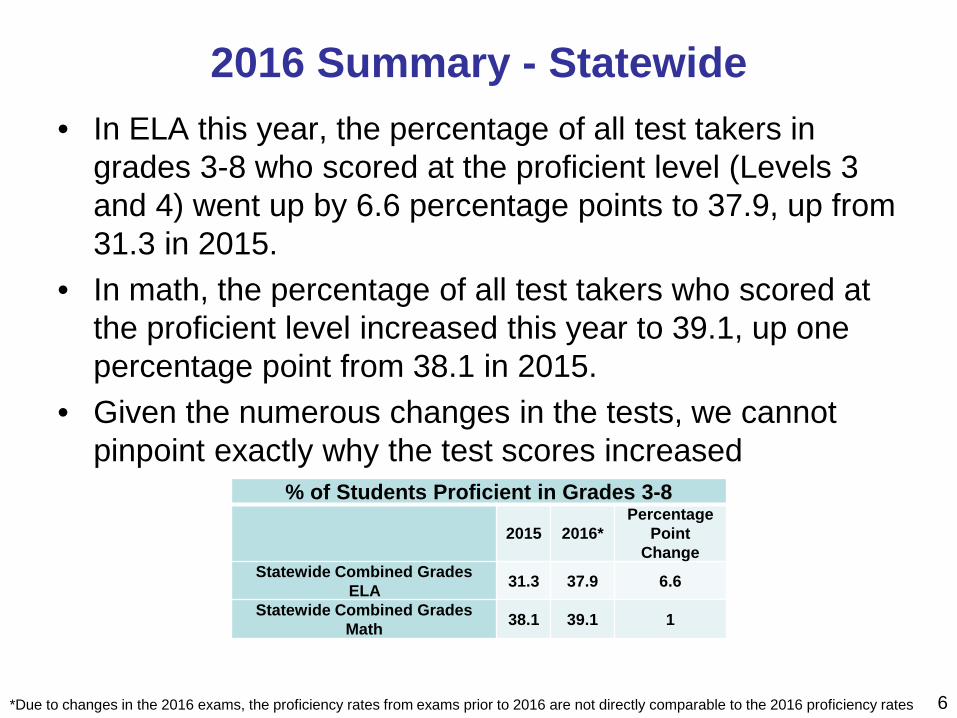
2016 Summary - Statewide • In ELA this year, the percentage of all test takers in
grades 3-8 who scored at the proficient level (Levels 3 and 4) went up by 6.6 percentage points to 37.9, up from 31.3 in 2015.
• In math, the percentage of all test takers who scored at the proficient level increased this year to 39.1, up one percentage point from 38.1 in 2015.
• Given the numerous changes in the tests, we cannot pinpoint exactly why the test scores increased
6
% of Students Proficient in Grades 3-8
2015 2016* Percentage
Point Change
Statewide Combined Grades ELA 31.3 37.9 6.6
Statewide Combined Grades Math 38.1 39.1 1
*Due to changes in the 2016 exams, the proficiency rates from exams prior to 2016 are not directly comparable to the 2016 proficiency rates
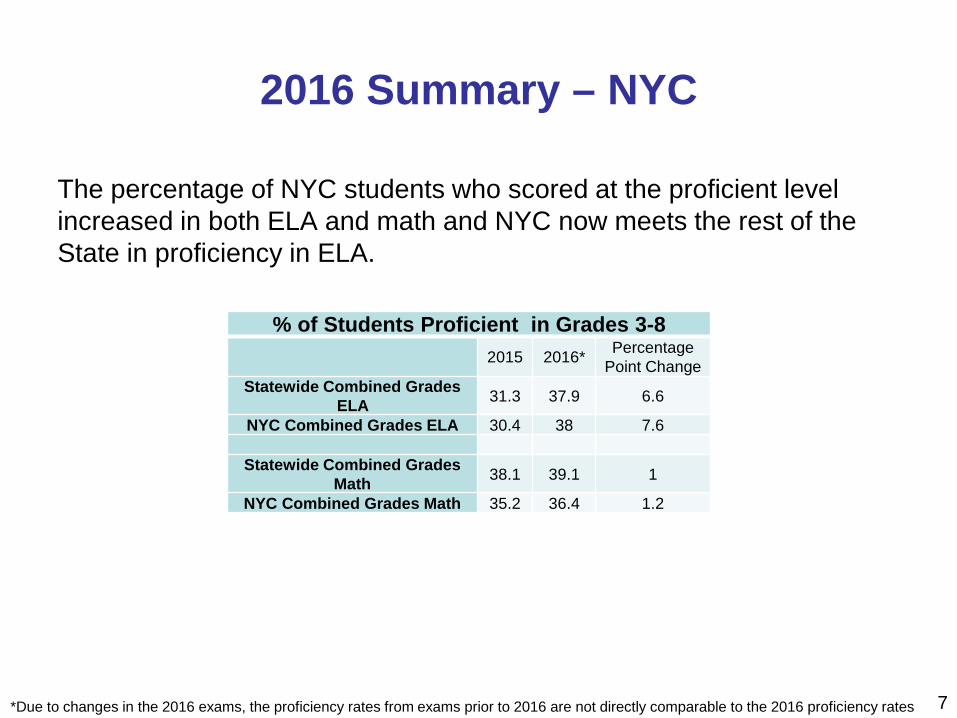
2016 Summary – NYC
The percentage of NYC students who scored at the proficient level increased in both ELA and math and NYC now meets the rest of the State in proficiency in ELA.
7
% of Students Proficient in Grades 3-8 2015 2016* Percentage
Point Change Statewide Combined Grades
ELA 31.3 37.9 6.6
NYC Combined Grades ELA 30.4 38 7.6
Statewide Combined Grades Math 38.1 39.1 1
NYC Combined Grades Math 35.2 36.4 1.2
*Due to changes in the 2016 exams, the proficiency rates from exams prior to 2016 are not directly comparable to the 2016 proficiency rates
2016 Summary – Big 5 School Districts
8
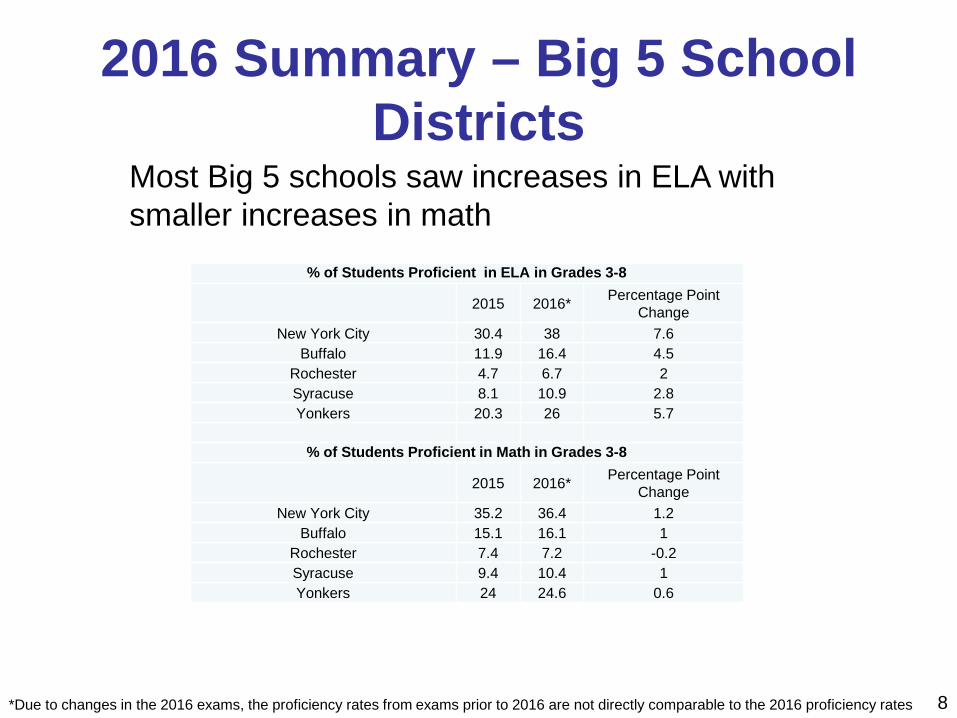
Most Big 5 schools saw increases in ELA with smaller increases in math
% of Students Proficient in ELA in Grades 3-8
2015 2016* Percentage Point Change
New York City 30.4 38 7.6 Buffalo 11.9 16.4 4.5
Rochester 4.7 6.7 2 Syracuse 8.1 10.9 2.8 Yonkers 20.3 26 5.7
% of Students Proficient in Math in Grades 3-8
2015 2016* Percentage Point Change
New York City 35.2 36.4 1.2 Buffalo 15.1 16.1 1
Rochester 7.4 7.2 -0.2 Syracuse 9.4 10.4 1 Yonkers 24 24.6 0.6
*Due to changes in the 2016 exams, the proficiency rates from exams prior to 2016 are not directly comparable to the 2016 proficiency rates
*Due to changes in the 2016 exams, the proficiency rates from exams prior to 2016 are not directly comparable to the 2016 proficiency rates
2016 Summary – Proficiency by Race/Ethnicity
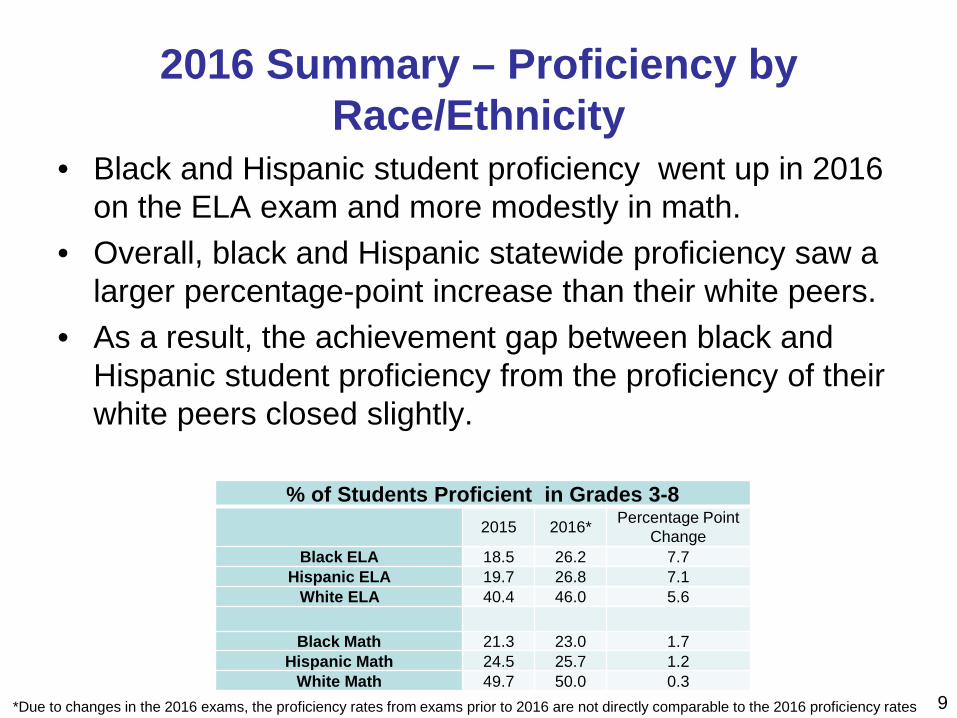
• Black and Hispanic student proficiency went up in 2016 on the ELA exam and more modestly in math.
• Overall, black and Hispanic statewide proficiency saw a larger percentage-point increase than their white peers.
• As a result, the achievement gap between black and Hispanic student proficiency from the proficiency of their white peers closed slightly.
9
% of Students Proficient in Grades 3-8
2015 2016* Percentage Point Change
Black ELA 18.5 26.2 7.7 Hispanic ELA 19.7 26.8 7.1
White ELA 40.4 46.0 5.6
Black Math 21.3 23.0 1.7 Hispanic Math 24.5 25.7 1.2
White Math 49.7 50.0 0.3
2016 Summary – Charter Schools
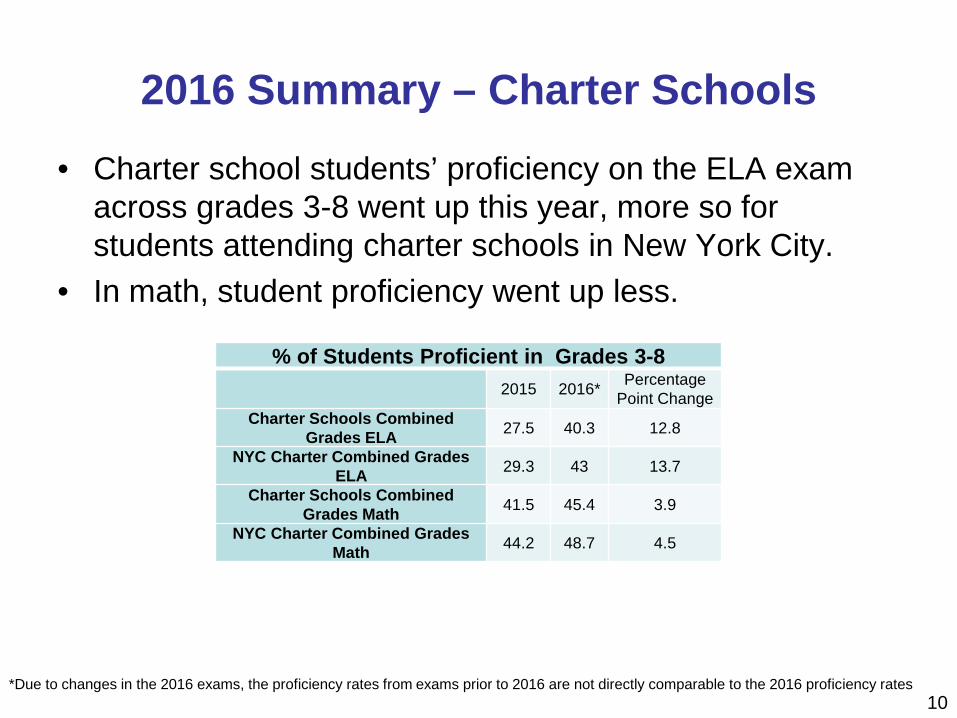
• Charter school students’ proficiency on the ELA exam across grades 3-8 went up this year, more so for students attending charter schools in New York City.
• In math, student proficiency went up less.
10
% of Students Proficient in Grades 3-8 2015 2016* Percentage
Point Change Charter Schools Combined
Grades ELA 27.5 40.3 12.8
NYC Charter Combined Grades ELA 29.3 43 13.7
Charter Schools Combined Grades Math 41.5 45.4 3.9
NYC Charter Combined Grades Math 44.2 48.7 4.5
*Due to changes in the 2016 exams, the proficiency rates from exams prior to 2016 are not directly comparable to the 2016 proficiency rates
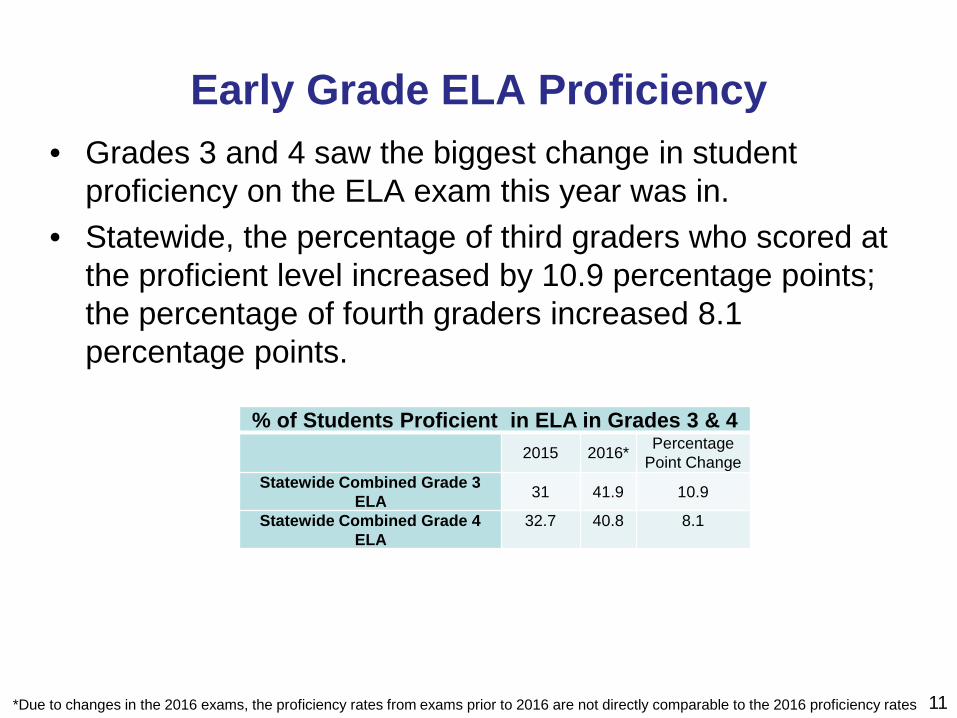
Early Grade ELA Proficiency • Grades 3 and 4 saw the biggest change in student
proficiency on the ELA exam this year was in. • Statewide, the percentage of third graders who scored at
the proficient level increased by 10.9 percentage points; the percentage of fourth graders increased 8.1 percentage points.
11
% of Students Proficient in ELA in Grades 3 & 4 2015 2016* Percentage
Point Change Statewide Combined Grade 3
ELA 31 41.9 10.9
Statewide Combined Grade 4 ELA
32.7 40.8 8.1
*Due to changes in the 2016 exams, the proficiency rates from exams prior to 2016 are not directly comparable to the 2016 proficiency rates
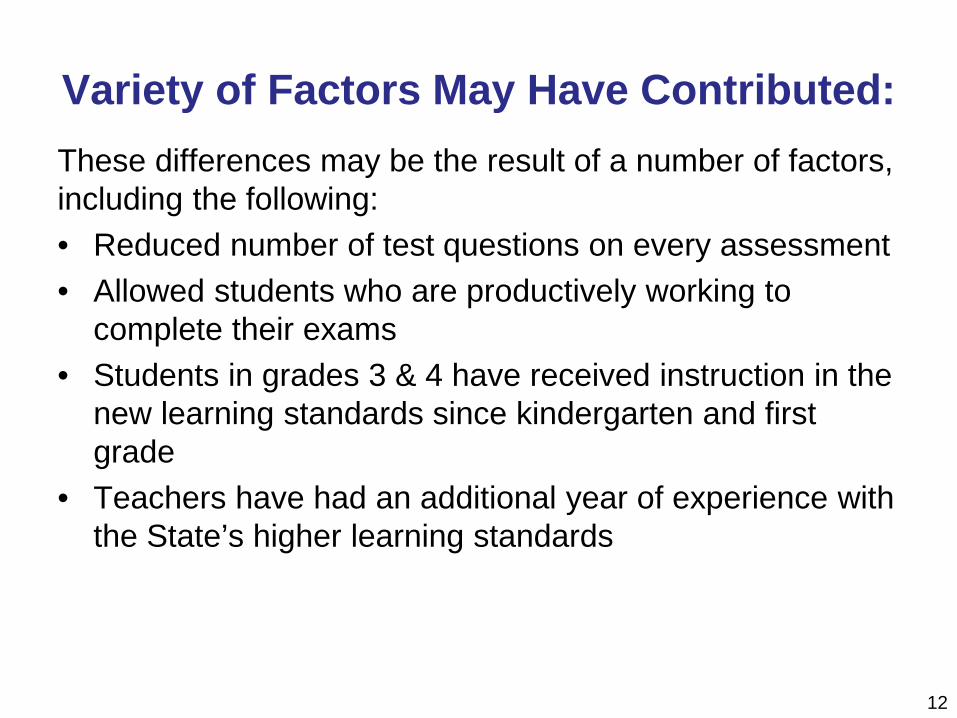
Variety of Factors May Have Contributed: These differences may be the result of a number of factors, including the following: • Reduced number of test questions on every assessment • Allowed students who are productively working to
complete their exams • Students in grades 3 & 4 have received instruction in the
new learning standards since kindergarten and first grade
• Teachers have had an additional year of experience with the State’s higher learning standards
12
Test Refusal Remains Flat
• The test refusal rate was approximately 21% in 2016
• This remains relatively flat compared to the previous year
13
2016 Grades 3-8
English Language Arts Test Results
14
*Due to changes in the 2016 exams, the proficiency rates from exams prior to 2016 are not directly comparable to the 2016 proficiency rates
64.4
%
31.2
%
69.6
%
30.3
%
65.9
%
30.2
%
71.2
%
29.6
%
68.0
%
31.4
%
70.5
%
33.8
%
68.3
%
31.1
%
62.9
%
31.6
%
69.2
%
32.4
%
64.1
%
29.0
%
72.6
%
28.0
%
64.5
%
28.4
%
72.0
%
34.2
%
67.5
%
30.6
%
62.9
%
31.0
%
69.1
%
32.7
%
64.7
%
29.8
%
69.4
%
30.6
%
62.2
%
29.2
%
70.5
%
34.7
%
66.4
%
31.3
%
73.3
%
41.9
%
75.6
%
40.8
%
63.8
%
33.5
%
72.6
%
34.4
%
71.7
%
35.5
%
76.3
%
40.9
%
72.2
%
37.9
%
2 &above
3 &above
2 &above
3 &above
2 &above
3 &above
2 &above
3 &above
2 &above
3 &above
2 &above
3 &above
2 &above
3 &above
2013201420152016
15
Grade 3 Grade 4 Grade 5 Grade 6 Grade 7 Combined Grades
Grade 8
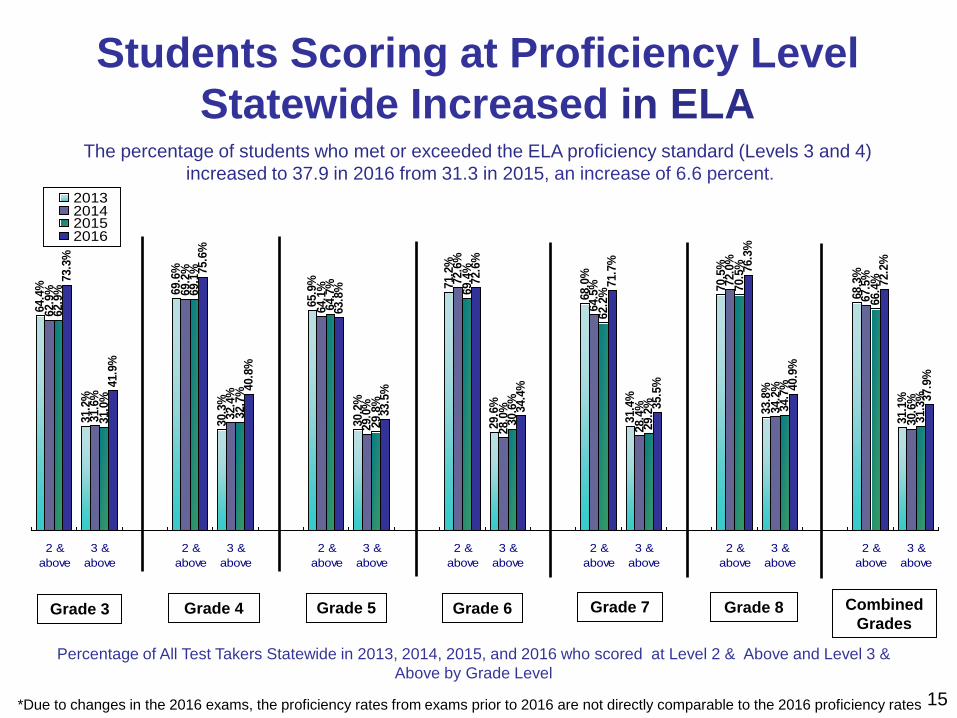
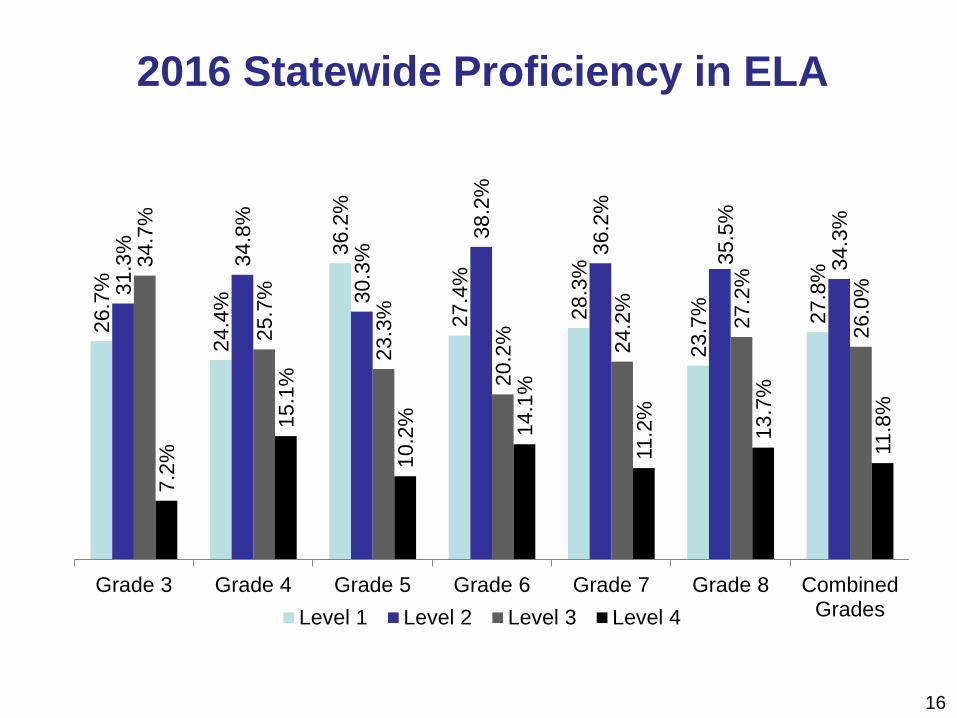
Students Scoring at Proficiency Level Statewide Increased in ELA
The percentage of students who met or exceeded the ELA proficiency standard (Levels 3 and 4) increased to 37.9 in 2016 from 31.3 in 2015, an increase of 6.6 percent.
Percentage of All Test Takers Statewide in 2013, 2014, 2015, and 2016 who scored at Level 2 & Above and Level 3 & Above by Grade Level
16
26.7
%
24.4
%
36.2
%
27.4
%
28.3
%
23.7
%
27.8
%
31.3
%
34.8
%
30.3
% 38
.2%
36.2
%
35.5
%
34.3
%
34.7
%
25.7
%
23.3
%
20.2
%
24.2
%
27.2
%
26.0
%
7.2%
15.1
%
10.2
%
14.1
%
11.2
%
13.7
%
11.8
%
Grade 3 Grade 4 Grade 5 Grade 6 Grade 7 Grade 8 CombinedGradesLevel 1 Level 2 Level 3 Level 4
2016 Statewide Proficiency in ELA
*Due to changes in the 2016 exams, the proficiency rates from exams prior to 2016 are not directly comparable to the 2016 proficiency rates
61.5
%
28.2
%
66.6
%
27.3
%
64.4
%
28.8
%
64.9
%
23.4
%
62.7
%
25.6
%
62.4
%
25.5
%
63.7
%
26.5
%
61.0
%
30.0
%
67.3
%
31.2
%
63.5
%
28.4
%
69.5
%
25.3
%
62.8
%
26.8
%
68.3
%
28.9
%
65.4
%
28.5
%
62.7
%
30.2
%
68.1
%
31.3
%
65.1
%
29.7
%
69.2
%
30.0
%
62.2
%
28.2
%
71.3
%
32.9
%
66.4
%
30.4
%
72.7
%
40.9
%
76.4
%
41.4
%
64.1
%
34.1
%
72.8
%
34.7
%
73.7
%
36.0
%
77.9
%
40.5
%
72.9
%
38.0
%
2 &above
3 &above
2 &above
3 &above
2 &above
3 &above
2 &above
3 &above
2 &above
3 &above
2 &above
3 &above
2 &above
3 &above
2013201420152016
17
Grade 3 Grade 4 Grade 5 Grade 6 Grade 7 Combined Grades
NYC
Grade 8
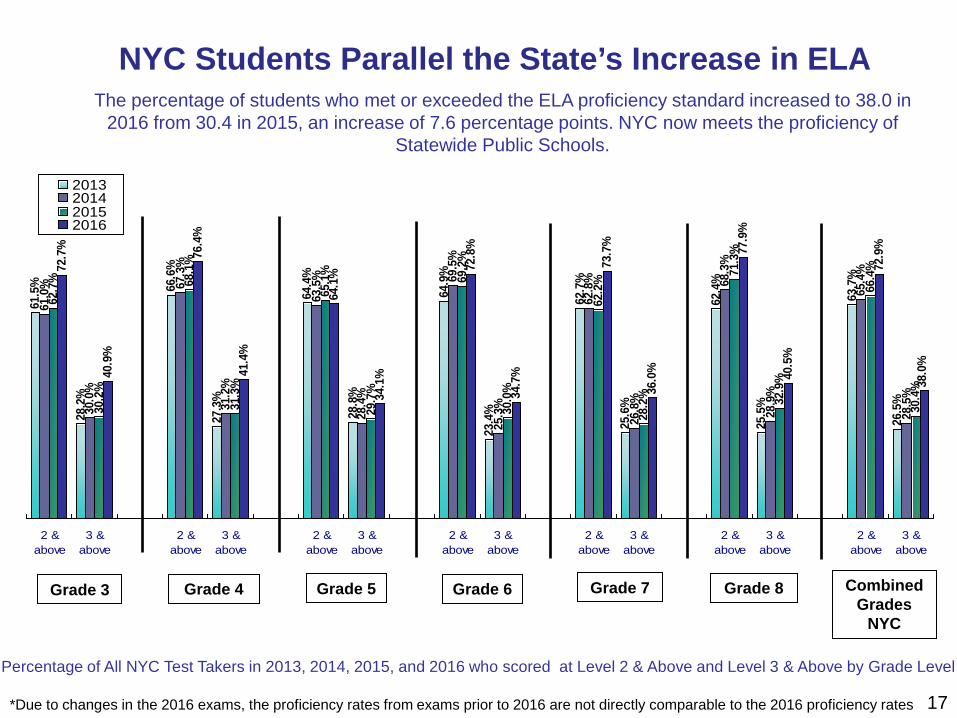
NYC Students Parallel the State’s Increase in ELA
Percentage of All NYC Test Takers in 2013, 2014, 2015, and 2016 who scored at Level 2 & Above and Level 3 & Above by Grade Level
The percentage of students who met or exceeded the ELA proficiency standard increased to 38.0 in 2016 from 30.4 in 2015, an increase of 7.6 percentage points. NYC now meets the proficiency of
Statewide Public Schools.
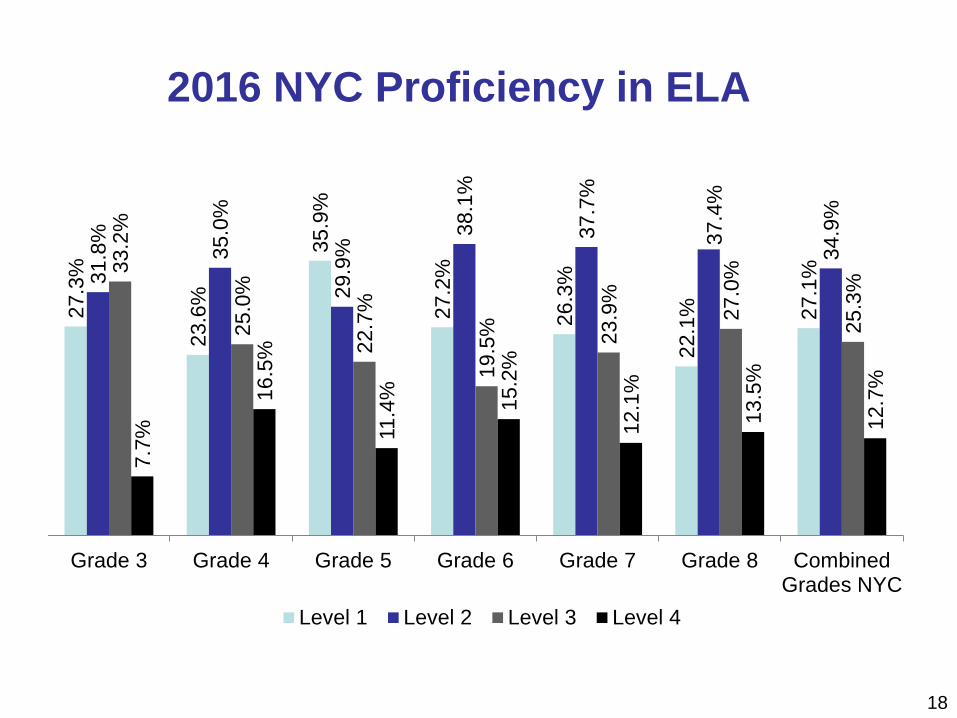
2016 NYC Proficiency in ELA
18
27.3
%
23.6
%
35.9
%
27.2
%
26.3
%
22.1
%
27.1
%
31.8
%
35.0
%
29.9
% 38
.1%
37.7
%
37.4
%
34.9
%
33.2
%
25.0
%
22.7
%
19.5
%
23.9
%
27.0
%
25.3
%
7.7%
16.5
%
11.4
%
15.2
%
12.1
%
13.5
%
12.7
%
Grade 3 Grade 4 Grade 5 Grade 6 Grade 7 Grade 8 CombinedGrades NYC
Level 1 Level 2 Level 3 Level 4
63.7
%
26.5
%
39.9
%
11.5
%
28.4
%
5.4%
32.9
%
8.7%
52.5
%
16.4
%
68.3
%
31.1
%
65.4
%
28.5
%
39.0
%
11.9
%
28.6
%
5.5%
31.6
%
8.5%
55.5
%
18.6
%
67.5
%
30.6
%
66.4
%
30.4
% 36.7
%
11.9
%
24.3
%
4.7%
29.1
%
8.1%
55.3
%
20.3
%
66.4
%
31.3
%
72.9
%
38.0
% 44.2
%
16.4
%
30.5
%
6.7%
33.9
%
10.9
%
62.1
%
26.0
%
72.2
%
37.9
%
2 &above
3 &above
2 &above
3 &above
2 &above
3 &above
2 &above
3 &above
2 &above
3 &above
2 &above
3 &above
2013201420152016
19
Yonkers Buffalo Total Public Syracuse Rochester NYC
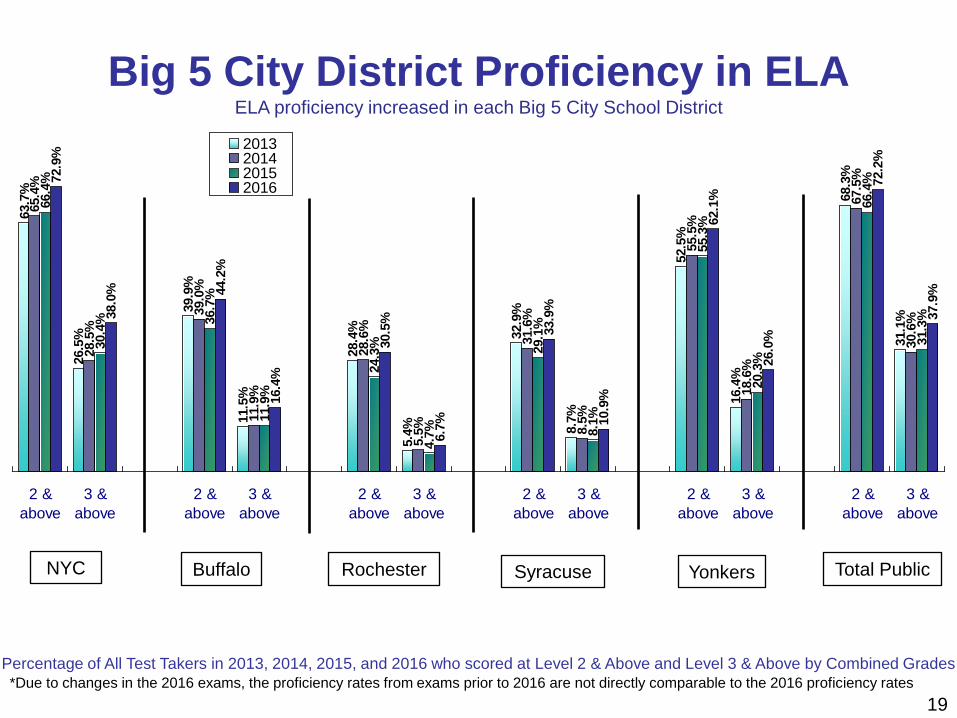
Big 5 City District Proficiency in ELA ELA proficiency increased in each Big 5 City School District
Percentage of All Test Takers in 2013, 2014, 2015, and 2016 who scored at Level 2 & Above and Level 3 & Above by Combined Grades
*Due to changes in the 2016 exams, the proficiency rates from exams prior to 2016 are not directly comparable to the 2016 proficiency rates
26.5
%
10.4
% 17.2
% 23.0
%
35.1
%
51.5
%
23.1
% 31.1
%
28.5
%
11.2
% 16.2
% 21.9
%
33.2
%
49.1
%
26.1
%
30.6
%
30.4
%
11.5
% 16.0
% 22.4
%
34.1
%
52.2
%
27.5
%
31.3
%38.0
%
15.4
% 21.2
% 27.3
%
39.4
%
58.9
%
40.3
%
37.9
%
NYC Large City Urban-Suburban
Rural Average Low Charter Total Public
2013201420152016
20
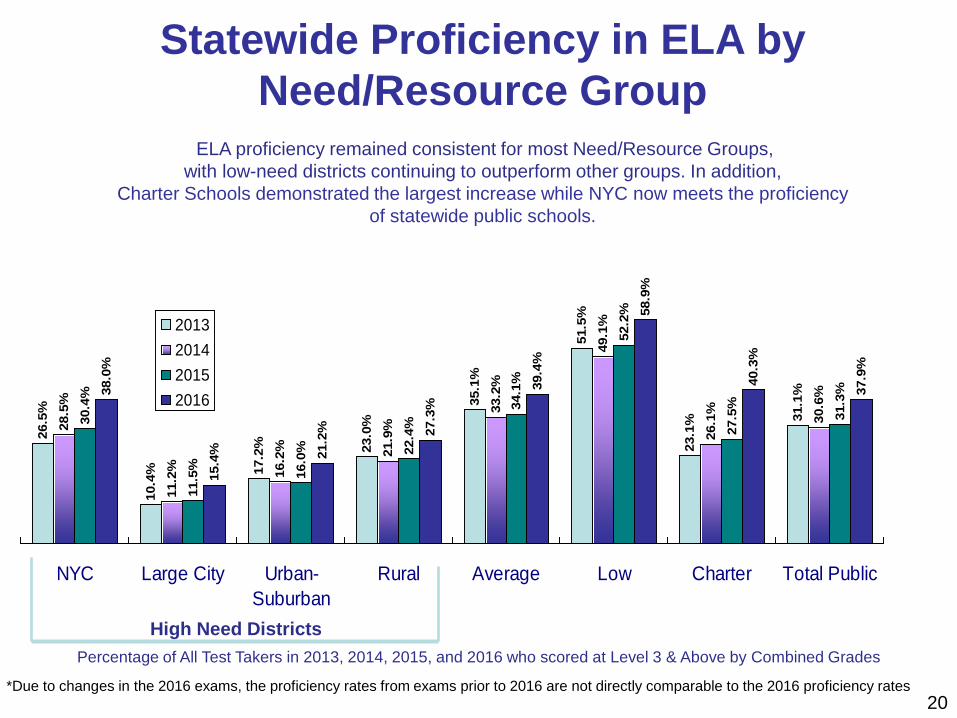
Statewide Proficiency in ELA by Need/Resource Group
ELA proficiency remained consistent for most Need/Resource Groups,
with low-need districts continuing to outperform other groups. In addition, Charter Schools demonstrated the largest increase while NYC now meets the proficiency
of statewide public schools.
Percentage of All Test Takers in 2013, 2014, 2015, and 2016 who scored at Level 3 & Above by Combined Grades
High Need Districts
*Due to changes in the 2016 exams, the proficiency rates from exams prior to 2016 are not directly comparable to the 2016 proficiency rates
*Due to changes in the 2016 exams, the proficiency rates from exams prior to 2016 are not directly comparable to the 2016 proficiency rates
82.5
%
50.1
%
53.5
%
16.2
%
56.5
%
17.7
%
58.4
%
21.2
%
77.1
%
39.9
%
82.4
%
50.4
%
54.4
%
17.4
%
57.2
%
18.5
%
59.9
%
22.0
%
75.5
%
38.5
%
83.2
%
52.5
%
54.3
%
18.5
%
57.3
%
19.7
%
60.4
%
23.8
%
74.7
%
40.4
%
86.2
%
59.0
%
62.9
%
26.2
%
64.5
%
26.8
%
66.8
%
29.9
%
78.6
%
46.0
%
2 &above
3 &above
2 &above
3 &above
2 &above
3 &above
2 &above
3 &above
2 &above
3 &above
2013201420152016
American Indian/Alaska
Native
Asian/Pacific Islander
Hispanic Black White
21
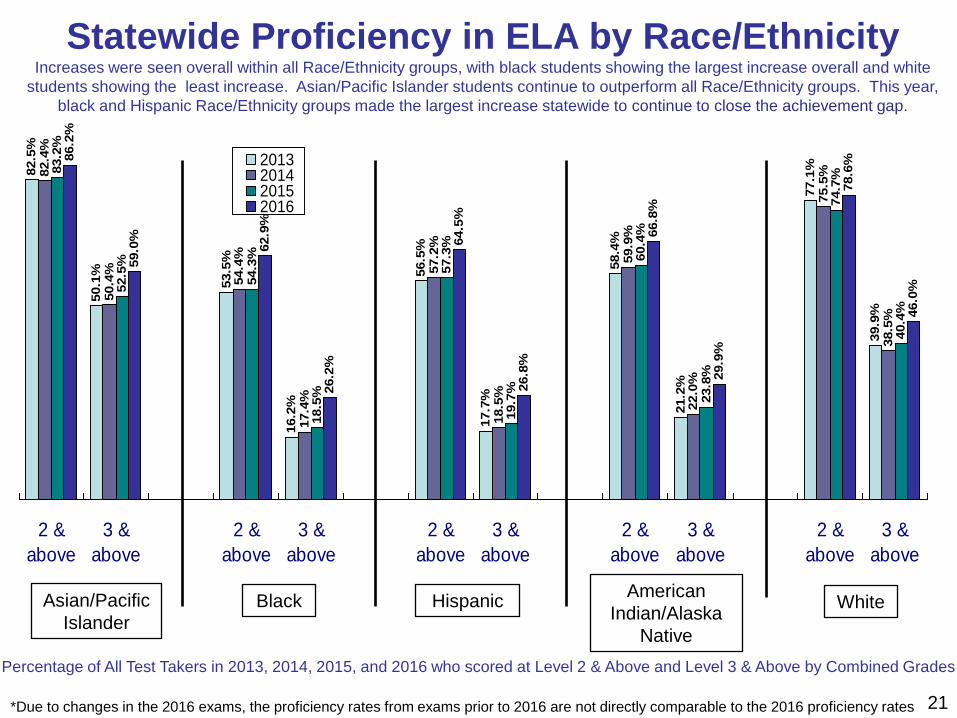
Statewide Proficiency in ELA by Race/Ethnicity Increases were seen overall within all Race/Ethnicity groups, with black students showing the largest increase overall and white
students showing the least increase. Asian/Pacific Islander students continue to outperform all Race/Ethnicity groups. This year, black and Hispanic Race/Ethnicity groups made the largest increase statewide to continue to close the achievement gap.
Percentage of All Test Takers in 2013, 2014, 2015, and 2016 who scored at Level 2 & Above and Level 3 & Above by Combined Grades
*Due to changes in the 2016 exams, the proficiency rates from exams prior to 2016 are not directly comparable to the 2016 proficiency rates
81.7
%
47.8
% 54.9
%
16.4
%
55.5
%
16.6
%
63.6
%
25.6
%
81.6
%
47.0
%
82.0
%
49.2
% 56.6
%
18.1
%
57.4
%
18.3
%
65.7
%
26.7
%
82.6
%
49.5
%
83.3
%
52.0
% 57.0
%
19.0
%
58.4
%
19.8
%
66.9
%
28.7
%
82.8
%
51.3
%
86.5
%
58.8
% 65.7
%
26.6
%
65.8
%
27.2
%
72.3
%
34.9
%
86.3
%
58.9
%
2 &above
3 &above
2 &above
3 &above
2 &above
3 &above
2 &above
3 &above
2 &above
3 &above
2013201420152016
American Indian/Alaska
Native
Asian/Pacific Islander
Hispanic Black White
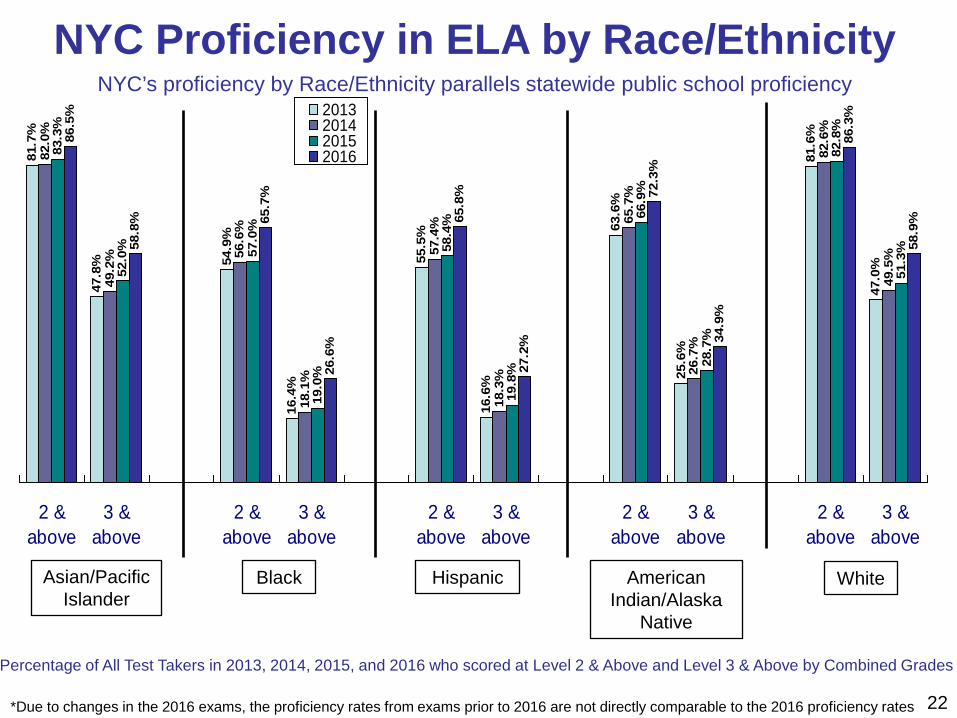
NYC Proficiency in ELA by Race/Ethnicity
Percentage of All Test Takers in 2013, 2014, 2015, and 2016 who scored at Level 2 & Above and Level 3 & Above by Combined Grades
NYC’s proficiency by Race/Ethnicity parallels statewide public school proficiency
22
*Due to changes in the 2016 exams, the proficiency rates from exams prior to 2016 are not directly comparable to the 2016 proficiency rates
73.0
%
35.4
%
63.8
%
27.0
%
72.6
%
35.1
%
62.7
%
26.3
%
72.1
%
36.4
%
61.0
%
26.5
%
77.8
%
43.9
%
66.8
%
32.2
%
2 & above 3 & above 2 & above 3 & above
2013 20142015 2016
Females Males
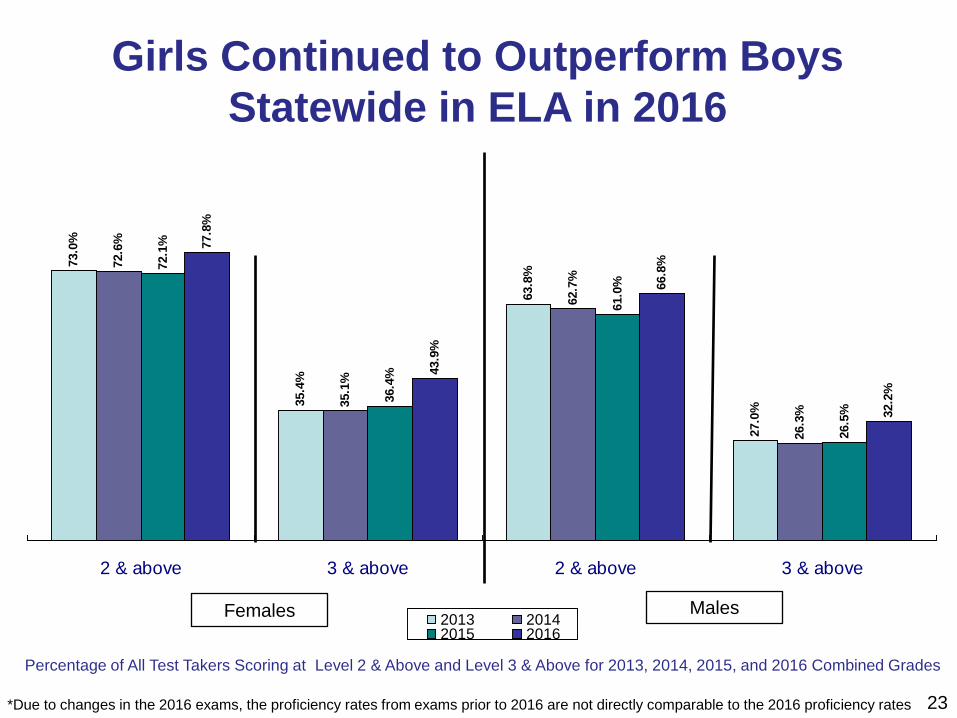
Girls Continued to Outperform Boys Statewide in ELA in 2016
Percentage of All Test Takers Scoring at Level 2 & Above and Level 3 & Above for 2013, 2014, 2015, and 2016 Combined Grades
23
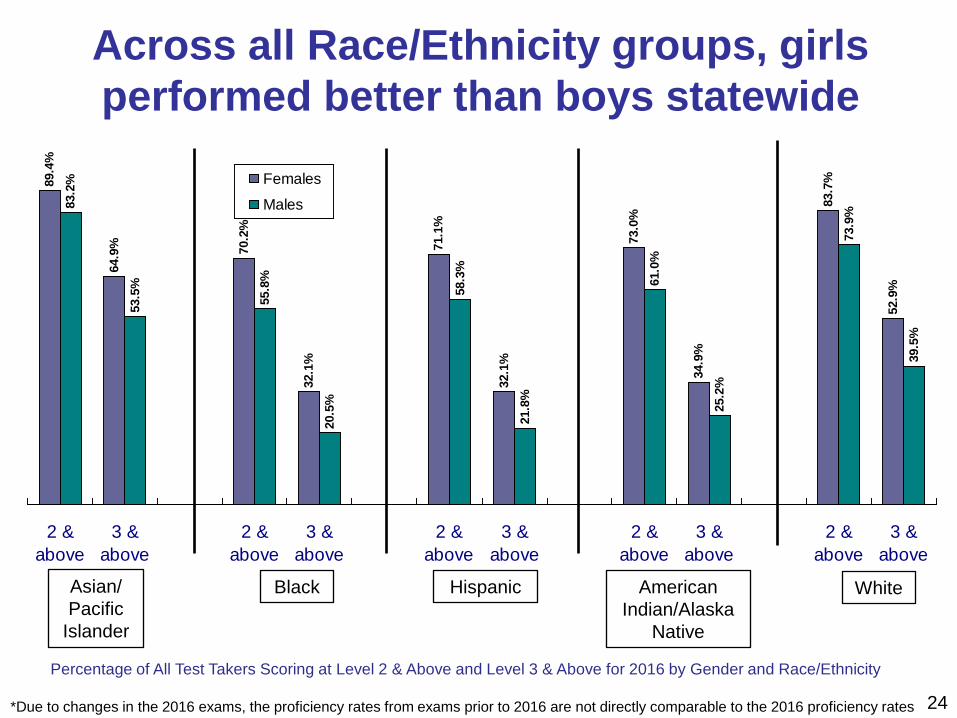
*Due to changes in the 2016 exams, the proficiency rates from exams prior to 2016 are not directly comparable to the 2016 proficiency rates
89.4
%
64.9
% 70.2
%
32.1
%
71.1
%
32.1
%
73.0
%
34.9
%
83.7
%
52.9
%
83.2
%
53.5
%
55.8
%
20.5
%
58.3
%
21.8
%
61.0
%
25.2
%
73.9
%
39.5
%
2 &above
3 &above
2 &above
3 &above
2 &above
3 &above
2 &above
3 &above
2 &above
3 &above
Females
Males
American Indian/Alaska
Native
Asian/ Pacific
Islander
Hispanic Black White
Across all Race/Ethnicity groups, girls performed better than boys statewide
Percentage of All Test Takers Scoring at Level 2 & Above and Level 3 & Above for 2016 by Gender and Race/Ethnicity
24
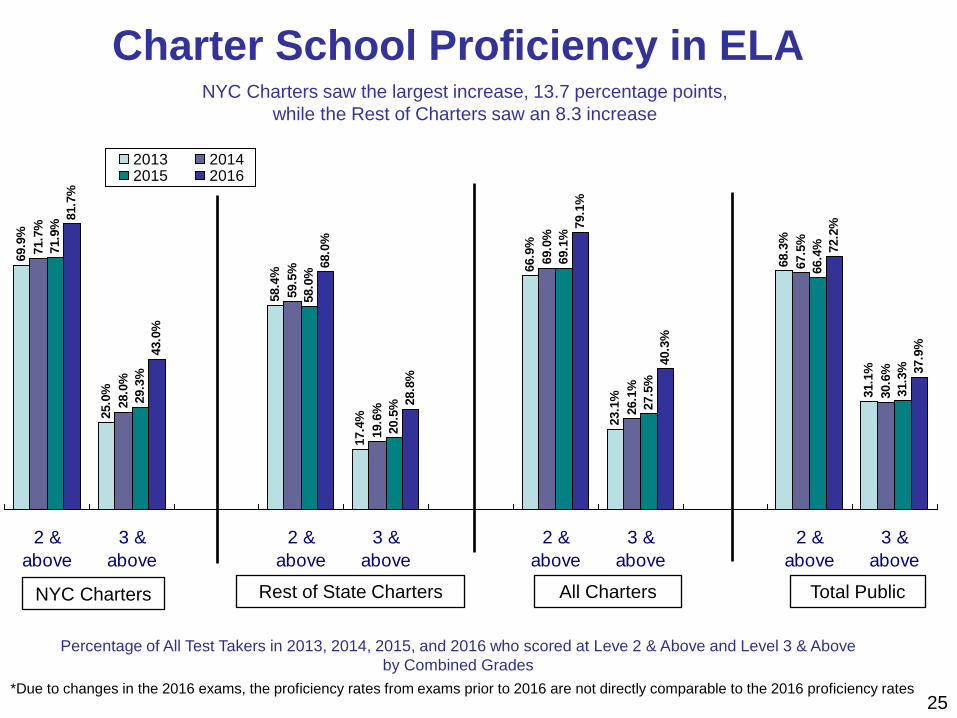
Percentage of All Test Takers in 2013, 2014, 2015, and 2016 who scored at Leve 2 & Above and Level 3 & Above by Combined Grades
25
Charter School Proficiency in ELA 69
.9%
25.0
%
58.4
%
17.4
%
66.9
%
23.1
%
68.3
%
31.1
%
71.7
%
28.0
%
59.5
%
19.6
%
69.0
%
26.1
%
67.5
%
30.6
%
71.9
%
29.3
%
58.0
%
20.5
%
69.1
%
27.5
%
66.4
%
31.3
%
81.7
%
43.0
%
68.0
%
28.8
%
79.1
%
40.3
%
72.2
%
37.9
%
2 &above
3 &above
2 &above
3 &above
2 &above
3 &above
2 &above
3 &above
2013 20142015 2016
Total Public NYC Charters All Charters Rest of State Charters
NYC Charters saw the largest increase, 13.7 percentage points, while the Rest of Charters saw an 8.3 increase
*Due to changes in the 2016 exams, the proficiency rates from exams prior to 2016 are not directly comparable to the 2016 proficiency rates
*Due to changes in the 2016 exams, the proficiency rates from exams prior to 2016 are not directly comparable to the 2016 proficiency rates
25.0
%
3.2%
68.3
%
31.1
%
24.5
%
3.3%
74.6
%
27.8
%
70.1
%
33.0
%
67.5
%
30.6
%
25.1
%
3.9%
75.1
%
30.5
%
69.1
%
33.9
%
66.4
%
31.3
%
28.5
%
4.0%
82.6
%
39.7
%
74.9
%
40.8
%
72.2
%
37.9
%
2 &above
3 &above
2 &above
3 &above
2 &above
3 &above
2 &above
3 &above
2013201420152016
Never ELLs3 Current ELLs1 Ever ELLs2 Total Public
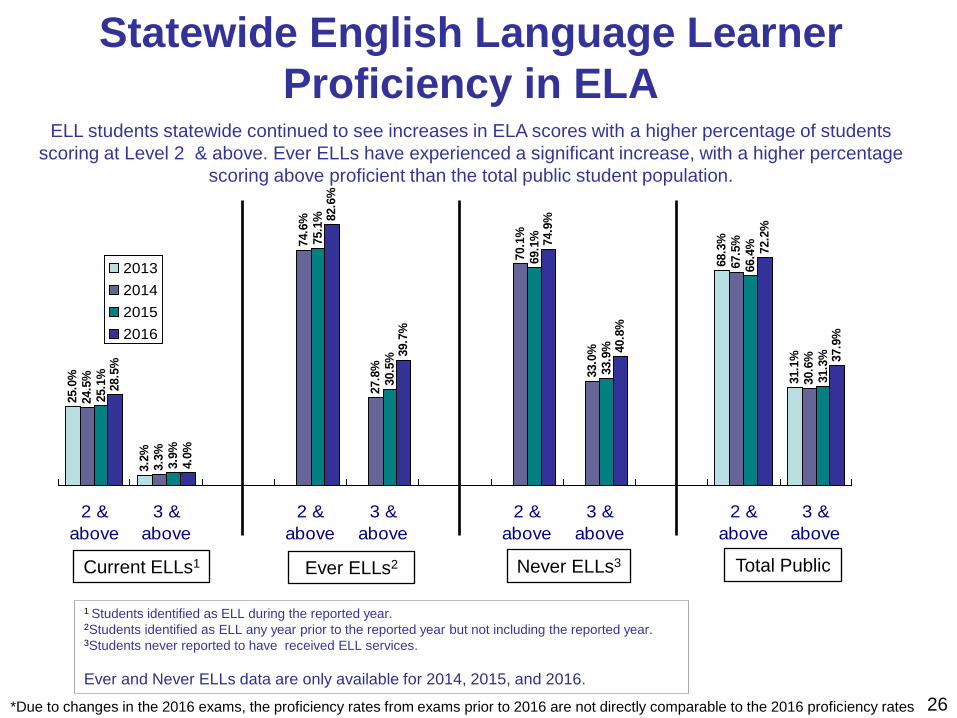
1 Students identified as ELL during the reported year. 2Students identified as ELL any year prior to the reported year but not including the reported year. 3Students never reported to have received ELL services. Ever and Never ELLs data are only available for 2014, 2015, and 2016.
Statewide English Language Learner Proficiency in ELA
ELL students statewide continued to see increases in ELA scores with a higher percentage of students scoring at Level 2 & above. Ever ELLs have experienced a significant increase, with a higher percentage
scoring above proficient than the total public student population.
26
25.0
%
3.2%
68.3
%
31.1
%
26.4
%
3.6%
77.8
%
31.1
%
69.1
%
32.0
%
67.5
%
30.6
%
27.4
%
4.4%
78.8
%
34.2
%
70.1
%
33.8
%
66.4
%
31.3
%
30.9
%
4.4%
85.5
%
43.2
%
76.7
%
42.1
%
72.2
%
37.9
%
2 &above
3 &above
2 &above
3 &above
2 &above
3 &above
2 &above
3 &above
2013201420152016
Never ELLs3 Current ELLs1 Ever ELLs2 Total Public
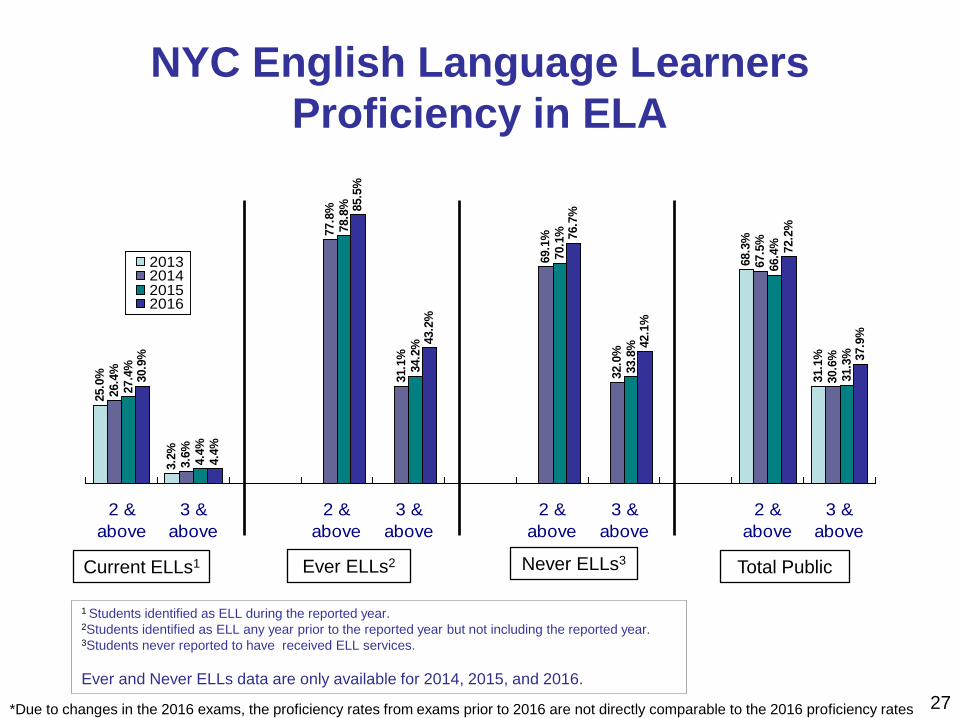
1 Students identified as ELL during the reported year. 2Students identified as ELL any year prior to the reported year but not including the reported year. 3Students never reported to have received ELL services. Ever and Never ELLs data are only available for 2014, 2015, and 2016.
NYC English Language Learners Proficiency in ELA
27
*Due to changes in the 2016 exams, the proficiency rates from exams prior to 2016 are not directly comparable to the 2016 proficiency rates
27.4
%
4.9%
75.8
%
35.9
%
27.8
%
5.2%
75.4
%
35.6
%
28.3
%
5.7%
74.4
%
36.6
%
7.9%
80.1
%
44.1
%
33.8
%
2 & above Students withDisabilities
3 & above Students withDisabilities
2 & above GeneralEducation
3 & above GeneralEducation
2013 2014 2015 2016
28
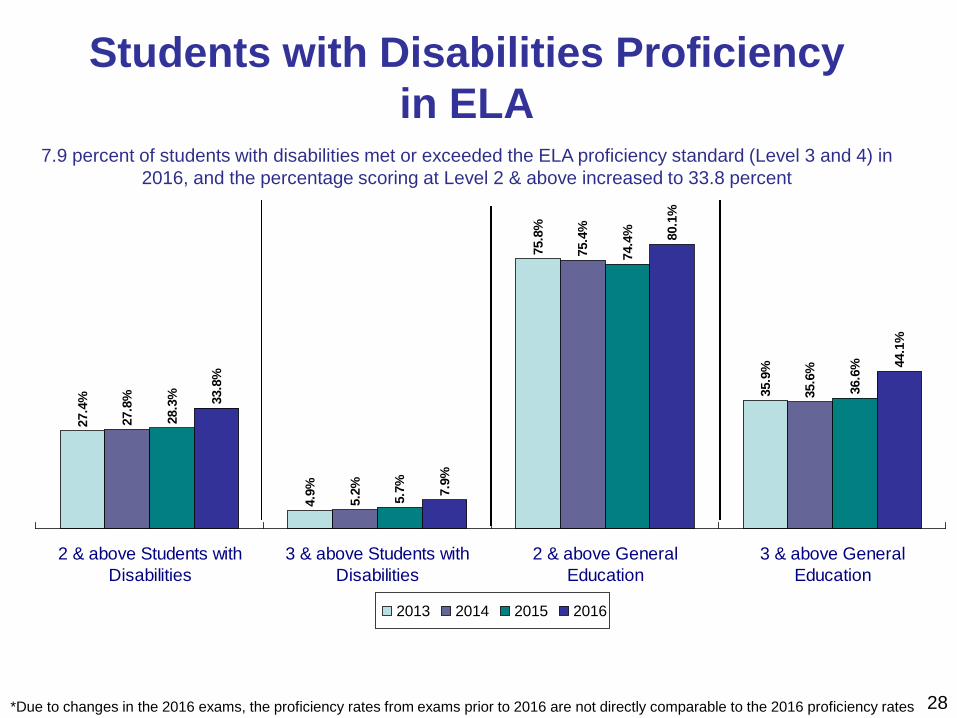
Students with Disabilities Proficiency in ELA
7.9 percent of students with disabilities met or exceeded the ELA proficiency standard (Level 3 and 4) in 2016, and the percentage scoring at Level 2 & above increased to 33.8 percent
*Due to changes in the 2016 exams, the proficiency rates from exams prior to 2016 are not directly comparable to the 2016 proficiency rates
2016 Grades 3-8
Math Test Results
29
69.7
%
34.2
%
71.1
%
36.4
%
60.3
%
29.9
%
71.1
%
30.6
%
62.1
%
27.8
%
68.9
%
27.5
%
67.2
%
31.1
%
73.1
%
42.2
%
73.3
%
41.8
%
67.9
%
39.3
%
72.6
%
37.2
%
64.6
%
32.0
%
62.6
%
21.5
%
69.3
%
36.2
%
72.1
%
42.0
%
73.0
%
43.1
%
69.2
%
42.7
%
71.6
%
38.9
%
66.4
%
34.8
%
60.3
%
21.9
%
69.3
%
38.1
%
74.8
%
44.1
%
72.5
%
44.7
%
68.0
%
40.1
%
74.1
%
40.1
%
66.3
%
35.9
%
60.1
%
23.8
%
69.9
%
39.1
%
2 &above
3 &above
2 &above
3 &above
2 &above
3 &above
2 &above
3 &above
2 &above
3 &above
2 &above
3 &above
2 &above
3 &above
2013 2014
2015 2016
30
Grade 3 Grade 4 Grade 5 Grade 6 Grade 7 Combined
Grades Grade 8
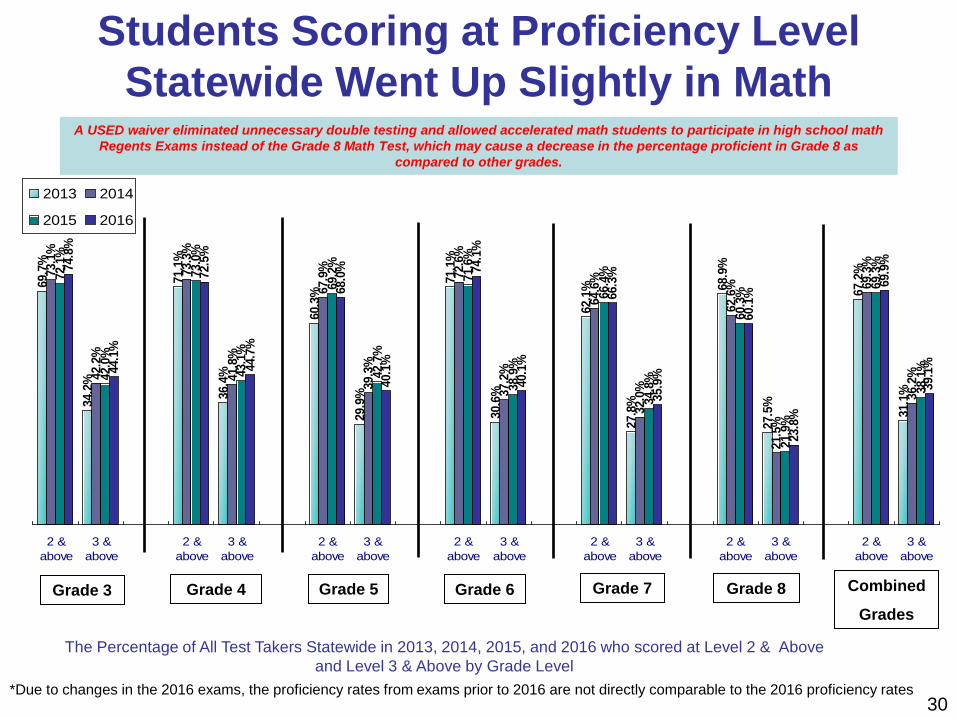
The Percentage of All Test Takers Statewide in 2013, 2014, 2015, and 2016 who scored at Level 2 & Above and Level 3 & Above by Grade Level
Students Scoring at Proficiency Level Statewide Went Up Slightly in Math
The percentage of students who met or exceeded the proficiency standard (Levels 3 and 4) increased to 39.1 in 2016 from 38.1 in 2015, a gain of 1.0
A USED waiver eliminated unnecessary double testing and allowed accelerated math students to participate in high school math Regents Exams instead of the Grade 8 Math Test, which may cause a decrease in the percentage proficient in Grade 8 as
compared to other grades.
*Due to changes in the 2016 exams, the proficiency rates from exams prior to 2016 are not directly comparable to the 2016 proficiency rates
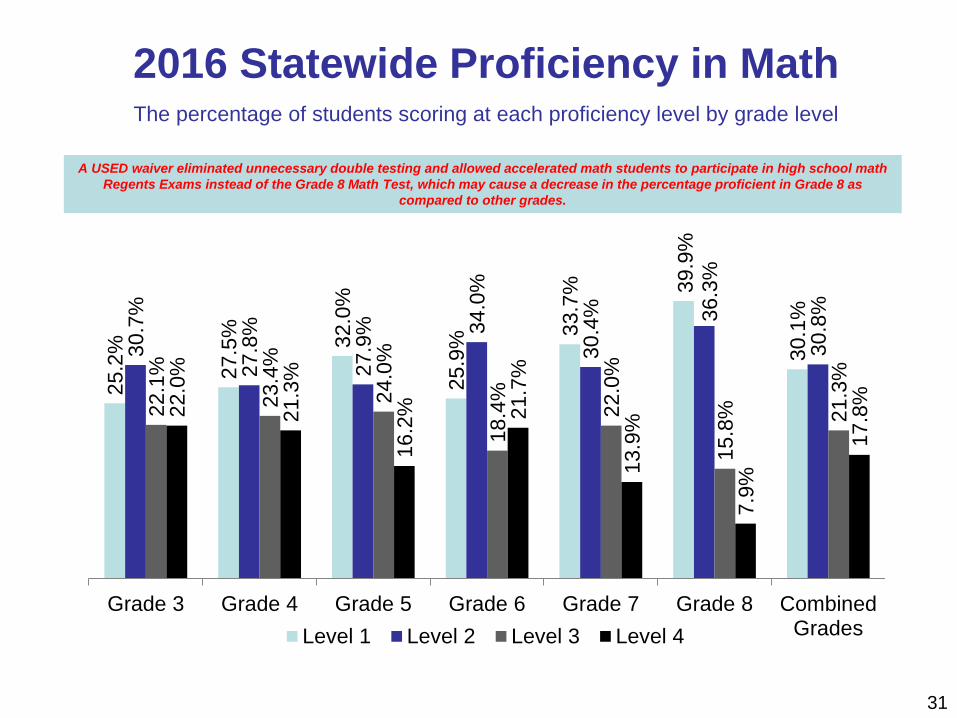
2016 Statewide Proficiency in Math The percentage of students scoring at each proficiency level by grade level
31
25.2
%
27.5
%
32.0
%
25.9
% 33
.7%
39.9
%
30.1
%
30.7
%
27.8
%
27.9
%
34.0
%
30.4
%
36.3
%
30.8
%
22.1
%
23.4
%
24.0
%
18.4
%
22.0
%
15.8
%
21.3
%
22.0
%
21.3
%
16.2
%
21.7
%
13.9
%
7.9%
17.8
%
Grade 3 Grade 4 Grade 5 Grade 6 Grade 7 Grade 8 CombinedGradesLevel 1 Level 2 Level 3 Level 4
A USED waiver eliminated unnecessary double testing and allowed accelerated math students to participate in high school math Regents Exams instead of the Grade 8 Math Test, which may cause a decrease in the percentage proficient in Grade 8 as
compared to other grades.
*Due to changes in the 2016 exams, the proficiency rates from exams prior to 2016 are not directly comparable to the 2016 proficiency rates
67.8
%
33.2
%
69.0
%
35.3
%
58.0
%
29.7
%
66.7
%
28.9
%
55.5
%
25.1
%
63.1
%
25.8
%
63.4
%
29.7
%
70.1
%
38.7
%
70.7
%
40.0
%
66.9
%
38.8
%
67.6
%
33.8
%
60.2
%
29.7
%
60.5
%
22.8
%
66.2
%
34.3
%
69.7
%
38.5
%
69.9
%
39.1
%
68.0
%
40.9
%
67.7
%
35.5
%
63.4
%
32.5
%
59.0
%
22.5
%
66.5
%
35.2
%
72.8
%
41.0
%
69.3
%
41.4
%
66.0
%
37.5
%
71.0
%
36.9
%
63.4
%
34.0
%
59.4
%
25.0
%
67.3
%
36.4
%
2 &above
3 &above
2 &above
3 &above
2 &above
3 &above
2 &above
3 &above
2 &above
3 &above
2 &above
3 &above
2 &above
3 &above
2013 20142015 2016
32
Grade 3 Grade 4 Grade 5 Grade 6 Grade 7 Combined Grades
NYC
Grade 8
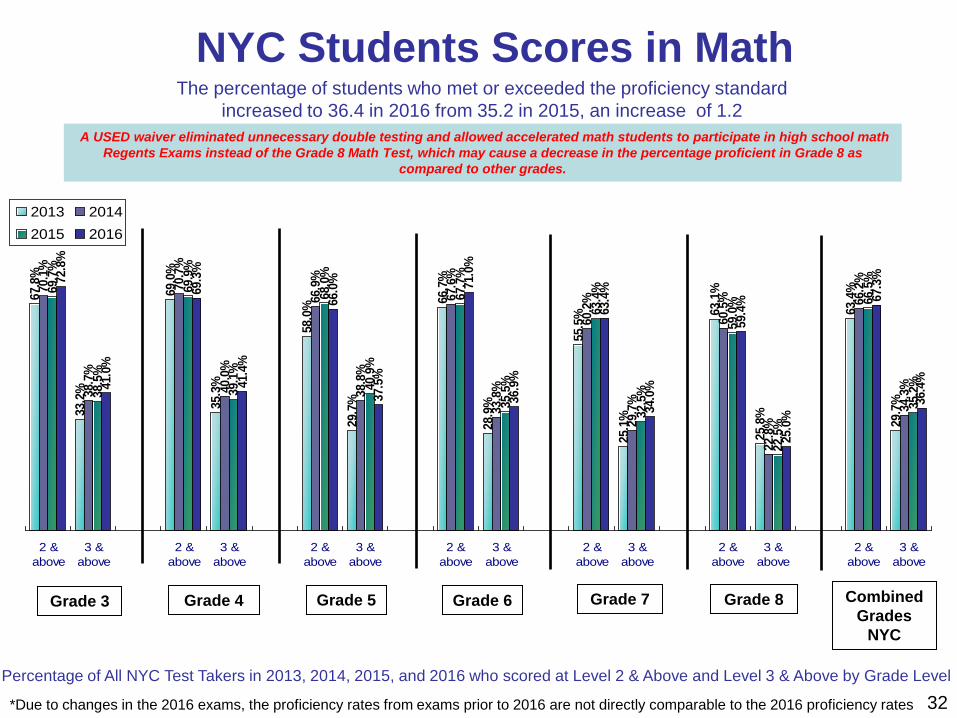
NYC Students Scores in Math
Percentage of All NYC Test Takers in 2013, 2014, 2015, and 2016 who scored at Level 2 & Above and Level 3 & Above by Grade Level
A USED waiver eliminated unnecessary double testing and allowed accelerated math students to participate in high school math Regents Exams instead of the Grade 8 Math Test, which may cause a decrease in the percentage proficient in Grade 8 as
compared to other grades.
The percentage of students who met or exceeded the proficiency standard increased to 36.4 in 2016 from 35.2 in 2015, an increase of 1.2
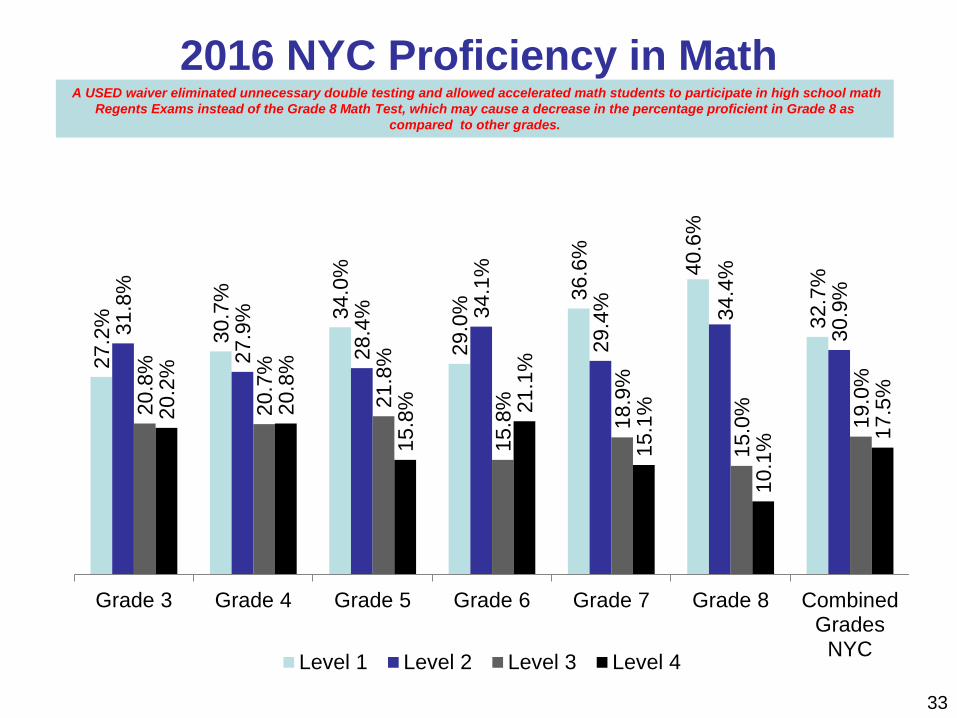
2016 NYC Proficiency in Math
33
27.2
%
30.7
%
34.0
%
29.0
% 36
.6%
40.6
%
32.7
%
31.8
%
27.9
%
28.4
%
34.1
%
29.4
%
34.4
%
30.9
%
20.8
%
20.7
%
21.8
%
15.8
%
18.9
%
15.0
%
19.0
%
20.2
%
20.8
%
15.8
%
21.1
%
15.1
%
10.1
% 17
.5%
Grade 3 Grade 4 Grade 5 Grade 6 Grade 7 Grade 8 CombinedGrades
NYCLevel 1 Level 2 Level 3 Level 4
A USED waiver eliminated unnecessary double testing and allowed accelerated math students to participate in high school math Regents Exams instead of the Grade 8 Math Test, which may cause a decrease in the percentage proficient in Grade 8 as
compared to other grades.
63.4
%
29.7
% 35.3
%
9.6%
25.4
%
5.0%
29.2
%
6.9%
46.9
%
14.6
%
67.2
%
31.1
%
66.2
%
34.3
% 39.2
%
13.1
%
29.3
%
7.2%
27.8
%
8.3%
54.0
%
21.8
%
69.3
%
36.2
%
66.5
%
35.2
% 40.1
%
15.1
%
28.7
%
7.4%
28.3
%
9.4%
54.7
%
24.0
%
69.3
%
38.1
%
67.3
%
36.4
% 41.7
%
16.1
%
27.7
%
7.2%
29.9
%
10.4
%
55.6
%
24.6
%
69.9
%
39.1
%
2 &above
3 &above
2 &above
3 &above
2 &above
3 &above
2 &above
3 &above
2 &above
3 &above
2 &above
3 &above
2013201420152016
34
Yonkers Buffalo Total Public Syracuse Rochester NYC
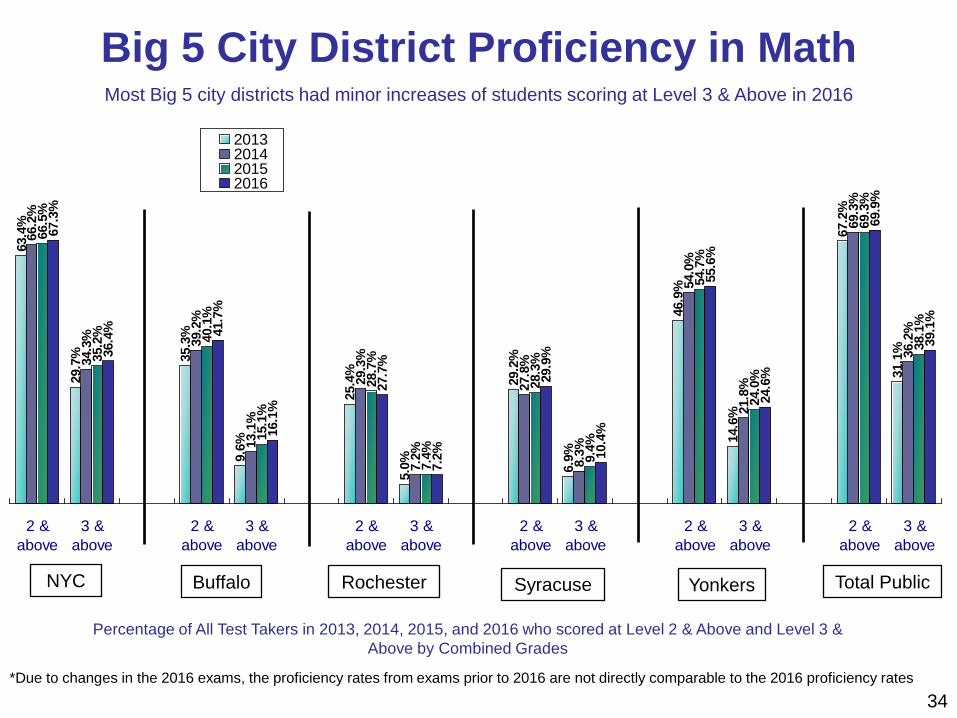
Big 5 City District Proficiency in Math Most Big 5 city districts had minor increases of students scoring at Level 3 & Above in 2016
Percentage of All Test Takers in 2013, 2014, 2015, and 2016 who scored at Level 2 & Above and Level 3 & Above by Combined Grades
*Due to changes in the 2016 exams, the proficiency rates from exams prior to 2016 are not directly comparable to the 2016 proficiency rates
*Due to changes in the 2016 exams, the proficiency rates from exams prior to 2016 are not directly comparable to the 2016 proficiency rates
29.7
%
9.0%
14.8
%
19.4
%
32.4
%
50.4
%
31.3
%
31.1
%
34.3
%
12.8
% 17.9
% 25.6
%
38.9
%
57.7
%
40.8
%
36.2
%
35.2
%
14.5
% 19.6
%
30.5
%
43.4
%
63.3
%
41.5
%
38.1
%
36.4
%
15.1
% 21.0
%
30.9
%
43.8
%
64.5
%
45.4
%
39.1
%
NYC Large City Urban-Suburban
Rural Average Low Charter Total Public
2013201420152016
35
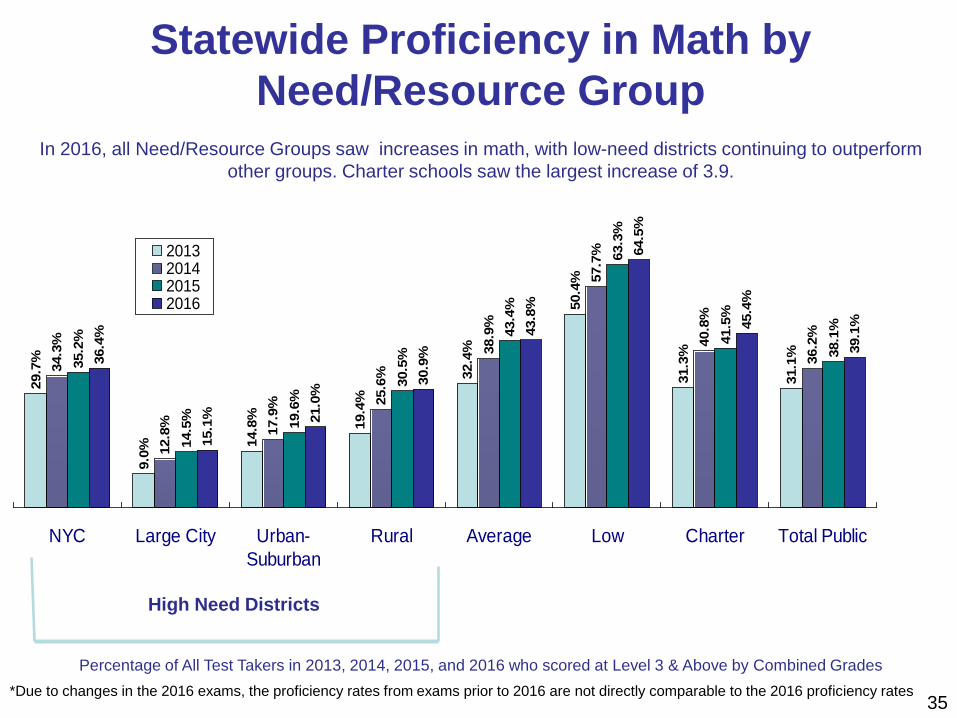
Statewide Proficiency in Math by Need/Resource Group
In 2016, all Need/Resource Groups saw increases in math, with low-need districts continuing to outperform
other groups. Charter schools saw the largest increase of 3.9.
Percentage of All Test Takers in 2013, 2014, 2015, and 2016 who scored at Level 3 & Above by Combined Grades
High Need Districts
*Due to changes in the 2016 exams, the proficiency rates from exams prior to 2016 are not directly comparable to the 2016 proficiency rates 36
86.5
%
59.9
%
49.2
%
15.3
%
55.4
%
18.5
%
57.6
%
20.9
%
76.4
%
38.1
%
87.8
%
64.7
%
52.6
%
19.8
%
58.5
%
23.4
%
62.2
%
27.6
%
78.8
%
44.8
%
88.2
%
66.0
%
53.4
%
21.3
%
58.8
%
24.5
%
64.4
%
30.7
%
80.6
%
49.7
%
88.2
%
66.5
%
54.7
%
23.0
%
59.8
%
25.7
%
62.8
%
29.5
%
80.6
%
50.0
%
2 &above
3 &above
2 &above
3 &above
2 &above
3 &above
2 &above
3 &above
2 &above
3 &above
2013201420152016
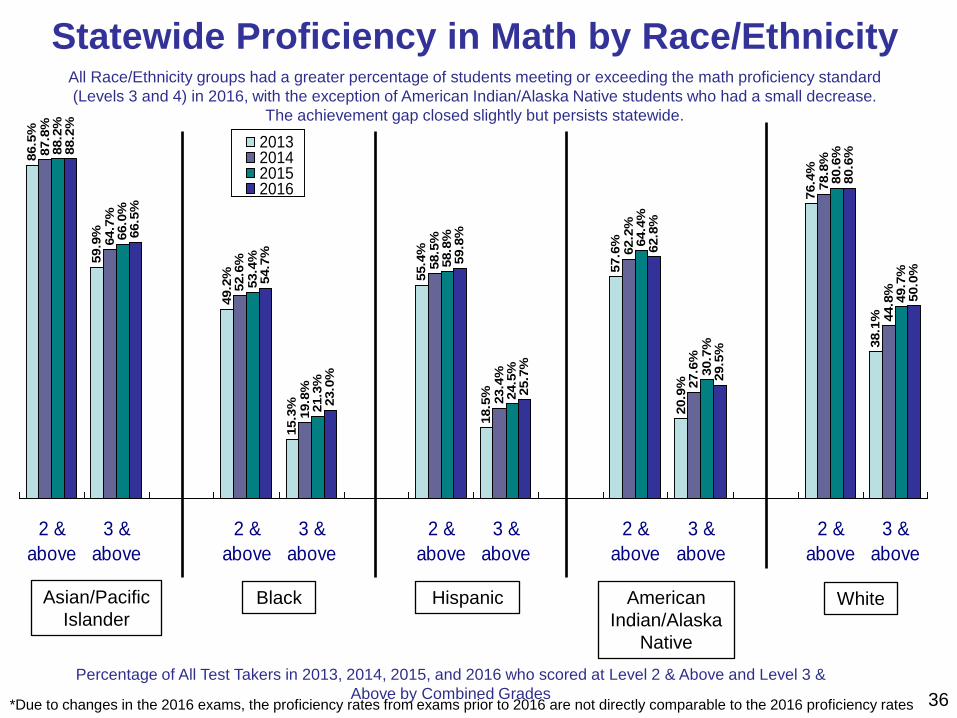
Statewide Proficiency in Math by Race/Ethnicity All Race/Ethnicity groups had a greater percentage of students meeting or exceeding the math proficiency standard (Levels 3 and 4) in 2016, with the exception of American Indian/Alaska Native students who had a small decrease.
The achievement gap closed slightly but persists statewide.
American Indian/Alaska
Native
Asian/Pacific Islander
Hispanic Black White
Percentage of All Test Takers in 2013, 2014, 2015, and 2016 who scored at Level 2 & Above and Level 3 & Above by Combined Grades
*Due to changes in the 2016 exams, the proficiency rates from exams prior to 2016 are not directly comparable to the 2016 proficiency rates 37
87.4
%
61.0
%
49.8
%
15.3
%
55.2
%
18.6
%
63.2
%
28.4
%
82.5
%
50.3
%
88.9
%
66.0
%
52.6
%
18.6
%
58.6
%
23.2
%
67.3
%
34.4
%
84.4
%
56.0
%
89.2
%
66.8
%
52.5
%
19.1
%
58.8
%
23.7
%
67.2
%
34.3
%
84.5
%
56.7
%
89.0
%
67.2
%
53.5
%
20.0
%
59.3
%
24.3
%
65.3
%
32.2
%
84.4
%
57.8
%
2 &above
3 &above
2 &above
3 &above
2 &above
3 &above
2 &above
3 &above
2 &above
3 &above
2013201420152016
American Indian/Alaska
Native
Asian/Pacific Islander
Hispanic Black White
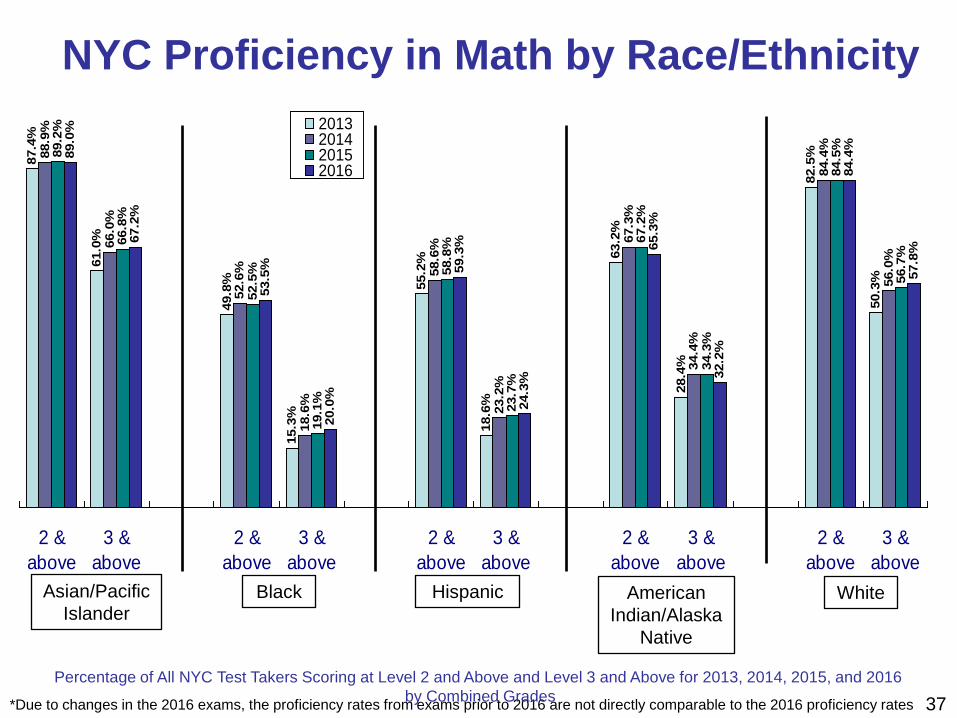
NYC Proficiency in Math by Race/Ethnicity
Percentage of All NYC Test Takers Scoring at Level 2 and Above and Level 3 and Above for 2013, 2014, 2015, and 2016 by Combined Grades
Percentage of All Test Takers Scoring at Level 2 and Above and Level 3 and Above for 2013, 2014, 2015, and 2016 by Combined Grades
68.4
%
30.9
%
66.0
%
31.2
%
70.7
%
36.7
%
67.8
%
35.8
%
70.9
%
38.7
%
67.8
%
37.5
%
71.6
%
39.6
%
68.4
%
38.6
%
2 & above 3 & above 2 & above 3 & above
2013 20142015 2016
38
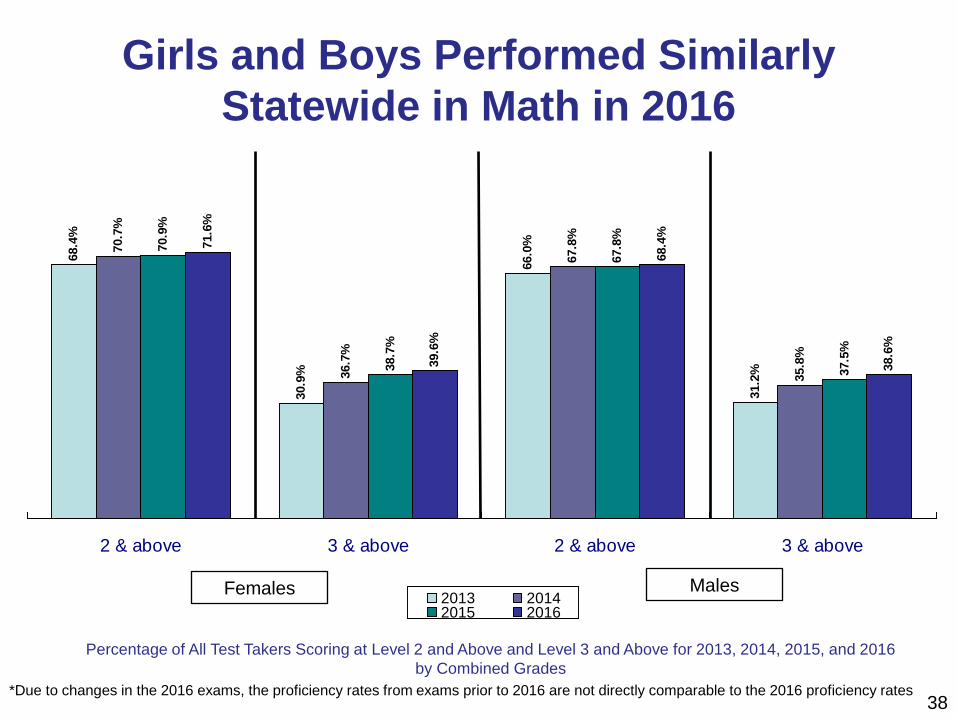
Females Males
Girls and Boys Performed Similarly Statewide in Math in 2016
*Due to changes in the 2016 exams, the proficiency rates from exams prior to 2016 are not directly comparable to the 2016 proficiency rates
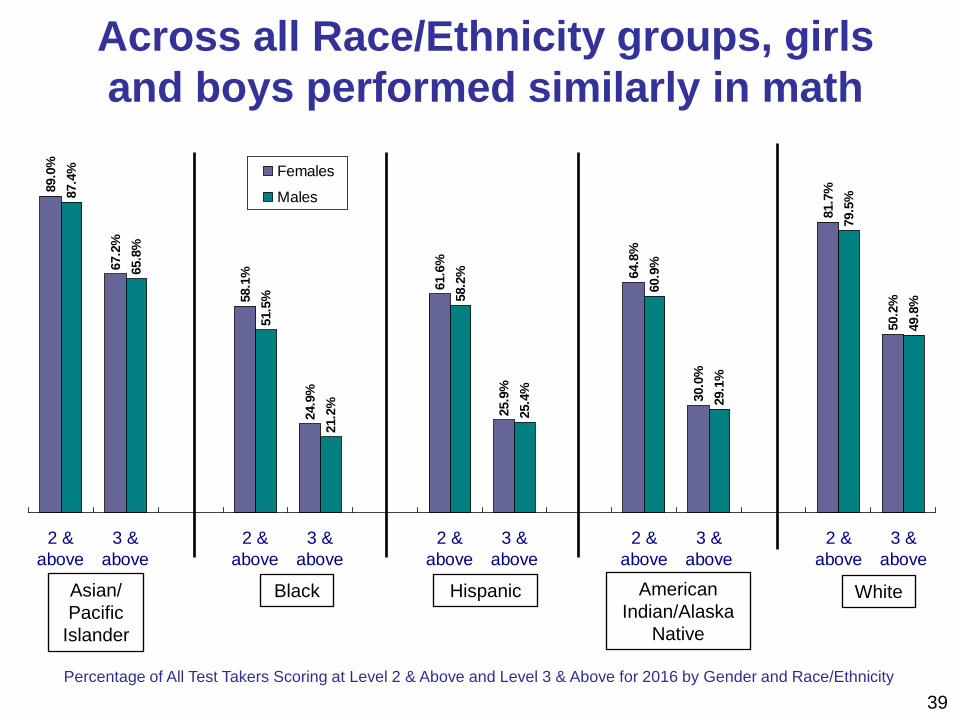
Percentage of All Test Takers Scoring at Level 2 & Above and Level 3 & Above for 2016 by Gender and Race/Ethnicity
89.0
%
67.2
%
58.1
%
24.9
%
61.6
%
25.9
%
64.8
%
30.0
%
81.7
%
50.2
%
87.4
%
65.8
%
51.5
%
21.2
%
58.2
%
25.4
%
60.9
%
29.1
%
79.5
%
49.8
%
2 &above
3 &above
2 &above
3 &above
2 &above
3 &above
2 &above
3 &above
2 &above
3 &above
Females
Males
39
American Indian/Alaska
Native
Asian/ Pacific
Islander
Hispanic Black White
Across all Race/Ethnicity groups, girls and boys performed similarly in math
40
74.4
%
34.8
%
63.1
%
21.0
%
71.5
%
31.3
%
67.2
%
31.1
%
78.6
%
43.9
%
68.4
%
30.4
%
76.4
%
40.8
%
69.3
%
36.2
%
77.8
%
44.2
%
66.7
%
30.2
%
75.6
%
41.5
%
69.3
%
38.1
%
80.0
%
48.7
%
65.2
%
30.9
%
77.3
%
45.4
%
69.9
%
39.1
%
2 &above
3 &above
2 &above
3 &above
2 &above
3 &above
2 &above
3 &above
2013 2014 2015 2016
Total Public NYC Charters All Charters Rest of State Charters
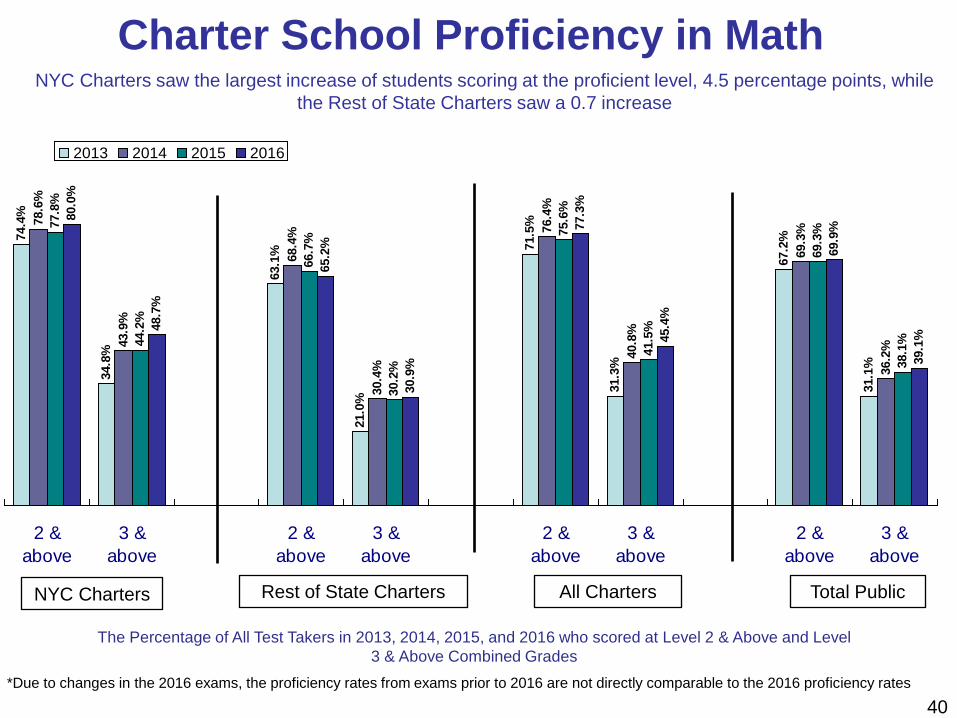
Charter School Proficiency in Math
The Percentage of All Test Takers in 2013, 2014, 2015, and 2016 who scored at Level 2 & Above and Level 3 & Above Combined Grades
NYC Charters saw the largest increase of students scoring at the proficient level, 4.5 percentage points, while the Rest of State Charters saw a 0.7 increase
*Due to changes in the 2016 exams, the proficiency rates from exams prior to 2016 are not directly comparable to the 2016 proficiency rates
35.0
%
9.8%
67.2
%
31.1
%37.3
%
12.1
%
70.3
%
35.6
%
72.5
%
39.1
%
69.3
%
36.2
%
37.4
%
12.7
%
76.9
%
40.6
%
72.0
%
40.7
%
69.3
%
38.1
%
37.5
%
11.5
%
78.5
%
43.6
%
72.5
%
41.7
%
69.9
%
39.1
%
2 &above
3 &above
2 &above
3 &above
2 &above
3 &above
2 &above
3 &above
2013201420152016
Never ELLs3 Current ELLs1 Ever ELLs2 Total Public
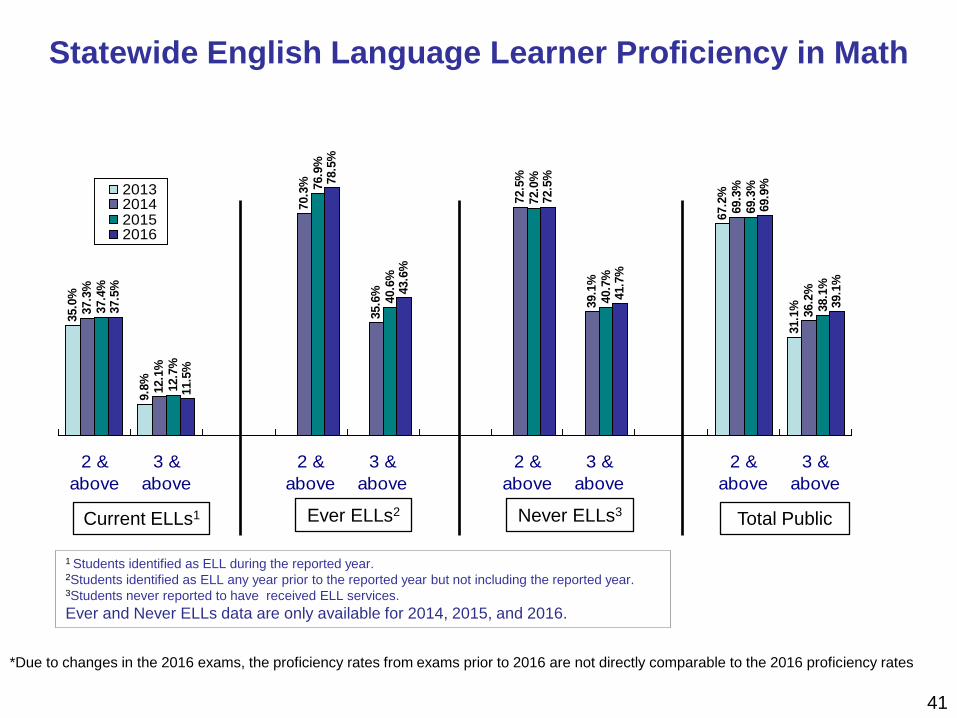
1 Students identified as ELL during the reported year. 2Students identified as ELL any year prior to the reported year but not including the reported year. 3Students never reported to have received ELL services. Ever and Never ELLs data are only available for 2014, 2015, and 2016.
Statewide English Language Learner Proficiency in Math
41
*Due to changes in the 2016 exams, the proficiency rates from exams prior to 2016 are not directly comparable to the 2016 proficiency rates
35.0
%
9.8%
67.2
%
31.1
%
41.2
%
14.0
%
71.5
%
38.1
%
69.5
%
37.3
%
69.3
%
36.2
%41.3
%
14.6
%
79.8
%
44.3
%
68.6
%
37.3
%
69.3
%
38.1
%
40.6
%
13.0
%
80.7
%
46.8
%
69.5
%
38.7
%
69.9
%
39.1
%
2 &above
3 &above
2 &above
3 &above
2 &above
3 &above
2 &above
3 &above
2013201420152016
Never ELLs3 Current ELLs1 Ever ELLs2 Total Public
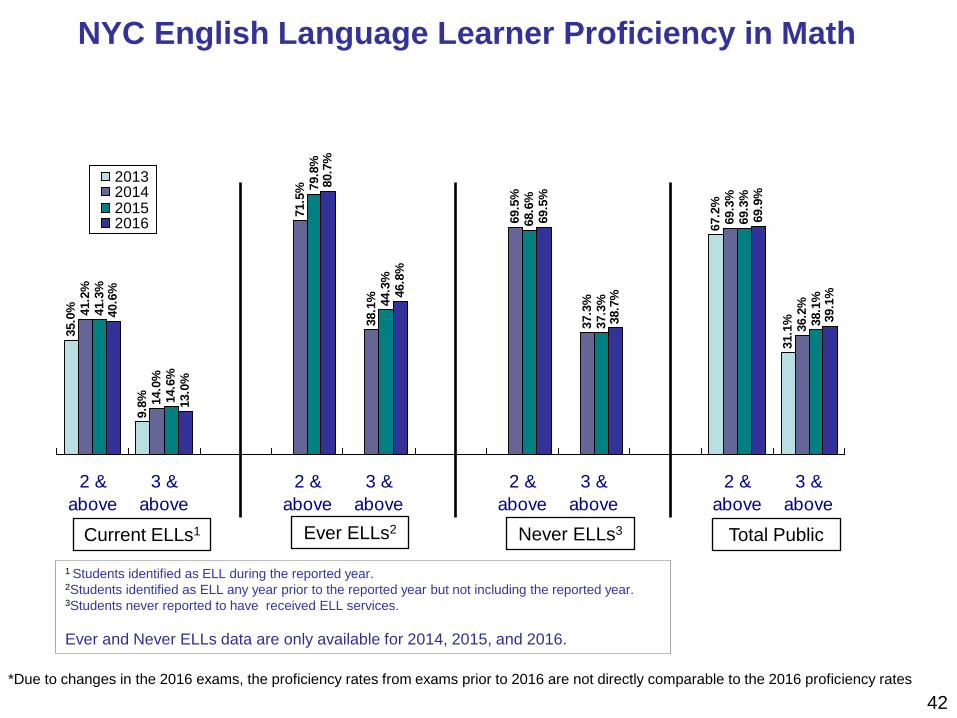
1 Students identified as ELL during the reported year. 2Students identified as ELL any year prior to the reported year but not including the reported year. 3Students never reported to have received ELL services. Ever and Never ELLs data are only available for 2014, 2015, and 2016.
NYC English Language Learner Proficiency in Math
42
*Due to changes in the 2016 exams, the proficiency rates from exams prior to 2016 are not directly comparable to the 2016 proficiency rates
43
29.9
%
6.8%
74.0
%
35.5
%
33.7
%
9.6%
76.4
%
41.6
%
34.3
%
10.6
%
76.6
%
43.9
%
35.3
%
10.9
%
77.2
%
45.0
%
2 & above Students withDisabilities
3 & above Students withDisabilities
2 & above GeneralEducation
3 & above GeneralEducation
2013 2014 2015 2016
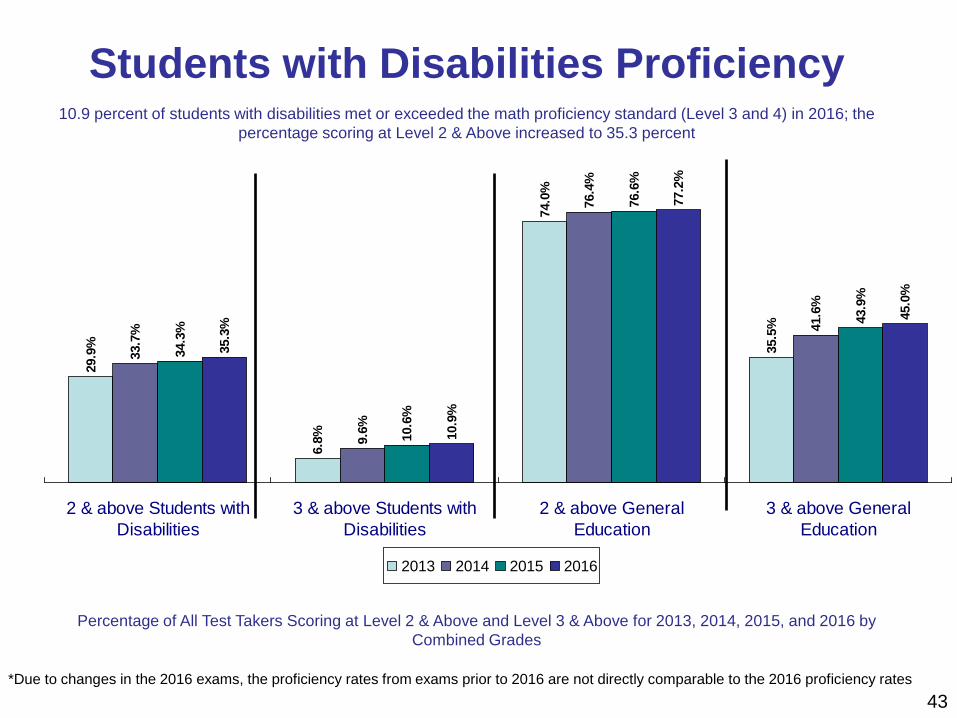
Students with Disabilities Proficiency 10.9 percent of students with disabilities met or exceeded the math proficiency standard (Level 3 and 4) in 2016; the
percentage scoring at Level 2 & Above increased to 35.3 percent
Percentage of All Test Takers Scoring at Level 2 & Above and Level 3 & Above for 2013, 2014, 2015, and 2016 by Combined Grades
*Due to changes in the 2016 exams, the proficiency rates from exams prior to 2016 are not directly comparable to the 2016 proficiency rates
2016 Not Tested
and Test Refusal Data
44
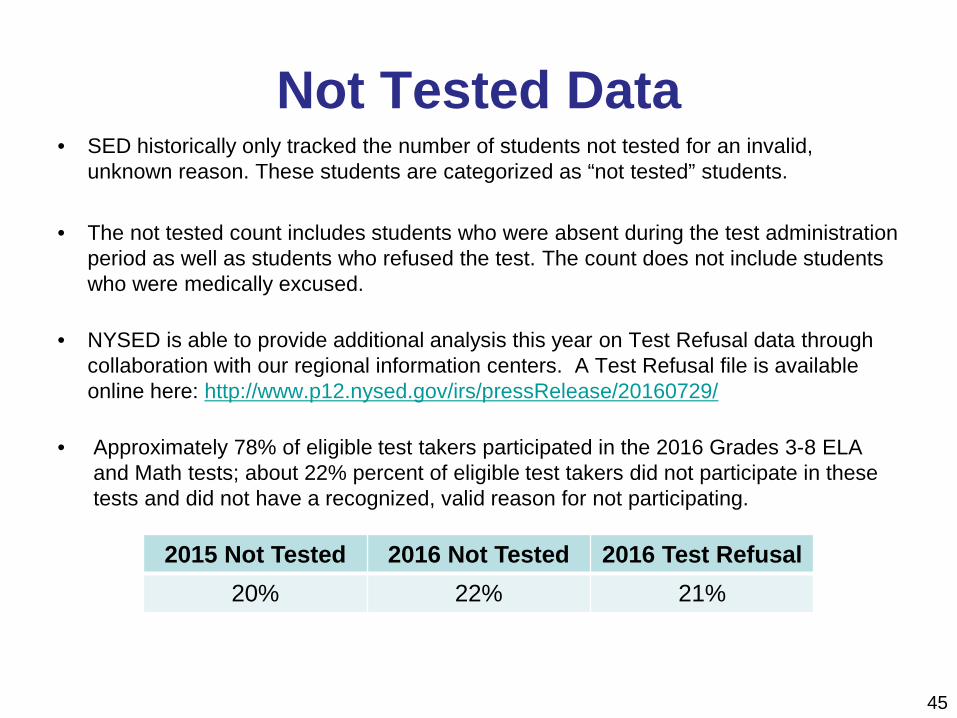
Not Tested Data • SED historically only tracked the number of students not tested for an invalid,
unknown reason. These students are categorized as “not tested” students.
• The not tested count includes students who were absent during the test administration period as well as students who refused the test. The count does not include students who were medically excused.
• NYSED is able to provide additional analysis this year on Test Refusal data through collaboration with our regional information centers. A Test Refusal file is available online here: http://www.p12.nysed.gov/irs/pressRelease/20160729/
• Approximately 78% of eligible test takers participated in the 2016 Grades 3-8 ELA and Math tests; about 22% percent of eligible test takers did not participate in these tests and did not have a recognized, valid reason for not participating.
45
2015 Not Tested 2016 Not Tested 2016 Test Refusal 20% 22% 21%
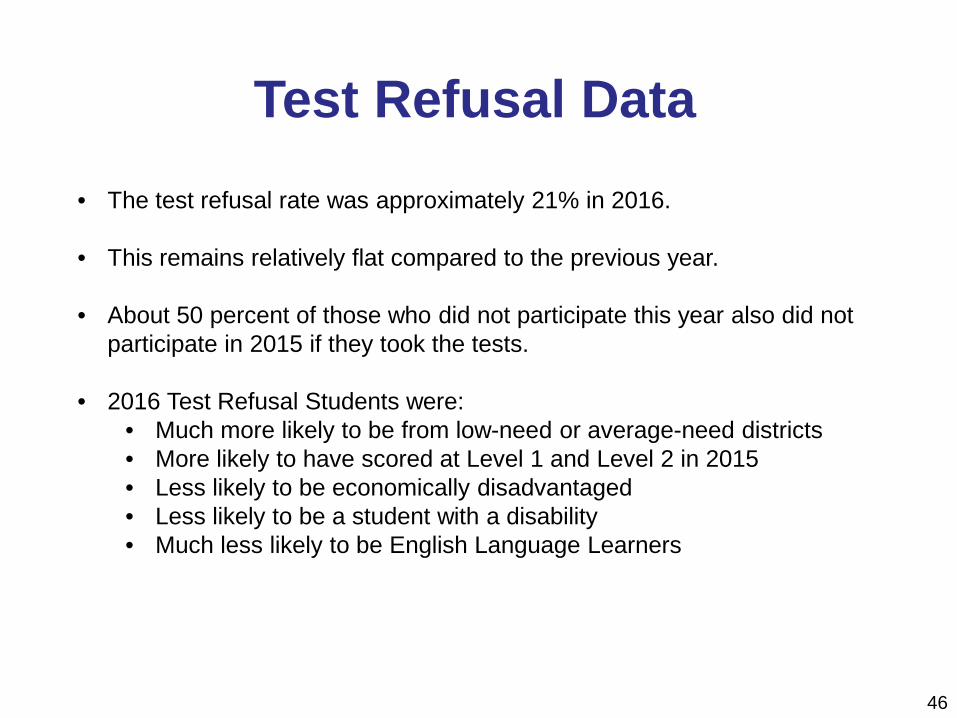
• The test refusal rate was approximately 21% in 2016.
• This remains relatively flat compared to the previous year.
• About 50 percent of those who did not participate this year also did not participate in 2015 if they took the tests.
• 2016 Test Refusal Students were: • Much more likely to be from low-need or average-need districts • More likely to have scored at Level 1 and Level 2 in 2015 • Less likely to be economically disadvantaged • Less likely to be a student with a disability • Much less likely to be English Language Learners
Test Refusal Data
46
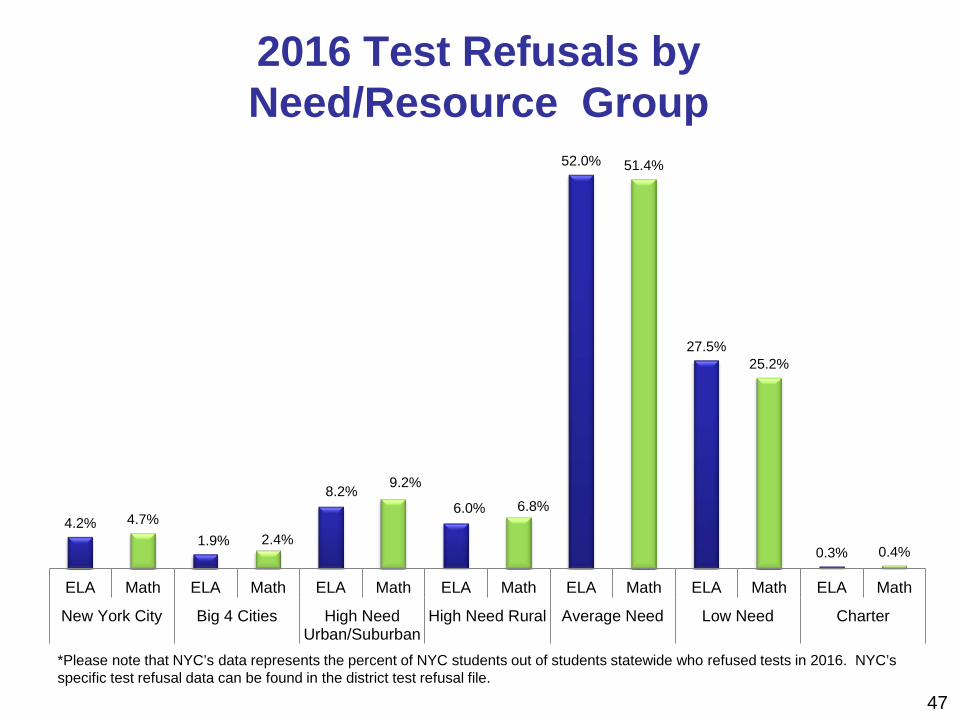
4.2% 4.7% 1.9% 2.4%
8.2% 9.2%
6.0% 6.8%
52.0% 51.4%
27.5% 25.2%
0.3% 0.4%
ELA Math ELA Math ELA Math ELA Math ELA Math ELA Math ELA Math
New York City Big 4 Cities High NeedUrban/Suburban
High Need Rural Average Need Low Need Charter
2016 Test Refusals by Need/Resource Group
47
*Please note that NYC’s data represents the percent of NYC students out of students statewide who refused tests in 2016. NYC’s specific test refusal data can be found in the district test refusal file.
Conclusion
• Overall, students scoring at the proficiency level increased, especially in ELA
• Work remains to improve scores across the board
• Multi-year process to make improvements to standards, curriculum and testing will continue
48
Recommended