Marshall UniversityMarshall Digital Scholar
Theses, Dissertations and Capstones
2014
Measuring the success of Kentucky's communityand technical college system in educationalattainment and advancing workforce developmentWilliam Daniel [email protected]
Follow this and additional works at: http://mds.marshall.edu/etdPart of the Community College Education Administration Commons
This Dissertation is brought to you for free and open access by Marshall Digital Scholar. It has been accepted for inclusion in Theses, Dissertations andCapstones by an authorized administrator of Marshall Digital Scholar. For more information, please contact [email protected].
Recommended CitationBissett, William Daniel, "Measuring the success of Kentucky's community and technical college system in educational attainment andadvancing workforce development" (2014). Theses, Dissertations and Capstones. Paper 798.
MEASURING THE SUCCESS OF KENTUCKY’S COMMUNITY AND
TECHNICAL COLLEGE SYSTEM IN EDUCATIONAL ATTAINMENT AND
ADVANCING WORKFORCE DEVELOPMENT
A Dissertation submitted to the Graduate College of
Marshall University
In partial fulfillment of the requirements for the degree of
Doctor of Education
in Educational Leadership
by William Daniel Bissett, M.A.J.
Approved by Dr. Dennis M. Anderson, Chairperson
Dr. Steven Banks Dr. Luke Eric Lassiter
Dr. Louis Watts
Marshall University May 2014

ii
COPYRIGHT PAGE
iii
DEDICATION
This dissertation is dedicated to my Alma Mater, Marshall University. Throughout my life, I have been fortunate to always have a connection to
Marshall University. As a high school student from nearby Barboursville, West Virginia, I attended conventions, speeches and sporting events at Marshall’s Huntington Campus. I earned my undergraduate from Marshall and was able to meet people of different cultures and countries, as well as having the opportunity to study abroad for a semester and receive my Commission in the United States Army. While earning my Master’s at Marshall, I was able to pursue a new career in journalism. And the doctoral degree in education that requires this study allowed me to gain greater knowledge of higher education and its many facets while serving as Marshall University’s Chief of Staff / Senior Vice President of Communications. As I write this dedication, I remain a proud Alumnus of Marshall University and continue my connection to the institution through teaching online and serving my Alma Mater in several capacities.
Like any institution created and maintained by human beings, Marshall University has its flaws and shortcomings, but it deserves recognition for benefiting so many people, especially those first-generation students who call Appalachia home.
While I could write for many more pages, my appreciation for this institution is best reflected in the second verse of Marshall University’s Alma Mater:
May the years be kind to Marshall;
May she grow in fame;
May her children fail her never
True to her beacon flame
May her spirit brave and strong
Honor right and conquer wrong;
This the burden of our song
Ever her truth proclaim.
iv
ACKNOWLEDGMENTS
There are many people who played an important role in the completion of this dissertation. First and foremost, I acknowledge and thank my doctoral committee chair, Dr. Dennis Anderson, for his unwavering support in my efforts. While his bluntness and inability to suffer fools is legendary, I wish more people knew of his kindness and loyalty. I also thank and acknowledge Drs. Steven Banks, Luke Eric Lassiter, and Louis Watts for their service on my doctoral committee. Their guidance and expertise was invaluable. The board of the Kentucky Coal Association (KCA) and the staff of KCA also deserve my thanks. They were supportive of my efforts to complete my doctoral degree throughout the completion of my coursework and the dissertation process. Dr. Stephen J. Kopp, President of Marshall University, might be my former boss, but he remains a solid supporter of my educational pursuits. I also thank him for the opportunity to serve as Chief of Staff / Senior Vice President of Communications of my Alma Mater, which coincided perfectly with this recent educational experience. Thank you to Joe Craft and Alliance Coal for reimbursing me for my tuition in the final four years of this program. Your support of my educational efforts will not be forgotten. I also must recognize Dean Teresa Eagle of the College of Education and Professional Development for insisting that I remain in the doctoral program when I considered quitting after moving to the President’s Office. Her counsel was correct. Dr. Carol Perry, whose dissertation served as one of the models for this study, was of great help to me. Her quickness to assist me in my efforts was a great example of collegiality between students. While this dissertation might still exist without her involvement, the assistance of Wendy VanDyk Evans was of great help in making this dissertation more accessible to the reader and is highly recommended to any person in need of a good editor. Without the help of Dr. Kate Shirley Akers and Barrett M. Ross of the Kentucky Center for Education and Workforce Statistics, I would not have had access to the data I needed to complete this dissertation. Their kindness and quick action are a great reflection of public employees in the Commonwealth of Kentucky. The numerous educators in my family demonstrated to me the importance of education and its importance to our society. Their service to students deserves more recognition than I can give here. To my mother and father, Bill and Anna May Bissett, who are probably hoping this doctoral degree is my final bout with higher education. While I cannot make any promises, their love and support have made me who I am.
Lastly, I would be remiss not to recognize my wonderful wife, Lara, and our two blessings, Molly Kat and Maggie Jane. They are my motivation for so many things, and I remain grateful for their love and support.

v
TABLE OF CONTENTS
DEDICATION………………………………………………………………………..
iii
ACKNOWLEDGEMENTS…………………………………………………………..
iv
TABLE OF CONTENTS……………………………………………………………
v
LIST OF TABLES……………………………………………………………………
vii
LIST OF FIGURES…………………………………………………………………
viii
ABSTRACT………………………………………………………………………….
ix
CHAPTER I. INTRODUCTION……………………………………………………...
Background Statement of the Problem Research Questions Significance of the Study Operational Definitions Methods Limitations Summary
1
II. REVIEW OF THE LITERATURE……………………………………. Kentucky Community and Technical College System (KCTCS) Scrutiny of KCTCS Competition From Public Four-Year Institutions and KCTCS Conclusion
11
III. RESEARCH METHODS……………………………………………… Research Design Population Data Collection Data Analysis Research Questions Null Hypothesis Summary
30
IV. PRESENTATION AND ANALYSIS OF DATA…………………….. Data Collection Research Questions Data Analysis Research Findings Summary
35

vi
V. CONCLUSION AND RECOMMENDATIONS……………………… Summary of Purpose Summary of Procedures Summary of Findings Summary of Ancillary Findings Limitations Recommendations for Future Research Conclusion
42
REFERENCES………………………………………………………………………. APPENDIX A………………………………………………………………………...
50 55
APPENDIX B………………………………………………………………………...
57
APPENDIX C………………………………………………………………………... 59 APPENDIX D………………………………………………………………………...
68
VITA………………………………………………………………………………….
72
vii
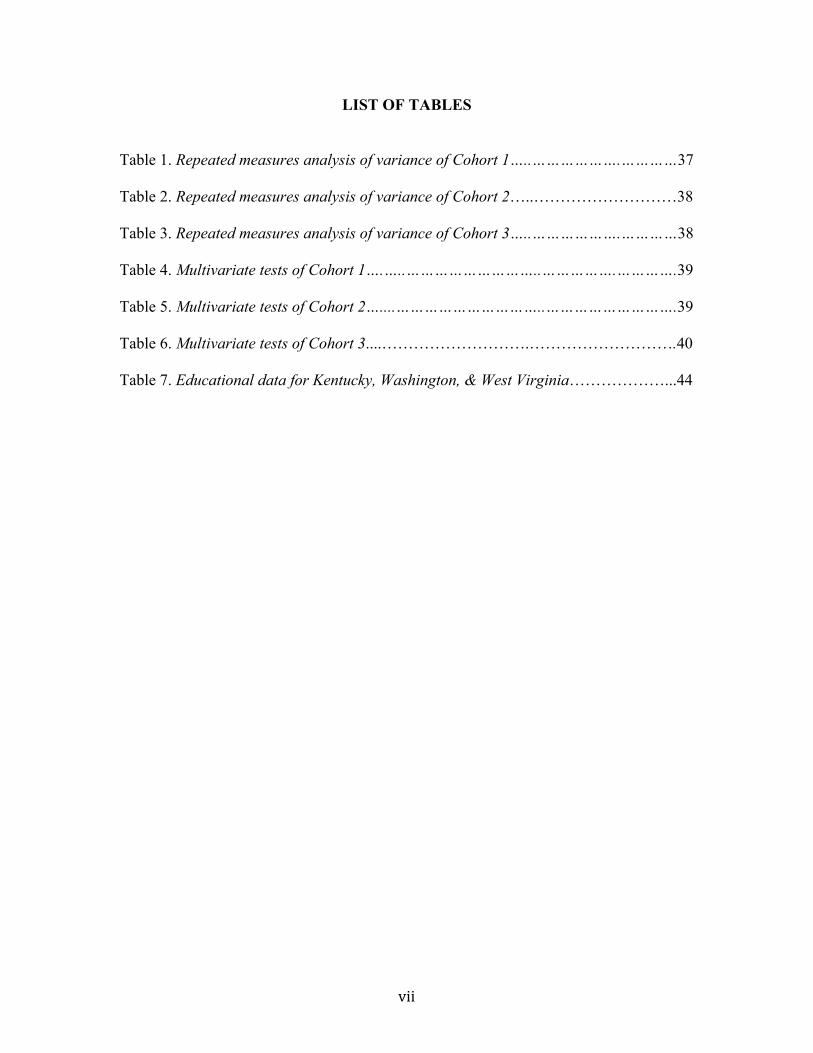
LIST OF TABLES Table 1. Repeated measures analysis of variance of Cohort 1…..……………….…………37
Table 2. Repeated measures analysis of variance of Cohort 2…..………………………38
Table 3. Repeated measures analysis of variance of Cohort 3…..……………….…………38
Table 4. Multivariate tests of Cohort 1….…..………………………..…………….………….39
Table 5. Multivariate tests of Cohort 2…....…………………………..……………………….39
Table 6. Multivariate tests of Cohort 3....……………………….……………………….40
Table 7. Educational data for Kentucky, Washington, & West Virginia………………...44

viii
LIST OF FIGURES Figure 1. Number of community colleges in the United States, 1901-2004.…………......13
Figure 2. Kentucky Education Attainment 25+ years of age, 2007-2011 estimates…...…19
Figure 3. KCTCS main and satellite campus locations…………………………….........20
Figure 4. 2006-2010 lobbying expenses for KCTCS, Kentucky’s four-year public
institutions, and other state CTC systems……………........…………….…...…..22
Figure 5. Enrollment in Kentucky’s public postsecondary institutions, 2006-2010……..24
Figure 6. Enrollment by Kentucky CTC, 2006-2010………………………………….….25
Figure 7. Six-year completion rate of two- and four-year colleges by race, 1995-1996...27
ix
ABSTRACT
This study examined the educational attainment and income of nontraditional
students in the Kentucky Community and Technical College System (KCTCS) and its
connection to workforce development efforts in the Commonwealth of Kentucky. The
population for this study included first time students between 25 and 64 years of age who
attended KCTCS either full-time or part-time during the academic years of 2006-2007,
2007-2008, and 2008-2009. The Kentucky Center for Education and Workforce Statistics
provided archival data that included information from this population regarding the type
of educational credential earned. The data were analyzed to determine the relationship
between the types of credentials and the median income of the students over four years.
After analysis, it was determined that the median income of these nontraditional students
increased significantly upon completion of an educational credential, with the academic
year of 2007-2008 showing a slightly less significant increase than the other two
academic years.
1
CHAPTER ONE: INTRODUCTION
An ever-expanding American Dream: this is the legacy – and the promise – of the community college system in America. It’s a system based on the principle that we all have a stake in one another’s success. Because when we invest in one another’s dreams, our communities benefit, our states benefit, and ultimately our entire nation is lifted up. We are in a moment when folks are finding it harder and harder to get ahead. You need new skills to compete, and everything – especially education – costs more. That’s why it’s time to call upon our community college systems once again. To make sure that the 21st century is just as much the American Century as the 20th. To put a little wind at the backs of the American people, and to put more of them on the pathway to their dreams (Obama, 2008).
Elected officials at all levels in the United States have been strong advocates of
community and technical colleges and their ability to improve the workforce. Community
and technical colleges are recognized for offering a chance at higher education, and its
associated stability and earning potential, to individuals who did not follow the traditional
path to a college degree. Such political advocacy usually results in increased funding for
the expansion of community college programs.
According to the Kentucky Occupational Outlook to 2018, which was published
by the Kentucky Education and Workforce Development Cabinet, the job classifications
that will see the most growth in Kentucky from 2008 to 2018 will be Healthcare Support
(24.9%), Healthcare Practitioners (21.1%), and Computer and Mathematical (20.2%).
Additionally, employment opportunities that require at least postsecondary vocational
training are projected to increase by 13.1%, while those occupations requiring only work
experience in a related occupation or on-the-job training will increase at a much slower
rate of 5.3%. The authors of the Outlook concluded, “Obtaining a postsecondary degree
offers more job opportunities, increased job security, and greater potential for financial
gain” (Kentucky Education and Workforce Development Cabinet, 2010, p. 2).

2
An important benchmark of the success of community and technical colleges is
measured by the education of individuals who did not follow a traditional track of high
school to college or who failed to complete high school. Kentucky’s high school
graduation rate (69.11%) is slightly below the national average (70.06%). Given the
Outlook’s conclusions for future opportunities, it is important to explore whether
Kentucky’s community college system is successful in reaching these low-skilled adults
aged 25 to 64 years old, who will find future employment increasingly difficult
(Kentucky Education and Workforce Development Cabinet, 2010).
Background While many of the academic resources related to nontraditional students and their
educational attainment indicate a lack of research in this area, there are references
available and are best compiled into four groups: Academic, Not-for-profit, Government,
and Business sources.
Academic Sources. David Prince and Davis Jenkins’ Building Pathways to
Success for Low-Skill Adult Students: Lessons for Community College Policy and
Practice from a Statewide Longitudinal Tracking Study (2005) focused on educational
achievement by nontraditional students in the State of Washington. Prince and Jenkins
sought to understand the success rates of students who had not matriculated as expected
and who entered postsecondary education at 25 years or older. Additional research in
their study included other possible academic challenges, identified by such markers as
participation in English as a Second Language (ESL) programs. Research was conducted
on every nontraditional student in Washington State’s community and technical colleges

3
for two academic years, 1996-1997 and 1997-1998. The findings included completion
percentages of educational credentials (Associate in Arts, Associate in Science, or
certificate) with students separated by other categories, such as ESL. The results also
suggested an increased income as the level of educational attainment increased.
The second academic source is Creating Pathways for Low-Skill Adults: Lessons
for Community and Technical Colleges from a Statewide Longitudinal Study (Perry,
2012). Using similar methodology as the Prince and Jenkins study, but in the State of
West Virginia, this study also compared United States Census results from 2010 and data
from West Virginia’s Community and Technical College System to identify relationships
between nontraditional students, educational attainment, and annual earnings. Perry also
differentiated between momentum point achievement (passing a critical course needed
for academic completion) and milestone achievement (earning an academic credential).
These two levels of achievement are connected, but are measured separately.
Not-for-profit Sources. Groups, such as the Ford Foundation, have conducted
research into educating underprepared workers for occupations that are expected to be in
great demand in the near future. Bridges to Opportunity for Underprepared Adults: A
State Policy Guide for Community College Leaders (2008) identified six states, including
Kentucky, that need improvement and suggests how state leaders can meet the specific
needs of their potential students. The Ford Foundation’s study combined successful case
studies, suggested strategies, and a method of measurement to gauge results in creating a
state community and technical college system that better serves the needs of both
students and employers.

4
Davis Jenkins’ A Short Guide to “Tipping Point” Analyses of Community College
Student Labor Market Outcomes (2008) is a product of the not-for-profit Community
College Research Center at Columbia University. This publication suggested methods to
measure the employment outcomes of graduates from community and technical colleges.
Beyond earning an educational credential, Jenkins suggested a “tipping point” where
enough credit hours are earned to change the economic earning ability of the student.
Other factors that are monitored include the grades that are earned and other challenges to
the student, such as ESL, remedial education programs like Adult Basic Education (ABE),
and socio-economic status. Jenkins concluded that institutional leaders need to be aware
of potential challenges that may cause students to not continue their education.
In 2011, Patrick Kelly of the National Center for Higher Education Management
Systems (NCHEMS) authored Realizing Kentucky’s Educational Attainment Goal: A
Look in the Rear View Mirror and Down the Road Ahead. NCHEMS, a not-for-profit
organization, commissioned this report after the passage of House Bill 1 (HB1) by the
Kentucky General Assembly in 2010. HB1 was legislation designed to build a statewide
higher education system that was devoted to public good and not to the needs of
individual institutions. Using the passage of HB1 as a starting point, Kelly measured
where success has occurred with postsecondary education in Kentucky, using metrics
such as degree completion with an emphasis on nontraditional students. He also
examined earnings during this period and differentiated between careers in
Science/Technology/Engineering/Math (STEM), Healthcare, and Other (unrelated to
STEM or Healthcare) academic disciplines. Achievement by race and ethnicity is also

5
reported. Kelly found Kentucky to be one of the most improved postsecondary
educational systems in the nation, especially among nontraditional students.
Government Sources. Jennifer Cheeseman Day and Eric Newburger’s The Big
Payoff: Educational Attainment and Synthetic Estimates of Work-Life Earnings was
published by United States Census Bureau in 2002. This study created a method of
measurement for added value that a student achieves after completing an education
credential at the high school or college level. The study used synthetic estimates, which
are described as estimates of work-life earnings for a 40-year range of employment.
Using information from only the month of March with the 1998, 1999, and 2000 editions
of the Current Population Survey, the authors measured earnings as well as the
percentage of full-time employment by level of educational attainment and differences in
the results based on sex and age. From a national perspective, this study concluded that,
for the period of time studied, people in the United States are more educated when
compared to previous studies, that education results in higher earnings, and that education
is worth the investment of time and expense based on the return.
The second government source related to the topic is the Kentucky Occupational
Outlook to 2018: A Statewide Analysis of Wages, Employment, Growth and Training,
which was developed by Kentucky’s Education and Workforce Development Cabinet in
2010. Written by Ron Crouch and Thomas Bowell, this report focused on employment
opportunities for 2008-2018. As in the sources previously mentioned, growth in STEM
and Healthcare occupations was expected.
Business Sources. The Kentucky Chamber of Commerce commissioned the 2011
Progress Report on Postsecondary Education. While educational attainment in higher

6
education is included, the report also examined high school preparation for postsecondary
education and found Kentucky’s K-12 system lacking in comparison to the rest of the
United States. A history of increases in tuition rates by postsecondary institutions was
also detailed.
Lastly, the United States Chamber of Commerce’s Leaders & Laggards report in
2012 raised concerns about the United States’ declining higher education system as
compared to other countries. In addition to looking at postsecondary education nationally,
the report also contained a state-by-state outlook. The Kentucky section gives the
Commonwealth a mixed letter grade based on the categories of Student Access & Success,
Efficiency & Cost-Effectiveness, Meeting Labor Market Demand, Transparency &
Accountability, Policy Environment, and Innovation. Four-year and two-year institutions
are graded separately. In most cases, the two-year institutions outperformed the four-year
institutions in these categories, based on the grades in this report.
Statement of the Problem
While some sources suggest that education in Kentucky is improving, the United
States Chamber of Commerce continues to give Kentucky’s post-K-12 education lower
than average grades for categories such as Meeting Labor Market Demand and Student
Access and Success (News release, 2012; United States Chamber of Commerce, 2012). It
is important that most of these sources do differentiate between two- and four-year
degree programs and explain that better results are being found within the two-year
programs. These lower than average grades make for greater challenges for low-skill
adults who have either a high school diploma or less education, as finding and keeping

7
employment for them will only become more difficult in the future. This study, a
longitudinal data analysis of these students that includes information about their level of
achievement educationally and their level of success with employment, will show
whether or not the community and vocational institutions are correcting this educational
shortfall. Given the importance that elected leaders and others place upon improving
postsecondary education for nontraditional students, there are clear policy implications
related to the level of success of these educational programs.
Research Questions
In comparing the data on the workforce of Kentucky and the low-skilled 25 to 64-
year-old demographic in question, the following research questions guided the study:
1. Are there any significant differences between the type of educational
credential program (diploma, certificate, associate degree) of nontraditional
students and their median income?
2. Are there any significant differences over time between the educational
attainment of nontraditional students and their median income?
Significance of the Study
With similar research conducted in Washington and West Virginia, this analysis
in Kentucky gives a comparison to the previous work. With this comparison, future
researchers may glean an understanding of whether these issues affecting workforce
development are unique to individual states or are reflected on a national scale (Prince &
Jenkins, 2005; Perry, 2012). Moreover, if state and federal governments are heavily

8
investing in community and vocational education, then there needs to be a demonstrated
return on this investment of public funds for the student, the potential employer, and the
taxpayer. By going beyond the achievement of an educational credential and
understanding the connection to a better workforce in Kentucky, this study not only
informs the individual that such educational pursuit is worthwhile, but also allows every
Kentuckian to understand the benefits of an improved workforce that can maintain
current employers as well as attract new employment opportunities to Kentucky.
Operational Definitions
Educational Attainment: An academic certificate, credential, or degree that is
earned with the completion of an educational program.
KCTCS: The Kentucky Community and Technical College System (KCTCS),
the statewide community college system that includes 16 individual colleges (KCTCS
System, 2007).
Nontraditional Student: An individual who is pursuing education, but not
immediately following his or her secondary school experience due to some interruption
between finishing high school and matriculating to some form of higher education.
Methods
This study is quantitative in nature. Using a longitudinal study, data were
analyzed from the Kentucky Center for Education and Workforce Statistics (KCEWS).

9
The timeframe of the data analyzed was from the academic years of 2006-2007, 2007-
2008, and 2008-2009. Although no individual student information was used, KCEWS did
provide detailed aggregate information on median student income after graduation by
quarter and educational credential obtainment of students through KCTCS programs.
Limitations
The research and analysis of this study pertains only to Kentucky and the impact
of KCTCS’s programs on the Commonwealth’s workforce of nontraditional students. It is
not designed to identify why these nontraditional students failed to follow traditional
educational paths. Additional limitations include:
• This study does not address economic factors that would increase or
decrease the success rate in increasing the educational attainment of
Kentucky’s workforce.
• This study only reviewed data involving 25- to 64-year old students and
did not review any data for traditional college students who are 18 to 24
years of age.
• If a nontraditional community college student lived in a state other than
Kentucky after graduation, this student’s information would not have been
included in the study.
• Additional education beyond the KCTCS was not considered as a factor in
possible earning or employment stability.
10
Summary
In order for postsecondary education to transform the lives of nontraditional
students for their financial benefit and for the improvement of Kentucky’s workforce, it is
critical that these results be measured for effectiveness and compared to the results of
other states with similar programs and challenges. There is an opportunity for future
studies to compare Kentucky’s system to the systems studied in Washington and West
Virginia. Beyond these three states, this study can be of benefit to other state systems in
reviewing their level of success by comparison, in addition to offering further
opportunities for scholarship by conducting similar research and analysis in the
remaining states.

11
CHAPTER TWO: REVIEW OF THE LITERATURE Since 1901, Community and Technical Colleges (CTCs) have provided an
education to their students that, in many cases, would not have been available from other
types of institutions. As one author points out, it is a choice “not between the community
college and a senior residential institution; it is between the community college and
nothing” (Ayers, 2010, p.1). With 90% of Americans living within a 25-mile radius of
one of the country’s 1,269 community colleges, this type of postsecondary education
reaches a larger and more diverse audience than any of its counterparts (Ayers, 2010).
This nationwide scope also allows CTCs to serve as conduits to four-year degree
programs, as nearly half of all undergraduates in the United States are also enrolled in
CTCs (AACC Fast Facts, 2013).
Due to the proliferation of CTCs across the United States, the number of students
educated by CTCs is equally significant (AACC past to present, 2013). Although the
United States is now a more educated country than at any time in its history, this increase
in education is best revealed within the classrooms of CTCs (Carnevale & Desrochers,
2003). In 2009, eight million students took classes for credit from CTCs, which is an
increase of more than 17% from 2007. The American Association of Community
Colleges (AACC) attributes this increase to several factors, including the weak economy
during the same period. By serving students who tend to be nontraditional, low-income,
members of a minority, or some combination of these factors, CTCs have positioned
themselves to be more welcoming than other postsecondary institutions. Although the
literature would suggest that CTCs have succeeded in bringing these high-risk students to
their campuses, they have been less successful in graduating these same students or
12
having them earn educational credentials (Rutschow, Richburg-Hayes, Brock, Orr, Cerna,
Cullinan, Kerrigan, Jenkins, Gooden & Martin, 2011).
Beyond their significant footprint in the United States and the broad audience they
serve, CTCs also face a changing mission as it relates to their existence. Since 2004,
direction regarding CTCs and their mission has come from the Department of Labor
instead of their former directing agency, the Department of Education (LexisNexis, 2012).
The rationale for this change by President Clinton’s administration was to have a greater
focus on the economic benefits provided by a CTC education. Beyond the obvious
benefit to the student in earning an education that would hopefully provide a livelihood as
well as an increase in income and stability, the benefit to workforce development was
also considered to be an important aspect of CTCs. Although CTCs had always been
considered job training institutions, especially in American popular culture, professor of
higher education at the University of North Carolina at Greensboro David Ayers warns
that too much control is being placed in corporate boardrooms and suggests that the local
community be the arbiter of the educational priorities of CTCs. Ayers believes that CTCs
should be less concerned about supplying employers with better employees and more
connected to the needs and interests of their students. Beyond workforce development,
Ayers believes that the history of CTC education connects to a public good because when
“one American learned, all benefited” (Ayers, 2010, p. 2). He expands this belief in
public good to include the development of future leaders within a community who can
address local issues such as water quality and malnutrition, while also creating a more
informed and engaged public that can think critically. Although his position is in contrast
with multiple federal administrations and corporate supporters of CTCs, Ayers expresses

13
concern that the CTC student is seen as nothing more than a means to an end wherein the
higher-risk student becomes part of an increasingly educated society, but also becomes a
more educated workforce. To Ayers, CTCs cannot simply educate students “to take their
place in a global society shaped by corporate interests” (Ayers, 2010, p.3).
Another potential conflict similar to the needs of the individual student versus the
need for an educated workforce can be found in the history of CTCs. The rapid growth of
CTCs during the past one hundred years started within local school districts or
universities themselves. As shown in Figure 1, the number of CTCs in the United States
has increased every year since 1901 (Phillippe & Patton, 2005).
Figure 1. Number of community colleges in the United States, 1901-2004.
After the Morrill Act of 1862 granted that all United States citizens should have
access to higher education, there eventually was a need to combine liberal education and
vocational training for a number of reasons, such as a growing population, a lack of seats
within traditional higher education institutions, and a lack of trained workers for an
14
increasingly technical industrial base (Phillipe & Patton, 2005). In 1901, Joliet Junior
College was established and is considered to be the first American community college.
Located on the south side of Chicago and constructed from an expanded high school, it
was established to serve first-generation college students who could not afford to attend a
traditional four-year institution (Wechsler, Goodchild & Eisenmann, 2008).
Throughout the twentieth century, many CTCs were established across the United
States for the same reason as Joliet Junior College, in addition to other reasons. Although
the high school-based version like Joliet was the most successful, other versions included
teacher institutes, vocational education centers, and citizenship schools. In some cases,
the precursor to the modern CTC was an independent private school like Vincennes
University in Indiana that created a CTC similar to traditional four-year higher education,
but with smaller classes and better student-faculty ratios (AACC Historical information,
2013).
Other socioeconomic changes in the United States also contributed to the need for
more CTCs. Although the Depression of the 1930s made additional job training
opportunities a way to ease widespread unemployment, the 1948 Truman Commission
suggested that a network of CTCs could better serve local needs and give greater access
to the G.I. Bill in the United States during the post-World War II era. The Truman
Commission also suggested that an expanded system of higher education would serve to
create a more democratic society and was clearly a public good (AACC past to present,
2013; Ayers, 2010).
As mentioned previously, the growth of CTCs was not without conflict that often
related directly to the mission of CTCs. Pederson (Wechsler et al., 2008) suggests that
15
there is a clear distinction between two different schools of thought related to the mission
of CTCs. One group of CTC scholars, labeled by Pederson as “Critics,” suggests that the
true of mission of CTCs is “the diversion of socially and economically disadvantaged
students away from the baccalaureate and into vocational programs, leading to careers of
inferior status and limited opportunity” (Wechsler et al., 2008, p. 565). In opposition to
this damaging position is another group of scholars, whom Pederson labels as
“Academics,” who describe CTCs as “a democratizer of access and…the principal means
by which higher education has been brought within the reach of virtually all Americans”
(Wechsler et al., 2008, p. 566). Pederson attempts to make sense of this ongoing conflict
by suggesting that each individual CTC is the product of its origins and leadership. Like
Ayers, Pederson is concerned that without the traditional input of faculty and other
contributors through shared governance, the direction of a local CTC will be decided by
the administration, its board, and other community leaders who possess influence. To
varying degrees, the control of a CTC is found in its connection to a high school or
university, or to the community where it resides, or some combination of control.
Pederson suggests that it is often by necessity and not by design that these relationships
between CTCs and other organizations help to shape the mission of each CTC. Although
accreditation and other academic forces attempt to standardize CTC education, there is an
aspect of these institutions that is uniquely independent based on what Pederson calls
“the social and economic interests of the sponsoring community” (Wechsler et al, 2008, p.
566).

16
Beyond these conflicts, CTCs also face other challenges that, to some degree,
mirror those challenges faced by four-year institutions. In the Fourth Edition of the
National Profile of Community Colleges, six national challenges are listed:
1. Limited funding in combination with substantial enrollment growth
2. Increasing demand for accountability
3. Growing diversity in student body
4. Renewed emphasis on workforce and teacher preparation
5. Constantly changing technology
6. Impending turnover in community college leadership (Phillippe & Patton, 2005,
p. 3)
In addition to these six challenges, the Profile suggests that the main challenge will be
funding a broad range of services to fit the needs of a changing student population when
resources are limited, if not shrinking (Phillippe & Patton, 2005).
Several other studies address these challenges, but often from a different
perspective. Davis Jenkins of the University of Illinois at Chicago identifies two reasons
that CTCs are often unable to adequately create opportunity for disadvantaged students.
First, Jenkins explains that there is a disconnect at some CTCs between the remedial and
occupational programs when compared with the college credit and academic programs.
As CTCs often provide English as a Second Language programs and Air Conditioning
and Refrigeration training, they also are responsible for educating a portion of their
students in the Fine Arts and preparing other students to pursue a four-year program after
completing the CTC’s two-year program. Second, some CTCs fail students not only

17
because they are serving a student population that is disadvantaged and thus more
expensive to educate, but also because the CTCs are often poorly funded (Jenkins, 2003).
With these many challenges, how do policymakers and other interested people
compare CTCs and their performance? This comparison can be difficult to make,
especially when comparing CTCs located in different states. Different metrics for success
have been commonplace, but attempts have been made to standardize this information
nationally to allow better comparisons. In 2010, the National Governors Association
published a study that stressed the need for such standardization of terminology and
offered metrics to accomplish this task. CTCs featured prominently in this study, as
interest in the benefits of CTC education was well established. The end goal of the study
was that, in time, there would be a shared collection of data that could be used to improve
all postsecondary education with an emphasis upon CTC education (Reyna, 2010).
Given the different expectations for CTCs that range from creating a more
egalitarian society to workforce development, the metrics used to gauge the success of a
CTC are varied based on the expectations of the institution. A review of the literature
reveals that several different metrics exist, allowing public officials, educators,
accreditors, donors, community members, current and prospective students, and others to
measure the success of an individual CTC or state CTC system (Bailey, Calcagno,
Jenkins, Kienzl & Leinbach, 2005). Some of those metrics and the information they
provide are described below.
Graduation rates. This common metric can measure the percentage of students
who complete an education credential, or the overall production of education credentials
by the CTC, or both (Kentucky 2011, 2011).

18
Licensure and certification passage rate. This straightforward metric indicates
how CTC students fare on federal and state tests that are necessary to work in specific
fields. It provides data that compares a specific program at one CTC with the same
program at another CTC (KCTCS, 2013).
Student, faculty and staff diversity ratios. As CTCs endeavor to serve underserved
populations, they must develop a multicultural environment that it is often compared to
the environment around the CTC. A CTC can compare its diversity in sex, race, origin,
and other criteria to see how it compares to its location (Kentucky 2011, 2011).
Additional hours needed to complete certificates and associate’s degrees. When a
student must take more hours than necessary to graduate with his or her educational
credential, the cost to the institution is far greater, the benefit of educational attainment
for the student is delayed, and the cost of tuition for the student increases as well
(Kentucky 2011, 2011).
Wage index. This metric identifies CTC students who have earned an educational
credential and who increase their earning by a specified amount in the second quarter
after graduation. In some cases, emphasis is made on high wage/high demand
occupations where the student should find employment and additional income quickly
(Kentucky 2011, 2011).
Degree completion by state. Although other secondary institutions would also
contribute to this metric, CTCs are a critical component of this measurement as they are
responsible for reaching student populations that may not be able to attend any other
postsecondary education for a variety of reasons. In Kentucky, which is the focus of this
study, 39% of residents have a college degree. This low number is a cause for concern, as

19
researchers suggest that state and national college degree attainment should be 60% by
2035 to meet the expected job market. Kentucky has made progress towards this goal, but
it has a long way to go (Powell, 2013). The figure below shows the total population of
Kentuckians who are 25 years or older along with their percentages of educational
attainment as reported by the 2012 American Community Survey (United States Census,
2012).
Figure 2. Kentucky Education Attainment 25+ years of age, 2007-2011 estimates.
Kentucky Community and Technical College System (KCTCS)
Two recent studies have used similar methods to examine the postsecondary
education of nontraditional students 25-64 years of age in other states. David Prince of
the Washington State Board for Community and Technical Colleges and Davis Jenkins of
the Community College Research Center conducted this research in Washington State,
and Carol Perry of Marshall University did a similar study in West Virginia (Prince &
Jenkins, 2005; Perry, 2012). This study has been created to examine similar issues in the
Commonwealth of Kentucky.
Although Kentucky’s CTCs have performed well by several metrics and
improvements have also been made to the state’s workforce, Kentucky’s higher education
20
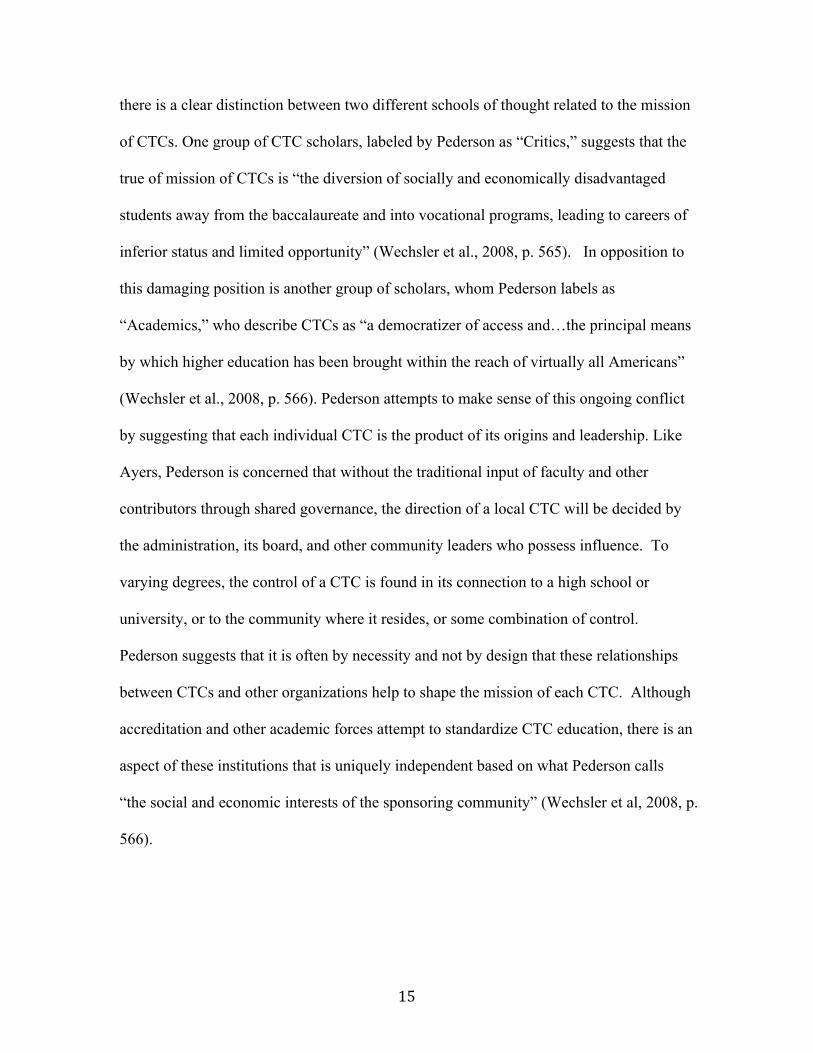
attainment rate remains below the national average. In 2011, 31% of Kentucky’s 2.3
million working-age adults (25-64 years old) had earned a two- or four-year college
degree. By comparison, the national average is 39% (Powell, 2013). Since the
establishment of the Kentucky Community and Technical College System (KCTCS) in
1997 and with the leadership of founding President and Chief Executive Officer Michael
McCall, KCTCS has merged 28 CTCs into the existing 16 CTC system, grown
enrollment to represent more than 50% of Kentucky’s postsecondary education, and
added more than 600 credit programs that result in certificates, diplomas, or associate
degrees. Beyond the remaining 16 CTCs, KCTCS also manages 65 campuses across the
state, as shown in Figure 3. (KCTCS, 2013, p. 39).
Figure 3. KCTCS main and satellite campus locations.
KCTCS has also been recognized as having a “seamless transition” between CTC
attendance and pursuing a four-year degree in Kentucky, which is not common
nationwide. KCTCS has explicit statewide policies so students will find this transition
easy to accomplish. Aspects of these policies include clear guidelines for assessment,
dual enrollment opportunities, and the sharing of data and technology (Chisman, 2004, p.

21
i).
Funding for KCTCS comes from several different categories. First, student tuition
(25% of total funding), either paid by the student directly or from another source, is a
revenue stream tied to enrollment and tuition rates. Closely connected to tuition is student
financial aid (21%) that allows lower-income students to take advantage of CTC
education. A decreasing revenue stream, in most cases, is state appropriation (34%),
which has dwindled as state budgets have decreased. Last is revenue considered in a
miscellaneous category (20%), which includes private donations, federal grants, and
other revenue unrelated to the first three categories (KCTCS System Profile, 2007).
Scrutiny of KCTCS
One source of scrutiny of KCTCS originated with Kentucky’s General Assembly.
At the direction of the General Assembly’s Program Review and Investigations
Committee, the Legislative Research Commission (LRC) conducted a study of KCTCS’
amount of spending for marketing, lobbying, and administration expenses. LRC not only
made comparisons to similar state CTC systems in Colorado, Louisiana, and Indiana, but
also to public four-year institutions in Kentucky. Recognizing that these comparisons
were not direct comparisons, this study nevertheless gave legislators a sense of how
KCTCS’ spending compared to other states and their in-state counterparts (Upton,
Littleton & Myatt, 2011). The chart below shows lobbying expenses of KCTCS from
2006-2010 and compares them to Kentucky’s public four-year institutions and the other
somewhat similar state CTC systems (Upton et al., 2011, p. 4).

22
Figure 4. 2006-2010 lobbying expenses for KCTCS, Kentucky’s four-year public
institutions, and other state CTC systems.
Co-chair of the Program Review and Investigations Committee, Kentucky
Representative Fitz Steele, explained that the cause of the study related to actions that
occurred during the 2011 legislative session. “We received several comments from
legislators who noticed a significant increase in attendance by KCTCS administrators,
staff, faculty, and students during the 2011 legislative session,” Steele said. “Rather than
have one day during the session where KCTCS would be visible at the Capitol, it seemed
each of the sixteen colleges were visiting independently and joined by both
administrators and lobbyists representing KCTCS. A second concern was a large amount
of what appeared to be costly gifts for legislators that ranged from expensive coffee cups
to other giveaways. One state senator collected these items on a table in his office to
demonstrate the amount of items being received by legislators. After this increase in both
attendance and promotional materials by a public institution, we thought it was necessary
to learn more information about the amount of money being spent on these actions as

23
well as what type of funds – public, private, or tuition dollars – were being used for these
purposes” (F. Steele, personal communication, Nov. 10, 2013).
In their report, the LRC made two recommendations to the Program Review and
Investigations Committee for their consideration. The first recommendation was to
prohibit the practice of using state funds for lobbying, which would require KCTCS and
other public institutions of higher learning to use private funds for these actions. The
LRC’s second recommendation was to have the Council of Postsecondary Education
collect and report any cost information that would create a better understanding of how
much was being spent by public institutions in marketing, lobbying, and administration
expenses, as well as the type of funds being used (Upton et al., 2013). “While the LRC’s
report was reviewed by our committee, neither of these recommendations were acted
upon,” said Steele. “After LRC’s report, the number of visits and the giveaways to
legislators by KCTCS decreased greatly” (F. Steele, personal communication, Nov. 10,
2013).
Additional scrutiny of KCTCS in the LRC report to the Program Review and
Investigations Committee focused upon the total compensation of KCTCS’ President and
Chief Executive Officer, Dr. Michael McCall. In addition to the LRC report, Kentucky
media also scrutinized McCall’s compensation after he was omitted from a statewide
news article listing the salaries of Kentucky’s leaders of institutions of higher learning.
This omission was noticed after The Chronicle of Higher Education published that in
2006-2007, McCall received approximately $611,000 when his base salary was $286,000.
It was also noted that his initial salary when hired in 1998 to be President and Chief
Executive Officer of KCTCS was $180,000 (Stinnett, 2007).

24
Although the LRC report was critical of McCall’s salary, it also contained
information about the success of KCTCS during McCall’s leadership and explained the
level of success of KCTCS in increasing enrollment as compared to other Kentucky
postsecondary institutions, as shown in Figure 5 (Upton et al., 2011, p. 4).
Figure 5. Enrollment in Kentucky’s public postsecondary institutions, 2006-2010.
Also highlighted in the report was the fact that McCall has overseen the transition of the
former collection of individual CTCs into the combined KCTCS (Upton et al., 2011). As
explained in his official biography, McCall is responsible for “an annual operating budget
of $920 million, and touches the lives of more than 500,000 citizens” (KCTCS, 2013).
McCall is also credited with leading enrollment increases at all sixteen CTCs within the
KCTCS (Upton et al., 2011, p. 5).

25
Figure 6. Enrollment by Kentucky CTC, 2006-2010.
Although criticized for his compensation, McCall remains a popular leader with
his superiors, as his November 15, 2013, retirement announcement, which will be
effective January 15, 2015, included laudatory quotes from current and former Governors
of Kentucky, past and present chairs of KCTCS’ board, and the head of the American
Association of Community Colleges, where McCall also serves as a board member
(News release, 2013).
Besides expenditures in promoting KCTCS and presidential compensation, a third
issue of scrutiny involving KCTCS related to eliminating the tenure system for future
KCTCS faculty. The issue publicly surfaced at the December 4, 2008, KCTCS board of
regents meeting, but had been discussed previously in private. A fifteen-page draft policy
was shared with the board that, if adopted, would have all future faculty hired by KCTCS
employed through a one- to four-year individual contract and serve as “at will”
employees. The rationale by the administration was that this new policy would respond

26
better to the “rapid shifts in the job market, emerging new job markets, and state budget
cuts which underscored the need for flexibility” (Alessi, 2008, p. 1).
Although KCTCS President McCall’s statements about the draft policy suggested
he was leaving this issue as a board decision, the faculty and their union representation
responded negatively and expressed concerns regarding the quality of faculty combined
with the inability to attract quality candidates, especially in rural areas (Alessi, 2008). As
one faculty member wrote in The Louisville Courier-Journal, KCTCS is “an oppressive,
expensive bureaucracy that treats faculty like bad children.” The faculty member draws
McCall into the issue by writing that if this policy was adopted, “The highest-paid
community college system president in the nation will preside over some of the lowest-
paid temporary or adjunct faculty in the nation. Is this good for our students or our state?”
(Ballard, 2009).
After a mandatory three-month waiting period for such actions, the draft policy
ending tenure for new faculty was adopted. The decision was criticized by Kentucky’s
Attorney General, members of the General Assembly, AFL-CIO, American Federation of
Teachers, Kentucky Faculty and Staff Alliance, and numerous KCTCS faculty members,
many of whom had already voiced their concerns during the three-month period prior to
the vote (Lederman, 2009).
Competition Between Public Four-Year Institutions and KCTCS
A competitive aspect of the literature related to CTCs that became apparent was a
constant comparison to four-year degree programs. These comparisons usually
highlighted CTCs’ service to populations that were underserved by four-year degree
27
programs, a more adaptive curriculum that better serves CTCs’ students and potential
employers, and a more affordable education. One example would be the AACC’s 2013
Community College Fast Facts that compares the average annual tuition of $3,130 for a
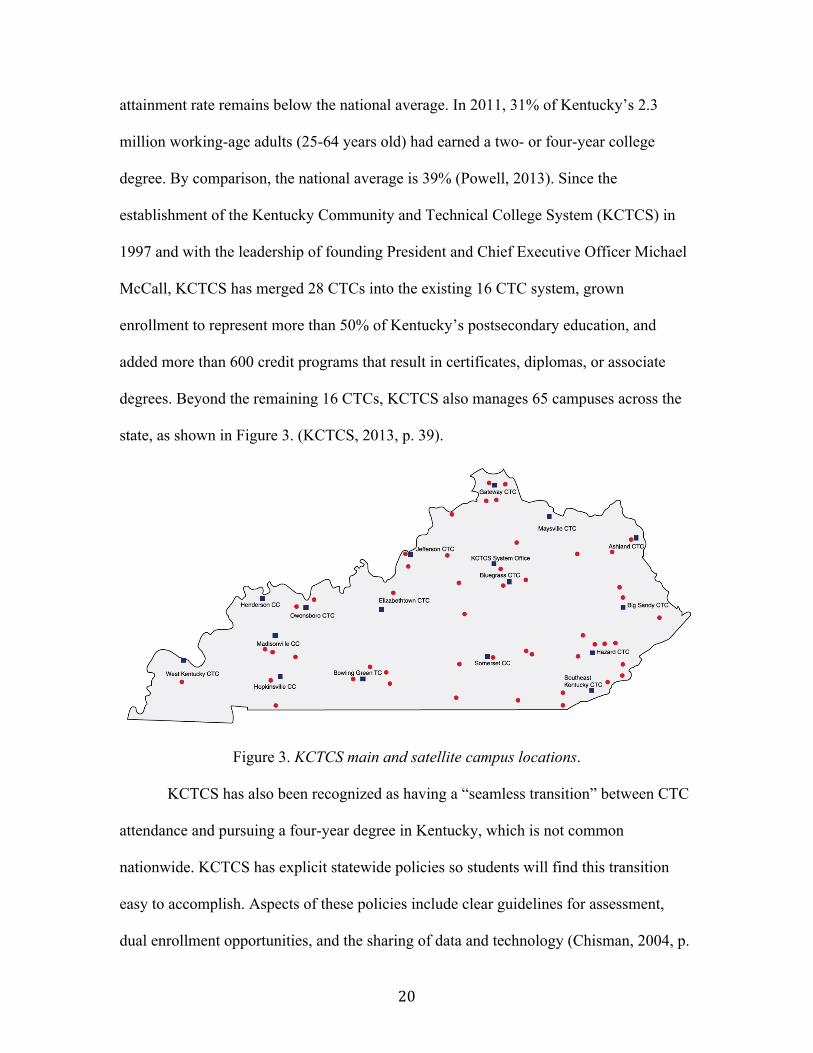
CTC to $8,660 for a similar four-year college (AACC Fast Facts, 2013). Another
comparison in the same study involves CTCs often failing to create opportunities for
disadvantaged students. This study contains a chart that compares six-year completion
rates between two-year and four-year public colleges by race, reproduced here in Figure 7
(Jenkins, 2003).
Figure 7. Six-year completion rate of two- and four-year colleges by race, 1995-1996.
In Kentucky, as in most every state, CTCs are competing with other public
postsecondary institutions for new and returning students, except for those incoming
students whose educational backgrounds allow them to enter KCTCS, but would prevent
them by admission standards to enter other public postsecondary institutions. This
competition in Kentucky is seen throughout the LRC’s report to the Program Review and
Investigations Committee. The comparisons made in the report between KCTCS and
other public postsecondary institutions included enrollment, marketing, presidential
compensation, and lobbying efforts. With regard to marketing, the need to create brand

28
awareness with potential students was highlighted, but also detailed in the report was
KCTCS’ purchasing of sponsorship opportunities at both University of Kentucky and
University of Louisville athletic events, which are two of the public institutions that
CTCs are competing against for student enrollment in some cases. While KCTCS would
also be competing against private postsecondary institutions for student enrollment,
private institutions are not listed in the LRC report, most likely because public funds
would not have been used for similar actions by the private institutions (Upton et al.,
2011).
Conclusion
Much like other educational institutions in the United States, CTCs face multiple
challenges related to funding and a changing student population during a time of budget
shortfalls and a struggling economy. CTCs are also charged to be a change agent in both
the development of the United States’ workforce and in creating access to better
opportunities for their students.
CTCs remain a popular choice for postsecondary education, not only with
students, but also with political leaders and the public. A 2004 poll of 600 adults showed
that people believe that CTCs are institutions of higher education that create opportunities
for their students (Liebowitz & Taylor, 2004). CTCs will be expected to meet numerous
challenges and high expectations for improving not only the lives of students but also the
workforce of the United States and to meet these challenges and expectations in a poor
economy where both public and private sector funds may be decreasing. With this

29
support and scrutiny, the need for a clear understanding of their success needs to be
readily available.

30
CHAPTER THREE: RESEARCH METHODS Chapter three presents the methods used to analyze existing data to measure the
impact of postsecondary education on the income and educational attainment of
nontraditional students in the Kentucky Community and Technical College System
(KCTCS), specifically those who completed a degree program and earned an educational
credential. Data for this study was collected from the Kentucky Center for Education and
Workforce Statistics.
Research Design
This research design is causal comparative. This means that the research is ex post
facto – it looks at what happens in the data after the fact. The current study does look at
multiple years, but in essence, this research is archival. Causal comparative is non-
experimental and the researcher does not manipulate the independent variables and there
is no random assignment to groups (Johnson, 2001). Instead, the researcher analyzes and
interprets existing, previously collected data (Gay & Airasian, 2000). This study uses pre-
existing, archival Student Unit Record (SUR) data for all variables (Gay & Airasian,
2000; Jenkins, 2008). The SUR data created a cohort that was analyzed for a three-year
period for educational attainment and annual income.
Population
Purposive sampling was used to obtain the participation data needed for this study.
The participants for this study included adults 25 to 64 years of age who were first time
KCTCS students who initially enrolled in either full-time or part-time coursework during

31
the academic years of 2006-2007, 2007-2008, and 2008-2009. Using these criteria, a
population of students was selected. This population was analyzed and a cohort of
students who earned an educational credential was identified for each academic year. The
median income of the students within these three cohorts was tracked for a four-year
period that was divided into quarters.
Data Collection
Data for the variables were secured from the Kentucky Center for Education and
Workforce Statistics (KCEWS). KCEWS maintains student data, student earnings, and
information related to Kentucky’s workforce. This data was provided following a written
request by the researcher to KCEWS. In addition to providing the data, the researcher
was exempted from review by the Institutional Research Board at Marshall University
and the Human Subjects Research Board of KCTCS, as no individual student data was
shared by KCEWS.
The workforce data provided by KCEWS was not self-reported by students, but
submitted by employers in Kentucky. All employers, other than independent contractors
and sole proprietors, are required to submit quarterly contribution and wage reports to the
Kentucky Labor Cabinet, which shares this information with KCEWS (K. Akers,
personal communication, Jan. 27, 2014). The wage data shared with KCEWS was the
source for the wage variables that were used in the economic impact aspect of this study.
KCEWS identified the student files that fit the researcher’s criteria, which created
three cohorts of adults 25 to 64 years of age, both full-time and part-time students who
were attending KCTCS for the first time with a minimum high school diploma and

32
initially enrolled during the academic years of 2006-2007, 2007-2008, and 2008-2009.
The files were cross-matched with the workforce data that were also provided by
KCEWS.
KCEWS’ files include data fields that identify the students’ earnings by quarter,
year, match (employed) wages, Classification of Instructional Program (CIP) code, and
type of degree earned. From these files, KCEWS was able to construct a wage table for
the cohorts during the academic year of 2006-2007, 2007-2008, and 2008-2009 (K. Akers,
personal communication, Jan. 27, 2014). All individual student identifiers were deleted
from the requested data. Privacy was not an issue since no individuals were identified.
The data files were transferred to SPSS data fields for statistical analysis and
were analyzed only for the purposes of this research.
Data Analysis
This study used both descriptive statistics and inferential statistics to analyze the
data and address the research questions. Depending on the research questions and the data,
analysis of variance, and repeated measures analysis of variance were used. In this study,
educational attainment is the dependent variable. However, educational attainment also
will be an independent variable in predicting income and employment.
Research Questions
In comparing the data on the workforce of Kentucky and the low-skilled 25- to
64-year-old demographic in question, the following research questions guided the study:
33
1. Are there any significant differences between the type of educational
credential program (diploma, certificate, associate degree) of nontraditional
students and their median income?
2. Are there any significant differences over time between the educational
attainment of nontraditional students and their median income?
The cohort of students used in this study represented all sixteen community and
technical colleges in Kentucky. However, the diagnoses and development of strategies
for improving student success should be left to the administrators, faculty, and staff of
KCTCS (Jenkins, 2008; Leinbach & Jenkins, 2008).
Null Hypothesis
In studies of this type, it is common to include null hypotheses:
1. There are no significant differences between the type of educational credential
program (diploma, certificate, associate degree) of nontraditional students and
their median income.
2. There are no significant differences over time between the educational
attainment of nontraditional students and their median income.
Summary
This study of educational attainment and its impact, if any, on the earnings of
nontraditional students who have enrolled in Kentucky’s community and technical
colleges analyzed the data using a non-experimental, causal comparative design. Data
were collected from KCEWS databases for all variables. Both descriptive statistics and

34
regression analysis were utilized for analyzing the data using IBM SPSS Statistics 20.
In order for postsecondary education to transform the lives of nontraditional
students for their financial benefit and for the improvement of Kentucky’s workforce, it is
critical that these results be measured for effectiveness and compared with the results of
other states with similar programs and challenges. There is an opportunity for this study
to not only measure Kentucky’s success, but also to compare that success to the systems
studied previously in Washington and West Virginia. Beyond these three states, this
study can be of benefit to other state systems in reviewing their level of success by
comparison, in addition to offering further opportunities for scholarship by conducting
similar research and analysis in the remaining states.

35
CHAPTER FOUR: DATA ANALYSIS AND RESULTS
The purpose of this study was to examine the effects of the educational attainment
of nontraditional students who attended the Kentucky Community and Technical College
System (KCTCS) in a specific time period with either a full-time or part-time enrollment.
The earning of an educational credential was compared to the students’ average income
and stability of employment. Similar to previously conducted surveys that examined the
community and technical systems in Washington State and West Virginia, this study
examines whether KCTCS is increasing the earning potential of its graduates and
improving the workforce of the Commonwealth of Kentucky.
Data Collection
Data for this study were obtained from the Kentucky Center for Education and
Workforce Statistics (KCEWS). Following a written request by the researcher, KCEWS
provided the data after the study was exempted by review from the Institutional Review
Boards of Marshall University and KCTCS, as well as the legal department of KCEWS.
See Appendices A and B for a copy of the exemption letters.
The parameters of the requested data were shared in writing with KCEWS. The
data was received in three Excel spreadsheets. Each spreadsheet contained information
for one cohort in this study: Cohort 1 - 2006-2007, Cohort 2 - 2007-2008, and Cohort 3 -
2008-2009. Each cohort was separately tracked for four years with median income data
reported on a quarterly basis. Therefore, Cohort 1 was followed for four academic years,
as were the other two cohorts. This data tracking produced fourteen different quarterly
measurements of median income for each of the above three cohorts.
36
The type of educational credential earned by the student – Associate Degree,
Certificate, or Diploma – was also included for each of these cohorts. Within the
educational credential, educational programs were also divided by their Classification of
Instructional Program (CIP) code. This data was then analyzed with the quarterly
earnings of these nontraditional students as they graduated from KCTCS. No information
was requested except for information related to nontraditional KCTCS students of 25 to
64 years of age, so there was no need to cull unrelated student information.
Research Questions
1. Are there any significant differences between the type of educational
credential program (diploma, certificate, associate degree) of nontraditional
students and their median income?
2. Are there any significant differences over time between the educational
attainment of nontraditional students and their median income?
Data Analysis
The data received from KCEWS was analyzed using IBM SPSS Statistics 20.
There were two basic types of analyses conducted on this data. The first analysis was an
analysis of variance of the three credential programs and their effect on median income.
(The independent variable was the type of credential program while the dependent
variable was median income.) The second analysis tracked median income for all three
cohorts over time with three separate repeated measures analysis of variance. (In this

37
analysis, time serves as the independent variable and median income is the dependent
variable.)
Descriptive statistics were also provided for the three student cohorts. The tables
containing these descriptive statistics are provided in Appendix C.
Using Analysis of variance (ANOVA), tests were conducted on the three cohorts
and their median income levels. In all three cohorts, the results showed no significant
differences in median income between the three degree groups in any of the cohorts. The
three tables that provide the analysis of variance of the three cohorts can be found in
Appendix C.
The next three tables provide repeated measures analysis of variance for the three
cohorts.
Table 1
Repeated measures analysis of variance of Cohort 1
Mean Std. Deviation N
N2007q3median 5010.52 1764.106 25
N2007q4median 5655.5600 1724.69333 25
N2008q1median 5708.8800 1937.90033 25
N2008q2median 5916.2000 1693.16257 25
N2008q3median 6106.3600 2086.86383 25
N2008q4median 6357.4400 1941.32908 25
N2009q1median 6134.0800 1709.82016 25
N2009q2median 6445.5600 1682.41595 25
N2009q3median 6311.6800 1791.83971 25
N2009q4median 7000.6800 2014.89743 25
N2010q1median 6419.4400 1672.28195 25
N2010q2median 7004.6000 1877.11791 25
N2010q3median 7025.1600 2229.92081 25
N2010q4median 7445.36 2133.831 25
N2011q1median 6989.20 1904.874 25
n2011q2median 7310.96 2081.162 25
38
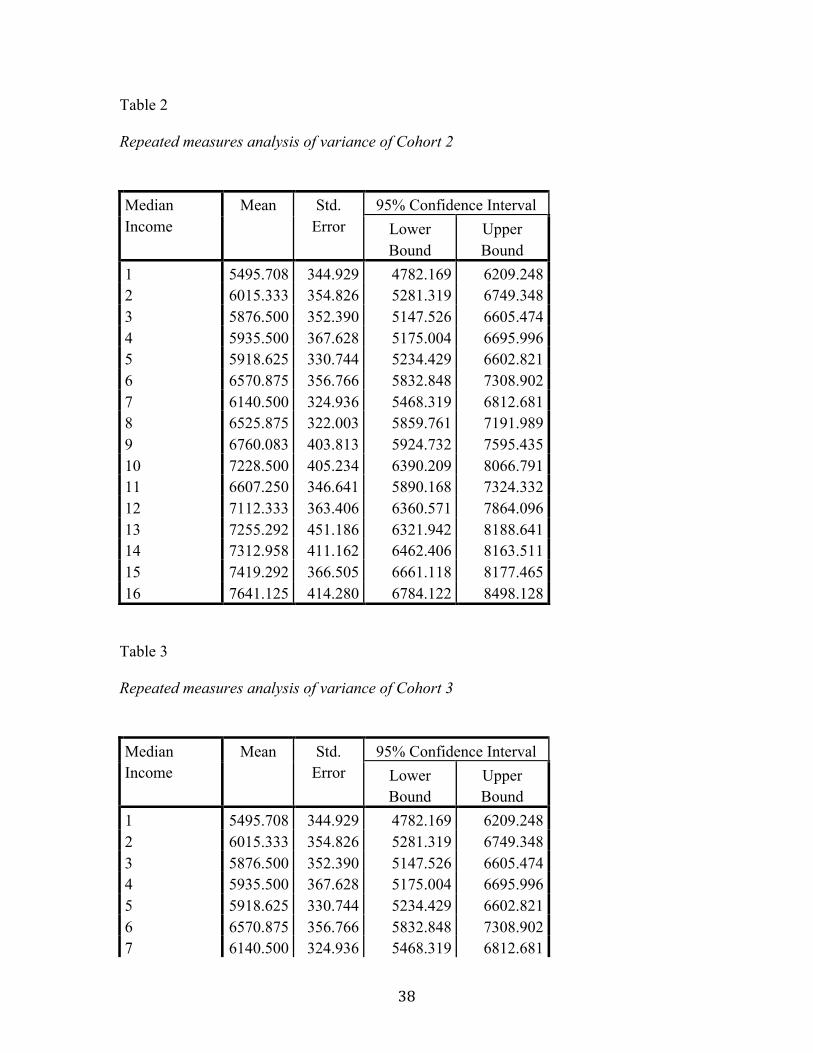
Table 2
Repeated measures analysis of variance of Cohort 2
Median Income
Mean Std. Error
95% Confidence Interval Lower Bound
Upper Bound
1 5495.708 344.929 4782.169 6209.248 2 6015.333 354.826 5281.319 6749.348 3 5876.500 352.390 5147.526 6605.474 4 5935.500 367.628 5175.004 6695.996 5 5918.625 330.744 5234.429 6602.821 6 6570.875 356.766 5832.848 7308.902 7 6140.500 324.936 5468.319 6812.681 8 6525.875 322.003 5859.761 7191.989 9 6760.083 403.813 5924.732 7595.435 10 7228.500 405.234 6390.209 8066.791 11 6607.250 346.641 5890.168 7324.332 12 7112.333 363.406 6360.571 7864.096 13 7255.292 451.186 6321.942 8188.641 14 7312.958 411.162 6462.406 8163.511 15 7419.292 366.505 6661.118 8177.465 16 7641.125 414.280 6784.122 8498.128
Table 3
Repeated measures analysis of variance of Cohort 3
Median Income
Mean Std. Error
95% Confidence Interval Lower Bound
Upper Bound
1 5495.708 344.929 4782.169 6209.248 2 6015.333 354.826 5281.319 6749.348 3 5876.500 352.390 5147.526 6605.474 4 5935.500 367.628 5175.004 6695.996 5 5918.625 330.744 5234.429 6602.821 6 6570.875 356.766 5832.848 7308.902 7 6140.500 324.936 5468.319 6812.681

39
8 6525.875 322.003 5859.761 7191.989 9 6760.083 403.813 5924.732 7595.435 10 7228.500 405.234 6390.209 8066.791 11 6607.250 346.641 5890.168 7324.332 12 7112.333 363.406 6360.571 7864.096 13 7255.292 451.186 6321.942 8188.641 14 7312.958 411.162 6462.406 8163.511 15 7419.292 366.505 6661.118 8177.465 16 7641.125 414.280 6784.122 8498.128
The next three tables use the main repeated analysis of the variance for the three
cohorts. The first line of each table uses Pillai’s Trace, which is the most common value
for the measure of significance. As seen in Tables 7, 8, and 9, the level of significance is
well below .05, which demonstrates highly significant increases in the students’ income
after earning one of the three educational credentials.
Table 4
Multivariate Tests of Cohort 1
Table 5
Multivariate Tests of Cohort 2
40
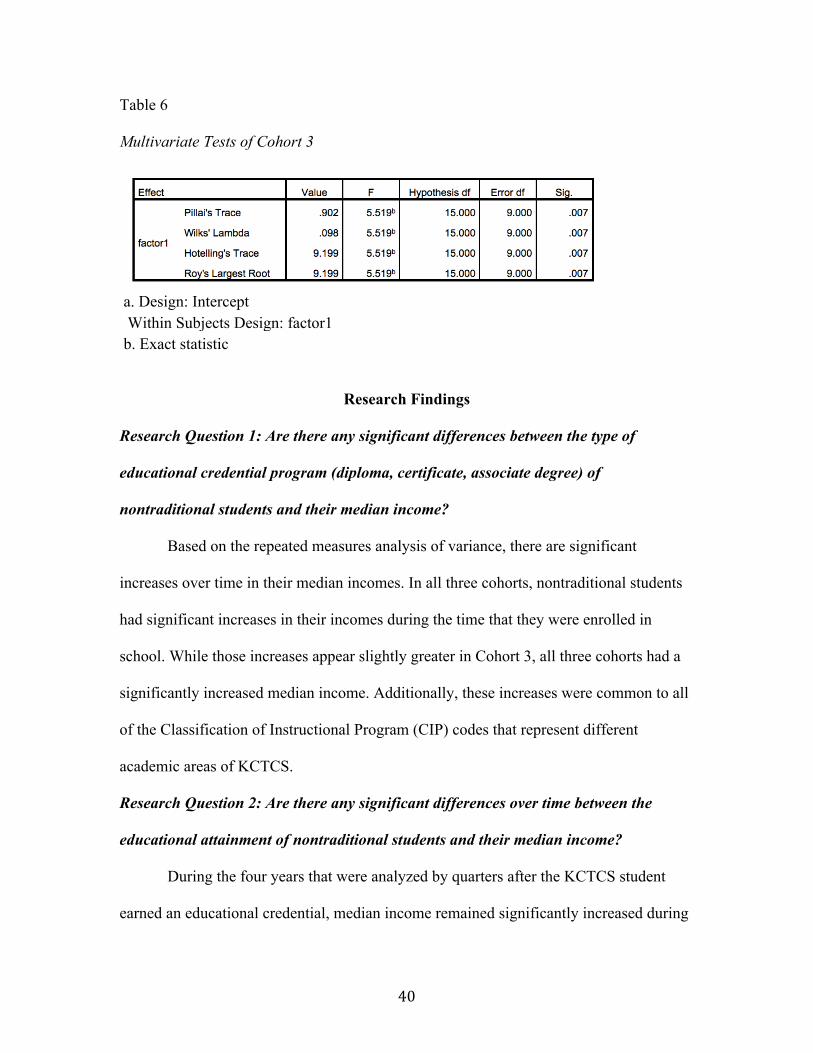
Table 6
Multivariate Tests of Cohort 3
a. Design: Intercept Within Subjects Design: factor1 b. Exact statistic
Research Findings
Research Question 1: Are there any significant differences between the type of
educational credential program (diploma, certificate, associate degree) of
nontraditional students and their median income?
Based on the repeated measures analysis of variance, there are significant
increases over time in their median incomes. In all three cohorts, nontraditional students
had significant increases in their incomes during the time that they were enrolled in
school. While those increases appear slightly greater in Cohort 3, all three cohorts had a
significantly increased median income. Additionally, these increases were common to all
of the Classification of Instructional Program (CIP) codes that represent different
academic areas of KCTCS.
Research Question 2: Are there any significant differences over time between the
educational attainment of nontraditional students and their median income?
During the four years that were analyzed by quarters after the KCTCS student
earned an educational credential, median income remained significantly increased during

41
this period of time. While consistent employment could be suggested by this continued
median income, no data was available to demonstrate it.
Summary
With the data from KCEWS, this study was able to clearly identify an increase in
median income for nontraditional KCTCS students who earned an educational credential
during the defined time period. While establishing that this same credential allowed
students to maintain employment was less identifiable, it is possible to suggest there is a
relationship as well, but further data collection and examination are needed.
42
CHAPTER FIVE: CONCLUSIONS AND RECOMMENDATIONS
Summary of Purpose
This study uses a longitudinal data analysis in an attempt to identify a relationship
between educational attainment of nontraditional students within the Kentucky
Community and Technical College System (KCTCS) and their success with employment
as well as their income after earning these credentials. With the ongoing concern of ever-
changing job markets and a lower-than-average quality workforce in Kentucky when
compared to the rest of the nation, the potential benefits of educational programs by
Community and Technical Colleges (CTCs) for both the student and the Commonwealth
of Kentucky needs to be examined.
The following questions defined the nature of the research:
1. Are there any significant differences between the type of educational
credential program (diploma, certificate, associate degree) of nontraditional
students and their median income?
2. Are there any significant differences over time between the educational
attainment of nontraditional students and their median income?
Summary of Procedures
Data for this study was collected from the Kentucky Center for Education and
Workforce Statistics (KCEWS) in the form of an Excel file with spreadsheets dedicated
to the academic years of 2006-2007, 2007-2008, and 2008-2009. This file separated the
data in rows by both type of credential – Associate Degree, Certificate, and Diploma –
and further separated these groups by Classification of Instructional Program (CIP) code,

43
which indicates the type of academic program pursued by the student. The columns of the
Excel file contained information regarding average student earnings by quarter for the
academic years. This information not only gives an indication of earnings as well as any
increases in earnings, but it also provides the aspect of ongoing employment following
graduation. All of the data obtained was from a cohort of nontraditional, first-time
KCTCS students who were 25 to 64 years of age. No individual student information was
requested or obtained.
In analyzing and testing the data, a series of tests was used, including descriptive
statistics, analysis of variance (ANOVA), and multivariate tests.
Summary of the Findings
The population for the study was 12,590 first-time, nontraditional KCTCS
students attending either full-time or part-time, who earned an Associate Degree,
Certificate, or Diploma, and who contributed income data through KCEWS. Significant
increases in median income were detected in all of the three types of education credential
earned, and similar increases were found in every CIP code related to these credentials.
Due to the lack of data related directly to the students’ ability to maintain
employment after earning their educational credentials, no statistical analysis of this
factor was possible, but the significant increases in median incomes do suggest that
consistent employment was maintained.
An external factor that needs to be considered with this study is that a major
economic downturn occurred during the time period when the data for this study was
collected. In spite of this economic downturn, KCTCS students identified for this study
44
still had significant increases in median income. It would be reasonable to conclude that
these increases could have been greater during less turbulent economic times. The results
of the study also suggest that the CTC education may still be beneficial even during
difficult economic times. These aspects not only leave room for further study, but also
validate aspects of the KCTCS’s mission.
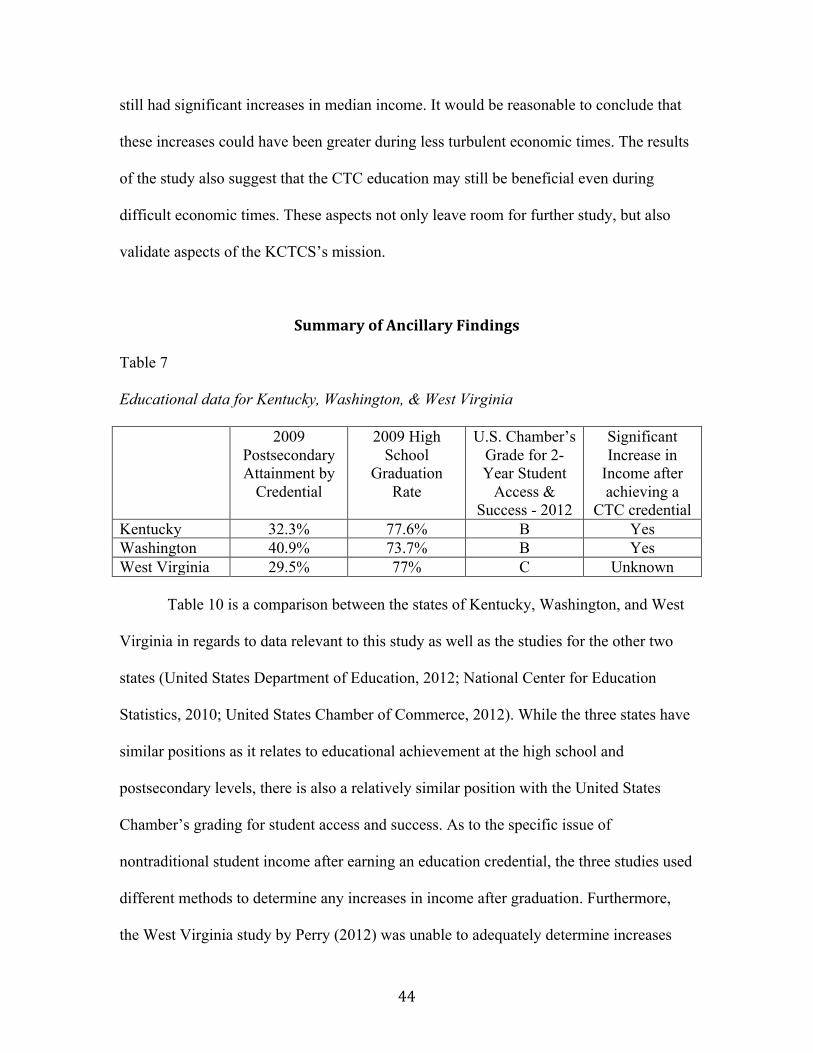
Summary of Ancillary Findings
Table 7
Educational data for Kentucky, Washington, & West Virginia
2009 Postsecondary Attainment by
Credential
2009 High School
Graduation Rate
U.S. Chamber’s Grade for 2-Year Student
Access & Success - 2012
Significant Increase in
Income after achieving a
CTC credential Kentucky 32.3% 77.6% B Yes Washington 40.9% 73.7% B Yes West Virginia 29.5% 77% C Unknown Table 10 is a comparison between the states of Kentucky, Washington, and West
Virginia in regards to data relevant to this study as well as the studies for the other two
states (United States Department of Education, 2012; National Center for Education
Statistics, 2010; United States Chamber of Commerce, 2012). While the three states have
similar positions as it relates to educational achievement at the high school and
postsecondary levels, there is also a relatively similar position with the United States
Chamber’s grading for student access and success. As to the specific issue of
nontraditional student income after earning an education credential, the three studies used
different methods to determine any increases in income after graduation. Furthermore,
the West Virginia study by Perry (2012) was unable to adequately determine increases

45
due to a lack of reported data. While the Prince and Jenkins study of Washington (2005)
did identify a significant increase in annual income after nontraditional students earned
an educational credential, this analysis was only completed for the years of 1996-1997
and 1997-1998.
With this comparison, the public policy implications for CTCs and their
leadership are demonstrated in the need for student data, both during the educational
process and after graduation. In order to support the position that CTCs are improving
both student incomes and the workforce of their states, student data must be maintained
to validate these improvements. In order to properly collect this data, CTC leaders need
to provide the necessary resources for this data collection, but might also need to seek the
passage of legislation in their state to require CTC graduates to relay this information and
allow access to the information through state agencies that collect data about income.
With a better understanding of their service to nontraditional students and
improving the workforce around them, CTCs would have more leverage politically at all
levels to request more public funds in addition to soliciting more charitable donations
from private entities that have a vested interest in the education of current and potential
employees.
While the importance of earning an educational credential is one of the main
aspects of these three studies, a recent development in CTC public policy that is unrelated
to educational credentials is the growth of noncredit curriculum. These noncredit
programs do not result in the student earning an educational credential, but provide
education that either improves the workforces due to a direct connection to the needs of
an employer or caters to the interests of students. Although these noncredit programs and
46
individual classes are a relatively new concept, they have been expanded in several states
and, in some cases, are offered by CTCs in a greater number than for-credit programs and
courses. If this trend continues, the earning of an educational credential would be a lesser
indicator of student success and workforce development (Van Noy, Jacobs, Korey, Bailey
& Hughes, 2008).
America Forward, a national non-partisan public policy initiative, suggests a six-
point outline on improving CTC education that will also benefit nontraditional students
and enhance existing workforce development activities. One of their six points – Improve
data access and utilization and emphasize accountability – connects well with these three
studies involving nontraditional students, improved income, and workforce development.
Stressing the need for greater oversight by the federal government, America Forward
suggests the creation of “data systems that connect across silos (such as workforce
development, education, higher education, and employment) and increase access by
providers, as well as state and local public agencies so data can be used to improve
outcomes” (America Forward, 2014, para. 5). This point encapsulates the need for better
data collection and access, which will increase the ability to measure the effectiveness of
CTCs and, in doing so, allow CTC leaders and supporters to identify programs and
strategies that maintain or increase their level of success. Other points within America
Forward’s outline include investing in proven programs; engaging employers as the
primary drivers of workforce development; thinking holistically about K-12, higher
education, and other constituencies; being flexible regarding goals and targets; and
supporting social enterprise, internships, and national service into the educational
experience (America Forward, 2014).

47
Limitations
There were factors that limited the conclusions to be drawn from this study.
First, it was not possible to verify that a nontraditional KCTCS student was
employed in a field related to his or her Classification of Instructional Program (CIP)
code. While it could be speculated that the increased median income found with students’
earnings within the study would still demonstrate the benefits of a KCTCS education to
both the students and the workforce of Kentucky, this study cannot verify it.
Second, no demographic data was collected. In obtaining the data from KCEWS,
there was reticence to share demographic data with this researcher because of concerns
about student confidentiality.
Third, while Kentucky was in the midst of a national economic downturn, it was
not possible to calculate the effects of this external factor on the results of this study. It
could be suggested that the overall increase in median income by the nontraditional
KCTCS students within the study suggests the benefit of a CTC education regardless of
statewide and even national economic factors, but such a suggestion would have to be
clarified within the timeline when the data was collected.
Recommendations for Further Research
While CTC education in Kentucky and the educational attainment of
nontraditional students was the focus of this study, further research related to this topic
would produce greater understanding.
This study, in conjunction with the Washington and West Virginia studies, leaves
47 other states that could be examined using similar methods. While these studies are
48
dissimilar in geography and method, the ongoing expansion of CTC education across the
United States creates a need for independent evaluation and discovery of whether other
states’ CTC programs are meeting the needs of their nontraditional students.
In Kentucky and other states where similar research is conducted, it would be
relevant to compare the median income of all residents who meet the same age
requirement but may or may not have attended postsecondary education during the same
time period. This comparison would verify the benefit of CTC attendance when
compared to individual earnings of all residents.
Future research could identify fluctuations in median student earnings if external
factors could be compared more directly, such as the possible connection between the
economic downturn of 2008 and the less significant increase in median income found in
Cohort 2.
Using different methods than this study, an analysis of KCTCS curriculum would
be helpful to determine if specific classes or class delivery methods better serve
nontraditional students in pursuing their educational attainment. While CTCs promote
their effectiveness at educating nontraditional students, a better understanding of how
CTCs succeed in that goal would benefit all postsecondary programs.
Conclusion
Since 1997, KCTCS has participated in a comprehensive statewide reorganization,
nearly doubled its student population, increased significantly its academic offerings to
better serve students and employers, and become the largest provider of postsecondary
education in the Commonwealth of Kentucky (KCTCS, 2009). While success and growth
49
in these areas is well chronicled in Kentucky, is KCTCS still meeting the needs of its
students, especially those students who are at high risk of failing to earn an educational
credential?
Based on the findings of this study, KCTCS is accomplishing its mission of
assisting nontraditional students in increasing their economic standing and improving the
workforce of the Commonwealth of Kentucky. Given Kentucky’s less-than-average
position in high school graduation rate, workforce development, and educational
attainment when compared to the rest of the nation, KCTCS can be seen as an important
agent for change.
If KCTCS is to follow the words of Horace Mann and be the “great equalizer” for
Kentuckians, including those students who did not travel the traditional route to
postsecondary education, there needs to continue to be a focus on service to this
population of students, especially in a state that already faces so many educational
challenges. Students should be given the opportunity to better themselves and, in so
doing, improve the educational attainment of their community. KCTCS, as a public
institution, should do everything in its ability to never lose sight of that important role.
Education then, beyond all other devices of human origin, is a great equalizer of the conditions of men,—the balance wheel of the social machinery (Mann, 1848).

50
REFERENCES
Alessi, R. (December 5, 2008). KCTCS mulls ending tenure. The Lexington Herald-
Leader. Retrieved from http://www.kentucky.com/2008/12/05/615013/kctcs-mulls-ending-tenure.html
Altman, R. (January, 2009). The Great Crash, 2008. Foreign Affairs. Retrieved from http://www.foreignaffairs.com/print/63714 America Forward. (2014). America Forward’s Policy Priorities for Reforming the
Federal Workforce System. Retrieved from http://www.americaforward.org/workforce-development-policy.html
American Association of Community Colleges. (2013). 2013 Community College Fast Facts. Retrieved from the American Association of Community Colleges: http://www.aacc.nche.edu/AboutCC/Documents/2013facts_fold_revised.pdf American Association of Community Colleges. (2013). Historical information.
Retrieved from American Association of Community Colleges: http://www.aacc.nche.edu/AboutCC/History/Pages/default.aspx American Association of Community Colleges. (2013) Community colleges past to
present. Retrieved from the American Association of Community Colleges: http://www.aacc.nche.edu/AboutCC/history/Pages/pasttopresent.aspx
Ayers, D. (May 2010). Putting the community back into the college. American
Association of University Professors. Retrieved from http://www.aaup.org/article/putting-community-back-college#.UoBAMChbuas
Bailey, T., Calcagno, J., Jenkins, D., Kienzl, G., & Leinbach, T. (September, 2005).
Community college success stories: What institutional characteristics make a difference? Retrieved from the Community College Research Center: http://www.usc.edu/dept/chepa/IDApays/publications/CC_Student_Success.pdf
Ballard, S. (February 25, 2009). KCTCS regents’ tenure plan criticized. The Louisville
Courier-Journal. Retrieved from http://www.courier-journal.com/article/20090226/OPINION02/902260352/KCTCS-regents-tenure-plan-criticized
Carnevale, A., & Desrochers, D. (2003). Standards for what? The economic roots of K-16 reform. Princeton, NJ: Educational Testing Service. Retrieved from http://www.learndoearn.org/For-Educators/Standards-for-What.pdf

51
Chisman, F. (May 2004). Adult Education & Literacy and Community Colleges in Kentucky. New York: Council for Advancement of Adult Literacy. Retrieved from http://www.caalusa.org/caal_ky_case_chisman.pdf
Day, J., & Newburger, E. (2002). The Big Payoff: Educational Attainment and Synthetic Estimates of Work-Life Earnings. Retrieved from United States Census Bureau: http://www.census.gov/prod/2002pubs/p23-210.pdf Ford Foundation. (2008). Bridges to Opportunity for Underprepared Adults: A State
Policy Guide for Community College Leaders. Retrieved from Bridges to Opportunity Initiative: http://www.fordfoundation.org/pdfs/library/Bridges_to_Opportunity_for_Underprepared_Adults.pdf
Gay, L. & Airasian, P. (2000). Educational research competencies for analysis and application. Upper Saddle River, NJ: Prentice-Hall, Inc. Jenkins, D. (March 2003). The potential of community colleges as bridges of
opportunity for the disadvantaged: Can it be achieved on a large scale? New York, NY: Community College Research Center, Teachers College, Columbia University. Retrieved from http://ccrc.tc.columbia.edu/media/k2/attachments/potential-community-colleges-bridges-opportunity.pdf
Jenkins, D. (2008). A Short Guide to “Tipping Point” Analyses of Community College
Student Labor Market Outcomes. Retrieved from Community College Research Center: http://knowledgecenter.completionbydesign.org/sites/default/files/60%20Jenkins%20April%202008.pdf
Johnson, B. (2001). Toward a new classification of nonexperimental quantitative
research. Retrieved from Educational Researcher: http://www33.homepage.villanova.edu/edward.fierros/pdf/Johnson.pdf
Kelly, P. (2011). Realizing Kentucky’s Educational Attainment Goal: A Look in
the Rear View Mirror and Down the Road Ahead. Retrieved from National Center for Higher Education Management Systems: http://cpe.ky.gov/NR/rdonlyres/81AB2E18-9122-4BAA-86C1-B6804D2CCE9A/0/NCHEMSRealizingKysCollegeAttainmentGoal.pdf
Kentucky 2011. (2011) Complete College America. U.S. Department of Education. Retrieved from http://completecollege.org/pdfs/Kentucky.pdf Kentucky Chamber of Commerce. (2011). 2011 Progress Report on Postsecondary
Education. Retrieved from http://www.kychamber.com/sites/default/files/PostsecondaryUpdate2012.pdf

52
Kentucky Community & Technical College System (KCTCS). (July 17, 2007). In the eye of the storm: Confronting Kentucky’s looming workforce crisis. Retrieved from http://www.kctcs.edu/~/media/System_Office/About/kctcs_ceo_summary_report.ashx
Kentucky Community & Technical College System (KCTCS). (2009). Metamorphosis. Retrieved from http://legacy.kctcs.edu/tenyear/ Kentucky Community & Technical College System (KCTCS). (2013). President McCall.
Retrieved from http://www.kctcs.edu/About_KCTCS/System_Administration/President_McCall.aspx
Kentucky Community & Technical College System (KCTCS). (2007). System Profile 07.
Retrieved from http://legacy.kctcs.edu/newspublications/systemprofiles/KCTCS_07_profile_01_15.pdf
Kentucky Education and Workforce Development Cabinet. (2010). Kentucky
Occupational Outlook to 2018: A Statewide Analysis of Wages, Employment, Growth and Training. Retrieved from http://library.sullivan.edu/spenlex/Resources/Publications/KY%20Occup%20Outlook%20to%202018.pdf
Lederman, D. (September 24, 2009). Rebuke for regents over tenure. Inside Higher
Ed. Retrieved from http://www.insidehighered.com/news/2009/09/24/kctcs Leinbach, D. & Jenkins, D. (2008). Using longitudinal data to increase community
college student success: A guide to measuring milestone and momentum point attainment. New York: Community College Research Center, Teachers College, Columbia University. Retrieved from http://knowledgecenter.completionbydesign.org/sites/default/files/77%20Leinbach%20Jenkins%20January%202008.pdf
LexisNexis. (2012) The Employment and Training Administration. Harris, Caddell &
Shanks, P.C. Retrieved from http://www.harriscaddell.com/newsletters/employment-law/the-employment-and-training-administration/
Liebowitz, M. & Taylor, J. (November 2004). Breaking through: Helping low-skilled
adults enter and succeed in college and careers. Jobs for the Future. Retrieved from http://www.breakingthroughcc.org/sites/default/files/BreakingThrough.pdf
53
Mann, H. (1848). Horace Mann on education and national Welfare. Tennessee Criminal Law Resources. Retrieved from
http://www.tncrimlaw.com/civil_bible/horace_mann.htm National Center for Education Statistics. (2010). High school dropout rates. Retrieved from http://high-school-dropout-rates.findthebest.com News Release. (January 12, 2012). Kentucky leaps 20 spots in national education ranking.
Governor Steve Beshear’s Communications Office. Retrieved from http://migration.kentucky.gov/Newsroom/governor/20120112educationranking.htm
News release. (November 15, 2013). Dr. Michael B. McCall, founding president of
KCTCS announces retirement. Kentucky Community & Technical College System (KCTCS). Retrieved from http://kctcs.edu/News%20and%20Events/newsItem?id={C853B68A-255B-49CF-AA44-86E3451EE534}
Obama, B. (2008). Preparing America for 21st Century Jobs. Retrieved from http://obama.3cdn.net/516099fccb1a1574bc_4pytmveej.pdf Perry, C. (August 2012). Creating pathways for low-skill adults: Lessons for
community and technical colleges from a statewide longitudinal study. Marshall University. Retrieved from http://mds.marshall.edu/cgi/viewcontent.cgi?article=1317&context=etd
Phillippe, K. & Patton, M. (2005). National profile of community colleges: Trends &
statistics, 4th edition. American Association of Community Colleges. Retrieved from http://files.eric.ed.gov/fulltext/ED494034.pdf
Powell, D. (Ed.). (2013). A stronger nation through higher education. Lumina
Foundation for Education. Retrieved from http://www.luminafoundation.org/stronger_nation/
Prince, D. & Jenkins, D. (April 2005). Building pathways to success for low-skill adult
students: Lessons for community college policy and practice from a statewide longitudinal tracking study. Community College Research Center. Retrieved from http://ccrc.tc.columbia.edu/media/k2/attachments/pathways-‐success-‐low-‐skill-‐adult.pdf
Reyna, R. (June 2010). Complete to compete: Common college completion metrics. National Governors Association. Retrieved from
http://www.nga.org/files/live/sites/NGA/files/pdf/1007COMMONCOLLEGEMETRICS.PDF

54
Rutschow, E., Richburg-Hayes, L., Brock, T., Orr, G., Cerna, O., Cullinan, D., Kerrigan, M., Jenkins, D., Gooden, S., & Martin, K. (January 2011). Turning the tide: Five years of achieving the dream in community colleges. MDRC. Retrieved from http://www.mdrc.org/sites/default/files/full_593.pdf
Stinnett, C. (November 18, 2007. KCTCS chief earns top salary. Evansville Courier &
Press. Retrieved from http://www.courierpress.com/news/2007/nov/18/kctcs-chief-earns-top-salary/
United States Census. (2012). Kentucky. 2007-2011 American Community Survey 5- Year Estimates. Retrieved from
http://factfinder2.census.gov/faces/tableservices/jsf/pages/productview.xhtml?pid=ACS_11_5YR_DP02
United States Chamber of Commerce. (2012). Leaders & Laggards. Retrieved
from http://icw.uschamber.com/reportcard/kentucky/ United States Department of Education. (July 12, 2012). New state-by-state college
attainment numbers show progress toward 2020 goal. Retrieved from http://www.ed.gov/news/press-releases/new-state-state-college-attainment-numbers-show-progress-toward-2020-goal
Upton, C., Littleton, L. & Myatt, J. (July 14, 2011). Kentucky Community & Technical
College System: Marketing, lobbying, and administration Expenses. Legislative Research Commission. Retrieved from http://www.lrc.ky.gov/lrcpubs/RR384.pdf
Van Noy, M., Jacobs, J., Korey, S., Bailey, T. & Hughes, K. (2008). Noncredit
Enrollment in workforce education: State policies and community college practices. Washington, DC: American Association of Community Colleges and Community College Research Center.
Wechsler, H., Goodchild, L., & Eisenmann, L. (Eds.). (2008). The history of higher
education, third edition. Association for the Study of Higher Education. Pearson Custom Publishing.

55
APPENDIX A
LETTER OF EXEMPTION FROM MARSHALL UNIVERSITY’S
INSTITUTIONAL RESEARCH BOARD
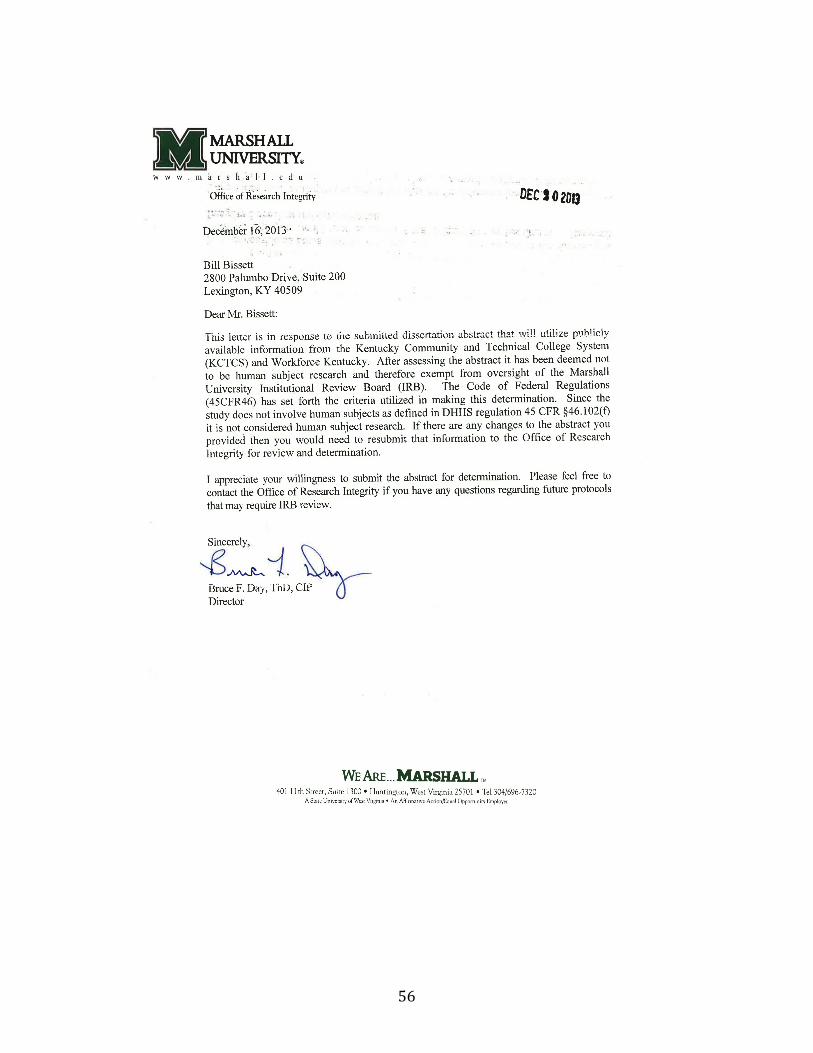
56
57
APPENDIX B
LETTER OF EXEMPTION FROM
KENTUCKY COMMUNITY AND TECHNICAL COLLEGE SYSTEM’S
HUMAN SUBJECTS RESEARCH BOARD
58
59
APPENDIX C
ANALYSIS OF VARIANCE OF COHORTS 1-3

60
ANOVA of Cohort 1
Sum of
Squares df Mean
Square F Sig.
N2007q3median
Between Groups
14395182.688
2 7197591.34
4 1.022 .375
Within Groups 168963067.8
31 24
7040127.826
Total 183358250.5
19 26
N2007q4median
Between Groups
3312233.299 2 1656116.64
9 .507 .609
Within Groups 75079517.31
7 23
3264326.840
Total 78391750.61
5 25
N2008q1median
Between Groups
7677267.615 2 3838633.80
8 .992 .386
Within Groups 88973131.50
0 23
3868397.022
Total 96650399.11
5 25
N2008q2median
Between Groups
5015807.195 2 2507903.59
7 .849 .441
Within Groups 67912255.26
7 23
2952706.751
Total 72928062.46
2 25
N2008q3median
Between Groups
3871803.779 2 1935901.89
0 .433 .654
Within Groups 102781090.0
67 23
4468743.046
Total 106652893.8
46 25
N2008q4median
Between Groups
12004979.231
2 6002489.61
5 1.471 .250
Within Groups 97919942.76
9 24
4079997.615
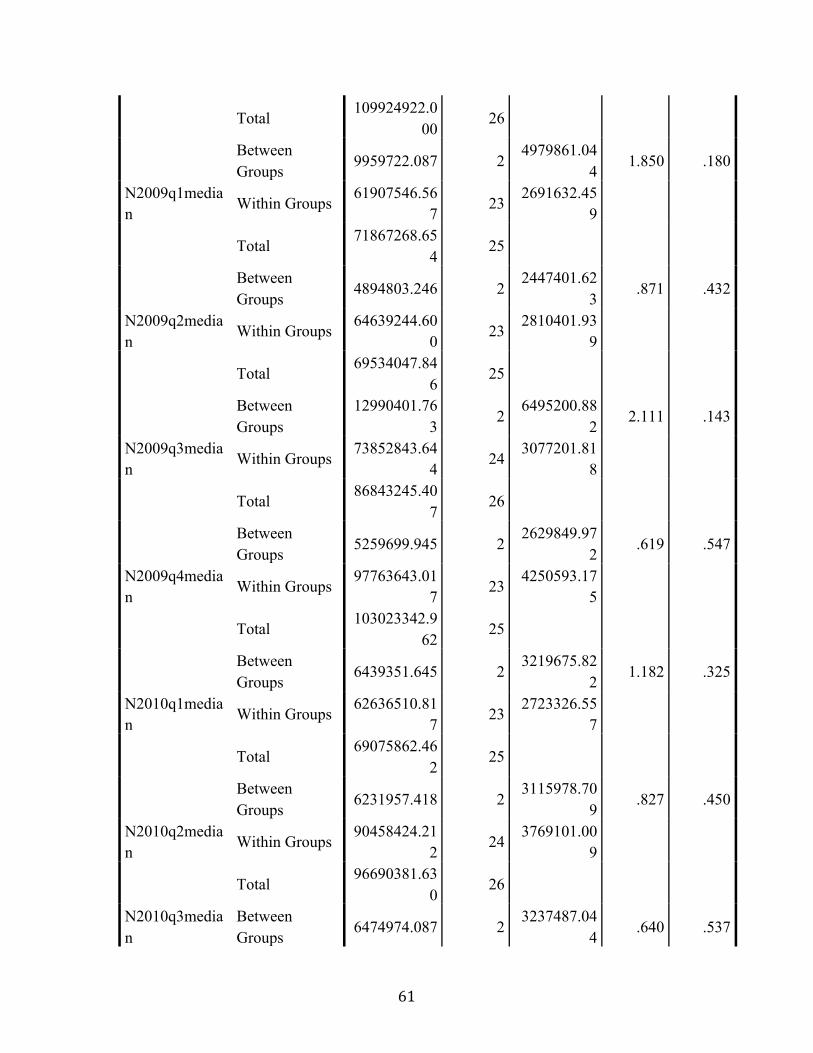
61
Total 109924922.0
00 26
N2009q1median
Between Groups
9959722.087 2 4979861.04
4 1.850 .180
Within Groups 61907546.56
7 23
2691632.459
Total 71867268.65
4 25
N2009q2median
Between Groups
4894803.246 2 2447401.62
3 .871 .432
Within Groups 64639244.60
0 23
2810401.939
Total 69534047.84
6 25
N2009q3median
Between Groups
12990401.763
2 6495200.88
2 2.111 .143
Within Groups 73852843.64
4 24
3077201.818
Total 86843245.40
7 26
N2009q4median
Between Groups
5259699.945 2 2629849.97
2 .619 .547
Within Groups 97763643.01
7 23
4250593.175
Total 103023342.9
62 25
N2010q1median
Between Groups
6439351.645 2 3219675.82
2 1.182 .325
Within Groups 62636510.81
7 23
2723326.557
Total 69075862.46
2 25
N2010q2median
Between Groups
6231957.418 2 3115978.70
9 .827 .450
Within Groups 90458424.21
2 24
3769101.009
Total 96690381.63
0 26
N2010q3median
Between Groups
6474974.087 2 3237487.04
4 .640 .537
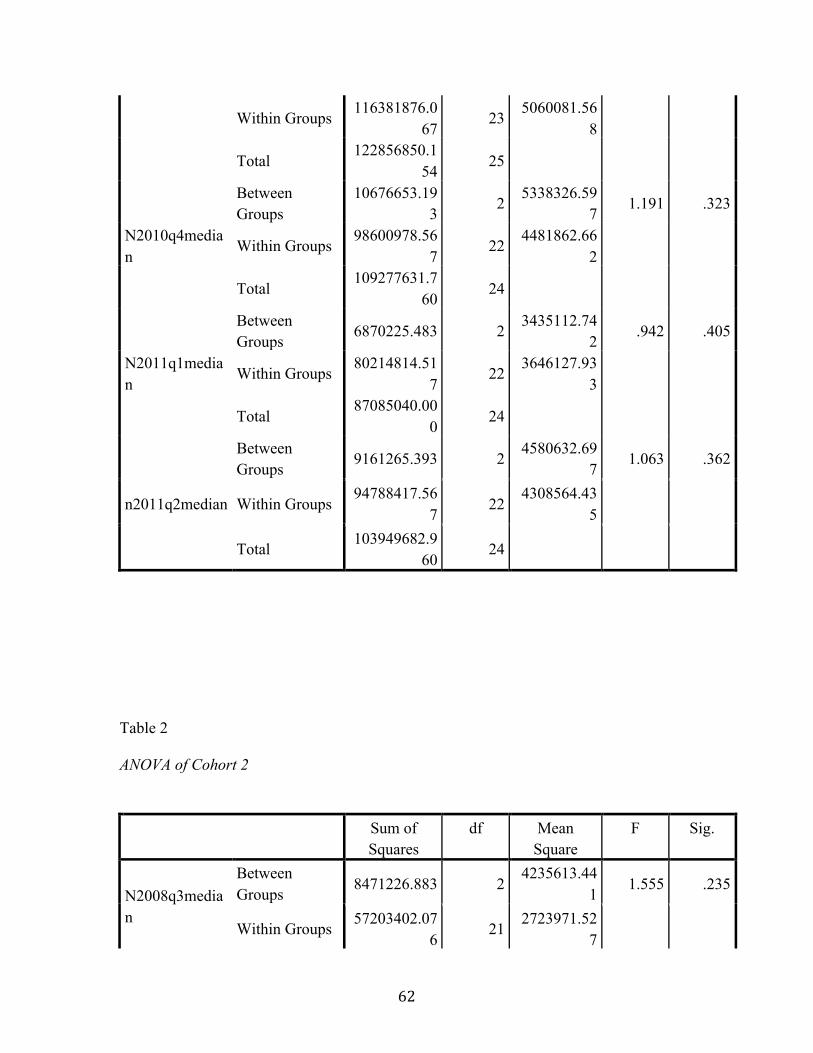
62
Within Groups 116381876.0
67 23
5060081.568
Total 122856850.1
54 25
N2010q4median
Between Groups
10676653.193
2 5338326.59
7 1.191 .323
Within Groups 98600978.56
7 22
4481862.662
Total 109277631.7
60 24
N2011q1median
Between Groups
6870225.483 2 3435112.74
2 .942 .405
Within Groups 80214814.51
7 22
3646127.933
Total 87085040.00
0 24
n2011q2median
Between Groups
9161265.393 2 4580632.69
7 1.063 .362
Within Groups 94788417.56
7 22
4308564.435
Total 103949682.9
60 24
Table 2
ANOVA of Cohort 2
Sum of
Squares df Mean
Square F Sig.
N2008q3median
Between Groups
8471226.883 2 4235613.44
1 1.555 .235
Within Groups 57203402.07
6 21
2723971.527

63
Total 65674628.95
8 23
N2008q4median
Between Groups
11366040.021
2 5683020.01
1 2.053 .153
Within Groups 58131757.31
2 21
2768178.920
Total 69497797.33
3 23
N2009q1median
Between Groups
7913340.252 2 3956670.12
6 1.370 .276
Within Groups 60633245.74
8 21
2887297.417
Total 68546586.00
0 23
N2009q2median
Between Groups
5515505.706 2 2757752.85
3 .838 .446
Within Groups 69087458.29
4 21
3289878.966
Total 74602964.00
0 23
N2009q3median
Between Groups
5404506.958 2 2702253.47
9 1.032 .374
Within Groups 54979640.66
7 21
2618078.127
Total 60384147.62
5 23
N2009q4median
Between Groups
9806721.058 2 4903360.52
9 1.703 .206
Within Groups 60453053.56
7 21
2878716.837
Total 70259774.62
5 23
N2010q1median
Between Groups
8657604.764 2 4328802.38
2 1.832 .185
Within Groups 49624309.23
6 21
2363062.345
Total 58281914.00
0 23
N2010q2median
Between Groups
12171434.222
2 6085717.11
1 2.836 .081
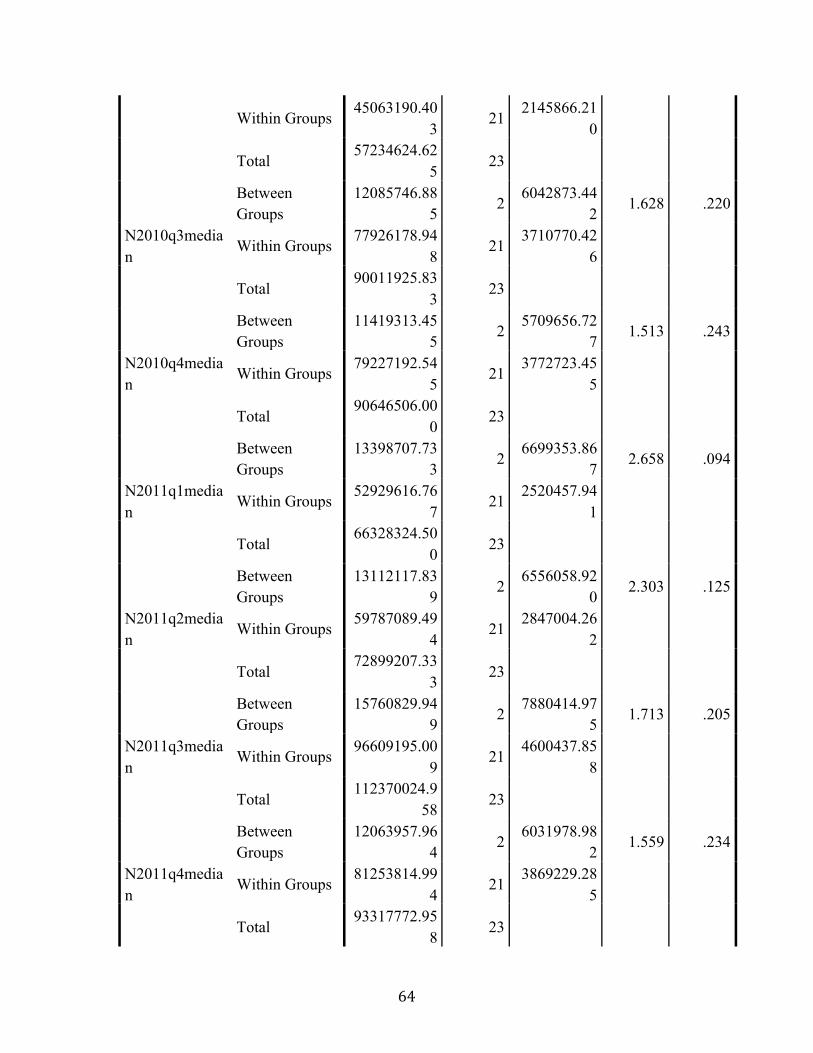
64
Within Groups 45063190.40
3 21
2145866.210
Total 57234624.62
5 23
N2010q3median
Between Groups
12085746.885
2 6042873.44
2 1.628 .220
Within Groups 77926178.94
8 21
3710770.426
Total 90011925.83
3 23
N2010q4median
Between Groups
11419313.455
2 5709656.72
7 1.513 .243
Within Groups 79227192.54
5 21
3772723.455
Total 90646506.00
0 23
N2011q1median
Between Groups
13398707.733
2 6699353.86
7 2.658 .094
Within Groups 52929616.76
7 21
2520457.941
Total 66328324.50
0 23
N2011q2median
Between Groups
13112117.839
2 6556058.92
0 2.303 .125
Within Groups 59787089.49
4 21
2847004.262
Total 72899207.33
3 23
N2011q3median
Between Groups
15760829.949
2 7880414.97
5 1.713 .205
Within Groups 96609195.00
9 21
4600437.858
Total 112370024.9
58 23
N2011q4median
Between Groups
12063957.964
2 6031978.98
2 1.559 .234
Within Groups 81253814.99
4 21
3869229.285
Total 93317772.95
8 23

65
N2012q1median
Between Groups
13078171.464
2 6539085.73
2 2.249 .130
Within Groups 61069801.49
4 21
2908085.785
Total 74147972.95
8 23
n2012q2median
Between Groups
18258695.313
2 9129347.65
6 2.507 .106
Within Groups 76479853.31
2 21
3641897.777
Total 94738548.62
5 23
Table 3
ANOVA of Cohort 3
Sum of
Squares df Mean
Square F Sig.
N2009q3median
Between Groups
6076864.337 2 3038432.16
8 1.327 .286
Within Groups 50360823.02
3 22
2289128.319
Total 56437687.36
0 24
N2009q4median
Between Groups
9579173.631 2 4789586.81
5 1.647 .215
Within Groups 63972550.36
9 22
2907843.199
Total 73551724.00
0 24
N2010q1median
Between Groups
9814454.571 2 4907227.28
5 1.627 .219
Within Groups 66370959.66
9 22
3016861.803
Total 76185414.24
0 24

66
N2010q2median
Between Groups
7475434.948 2 3737717.47
4 1.297 .294
Within Groups 63424029.29
2 22
2882910.422
Total 70899464.24
0 24
N2010q3median
Between Groups
13146314.483
2 6573157.24
2 1.779 .192
Within Groups 81298356.47
7 22
3695379.840
Total 94444670.96
0 24
N2010q4median
Between Groups
12140396.183
2 6070198.09
2 1.817 .186
Within Groups 73508447.57
7 22
3341293.072
Total 85648843.76
0 24
N2011q1median
Between Groups
9091558.971 2 4545779.48
5 1.702 .205
Within Groups 58753935.66
9 22
2670633.440
Total 67845494.64
0 24
N2011q2median
Between Groups
8339459.809 2 4169729.90
5 1.506 .244
Within Groups 60919533.63
1 22
2769069.710
Total 69258993.44
0 24
N2011q3median
Between Groups
10551303.209
2 5275651.60
5 1.282 .297
Within Groups 90523898.23
1 22
4114722.647
Total 101075201.4
40 24
N2011q4median
Between Groups
17920616.983
2 8960308.49
2 2.333 .122
Within Groups 80663008.35
0 21
3841095.636

67
Total 98583625.33
3 23
N2012q1median
Between Groups
14249624.775
2 7124812.38
7 1.861 .180
Within Groups 80413277.85
0 21
3829203.707
Total 94662902.62
5 23
N2012q2median
Between Groups
6320883.267 2 3160441.63
3 .776 .473
Within Groups 85521210.06
7 21
4072438.575
Total 91842093.33
3 23
N2012q3median
Between Groups
16751820.284
2 8375910.14
2 2.178 .137
Within Groups 84587537.07
6 22
3844888.049
Total 101339357.3
60 24
N2012q4median
Between Groups
10874362.288
2 5437181.14
4 1.455 .255
Within Groups 82231977.71
2 22
3737817.169
Total 93106340.00
0 24
N2013q1median
Between Groups
9625387.757 2 4812693.87
8 1.244 .308
Within Groups 85096950.80
3 22
3868043.218
Total 94722338.56
0 24
n2013q2median
Between Groups
5036093.549 2 2518046.77
4 .562 .578
Within Groups 103052334.9
51 23
4480536.302
Total 108088428.5
00 25

68
APPENDIX D
DESCRIPTIVES OF COHORTS 1-3

69

70

71
72
CURRICULUM VITAE
WILLIAM DANIEL BISSETT EDUCATION Marshall University, Doctor of Education, Leadership Studies, 2014 University of Kentucky, Nine Hours of Coursework, College of Education, 2010-2011 Marshall University, Masters of Journalism, 1997 Marshall University, Bachelor of Arts, 1992 Military Police Officers Basic Course, U.S. Army, Fort McClellan, AL, 1989 Nuclear, Biological and Chemical Course, U.S. Army Reserve, Morgantown, WV, 1988 Brunel University, Fifteen Hours of Coursework, British Law, 1986 PROFESSIONAL EXPERIENCE 2010-Present President, Kentucky Coal Association 2012-Present Member, National Coal Council 2010-Present Member, University of Kentucky Mining Engineering Foundation Board 2006-Present Adjunct Faculty, Marshall University College of Arts and Media 2007-2010 Chief of Staff / Senior VP for Communications, Marshall University 2005-2007 Director of Public Relations, Marshall University 2005-2007 Public Relations Consultant, Self-Employed 2003-2005 Weekly Talk Radio Guest, WVTS-AM 950 2003-2005 Vice President of Public Relations, Charles Ryan Associates 2002-2003 Director of Communications, West Virginia Department of Transportation 2000-2002 Director of Communications, West Virginia Department of Agriculture 1998-2002 Communications Officer, West Virginia Department of Agriculture 1995-1998 Creative Services Producer, WOWK-TV 13 1992-1995 Columnist, The Charleston Gazette 1993-1995 Owner / Investigator, Accurate Investigations, Inc. 1991-1994 Investigator, Foutty Investigations, Inc. 1987-1990 Platoon Leader, 363rd Military Police Company, Grafton, WV PRESENTATIONS 2011 Co-authored Circulation Patterns of Appalachian Newspapers,
Appalachian Studies Association, Eastern Kentucky University, Richmond, KY

73
2011 Co-presented Circulation Patterns of Appalachian Newspapers, National Newspaper Association, Albuquerque, NM
2009 Co-presented What to Expect as a Doctoral Student, Marshall University Doctoral Seminar, South Charleston, WV
2008 Co-presented Is the Nature of Presidential Leadership Changing?, Southern Regional Council on Educational Administration, Charleston, WV
MEMBERSHIPS Marshall University’s School of Journalism & Mass Communications Advisory Council United States Department of Energy’s National Coal Council University of Kentucky’s Mining Engineering Foundation Board
Recommended