ORIGINAL PAPER
Mechanical Properties of Gas Shale During Drilling Operations
Chuanliang Yan1,2 • Jingen Deng2 • Yuanfang Cheng1 • Menglai Li3 •
Yongcun Feng4 • Xiaorong Li4
Received: 27 March 2016 / Accepted: 12 March 2017 / Published online: 18 March 2017
� Springer-Verlag Wien 2017
Abstract The mechanical properties of gas shale signifi-
cantly affect the designs of drilling, completion, and
hydraulic fracturing treatments. In this paper, the
microstructure characteristics of gas shale from southern
China containing up to 45.1% clay were analyzed using a
scanning electron microscope. The gas shale samples fea-
ture strongly anisotropic characteristics and well-developed
bedding planes. Their strength is controlled by the strength
of both the matrix and the bedding planes. Conventional
triaxial tests and direct shear tests are further used to study
the chemical effects of drilling fluids on the strength of
shale matrix and bedding planes, respectively. The results
show that the drilling fluid has a much larger impact on the
strength of the bedding plane than that of the shale matrix.
The impact of water-based mud (WBM) is much larger
compared with oil-based mud. Furthermore, the borehole
collapse pressure of shale gas wells considering the effects
of drilling fluids are analyzed. The results show that the
collapse pressure increases gradually with the increase of
drilling time, especially for WBM.
Keywords Shale gas � Rock mechanics � Bedding plane �Single plane of weakness theory � Drilling fluid � Boreholestability
List of symbols
Ct Compressive strength after an immersion time of t
C0 Compressive strength before immersion
Eh Young’s modulus parallel to the bedding plane
Ev Young’s modulus normal to the bedding plane
Eca Young’s modulus at a given angle of caGhh Shear modulus parallel to the bedding plane
Gvh Shear modulus normal to the bedding plane
Pw Mud weight
St Shear strength after an immersion time of t
S0 Shear strength before immersion
mhh Poisson’s ratio parallel to the bedding plane
mvh Poisson’s ratio normal to the bedding plane
b Angle between the normal direction of the weak
plane and r1h Circumferential angle on the wellbore wall
r Normal stress
r1 Maximum principal stress
r3 Minimum principal stress
rrr Radial stress around the borehole
rzz Axial stress around the borehole
rhh Tangential stress around the borehole
s Shear stress
so Cohesion of the rock matrix
s0o Cohesion of the weak plane
u Friction angle of the rock matrix
u0 Friction angle of the weak plane
e Normal strain
c Shear strain
& Chuanliang Yan
& Yongcun Feng
1 School of Petroleum Engineering, China University of
Petroleum (East China), Qingdao, China
2 State Key Laboratory of Petroleum Resource and
Prospecting, China University of Petroleum (Beijing),
Beijing, China
3 Key Laboratory of Shale Gas Exploration, Ministry of Land
and Resources, Chongqing Institute of Geology and Mineral
Resources, Chongqing, China
4 The University of Texas at Austin, Austin, TX, USA
123
Rock Mech Rock Eng (2017) 50:1753–1765
DOI 10.1007/s00603-017-1203-5
ca Angle between the load direction and the bedding
plane
1 Introduction
Shale gas is an important unconventional resource (Zou
et al. 2010). The estimated shale gas reserve worldwide is
623 trillion cubic meters according to a report from the
Energy Information Administration, and the shale gas will
continue to play an important role in the future global
energy market (Yuan et al. 2012). For economic and safe
developments of shale gas, knowledge of mechanical
characteristics of gas shale is important for wellbore sta-
bility analysis, well trajectory optimization, and hydraulic
fracturing design (Zhao et al. 2004; Jiang 2011; Yan et al.
2013; Sone and Zoback 2013a, 2014; Guo et al. 2014;
Rasouli and Sutherland 2014). It is well known that the
mechanical properties of gas shale are very different from
those of tight sands and carbonate rocks due to the extre-
mely tight matrix, preexisting natural fractures, and bed-
ding planes (Zhang et al. 2007; Liu et al. 2008; You et al.
2014). Only few laboratory test results on the mechanical
characteristics of gas shale have been published compared
with conventional rocks. Vernik and Nur (1992) investi-
gated the velocity anisotropy of organic-rich black shale
and concluded that the anisotropy is mainly due to the non-
uniform shale microstructure. Lo et al. (1986) studied the
elastic anisotropy of Chicopee shale under various con-
fining pressures and demonstrated that the shale retains a
residual anisotropy under high confining pressures due to
its particularly internal particle arrangement. Niandou et al.
(1997) found that the Tournemire shale displays clearly
anisotropic, plastic deformation based on conventional
triaxial tests and loading/unloading tests. Kuila et al.
(2011) argued that shale anisotropy is induced by complex
field stress environments and found that shale samples
remain highly anisotropic under high confining pressures.
Sone and Zoback (2013a, b, c, 2014) studied the geome-
chanical problems for various shale gas reservoirs in North
America. They experimentally analyzed the anisotropically
mechanical properties and their relationships with the
velocity anisotropy of organic-rich shales. In particular,
they documented creep characteristics of organic-rich
shales, which had been long neglected, and analyzed the
impact of shale creep on horizontal stresses.
Failure of gas shale is dependent on the properties of
both the shale matrix and the bedding planes (Liang et al.
2014; Heng et al. 2015). Experimental results have shown
that the strength of gas shale is a function of the angle
between the axial stress and the bedding plane (Yuan et al.
2013; Fjær and Nes 2013). However, in the previous
studies, the influence of drilling fluid on the mechanical
properties of gas shale was not considered. Invasion of
drilling fluid into the gas shale can occur while drilling.
The gas shale usually contains abundant clay minerals.
The time required to drill a horizontal well in shale gas is
relatively long and borehole instability problems tend to
occur in the late time of drilling because of drilling fluid
invasion (You et al. 2014). For example, the drilling
period for Well W201-H1 in the Sichuan Basin in
southwest China is 72 days. The post-drilling wiper trip
takes 38 days and the volume of caved shale collected at
the surface is as high as 35 m3. Therefore, understanding
the influence of drilling fluid on the mechanical charac-
teristics of gas shale is vital for solving the wellbore
instability problems. In this paper, an experimental study
is conducted to investigate the effects of drilling fluids on
the strength of the shale matrix and bedding planes. The
mechanisms for the effects of different drilling fluids are
discussed.
2 Characteristics of the Gas Shale Samples
The gas shale samples used in this study were obtained
from the Sichuan Basin, China. The samples were sent to
the laboratory for testing as soon as possible after coring to
avoid weathering and loss of water content. The measured
porosities of the samples, using the helium expansion
method, are 2–6%. The matrix permeability is less than
0.01 mD under the in situ stress conditions, but the local
fracture-related permeability can be very high. X-ray
diffraction (XRD) was used to analyze the mineral contents
of the samples and the results are reported in Table 1 and
Table 2. The samples consist of 28.8–47.5% quartz (38.3%
in average) and 33.9–50.7% clay minerals (41.9% in
average). The clay contains 37–45% illite, 36–46% mixed-
layer illite/smectite (I/S), and some chlorite and kaolinite.
No pure smectite is present in the samples.
The gas shale formations usually have a well-laminated
structure (Fig. 1) due to the originally depositional char-
acteristics and the continuous changes in compositions and
structures of the formation under deep burial conditions
(Suarez-Rivera et al. 2005). Therefore, different rock
properties may exhibit along the directions parallel and
normal to the laminated planes due to the organized dis-
tributions of clay minerals (Hornby 1994; Sondergeld and
Rai 2011) and compliantly organic materials (Sondergeld
et al. 2000; Vernik and Milovac 2011).
Scanning electron microscope (SEM) was used to study
the microstructural characteristics of the gas shales and
regularly oriented micro-fractures were observed, as shown
in Fig. 2.
The transverse isotropy of gas shale is first exhibited in
its elasticity (Hornby 1994). Many experiments have
1754 C. Yan et al.
123

shown that shale is a transverse, isotropic material (Yuan
2014) in which the elastic modulus parallel to the bedding
plane is usually 10–150% greater than that perpendicular to
the bedding plane. However, in the matrix between the
bedding planes, very little difference is observed in dif-
ferent directions (Cho et al. 2012; Sayers 2013; Sone and
Zoback 2014; Yuan 2014; Yan et al. 2015).
We measured the P-wave velocities of the gas shale
samples under the atmospheric pressure at different direc-
tions, from parallel to perpendicular to the bedding planes
with an incremental angle of 30�, as shown in Fig. 3. The
Intelligent Ultrasonic Apparatus of Rock was used for the
measurements. The apparatus has a sampling frequency of
10 MHz, a sensor frequency of 0.35 MHz, and a time
accuracy of 0.1 ls. The P-wave measurement results are
shown in Table 3.
The difference in the P-wave velocities parallel to the
bedding plane is small (\113 m/s), but the difference
between the parallel and the perpendicular directions to the
bedding plane is significantly larger, with a maximum
difference of 851 m/s. The results support that gas shale
can be characterized as a transversely isotropic material.
The constitutive equation of the stress–strain relation-
ship of a transversely isotropic material can be expressed as
follows (Sayers 2005):
Table 1 Mineral components of the gas shale
No. Quartz (%) K-feldspar (%) Plagioclase (%) Calcite (%) Dolomite (%) Pyrite (%) Salt (%) Clay (%)
1 35.4 0.9 1.3 4.4 4.0 6.5 – 47.5
2 47.5 – 1.9 5.9 3.7 4.3 1.3 35.4
3 37.4 1.2 1.5 4.5 4.9 16.6 – 33.9
4 28.8 – 1.9 4.9 3.7 3.2 6.8 50.7
5 42.4 – 2.1 5.2 4.7 3.5 – 42.1
Table 2 Mineral components
of the clay mineralsNo. Mineral components of the clay minerals (%) Smectite components in the mixed layer (S%)
Smectite I/S1 Illite Kaolin Chlorite C/S2 I/S C/S
1 – 41 39 8 12 – 20 –
2 – 39 42 6 13 – 25 –
3 – 36 45 6 13 – 28 –
4 – 46 37 7 10 – 26 –
5 – 41 43 5 11 – 22 –
1 I/S—mixed-layer illite/smectite2 C/S—mixed-layer chlorite/smectite
Fig. 1 Photograph of gas shale
Fig. 2 Parallel micro-fractures in the gas shale
Mechanical Properties of Gas Shale During Drilling Operations 1755
123

exxeyyezzcyz
czxcxy
0BBBBBBBBB@
1CCCCCCCCCA
¼
1
Eh
� mhhEh
� mvhEv
� mhhEh
1
Eh
� mvhEv
� mhvEh
� mhvEh
1
Ev1
Gvh1
Gvh1
Ghh
0BBBBBBBBBBBBBBBBB@
1CCCCCCCCCCCCCCCCCA
rxxryyrzzsyzszxsxy
0BBBBBBBBB@
1CCCCCCCCCA
ð1Þ
where r and s are the normal and shear stress components,
respectively; e and c are the normal and shear strain compo-
nents, respectively; Ev and Eh are the Young’s modulus nor-
mal and parallel to the bedding plane, respectively; mvh and mhvare the Poisson’s ratio parallel and normal to the bedding
plane, respectively, due to the imposed vertical strain; mhh isthe Poisson’s ratio parallel to the bedding plane due to the
imposed parallel strain; Ghh and Gvh are the shear modulus
parallel and normal to the bedding plane, respectively.
Considering the isotropy in the direction parallel to the
bedding, the shear modulus Ghh can be expressed as a
function of Eh and mhh:
Ghh ¼Eh
2 1þ mhhð Þ ð2Þ
The mechanical property matrix for elastic materials in
Eq. 1 must be symmetric to satisfy thermodynamic
requirements (Gautam and Wong 2006). Therefore, the
following equation should hold:
mhvEh
¼ mvhEv
ð3Þ
Among the seven elasticity parameters in Eq. 1, only
five are independent. These five parameters, Ev, Eh, mvh, mhhand Gvh, can fully describe transversely isotropic materials,
as shown in Eq. 4.
exxeyyezzcyz
czxcxy
0BBBBBBBBB@
1CCCCCCCCCA
¼
1
Eh
� mhhEh
� mvhEv
� mhhEh
1
Eh
� mvhEv
� mvhEv
� mvhEv
1
Ev1
Gvh1
Gvh
2 1þ mhhð ÞEh
0BBBBBBBBBBBBBBBBB@
1CCCCCCCCCCCCCCCCCA
rxxryyrzzsyzszxsxy
0BBBBBBBBB@
1CCCCCCCCCA
ð4Þ
These five independent elasticity parameters can be
determined using laboratory tests (Sarout et al. 2007).
We measured the static elasticity parameters of the gas
shale as follows: Ev and mvh were measured via a uni-
axial compressive test on a core sample with its axis
normal to the bedding plane. Eh and mhh were measured
via a uniaxial compressive test on a sample with its axis
parallel to the bedding plane. In addition to these uni-
axial compressive tests, core samples with their axes
intersecting the bedding plane at angles other than 0� and
90� (in this case, 45�) were used to determine Gvh. The
elastic modulus was calculated as follows (Cho et al.
2012; Wang et al. 2012):
1
Eca
¼ sin4 caEh
þ 1
Gvh
� 2vvh
Ev
� �� sin2 ca cos2 ca þ
cos4 caEv
ð5Þ
where ca is the angle between the load direction and the
bedding plane; Eca represents Young’s modulus measured
at a given ca.
Perpendicular
Fig. 3 P-wave velocity testing directions
Table 3 P-wave velocity results
Angle (�) P-wave velocity (m/s)
Parallel to the bedding plane
0 4849
30 4904
60 4937
90 4898
120 4843
150 4824
180 4849
Perpendicular to the bedding plane 4086
1756 C. Yan et al.
123

Based on the test results, the five independent elasticity
parameters of the transversely isotropic shale were calcu-
lated using Eq. (5) and the results are shown in Table 4.
These results were obtained by averaging the measurements
of several groups of uniaxial compressive tests. For the tests
in the same loading direction, the measurement results are
very similar, with the largest relative difference\10%.
3 Experimental Methods
The transverse isotropy of gas shales exhibits not only in
their elastic properties but also in the strength, which is
greatly influenced by the weak bedding planes (Chenevert
1964; Higgins et al. 2008). To study the failure of such
rocks, several failure criteria for anisotropic rocks have
been proposed (Jaeger 1960; Walsh and Brace 1964;
Gol’denblat and Kopnov 1965; Mclamore and Gray 1967;
Karr et al. 1989; Hill 1998; Tien and Kuo 2001; Mortara
2010). However, these criteria usually involve many
parameters which require a large number of core tests to
determine. For gas shale, it is usually difficult and expen-
sive to obtain enough cores. Therefore, selecting a simple
and practical failure criterion suitable for gas shale is
important. The single plane of weakness theory proposed
by Jaeger (1960) is a concise and widely used strength
criterion for anisotropic rocks, which requires relatively
less and easy-to-determine parameters.
The single plane of weakness theory assumes that the
layered rock has two failure modes: shear failure along the
bedding plane and shear failure of the rock matrix. The
failure criterion for the rock matrix is expressed by Eq. 6.
s ¼ so þ r tanu ð6Þ
where r is the normal stress on the failure plane; s is the
shear stress on the failure plane; so and u are the cohesion
and the friction angle of the rock matrix, respectively.
Through this paper, compressive stress is taken as positive.
The failure criterion for the weak plane is defined as:
s ¼ s0o þ r tanu0 ð7Þ
where r and s are the normal stress and shear stress on the
weak plane, respectively; s0o and u0 are the cohesion and
friction angle of the weak plane, respectively.
When transforming the stresses on a matrix failure plane
and on a weak bedding plane into principal stresses r1 andr3, Eqs. 6 and 7 become Eqs. 8 and 9, respectively.
r1 � r3ð Þ ¼ 2ðs0 þ r3 tanuÞffiffiffiffiffiffiffiffiffiffiffiffiffiffiffiffiffiffiffiffiffitan2 uþ 1
p� tanu
ð8Þ
r1 � r3ð Þ ¼ 2ðs0o þ r3 tanu0Þ1� tanu0cotanbð Þ sin 2b ð9Þ
where b is the angle between the normal direction of the
weak plane and r1. For values of b approaching 90� or in therange of 0� tou0, slip on the plane of weakness cannot occur.
Because the strength of gas shale is jointly controlled by
the matrix strength and bedding plane strength, the impacts
of drilling fluid on both of them were tested. Two groups of
standard core samples (/25 mm 9 50 mm) were drilled
using a diamond coring bit with kerosene as the cooling
medium. Abrasive papers were used to smooth the end
surfaces of the shale samples until the roughness is less
than ±0.05 mm. The axes of the samples are perpendicular
to both end surfaces with a discrepancy less than ±0.25�.One group of the samples with the axis normal to the
bedding plane was used to study the matrix strength using
conventional triaxial tests. The other group with the axis
parallel to the bedding plane was used to measure the
bedding plane strength using direct shear tests. Because the
acoustic wave velocities are related to the rock mechanical
properties, acoustic wave velocity tests were also con-
ducted under the same conditions and only samples with
similar wave velocities in each group were selected for the
strength tests. The wave velocities of the samples perpen-
dicular to the bedding plane range from 4075 to 4113 m/s,
while the velocities parallel to the bedding plane are
between 4845 and 4869 m/s. The similar wave velocities
imply that the core samples have similar mechanical
parameters in the corresponding directions.
The selected samples were then immersed in water-
based mud (WBM) and oil-based mud (OBM) at a tem-
perature of 60 �C. To investigate the influence of immer-
sion time on shale strength, the samples were immersed for
various durations, i.e., 1, 2, 4, 6, 8, and 10 days. To prevent
the drilling fluid from evaporating from the immersed shale
samples, strength tests were carried out immediately after
the samples were taken out from the drilling fluid.
It should be noted that the use of kerosene as the cooling
liquid while coring the samples may influence water
absorption when the samples are immersed in WBM
because the kerosene may change the wettability of the
core surface and increase the resistance to water infiltra-
tion. Consequently, the estimated impact of the WBM may
be smaller in the experiments than in the real situations. To
mitigate this effect, the kerosene on the sample surface was
wiped off using oil-absorbing papers immediately after
coring and then the samples were placed in an oven, drying
for 24 h at a temperature of 60 �C before immersing them
in WBM. This should have effectively removed the
Table 4 Summary of the anisotropic parameters of the shale
Ev (GPa) Eh (GPa) mvh mhh Gvh (GPa)
20 24 0.18 0.21 18
Mechanical Properties of Gas Shale During Drilling Operations 1757
123
residual kerosene on the samples and eliminated its influ-
ence on the strength tests.
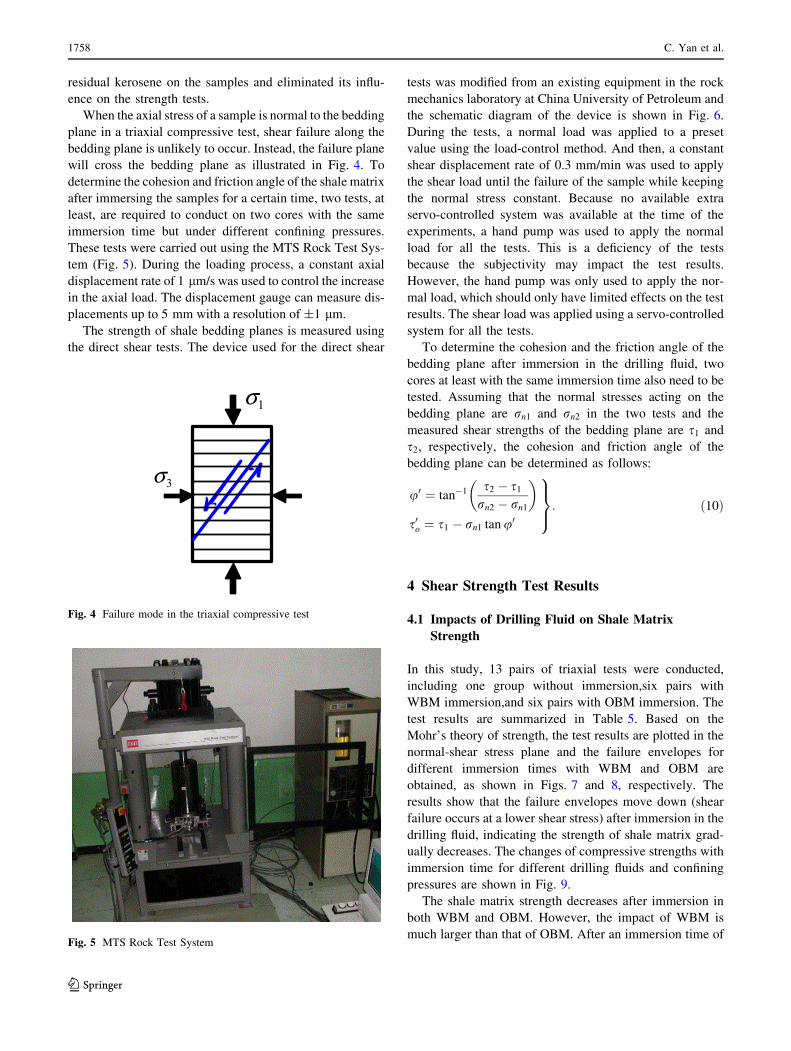
When the axial stress of a sample is normal to the bedding
plane in a triaxial compressive test, shear failure along the
bedding plane is unlikely to occur. Instead, the failure plane
will cross the bedding plane as illustrated in Fig. 4. To
determine the cohesion and friction angle of the shale matrix
after immersing the samples for a certain time, two tests, at
least, are required to conduct on two cores with the same
immersion time but under different confining pressures.
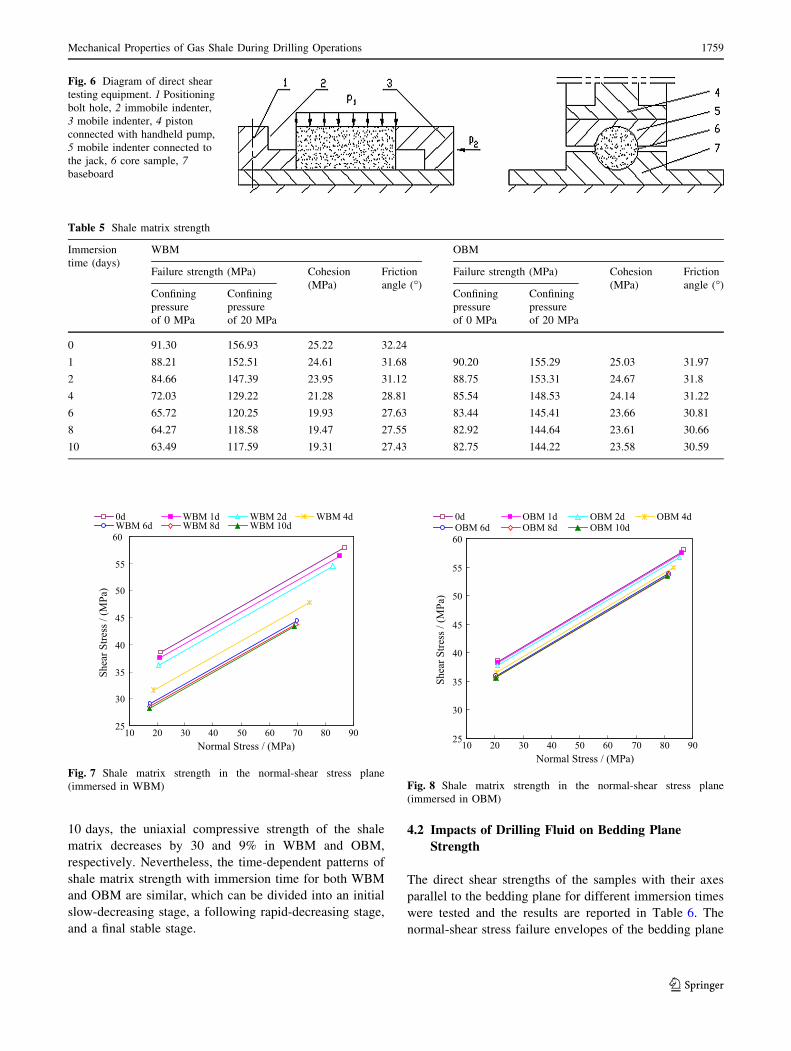
These tests were carried out using the MTS Rock Test Sys-
tem (Fig. 5). During the loading process, a constant axial
displacement rate of 1 lm/s was used to control the increase
in the axial load. The displacement gauge can measure dis-
placements up to 5 mm with a resolution of ±1 lm.
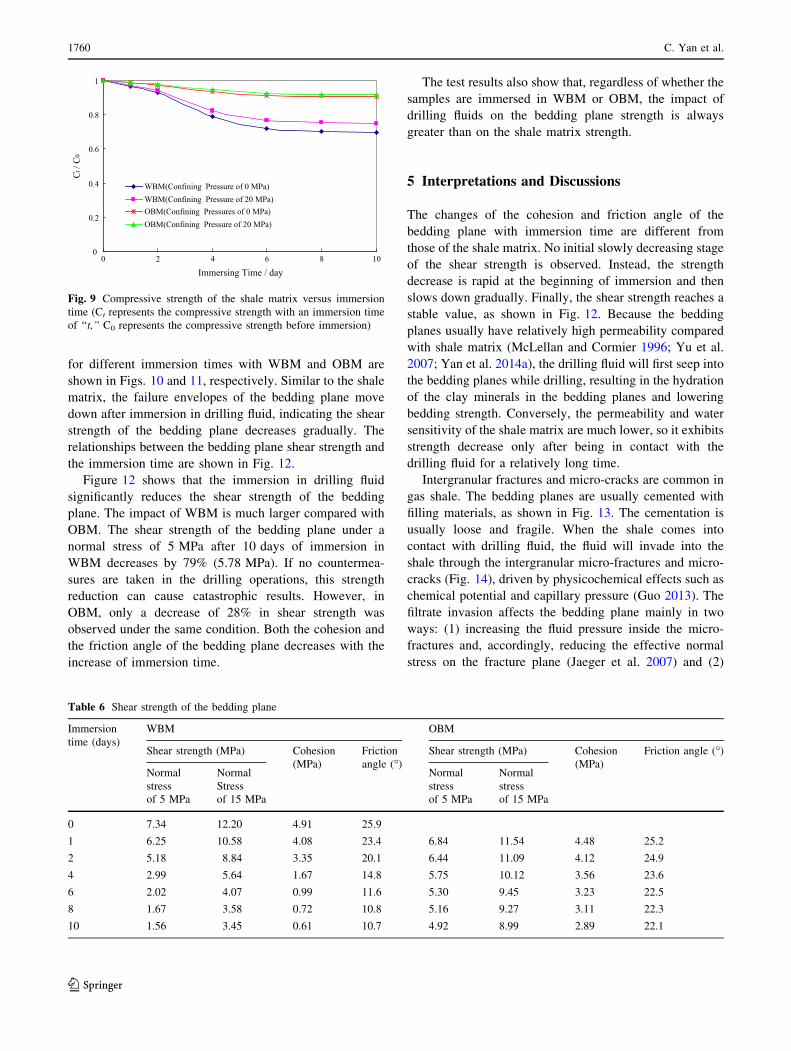
The strength of shale bedding planes is measured using
the direct shear tests. The device used for the direct shear
tests was modified from an existing equipment in the rock
mechanics laboratory at China University of Petroleum and
the schematic diagram of the device is shown in Fig. 6.
During the tests, a normal load was applied to a preset
value using the load-control method. And then, a constant
shear displacement rate of 0.3 mm/min was used to apply
the shear load until the failure of the sample while keeping
the normal stress constant. Because no available extra
servo-controlled system was available at the time of the
experiments, a hand pump was used to apply the normal
load for all the tests. This is a deficiency of the tests
because the subjectivity may impact the test results.
However, the hand pump was only used to apply the nor-
mal load, which should only have limited effects on the test
results. The shear load was applied using a servo-controlled
system for all the tests.
To determine the cohesion and the friction angle of the
bedding plane after immersion in the drilling fluid, two
cores at least with the same immersion time also need to be
tested. Assuming that the normal stresses acting on the
bedding plane are rn1 and rn2 in the two tests and the
measured shear strengths of the bedding plane are s1 and
s2, respectively, the cohesion and friction angle of the
bedding plane can be determined as follows:
u0 ¼ tan�1 s2 � s1rn2 � rn1
� �
s0o ¼ s1 � rn1 tanu0
9>=>;: ð10Þ
4 Shear Strength Test Results
4.1 Impacts of Drilling Fluid on Shale Matrix
Strength
In this study, 13 pairs of triaxial tests were conducted,
including one group without immersion,six pairs with
WBM immersion,and six pairs with OBM immersion. The
test results are summarized in Table 5. Based on the
Mohr’s theory of strength, the test results are plotted in the
normal-shear stress plane and the failure envelopes for
different immersion times with WBM and OBM are
obtained, as shown in Figs. 7 and 8, respectively. The
results show that the failure envelopes move down (shear
failure occurs at a lower shear stress) after immersion in the
drilling fluid, indicating the strength of shale matrix grad-
ually decreases. The changes of compressive strengths with
immersion time for different drilling fluids and confining
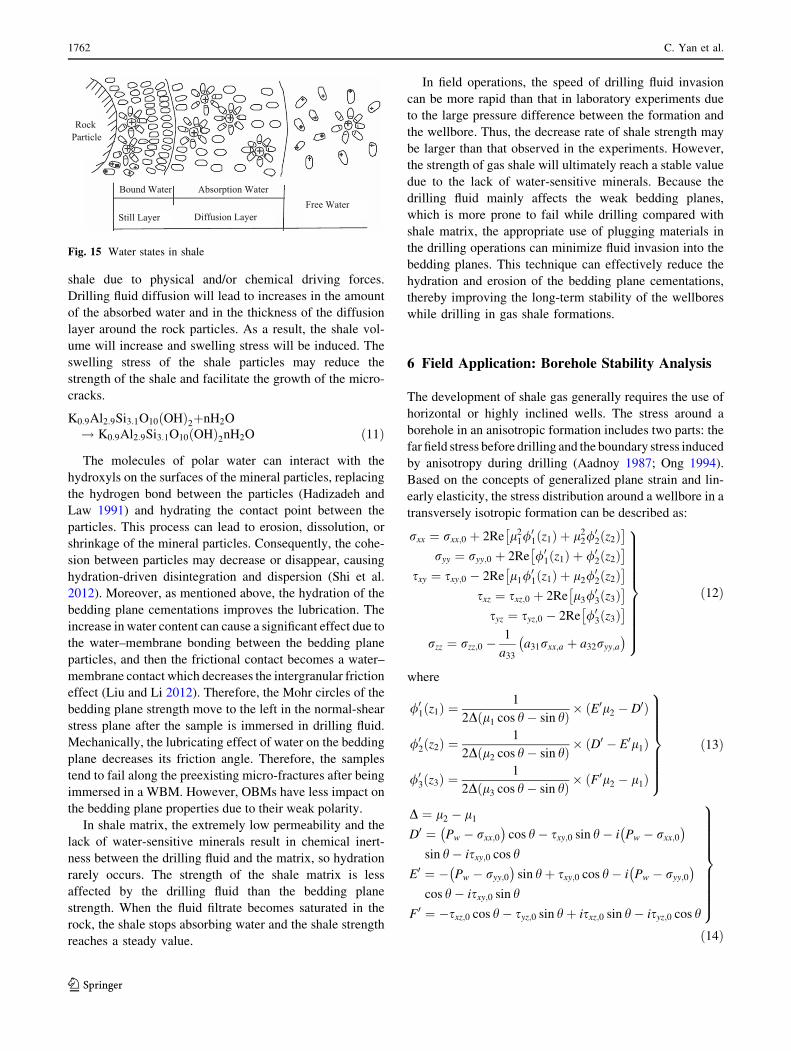
pressures are shown in Fig. 9.
The shale matrix strength decreases after immersion in
both WBM and OBM. However, the impact of WBM is
much larger than that of OBM. After an immersion time of
1σ
3σ
Fig. 4 Failure mode in the triaxial compressive test
Fig. 5 MTS Rock Test System
1758 C. Yan et al.
123
10 days, the uniaxial compressive strength of the shale
matrix decreases by 30 and 9% in WBM and OBM,
respectively. Nevertheless, the time-dependent patterns of
shale matrix strength with immersion time for both WBM
and OBM are similar, which can be divided into an initial
slow-decreasing stage, a following rapid-decreasing stage,
and a final stable stage.
4.2 Impacts of Drilling Fluid on Bedding Plane
Strength
The direct shear strengths of the samples with their axes
parallel to the bedding plane for different immersion times
were tested and the results are reported in Table 6. The
normal-shear stress failure envelopes of the bedding plane
Fig. 6 Diagram of direct shear
testing equipment. 1 Positioning
bolt hole, 2 immobile indenter,
3 mobile indenter, 4 piston
connected with handheld pump,
5 mobile indenter connected to
the jack, 6 core sample, 7
baseboard
Table 5 Shale matrix strength
Immersion
time (days)
WBM OBM
Failure strength (MPa) Cohesion
(MPa)
Friction
angle (�)Failure strength (MPa) Cohesion
(MPa)
Friction
angle (�)Confining
pressure
of 0 MPa
Confining
pressure
of 20 MPa
Confining
pressure
of 0 MPa
Confining
pressure
of 20 MPa
0 91.30 156.93 25.22 32.24
1 88.21 152.51 24.61 31.68 90.20 155.29 25.03 31.97
2 84.66 147.39 23.95 31.12 88.75 153.31 24.67 31.8
4 72.03 129.22 21.28 28.81 85.54 148.53 24.14 31.22
6 65.72 120.25 19.93 27.63 83.44 145.41 23.66 30.81
8 64.27 118.58 19.47 27.55 82.92 144.64 23.61 30.66
10 63.49 117.59 19.31 27.43 82.75 144.22 23.58 30.59
25
30
35
40
45
50
55
60
10 20 30 40 50 60 70 80 90Normal Stress / (MPa)
Shea
r Stre
ss /
(MPa
)
0d WBM 1d WBM 2d WBM 4dWBM 6d WBM 8d WBM 10d
Fig. 7 Shale matrix strength in the normal-shear stress plane
(immersed in WBM)
25
30
35
40
45
50
55
60
10 20 30 40 50 60 70 80 90Normal Stress / (MPa)
Shea
r Stre
ss /
(MPa
)
0d OBM 1d OBM 2d OBM 4dOBM 6d OBM 8d OBM 10d
Fig. 8 Shale matrix strength in the normal-shear stress plane
(immersed in OBM)
Mechanical Properties of Gas Shale During Drilling Operations 1759
123
for different immersion times with WBM and OBM are
shown in Figs. 10 and 11, respectively. Similar to the shale
matrix, the failure envelopes of the bedding plane move
down after immersion in drilling fluid, indicating the shear
strength of the bedding plane decreases gradually. The
relationships between the bedding plane shear strength and
the immersion time are shown in Fig. 12.
Figure 12 shows that the immersion in drilling fluid
significantly reduces the shear strength of the bedding
plane. The impact of WBM is much larger compared with
OBM. The shear strength of the bedding plane under a
normal stress of 5 MPa after 10 days of immersion in
WBM decreases by 79% (5.78 MPa). If no countermea-
sures are taken in the drilling operations, this strength
reduction can cause catastrophic results. However, in
OBM, only a decrease of 28% in shear strength was
observed under the same condition. Both the cohesion and
the friction angle of the bedding plane decreases with the
increase of immersion time.
The test results also show that, regardless of whether the
samples are immersed in WBM or OBM, the impact of
drilling fluids on the bedding plane strength is always
greater than on the shale matrix strength.
5 Interpretations and Discussions
The changes of the cohesion and friction angle of the
bedding plane with immersion time are different from
those of the shale matrix. No initial slowly decreasing stage
of the shear strength is observed. Instead, the strength
decrease is rapid at the beginning of immersion and then
slows down gradually. Finally, the shear strength reaches a
stable value, as shown in Fig. 12. Because the bedding
planes usually have relatively high permeability compared
with shale matrix (McLellan and Cormier 1996; Yu et al.
2007; Yan et al. 2014a), the drilling fluid will first seep into
the bedding planes while drilling, resulting in the hydration
of the clay minerals in the bedding planes and lowering
bedding strength. Conversely, the permeability and water
sensitivity of the shale matrix are much lower, so it exhibits
strength decrease only after being in contact with the
drilling fluid for a relatively long time.
Intergranular fractures and micro-cracks are common in
gas shale. The bedding planes are usually cemented with
filling materials, as shown in Fig. 13. The cementation is
usually loose and fragile. When the shale comes into
contact with drilling fluid, the fluid will invade into the
shale through the intergranular micro-fractures and micro-
cracks (Fig. 14), driven by physicochemical effects such as
chemical potential and capillary pressure (Guo 2013). The
filtrate invasion affects the bedding plane mainly in two
ways: (1) increasing the fluid pressure inside the micro-
fractures and, accordingly, reducing the effective normal
stress on the fracture plane (Jaeger et al. 2007) and (2)
0
0.2
0.4
0.6
0.8
1
0 2 4 6 8 10
Immersing Time / day
Ct /
C0
WBM(Confining Pressure of 0 MPa)WBM(Confining Pressure of 20 MPa)OBM(Confining Pressures of 0 MPa)OBM(Confining Pressure of 20 MPa)
Fig. 9 Compressive strength of the shale matrix versus immersion
time (Ct represents the compressive strength with an immersion time
of ‘‘t,’’ C0 represents the compressive strength before immersion)
Table 6 Shear strength of the bedding plane
Immersion
time (days)
WBM OBM
Shear strength (MPa) Cohesion
(MPa)
Friction
angle (�)Shear strength (MPa) Cohesion
(MPa)
Friction angle (�)
Normal
stress
of 5 MPa
Normal
Stress
of 15 MPa
Normal
stress
of 5 MPa
Normal
stress
of 15 MPa
0 7.34 12.20 4.91 25.9
1 6.25 10.58 4.08 23.4 6.84 11.54 4.48 25.2
2 5.18 8.84 3.35 20.1 6.44 11.09 4.12 24.9
4 2.99 5.64 1.67 14.8 5.75 10.12 3.56 23.6
6 2.02 4.07 0.99 11.6 5.30 9.45 3.23 22.5
8 1.67 3.58 0.72 10.8 5.16 9.27 3.11 22.3
10 1.56 3.45 0.61 10.7 4.92 8.99 2.89 22.1
1760 C. Yan et al.
123

altering the properties of the internal fracture planes in the
shale. When in contact with drilling fluid, the water-sen-
sitive shale will absorb water, resulting in a chemical
reaction as shown in Eq. 11 (Yang et al. 2006). This
reaction can lubricate the fracture plane (Yan et al. 2014a)
and reduce the friction inside the fracture. This will
accelerate the propagation of the micro-cracks due to the
increased stress transmission to the crack tip and the ulti-
mate decrease in the strength of the fracture plane.
Meanwhile, different forms of water present in shale,
including solid water, water vapor, bound water, adsorbed
water, gravitational water (free water), and capillary water,
as shown in Fig. 15. The drilling fluids may diffuse into the
0
3
6
9
12
15
0 2 4 6 8 10 12 14 16 18 20
Normal Stress / (MPa)
Shea
r Stre
ss /
(MPa
)0d WBM 1d WBM 2d WBM 4dWBM 6d WBM 8d WBM 10d
Fig. 10 Bedding plane strength in the normal-shear stress plane
(immersed in WBM)
0
3
6
9
12
15
0 2 4 6 8 10 12 14 16 18 20Normal Stress / (MPa)
Shea
r Stre
ss /
(MPa
)
0d OBM 1d OBM 2d OBM 4dOBM 6d OBM 8d OBM 10d
Fig. 11 Bedding plane strength in the normal-shear stress plane
(immersed in OBM)
0
0.2
0.4
0.6
0.8
1
0 2 4 6 8 10
Immersing Time / day
St /
S0
WBM(Normal Stress of 5 MPa)WBM(Normal Stress of 15 MPa)OBM(Normal Stress of 5 MPa)OBM(Normal Stress of 15 MPa)
Fig. 12 Shear strength of the bedding plane versus immersion time
(St represents the shear strength with an immersion time of ‘‘t,’’ S0represents the shear strength before immersion)
Fig. 13 Cementation of a micro-fracture
Fig. 14 Capillary self-absorbing phenomenon of shale
Mechanical Properties of Gas Shale During Drilling Operations 1761
123
shale due to physical and/or chemical driving forces.
Drilling fluid diffusion will lead to increases in the amount
of the absorbed water and in the thickness of the diffusion
layer around the rock particles. As a result, the shale vol-
ume will increase and swelling stress will be induced. The
swelling stress of the shale particles may reduce the
strength of the shale and facilitate the growth of the micro-
cracks.
K0:9Al2:9Si3:1O10 OHð Þ2þnH2O
! K0:9Al2:9Si3:1O10 OHð Þ2nH2O ð11Þ
The molecules of polar water can interact with the
hydroxyls on the surfaces of the mineral particles, replacing
the hydrogen bond between the particles (Hadizadeh and
Law 1991) and hydrating the contact point between the
particles. This process can lead to erosion, dissolution, or
shrinkage of the mineral particles. Consequently, the cohe-
sion between particles may decrease or disappear, causing
hydration-driven disintegration and dispersion (Shi et al.
2012). Moreover, as mentioned above, the hydration of the
bedding plane cementations improves the lubrication. The
increase in water content can cause a significant effect due to
the water–membrane bonding between the bedding plane
particles, and then the frictional contact becomes a water–
membrane contact which decreases the intergranular friction
effect (Liu and Li 2012). Therefore, the Mohr circles of the
bedding plane strength move to the left in the normal-shear
stress plane after the sample is immersed in drilling fluid.
Mechanically, the lubricating effect of water on the bedding
plane decreases its friction angle. Therefore, the samples
tend to fail along the preexisting micro-fractures after being
immersed in a WBM. However, OBMs have less impact on
the bedding plane properties due to their weak polarity.
In shale matrix, the extremely low permeability and the
lack of water-sensitive minerals result in chemical inert-
ness between the drilling fluid and the matrix, so hydration
rarely occurs. The strength of the shale matrix is less
affected by the drilling fluid than the bedding plane
strength. When the fluid filtrate becomes saturated in the
rock, the shale stops absorbing water and the shale strength
reaches a steady value.
In field operations, the speed of drilling fluid invasion
can be more rapid than that in laboratory experiments due
to the large pressure difference between the formation and
the wellbore. Thus, the decrease rate of shale strength may
be larger than that observed in the experiments. However,
the strength of gas shale will ultimately reach a stable value
due to the lack of water-sensitive minerals. Because the
drilling fluid mainly affects the weak bedding planes,
which is more prone to fail while drilling compared with
shale matrix, the appropriate use of plugging materials in
the drilling operations can minimize fluid invasion into the
bedding planes. This technique can effectively reduce the
hydration and erosion of the bedding plane cementations,
thereby improving the long-term stability of the wellbores
while drilling in gas shale formations.
6 Field Application: Borehole Stability Analysis
The development of shale gas generally requires the use of
horizontal or highly inclined wells. The stress around a
borehole in an anisotropic formation includes two parts: the
far field stress before drilling and the boundary stress induced
by anisotropy during drilling (Aadnoy 1987; Ong 1994).
Based on the concepts of generalized plane strain and lin-
early elasticity, the stress distribution around a wellbore in a
transversely isotropic formation can be described as:
rxx ¼ rxx;0 þ 2Re l21/01 z1ð Þ þ l22/
02 z2ð Þ
� �
ryy ¼ ryy;0 þ 2Re /01 z1ð Þ þ /0
2 z2ð Þ� �
sxy ¼ sxy;0 � 2Re l1/01 z1ð Þ þ l2/
02 z2ð Þ
� �
sxz ¼ sxz;0 þ 2Re l3/03 z3ð Þ
� �
syz ¼ syz;0 � 2Re /03 z3ð Þ
� �
rzz ¼ rzz;0 �1
a33a31rxx;a þ a32ryy;a� �
9>>>>>>>>>>=>>>>>>>>>>;
ð12Þ
where
/01 z1ð Þ ¼ 1
2D l1 cos h� sin hð Þ � E0l2 � D0ð Þ
/02 z2ð Þ ¼ 1
2D l2 cos h� sin hð Þ � D0 � E0l1ð Þ
/03 z3ð Þ ¼ 1
2D l3 cos h� sin hð Þ � F0l2 � l1ð Þ
9>>>>>>>=>>>>>>>;
ð13Þ
D ¼ l2 � l1D0 ¼ Pw � rxx;0
� �cos h� sxy;0 sin h� i Pw � rxx;0
� �
sin h� isxy;0 cos h
E0 ¼ � Pw � ryy;0� �
sin hþ sxy;0 cos h� i Pw � ryy;0� �
cos h� isxy;0 sin h
F0 ¼ �sxz;0 cos h� syz;0 sin hþ isxz;0 sin h� isyz;0 cos h
9>>>>>>>>>=>>>>>>>>>;ð14Þ
RockParticle
Diffusion LayerFree Water
Bound Water Absorption Water
Still Layer
Fig. 15 Water states in shale
1762 C. Yan et al.
123

where rxx , ryy , rzz , sxy , sxz ,and syz are the stress
components around the wellbore in a rectangular coordi-
nate system; the stress components with the subscripts of
‘‘0’’ and ‘‘a’’ are far field stresses before drilling and the
boundary stresses induced by anisotropy during drilling,
respectively; h is the circumferential angle on the wellbore
wall; Re is the notation for the real part of the complex
expressions in the brackets; a31, a32, and a33 are the com-
ponents of the compliance coefficient matrix of the mate-
rial /ðzkÞ ðk ¼ 1; 2; 3Þ represents the analytic functions of
the complex variable zk ¼ xþ lky; lk is the characteristic
root of the characteristic equation corresponding to the
strain compatibility equation; Pw is the mud pressure acting
on the borehole wall.
The above equations are established in a rectangular
coordinate system, but it is more convenient to conduct
borehole stability analysis using a borehole cylindrical
coordinate system (Chen et al. 2008; Yan et al. 2014b).
Therefore, the stresses in Eq. 12 are converted to a cylin-
drical coordinate system as follows:
where rrr ,rhh and rzz are the radial, tangential, and axial
stress around the wellbore, respectively; shz, srz and srh areshear stresses.
The maximum principal stress r1 and minimum prin-
cipal stress r3 on the wellbore wall can be determined as
(Fjar et al. 2008; Zhu et al. 2015):
r1 ¼rhh þ rzzð Þ
2þ
ffiffiffiffiffiffiffiffiffiffiffiffiffiffiffiffiffiffiffiffiffiffiffiffiffiffiffiffiffiffiffiffiffiffiffirhh � rzz
2
2
þs2hz
r
r3 ¼ rrr
9>=>;
ð16Þ
In bedding shales, borehole failure may include two
modes: shale matrix failure and bedding plane failure
(Zhang 2013). The single plane of weakness theory is used
to describe the failure of shale in this paper: matrix failure
and bedding plane failure are defined by Eqs. 8 and 9,
respectively (Jaeger 1960).
The collapse pressure is the minimum wellbore pressure
required to maintain wellbore stability while drilling. The
collapse pressure of a well in a gas shale formation can be
determined by inserting Eq. 16 into the single plane of
weakness theory Eqs. 8 and 9. Furthermore, the time-
dependent collapse pressure due to drilling fluid invasion can
be evaluated by combining the testing results in Sect. 4.
For determining the time-dependent collapse pressure,
elastic parameters shown in Table 4 were used. The shale
formation is under an overburden pressure of 62 MPa, a
maximum horizontal stress of 52.3 MPa, and a minimum
horizontal stress of 43.5 MPa. The formation pressure is
26 MPa. These values were obtained through an inversion
method based on the leak-off test results. The direction of
maximum horizontal stress is N90�E. The bedding dip of
the shale formation is 30� and the dip direction is 0�. TheBiot’s coefficient of the formation is 0.7.
Figures 16 and 17 show the time-dependent collapse
pressures for WBM and OBM, respectively. The collapse
pressures increase with drilling time, but the increasing rate
reduces with time and becomes very small after 6 days.
The collapse pressure is nearly constant after 10 days,
which can be regarded as the final collapse pressure with
drilling fluid invasion. When drilling along the direction of
the minimum horizontal stress, the final collapse pressure is
1.90 and 1.58 g/cm3 for WBM and OBM, respectively.
When drilling along the direction of the maximum hori-
zontal stress, the final collapse pressure is 1.56 and 1.30 g/
cm3 for WBM and OBM, respectively.
Fig. 16 Time-dependent collapse pressure with WBM
rrrrhhrzzshzsrzsrh
0BBBBBB@
1CCCCCCA
¼
cos2 h sin2 h 0 0 0 2 sin h cos hsin2 h cos2 h 0 0 0 �2 sin h cos h0 0 1 0 0 0
0 0 0 cos h � sin h 0
0 0 0 sin h cos h 0
� sin h cos h sin h cos h 0 0 0 cos2 h� sin2 h
26666664
37777775
rxxryyrzzsyzsxzsxy
0BBBBBB@
1CCCCCCA
ð15Þ
Mechanical Properties of Gas Shale During Drilling Operations 1763
123

For the case drilling along minimum horizontal stress
direction using WBM which requires a mud density higher
than 1.90 g/cm3 to maintain wellbore stability, the bore-
hole pressure is very close to the minimum horizontal
stress. Under this situation, fracturing of the wellbore and
the resulting lost circulation can easily occur in bedding
shale formations. To mitigate this problem, OBM is rec-
ommended. However, when drilling along the direction of
the maximum horizontal stress, the final collapse pressure
is low, even for WBM. Therefore, WBM and OBM can
both satisfy the wellbore stability requirements and the
engineers can have more flexibility in selecting the mud
type at a rig site. From the viewpoint of avoiding wellbore
instability, horizontal wells are recommended to be drilled
along the direction of the maximum horizontal stress.
7 Conclusions
The gas shale is characterized by the presence of clayminerals
and a laminated structure. It can be treated as a transversely
isotropic material and its strength is jointly controlled by the
matrix strength and the bedding plane strength.
Drilling fluid immersion significantly decreases the
strength of shale matrix and bedding plane.WBMhas a much
greater impact on shale strength than OBM. The drilling fluid
immersion has a much larger impact on the bedding plane
strength than on the shale matrix strength. The changes in
shale matrix strength with immersion time can be divided into
an initial slow-decreasing stage, an intermediate rapid-de-
creasing stage, and a final stable stage. Differently, the bed-
ding plane strength exhibits a rapid decrease from the very
beginning of immersion and then slows down.
When shale comes into contact with drilling fluid, the
fluid invades the rock through the intergranular micro-
fractures and micro-cracks in the shale. The fluid invasion
affects the bedding plane in two ways, i.e., increasing the
fluid pressure inside the micro-fractures with the accom-
panying decrease in the effective normal stress on the
fracture planes and altering the properties of the internal
fracture planes in the shale. Conversely, the strength of the
shale matrix is less affected by the drilling fluid because it
usually has extremely low permeability and very little
water-sensitive minerals compared to the bedding planes.
The collapse pressure gradually increases as the drilling
time increases. WBM filtration results in a larger increase
in collapse pressure compared with OBM. Thus, OBM is
recommended for drilling bedding shale formations to
maintain the long-term stability of the borehole.
Acknowledgements The authors would like to thank the editor and
the anonymous reviewers for their helpful and constructive com-
ments. This work is financially supported by the Changjiang Scholars
and Innovative Research Team in University (Grant No. IRT_14R58),
the National Basic Research Program of China (973 Program) (Grant
No. 2015CB251201), the National Natural Science Foundation Pro-
ject of China (Grant No. 51574270 and 51504280), Fundamental
Research Funds for the Central Universities (Grant No.
15CX02009A), the Qingdao Science and Technology Project (Grant
No. 15-9-1-55-jch).
References
Aadnoy BS (1987) Continuum mechanics analysis of the stability of
inclined boreholes in anisotropic rock formations. Ph.D. Thesis.
Norwegian Institute of Technology, University of Trondheim
Chen M, Jin Y, Zhang GQ (2008) Petroleum related rock mechanics.
Science Press, Beijing
Chenevert ME (1964) The deformation-failure characteristics of
laminated sedimentary rocks. University of Texas
Cho JW, Kim H, Jeon S, Min KB (2012) Deformation and strength
anisotropy of Asan gneiss, Boryeong shale, and Yeoncheon
schist. Int J Rock Mech Min Sci 50:158–169
Fjær E, Nes OM (2013) Strength anisotropy of Mancos shale. In:
Proceedings of the 47th US rock mechanics/geomechanics
symposium. San Francisco
Fjar E, Holt RM, Raaen AM, Risnes R, Horsrud P (2008) Petroleum
related rock mechanics. Elsevier Science, Amsterdam
Gautam R, Wong RC (2006) Transversely isotropic stiffness param-
eters and their measurement in Colorado shale. Can Geotech J
43(12):1290–1305
Gol’denblat II, Kopnov VA (1965) Strength of glass-reinforced
plastics in the complex stress state. Mech Comp Mater
1(2):54–59
Guo TK (2013) Mechanism Research on Hydraulic Fracturing by
Stimulated Reservoir Volume (SRV) for Shale Play. Ph.D.
Thesis. China University of Petroleum (Beijing)
Guo TK, Zhang SC, Qu ZQ, Zhou T, Xiao YS, Gao J (2014)
Experimental study of hydraulic fracturing for shale by stimu-
lated reservoir volume. Fuel 128:373–380
Hadizadeh J, Law RD (1991) Water-weakening of sandstone and
quartzite deformed at various stress and strain rates. Int J Rock
Mech Min Sci Geomech Abstr 28(5):431–439
Heng S, Guo Y, Yang C, Daemen JJ, Li Z (2015) Experimental and
theoretical study of the anisotropic properties of shale. Int J Rock
Mech Min Sci 74:58–68
Fig. 17 Time-dependent collapse pressure with OBM
1764 C. Yan et al.
123
Higgins S, Goodwin S, Donald A, Bratton T, Tracy G (2008)
Anisotropic stress models improve completion design in the
Baxter Shale. In: SPE annual technical conference and exhibi-
tion, Denver, Colorado
Hill R (1998) The mathematical theory of plasticity. Oxford
University Press, Oxford
Hornby BE (1994) The elastic properties of shales. Ph.D. Thesis.
University of Cambridge
Jaeger JC (1960) Shear failure of anisotropic rocks. Geol Mag
97(1):65–72
Jaeger J, Cook NGW, Zimmerman R (2007) Fundamentals of rock
mechanics. Blackwell, London
Jiang S (2011) Geological theory innovations and advances in drilling
and completion technology for shale gas development. Pet Drill
Technol 39(3):17–23
Karr DG, Law FP, Fatt MH, Cox GF (1989) Asymptotic and quadratic
failure criteria for anisotropic materials. Int J Plast 5(4):303–336
Kuila U, Dewhurst DN, Siggins AF, Raven MD (2011) Stress
anisotropy and velocity anisotropy in low porosity shale.
Tectonophysics 503(1):34–44
Liang C, Chen M, Jin Y, Lu Y (2014) Wellbore stability model for
shale gas reservoir considering the coupling of multi-weakness
planes and porous flow. J Nat Gas Sci Eng 21:364–378
Liu J, Li JP (2012) Study of shear strength water sensitivity of intact
schist from Guzhu expressway. Rock Soil Mech
33(6):1719–1723
Liu RH, Feng WG, Long L (2008) Experimental studies on the
mechanics and acoustics of tight carbonate rock. Pet Geol
Oilfield Dev Daqing 27(6):131–134
Lo T, Coyner KB, Toksoz MN (1986) Experimental determination of
elastic anisotropy of Berea sandstone, Chicopee shale, and
Chelmsford granite. Geophysics 51(1):164–171
McLamore R, Gray KE (1967) The mechanical behavior of
anisotropic sedimentary rocks. J Eng Ind 89:62
McLellan PJ, Cormier K (1996) Borehole instability in fissile, dipping
shales, Northeastern British Columbia. In: SPE gas technology
symposium. Alberta
Mortara G (2010) A yield criterion for isotropic and cross-anisotropic
cohesive-frictional materials. Int J Numer Anal Methods
Geomech 34(9):953–977
Niandou H, Shao JF, Henry JP, Fourmaintraux D (1997) Laboratory
investigation of the mechanical behaviour of Tournemire shale.
Int J Rock Mech Min Sci 34(1):3–16
Ong SH (1994) Borehole stability. Ph.D. Thesis. University of
Oklahoma
Rasouli V, Sutherland A (2014) Geomechanical characteristics of gas
shales: a case study in the North Perth Basin. Rock Mech Rock
Eng 47(6):2031–2046
Sarout J, Molez L, Gueguen Y, Hoteit N (2007) Shale dynamic
properties and anisotropy under triaxial loading: experimental
and theoretical investigations. Phys Chem Earth 32(8):896–906
Sayers CM (2005) Seismic anisotropy of shales. Geophys Prospect
53(5):667–676
Sayers CM (2013) The effect of anisotropy on the Young’s moduli
and Poisson’s ratios of shales. Geophys Prospect 61(2):416–426
Shi B, Xia B, Lin Y (2012) CT imaging and mechanism analysis of
crack development by hydration in hard-brittle shale formations.
Act Pet Sin 33(1):137–142
Sondergeld, CH, Rai CS, Margesson RW, Whidden KJ (2000)
Ultrasonic measurement of anisotropy on the Kimmeridge shale.
In: 70th annual international meeting, SEG. Alberta
Sondergeld CH, Rai CS (2011) Lead Edge 30(3):324–331
Sone H, Zoback M (2013a) Relation between creep compliance and
elastic modulus in organic-rich shales observed through labora-
tory experiments. In: EGU general assembly conference
abstracts. Vienna
Sone H, Zoback MD (2013b) Mechanical properties of shale-gas
reservoir rocks—part 1: static and dynamic elastic properties and
anisotropy. Geophysics 78(5):381–392
Sone H, Zoback MD (2013c) Mechanical properties of shale-gas
reservoir rocks—part 2: ductile creep, brittle strength, and their
relation to the elastic modulus. Geophysics 78(5):393–402
Sone H, Zoback MD (2014) Time-dependent deformation of shale gas
reservoir rocks and its long-term effect on the in situ state of
stress. Int J Rock Mech Min Sci 69:120–132
Suarez-Rivera R, Green S, Handwerger D, Martin W, Kieschnick J
(2005) Accounting for heterogeneity provides a new perspective
for completions in tight gas shales. In: The 40th US symposium
on rock mechanics (USRMS). Alaska
Tien YM, Kuo MC (2001) A failure criterion for transversely
isotropic rocks. Int J Rock Mech Min Sci 38(3):399–412
Vernik L, Milovac J (2011) Rock physics of organic shales. Lead
Edge 30(3):318–323
Vernik L, Nur A (1992) Ultrasonic velocity and anisotropy of
hydrocarbon source rocks. Geophysics 57(5):727–735
Walsh JB, Brace WF (1964) A fracture criterion for brittle anisotropic
rock. J Geophys Res 69(16):3449–3456
Wang Q, Wang P, Xiang DG, Feng YS (2012) Anisotropic property
of mechanical parameters of shales. Nat Gas Ind 32(12):62–65
Yan C, Deng JG, Yu B, Tan Q, Deng FC, Zhu H, Hu L, Chen Z
(2013) Research on collapsing pressure of gas shale. Chin J Rock
Mech Eng 32(8):1595–1602
Yan C, Deng J, Yu B, Liu H, Deng F, Chen Z, Hu L, Zhu H, Han Q
(2014a) Wellbore stability analysis and its application in the
Fergana basin, central Asia. J Geophys Eng 11(1):1–9
Yan C, Deng J, Yu B, Li W, Chen Z, Hu L, Li Y (2014b) Borehole
stability in high-temperature formations. Rock Mech Rock Eng
47(6):2199–2209
Yan C, Deng J, Hu L, Chen Z, Yan X, Lin H, Tan Q, Yu B (2015)
Brittle failure of shale under uniaxial compression. Arab J
Geosci 8(5):2467–2475
Yang C, Mao H, Wang X, Li X, Chen J (2006) Study on variation of
microstructure and mechanical properties of water-weakening
slates. Rock Soil Mech 27(12):2090–2098
You L, Kang Y, Chen Z (2014) Wellbore instability in shale gas wells
drilled by oil-based fluids. Int J Rock Mech Min Sci 72:294–299
Yu BH, Deng JG, Wang HG (2007) Borehole stability technique for
Huoerguosi anticline, Junggar Basin, North west China. Pet
Explor Dev 34(1):108–112
Yuan JL (2014) Mechanical properties evaluation of shale reservoir
and engineering applications. Ph.D. Thesis. China University of
Petroleum (Beijing)
Yuan J, Deng J, Yu B, Tan Q, Fan B (2012) Wellbore stability of
horizontal wells in shale gas reservoirs. Nat Gas Ind 32(9):66–70
Yuan JL, Deng JG, Tan Q, Yu BH, Jin XC (2013) Borehole stability
analysis of horizontal drilling in shale gas reservoirs. Rock Mech
Rock Eng 46(5):1157–1164
Zhang J (2013) Borehole stability analysis accounting for anisotropies
in drilling to weak bedding planes. Int J Rock Mech Min Sci
60:160–170
Zhang H, Kang Y, Cheng J (2007) Experimental study on mechanical
properties of dense sandstone under different confining pres-
sures. Chin J Rock Mech Eng 26(S):4227–4231
Zhao JZ, LI ZK, Sun JJ, Yan J, Dong GH, Li R (2004) Triaxial stress
test of rock and primary research on the rule of compaction
effect. J Univ Pet 28(4):56–58
Zhu H, Deng J, Jin X, Hu L, Luo B (2015) Hydraulic fracture
initiation and propagation from wellbore with oriented perfora-
tion. Rock Mech Rock Eng 8(2):585–601
Zou C, Dong D, Wang S, Li J, Li X, Wang Y, Cheng K (2010)
Geological characteristics and resource potential of shale gas in
China. Pet Explor Dev 37(6):641–653
Mechanical Properties of Gas Shale During Drilling Operations 1765
123
Recommended