Southern Illinois University CarbondaleOpenSIUC
Dissertations Theses and Dissertations
12-2009
Mechanics of Stimulus & Response Generalizationin Signal Detection & Psychophysics: Adaptationof Static Theory to Dynamic Performance.Blake Allen HutsellSouthern Illinois University Carbondale, [email protected]
Follow this and additional works at: http://opensiuc.lib.siu.edu/dissertations
This Open Access Dissertation is brought to you for free and open access by the Theses and Dissertations at OpenSIUC. It has been accepted forinclusion in Dissertations by an authorized administrator of OpenSIUC. For more information, please contact [email protected].
Recommended CitationHutsell, Blake Allen, "Mechanics of Stimulus & Response Generalization in Signal Detection & Psychophysics: Adaptation of StaticTheory to Dynamic Performance." (2009). Dissertations. Paper 98.
MECHANICS OF STIMULUS & RESPONSE GENERALIZATION IN SIGNAL DETECTION & PSYCHOPHYSICS: ADAPTATION OF STATIC THEORY TO
DYNAMIC PERFORMANCE.
By
Blake A. Hutsell
B.S., Arkansas State University, 2003 M.A., Southern Illinois University, 2008
A Dissertation Submitted in Partial Fulfillment of the Requirements for the
Doctor of Philosophy Degree
Department of Psychology
In the Graduate School Southern Illinois University Carbondale
December, 2009
DISSERTATION APPROVAL
MECHANICS OF STIMULUS & RESPONSE GENERALIZATION IN SIGNAL DETECTION & PSYCHOPHYSICS: ADAPTATION OF STATIC THEORY TO
DYNAMIC PERFORMANCE.
By
Blake A. Hutsell
A Dissertation Submitted in Partial
Fulfillment of the Requirements
for the Degree of
Doctor of Philosophy
in the field of Psychology
Approved by:
Eric A. Jacobs, Chair
Michael Young
Matthew Schlesinger
David Gilbert
Michael May
Graduate School Southern Illinois University Carbondale
November 4, 2009
i
AN ABSTRACT OF THE DISSERTATION OF
Blake A. Hutsell, for the Doctor of Philosophy degree in Psychology, presented on November 4, 2009, at Southern Illinois University Carbondale. TITLE: MECHANICS OF STIMULUS & RESPONSE GENERALIZATION IN SIGNAL DETECTION & PSYCHOPHYSICS: ADAPTATION OF STATIC THEORY TO DYNAMIC PERFORMANCE. MAJOR PROFESSOR: Eric A. Jacobs, Ph.D.
The area of perceptual decision-making research seeks to understand how our
perception of the world affects our judgment. Laboratory investigations of perceptual
decision-making concentrate on observers’ ability to discriminate among stimuli and
their biases towards reporting one stimulus more frequently than others. Choice
theories assume that these performance measures are determined by generalization of
reinforcement along both stimulus and response dimensions. Historically the majority
of research has addressed situations in which the difference among stimuli and
resulting consequences of a perceptual decision are static. Consequently, little is
known about the dynamics of stimulus and response generalization. The present
research investigated the dynamics of discrimination accuracy and response bias by
frequently varying differences among stimuli and the outcomes for correct decisions.
In Experiment 1, four rats responded in a two-stimulus, two-response
detection procedure employing temporal stimuli (short vs. long houselight
presentations). Sample stimulus difference was varied over two levels across
experimental conditions. A rapid acquisition procedure was employed in which
relative reinforcer frequency varied daily. Shifts in response bias were well described
by a behavioral model of detection (Davison & Nevin, 1999). Within sessions, bias
adjusted rapidly to current reinforcer ratios when the sample stimulus difference was
ii
large, but not when the difference was small. In Experiment 2, three rats responded in
a five-stimulus, two-response detection procedure employing temporal stimuli.
Relative reinforcer frequency was again varied daily. Control by current session
reinforcer ratios increased rapidly within sessions in a nearly monotonic fashion.
Furthermore, response bias following each sample stimulus was observed within the
first few trials of an experimental session. The speed of changes in response bias,
especially following an unreinforced probe stimulus, provide strong support for an
effective reinforcement process and suggest that this process may operate at a trial-
by-trial level. In Experiment 3, three rats responded in a six-stimulus, two-response
classification procedure. A repeated-acquisition procedure was employed in which
the relationship between classes of short and long sample stimuli and their respective
correct comparison locations reversed every 15 sessions. After several reversals, the
probabilities of reinforcement for correct classification were also manipulated. In the
majority of conditions across subjects, response bias reached half-asymptotic levels
more rapidly than did discrimination accuracy. These findings provide some support
for a backward chaining account of the acquisition of signal detection performance.
An attention-augmented behavioral detection model accurately described the
acquisition data; however parameter estimates expressing the probability of attending
to sample and comparison stimuli differed widely among subjects.
The results of these experiments support the adaptation of dynamic research
methodologies to the study of learning in perceptual decision-making tasks.
Furthermore, discrimination performance and response bias adapt rapidly to frequent
changes in reinforcement contingencies. Quantitative models formulated to describe
iii
static performance in detection procedures can be extended to predict dynamic
performance. Some theoretical assumptions of these models were supported and
others were violated. Overall, this research supports a renewed emphasis on learning
in signal detection procedures and suggests that stable behavioral endpoints are at
least as much a function of contingency variables as they are of sensory variables.

iv
ACKNOWLEDGEMENTS
I would like to thank my advisor, Eric Jacobs, for his encouragement,
enthusiasm, and guidance throughout the course of this project. Over my entire
graduate career Eric has provided me with the freedom to pursue my own interests,
has shaped my world view, and most importantly been my friend. I wish to
acknowledge my other academic parents Kris Biondolillo and Craig Jones who
ignited a passion for the science of behavior. I would like to thank Mike Young for
service in all of my committees, exposing me to valuable domains outside behavior
analysis, and for setting such high standards for me. I thank the other members of my
dissertation committee Dave Gilbert, Michael May, and Matt Schlesinger for valuable
comments and suggestions.
I would like to thank a number of other students for support and friendship. I
thank fellow graduate students Josh Beckmann, Cathy Jones, Jose Martinez, and
Steve Neese for their continuous encouragement, enthusiasm, and fond memories. I
thank former undergraduate students Andy Rodewald and Melissa Swisher for their
outstanding efforts in the lab and for sparking an enthusiasm for teaching.
Finally, I wish to thank my parents and family for their unconditional support
and affection. To my parents, in particular, I cannot express my gratitude; any success
I have had rightfully belongs to them. Thanks for believing in me when I did not.
v
TABLE OF CONTENTS
CHAPTER PAGE
ABSTRACT.....................................................................................................................i
ACKNOWLEDGMENTS .............................................................................................iv
LIST OF TABLES.........................................................................................................vi
LIST OF FIGURES ..................................................................................................... vii
CHAPTERS
Psychophysics, Signal Detection, and Operant Behavior...............................................1
Signal Detection: Accuracy and Bias .................................................................4
Signal Detection as Operant Behavior................................................................7
A Matching Model of Detection .........................................................................8
A Detection Model of Choice ...........................................................................13
Variations in Attending.....................................................................................17
Learning in Detection .......................................................................................19
The Present Research........................................................................................24
Rapid Acquisition of Bias in Signal Detection. ............................................................29
Method ..............................................................................................................35
Results...............................................................................................................39
Discussion.........................................................................................................45
Rapid Shifts in the Psychometric Function for Time ...................................................48
Method ..............................................................................................................55
Results...............................................................................................................58
vi
Discussion.........................................................................................................64
Dynamics of Attending in the Repeated Acquisition of a Temporal
Discrimination………………………………………………………………………..68
Method ..............................................................................................................76
Results...............................................................................................................79
Discussion.........................................................................................................88
General Discussion .......................................................................................................94
Assessment of Dynamic Methodology ...........................................................100
Implications for Theory ..................................................................................102
The Spread of Effect .......................................................................................109
Future Directions ............................................................................................113
Conclusion ......................................................................................................116
REFERENCES ...........................................................................................................151
VITA .........................................................................................................................177
vii
LIST OF TABLES
TABLE PAGE
Table 1.1 .....................................................................................................................118
Table 3.1 .....................................................................................................................119
Table 4.1 .....................................................................................................................120
Table 4.2 .....................................................................................................................121
Table 4.3 .....................................................................................................................122
viii
LIST OF FIGURES
FIGURE PAGE
Figure 1.1 ....................................................................................................................123
Figure 1.2 ....................................................................................................................124
Figure 1.3 ....................................................................................................................125
Figure 2.1 ....................................................................................................................126
Figure 2.2 ....................................................................................................................127
Figure 2.3 ....................................................................................................................128
Figure 2.4 ....................................................................................................................129
Figure 2.5 ....................................................................................................................130
Figure 2.6 ....................................................................................................................131
Figure 2.7 ....................................................................................................................132
Figure 3.1 ....................................................................................................................133
Figure 3.2 ....................................................................................................................134
Figure 3.3 ....................................................................................................................135
Figure 3.4 ....................................................................................................................136
Figure 3.5 ....................................................................................................................137
Figure 3.6 ....................................................................................................................138
Figure 3.7 ....................................................................................................................139
Figure 3.8 ....................................................................................................................140
Figure 4.1 ....................................................................................................................141
Figure 4.2 ....................................................................................................................142
Figure 4.3 ....................................................................................................................143

ix
Figure 4.4 ....................................................................................................................144
Figure 4.5 ....................................................................................................................145
Figure 4.6 ....................................................................................................................146
Figure 4.7 ....................................................................................................................147
Figure 4.8 ....................................................................................................................148
Figure 4.9 ....................................................................................................................149
Figure 4.10 ..................................................................................................................150
1
CHAPTER 1
PSYCHOPHYSICS, SIGNAL DETECTION, AND OPERANT BEHAVIOR
Most would agree that if the world were exactly as we perceive it, then all our
decisions would be perfectly accurate and the resulting consequences would be those
we desire most. However, with experience, most of us become aware that the world
often differs greatly from our perceptions. Moreover, we are aware that all too often
our actions do not produce their intended effects. From our personal lives to our
professional, the consequences of our decisions affect us as well as others. At times,
the stakes are low; however, at other times the consequences of our actions can be
dire. Many decisions require one to make a positive or negative decision based on the
presence or absence of a particular event or piece of evidence. In this type of
decision-making scenario, two types of mismatch between the true state of the world
and our perceptions of it are possible. We can incorrectly conclude that the evidence
for the event is satisfactory when it in fact is not and we can conclude the evidence is
insufficient when it is actually adequate. The first error is called a false positive (false
alarm) and the second a false negative (miss). Both are false assertions about the true
state of the world and may be costly. Two independent facets of the world produce
perceptual errors, the similarity of individual pieces of evidence and the consequences
of positive and false judgments. For example, a quality control inspector must decide
whether a textile meets or exceeds customer expectations. Clearly, no two pieces of
fabric are identical and different customer bases have diverse demands. As a result,
what the inspector judges to be of good quality depends on existing expectations and
2
the fiscal consequences of incorrect designation of quality. Incorrect assignment of
quality to a defective fabric will hurt the brand name. However, too high of a quality
criterion is costly as much valuable material is discarded. The quality inspector must
adopt a criterion that is neither too lenient nor to restrictive. To be successful, the
individual must strike the right balance between erroneous judgments of poor quality
fabric being treated as though it were high and high quality fabric mistakenly judged
as poor. That is, the inspector must accept a certain frequency of errors; however,
market forces will ultimately determine how strict the criterion must be if the
manufacturer is to succeed. In other situations, the cost associated with each type of
error is asymmetrical. For example, prognosis of a fatal disease and diagnosis of
developmental disabilities carry with them greater costs of false judgments.
The area of perceptual decision-making research seeks to understand how the
disparity between the world and our perceptions of it affect our judgments and how
we might go about bringing the two into better alignment. This area of decision-
making research has historically addressed situations in which the evidence and
resulting consequences of a perceptual decision are static. The present dissertation
attempts to study the dynamics of decision criteria by frequently varying evidence
and decision outcomes. Specifically, by employing identification and categorization
paradigms to study nonhuman behavior in a laboratory setting I hope to better
understand how individuals learn to adopt a particular decision criterion.
Additionally, a systematic understanding of the perceptual decision process may shed
light on why individuals frequently make less than optimal judgments.
3
The following is intended to provide the reader with an introduction to the
breadth of topics that inform the present work and simultaneously bring the goals of
the present research into sharper focus. These topics include: research on choice
(Herrnstein, 1970; Luce, 1963a), stimulus control (Dinsmoor, 1995; Guttman &
Kalish, 1956; Honig & Urcuioli,1981), detection and identification (Luce & Galanter,
1963a; Luce & Green, 1974; Green, 1960), psychophysical scaling (Luce & Galanter,
1963; Thurstone, 1927a, 1927b), and mathematical treatments of the temporal
patterning of responses (Blough, 1963; Killeen, Hall, Reilly, & Kettle, 2002; Luce,
1986; Link, 1992, McGill, 1963; Palya, 1992; Shull, 1991; Shull, Gaynor, & Grimes,
2001). Each topic has been studied extensively within two distinct, yet
complementary traditions, the experimental analysis of behavior and psychophysics.
Put most broadly, the focus of this research area is the processes by which distal
environmental consequences come to have an affect upon an organism’s behavior in a
particular context. The present work is aimed at contributing to the methodological
and empirical study of the dynamics of reinforcer effects of behavior-produced
consequences that extend through stimulus and response dimensions to affect
different classes of behavior at other times and in the presence of different stimuli
(Hineline, 1993; Killeen, 1992; 1994).
This first chapter is intended to provide a general background on an area of
research that has evolved over the last 40 years out of a union of psychophysics and
the experimental analysis of behavior. First, I provide an overview of some
commonly employed procedures and introduce prominent measures of performance
taken from signal detection theory. Next, I will discuss research and theory that has
4
mostly been informed by non-human research conducted in the tradition of the
experimental analysis of behavior. These sections concentrate on theory development,
specifically quantitative formulations of performance in signal detection,
identification, and matching-to-sample procedures. The introductory section
concludes with a discussion of the goals of this dissertation and outlines future
research. Each subsequent chapter contains a review of the literature deemed most
pertinent to each experiment.
Signal Detection: Accuracy and Bias.
One of the simplest psychophysical procedures is sometimes called a
correspondence experiment (Macmillan & Creelman, 1991). In such a procedure, a
correspondence is said to exist between the stimuli presented and responses available.
That is, for each stimulus presented to the subject, a single response corresponds to
that stimulus. The simplest form of correspondence experiment is the one-interval
design. In the one-interval design, a single stimulus representing one of two possible
classes of stimuli is presented to the subject on every trial. The subject’s task is to
identify the stimulus as being a member of one class or the other. The one-interval
design is equivalent to the “yes-no” detection experiment. The “yes-no” task has been
historically labeled as such due to its early use in absolute identification, where
subjects were sometimes presented with a stimulus plus background noise or just
background noise alone.
In Figure 1.1, the “yes-no” or “go, no-go” task is diagrammed as the classic
absolute identification task where a stimulus plus noise is presented or noise alone is
presented to the subject. In the absolute identification task, however, the concurrently
5
available response (B2) indicating noise alone is sometimes not explicitly measured.
Alternatively, in a standard 2-stimulus, 2-response recognition task (Figure 1.1),
subjects are presented with one of the two possible stimuli (S1 or S2) on each trial.
One type of response (a B1 response, e.g., a right button press) is deemed correct on
S1 trials and the other type of response (a B2 response, e.g., a left button press) is
deemed correct on S2 trials. Feedback on the accuracy of the subjects’ performance is
typically given in the form of payoffs for correct responses and/or penalties for
incorrect responses.
There are two key measures of performance in such procedures: the frequency
with which subjects respond correctly and the frequency with which subjects make
one type of response more frequently than others. The former measure is accuracy
which ostensibly relates to the sensory aspects of the procedure, and the latter
measure is called response bias and relates to decision variables such as payoffs or
information feedback for correct and incorrect responses, respectively. These two
primary measures of performance in a “yes-no” task can be visualized by plotting a
receiver operating characteristic (ROC) function. Briefly, the ROC curve is a plot of
the probability of the subject responding “yes” a signal was present plotted on the y-
axis and the probability of saying “yes” when the noise alone was present plotted on
the x-axis. The top graph of Figure 1.2 is a plot of a standard ROC curve with four
levels of accuracy or sensitivity. The hit and false alarm probabilities have been
plotted as their z transforms and are thus linear in these coordinates. Perhaps the most
widely used measure of sensitivity (assuming an equal variance model) is d' as
6
indexed by the distance of each line from the major diagonal and given by the
equation:
' ( ) ( )d z H z FA= − (1.1)
where z is the inverse of the Gaussian probability density function and H and FA are
the hit and false alarm probabilities (see Fig. 1.1), respectively (MacMillan &
Creelman, 1991; Swets, 1986a, 1986b). The points lying along each line in Figure 1.2
would result from biasing manipulations such as instructions, unequal payoffs, or
unequal penalties (Voss, McCarthy, & Davison, 1993). Each data point lying upon
the same line indicates varying degrees of bias with a constant level of accuracy or
sensitivity; a condition called isosensitivity (Luce, 1963a). Specifically, the measure
of bias used to generate the points in Figure 1.2 is given by the criterion location
measure c. This measure is calculated as:
[ ]1 ( ) ( )2
c z H z FA= − + (1.2)
where all notation is as above. The bottom graph of Figure 1.2 is a plot of a z-
transformed ROC curve with four levels of bias given by c indicated in the figure.
The distance from the minor diagonal, which is indicated as a criterion value of zero,
indexes the degree of bias and points lying the same distance from the minor diagonal
at different levels of sensitivity satisfy a condition called isobias. Thus, the isobias
curve is the complement of the isosensitivity curve. Isobias curves result from a
biasing manipulations being held constant, while the signal to noise ratio is varied
across experimental conditions.
7
Signal Detection as Operant Behavior.
Nevin’s (1969) review of Green and Swets’ (1966) foundational text on signal
detection theory provided the conceptual bridge between the human psychophysics
and nonhuman learning laboratories that continues to provide a framework for the
study of the discriminated operant (Davison & Nevin, 1999; Shull, 1999; White &
Wixted, 1999). Nevin pointed out important methodological similarities between the
two disciplines and provided an analysis of response bias by extending the matching
law treatment of choice in concurrent schedules of reinforcement (Catania, 1963a,
1963b, 1966; Herrnstein, 1961; Pliskoff, Shull, and Gollub, 1968).
Nevin recognized that the standard “yes-no” signal detection experiment of
psychophysics (Bush, Galanter, & Luce, 1963) resembles a complex schedule of
reinforcement (Ferster & Skinner, 1957). The 2x2-detection task is commonly treated
as a variant of the matching-to-sample (MTS) task in the learning literature (Catania,
1998). Nevin suggested that the “yes-no” procedure is a concurrent schedule of
reinforcement (B1 and B2 available simultaneously) within the context of a multiple
or mixed schedule of reinforcement depending on the similarity of S1 and S2,
respectively (see also Nevin, 1981). Multiple and mixed schedules of reinforcement
(Ferster & Skinner, 1957) are composed of successively presented component
reinforcement schedules, in which the transitions between each schedule are either
signaled (i.e., multiple schedule) or unsignaled (i.e., mixed schedule). Thus, the “yes-
no” task exists within the continuum of multiple-to-mixed concurrent schedules of
reinforcement. When S1 is not discriminable form S2, conditions approximate a mixed
8
schedule. When S1 is highly discriminable from S2, conditions approximate a multiple
schedule.
The most enduring contribution of Nevin’s (1969) review was his reanalysis
of some data presented by Green and Swets (1966). The data reported by Green and
Swets were obtained from a single subject in an auditory “yes-no” task. In the
procedure from which the data were taken, the strength of an auditory signal
remained constant while the probability of signal presentation or the relative payoffs
for responding “yes” were varied to generate a receiver operating characteristic
(ROC) function. Nevin’s reanalysis demonstrated that the probability of a “yes”
response was approximately equal to the relative frequency of payoff for responding
“yes”. Nevin speculated that the matching relation he found must depend in some
way on the strength of the signal presented to the subject. The demonstration of
matching of response to reinforcer proportions in a signal detection procedure by
Nevin (1969) would form the basis of modeling efforts for the next two decades.
However, his suggestion that the strength of the signal and reinforcement
contingencies be treated similarly would not be investigated for many years (Davison
& Nevin, 1999; Nevin, 1981).
A Matching Model of Detection.
Following Nevin’s (1969) lead, Davison and Tustin (1978) presented a model
for performance in signal detection procedures based upon the generalized matching
law (Baum, 1974; 1979; Herrnstein, 1961). Davison and Tustin provided a choice-
based model of detection performance that assumes that stimulus and payoff
manipulations are independent sources of response bias. Therefore, the isosensitivity
9
curve (Fig. 1.2), which is often obtained from subjects in studies of detection
performance (Green & Swets, 1966; Macmillan & Creelman, 1991; Nevin, 1969;
1981), is the result of variation in payoffs at a constant level of stimulus difference,
while the isobias curve results from variation in stimulus differences at constant
relative payoffs. Although the model has been shown to be inadequate, it is an
important historical development and thus foreshadows future efforts to model bias
from a matching law-based approach.
Davison and Tustin’s (1978) model predicts that choice among response
alternatives in a 2-stimulus, 2-response detection task is independently determined by
the reinforcer frequency ratio and the physical difference between the sample stimuli.
The equation for predicting performance on S1 trials is
dcR
Rra
B
Bloglog
22
11log12
11log ++⎟⎟
⎠
⎞
⎜⎜
⎝
⎛=
⎟⎟
⎠
⎞
⎜⎜
⎝
⎛ (1.3a)
and the equation for performance on S2 trials is
dcR
Rra
B
Bloglog
22
11log22
21log −+⎟⎟
⎠
⎞
⎜⎜
⎝
⎛=
⎟⎟
⎠
⎞
⎜⎜
⎝
⎛ (1.3b)
where Bij and Rij are the response and reinforcer frequencies identified by the
stimulus (S1 or S2) and response alternative (B1 or B2) to which it occurs (see Fig.
1.2). The parameter ar, measures the extent to which variation in the reinforcer
frequency ratio produces changes in the response ratio. Note that the log d and log c
parameters are not the same as the d' and c parameters of detection theory, although
the parameters do measure somewhat similar aspects of performance. The parameter
log d, measures a constant preference towards making a correct response, which
depends upon the difference between S1 and S2. Thus, the signs are opposite in the
10
two equations. In the generalized matching approach, log c measures any constant
bias towards one response alternative that is independent of variation in the reinforcer
frequency ratio (i.e., side or comparison color preference, unequal response force
requirements; see Baum, 1974; 1979). The parameters log d and log c are assumed to
be independent sources of preference in a detection task. That is, discrimination, as
measured by log d, must be equal in both equations and log c is a measure of any
residual preference due to variables other than reinforcer frequency or stimulus
difference.
The chief prediction following from Davison and Tustin’s (1978) formulation
is that stimulus and reinforcer variables are independent sources of bias in a detection
task. This assumption of independence can be seen when Equations 1.3a and 1.3b are
added to produce an equation that predicts overall response bias, log B. Davison and
Tustin’s equation for measuring overall response bias, after algebraic simplification,
is:
cR
Rra
BB
BBB log
22
11log2212
2111log5.0log +=⋅
⋅= ⎟
⎟⎠
⎞⎜⎜⎝
⎛⎟⎟
⎠
⎞
⎜⎜
⎝
⎛ (1.4)
where all variables, variable subscripts, and parameters are as above. Note that in the
derivation of Equation 1.4, the stimulus bias term (log d) has dropped out of the
equation. Therefore, Davison and Tustin’s equation for bias states that the relative
frequency of making a B1 or B2 response in the presence of S1 or S2 is a linear
function of the relative frequency of reinforcers for correct responses and
uncontrolled sources of bias. Furthermore, the equation predicts that bias is
independent of discrimination between S1 and S2. While adding Equations 1.3a and
11
1.3b provides an overall measure of bias in a detection task, subtraction of the two
equations gives an overall measure of discrimination. Davison and Tustin’s equation
for measuring discrimination performance is:
⎟⎟⎠
⎞⎜⎜⎝
⎛
⋅
⋅=
21122211log5.0log
BBBB
d (1.5)
where Bij are the response frequencies as defined above. The measure log d is the
geometric mean of the ratio of correct and error responses. The antilog of this
measure of discrimination is the inverse of the confusion measure η derived from
choice theory (Luce, 1963; Shepard, 1957, 1958a). Note that the terms indicating the
frequencies of reinforcers for each correct response do not appear in Equation 1.5.
Therefore, the detection model of Davison and Tustin predicts independence between
bias and discrimination performance in a detection task.
Initial research conducted and analyzed according to Davison and Tustin’s
model supported the predicted independence of bias and discriminability. McCarthy
and Davison (1979) reported a study in which the physical difference between S1 and
S2 was held constant and the frequency of reinforcement for correct responses was
varied across several conditions. They reported that as bias (log b) varied directly
with the reinforcer ratio, point estimates of log d were constant; therefore bias and
discrimination were independent. McCarthy and Davison (1980a) again varied the
relative frequency of reinforcers for correct responses, but over two levels of stimulus
difference across conditions. They also reported that bias (log b) and discrimination
(log d) were independent. Subsequently, McCarthy and Davison (1980b) reported that
these measures were independent over a larger range of variation in stimulus
difference.
12
Although early research supported the independence assumption of Davison
and Tustin’s model (for review see Davison & McCarthy, 1988; McCarthy &
Davison, 1981a, 1981b), later, more extensive studies reported interactions between
bias and discriminability. McCarthy and Davison (1984) carried out a large
parametric study in which they varied the reinforcer ratio across three levels at each
of five levels of difference between S1 and S2 in a detection task with pigeons.
McCarthy and Davison also studied the effects of two procedures for scheduling
reinforcers for correct responses (see also Stubbs, 1976). The first procedure called a
controlled reinforcer ratio procedure, sets up a reinforcer for a correct response and
assigns no further reinforcers until the appropriate response occurs and the assigned
reinforcer is obtained. In the uncontrolled reinforcer ratio procedure, the scheduling
of reinforcers for each correct response is independent of the other. In the choice
literature, these two procedures for scheduling reinforcers concurrently are referred to
as independent (Herrnstein, 1961) and dependent schedules (Stubbs & Pliskoff,
1969), respectively. McCarthy and Davison (1984) found that the relation between
bias and discriminability depended upon the scheduling arrangement. In their
controlled reinforcer ratio procedure (dependent schedule), estimates of bias remained
constant as the sample stimuli where made more different, thus replicating previous
work. In the uncontrolled reinforcer ratio procedure (independent schedule), however,
bias was greater in the conditions of lower stimulus difference. That is, under the
uncontrolled procedure, subjects showed a stronger bias towards the response
alternative with the higher reinforcer rate when discrimination was poor.
13
Two points should be made regarding the findings of McCarthy and Davison
(1984) and others like them (Alsop & Davison, 1991; Godfrey, 1997; Nevin, Cate, &
Alsop, 1993). Although McCarthy and Davison’s (1984) study was the first to show
an interaction between bias and discriminability, other studies subsequently replicated
these findings (Alsop & Davison, 1991; Godfrey, 1997). Currently, the reasons for
this interaction are not well understood (Alsop, 1991, 1998; Alsop & Rowley, 1996;
Alsop & Porritt, 2006). First, the interaction between bias and discriminability has
subsequently been obtained using both uncontrolled (McCarthy & Davison, 1984)
and controlled (Alsop & Davison, 1991) reinforcer ratio procedures (for discussion
see Alsop & Porritt, 2006). Second, the sensitivity parameter, ar in Equation 1.4
provides no insight into the possible mechanisms responsible for changes in bias.
Although the Davison-Tustin model had some early success, recent research has
shown the model to have serious limitations.
The fact that the assumption of independence has not held in at least some
circumstances however, is troubling. Furthermore, the model cannot account for data
from studies in which reinforcers for error responses have been arranged (Davison &
McCarthy, 1980b; Nevin, Jenkins, Whittaker, & Yarensky, 1982). Perhaps most
importantly, there is no obvious way to extend the model to procedures with more
than two stimuli (Davison, 1991; Davison & McCarthy, 1987; 1989).
A Detection model of Choice.
Alsop (1991) and Davison (1991) independently introduced a detection model
that predicts an interaction between bias and discriminability (Davison & Nevin,
1999). Their model is based upon an earlier model of choice proposed by Davison
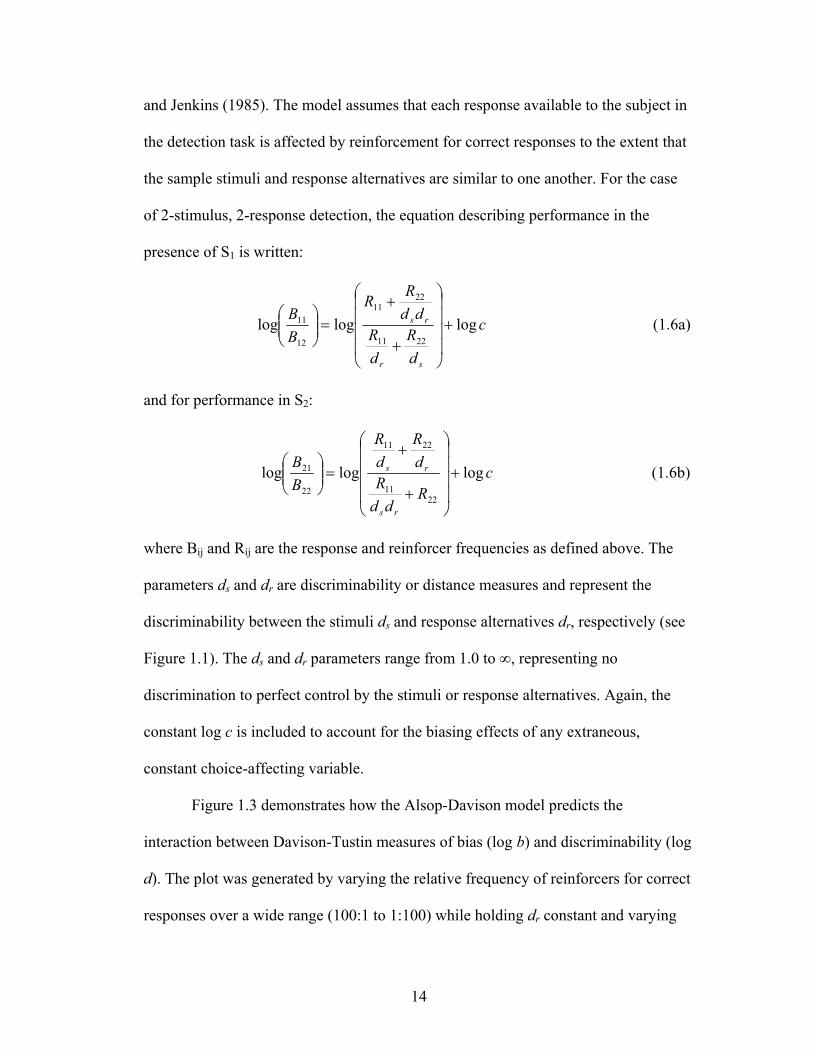
14
and Jenkins (1985). The model assumes that each response available to the subject in
the detection task is affected by reinforcement for correct responses to the extent that
the sample stimuli and response alternatives are similar to one another. For the case
of 2-stimulus, 2-response detection, the equation describing performance in the
presence of S1 is written:
c
dR
dR
ddRR
BB
sr
rs logloglog2211
2211
12
11 +⎟⎟⎟⎟
⎠
⎞
⎜⎜⎜⎜
⎝
⎛
+
+=⎟⎟
⎠
⎞⎜⎜⎝
⎛ (1.6a)
and for performance in S2:
cR
ddR
dR
dR
BB
rs
rs logloglog22
11
2211
22
21 +⎟⎟⎟⎟
⎠
⎞
⎜⎜⎜⎜
⎝
⎛
+
+=⎟⎟
⎠
⎞⎜⎜⎝
⎛ (1.6b)
where Bij and Rij are the response and reinforcer frequencies as defined above. The
parameters ds and dr are discriminability or distance measures and represent the
discriminability between the stimuli ds and response alternatives dr, respectively (see
Figure 1.1). The ds and dr parameters range from 1.0 to ∞, representing no
discrimination to perfect control by the stimuli or response alternatives. Again, the
constant log c is included to account for the biasing effects of any extraneous,
constant choice-affecting variable.
Figure 1.3 demonstrates how the Alsop-Davison model predicts the
interaction between Davison-Tustin measures of bias (log b) and discriminability (log
d). The plot was generated by varying the relative frequency of reinforcers for correct
responses over a wide range (100:1 to 1:100) while holding dr constant and varying
15
ds, over three levels (25, 50, and 100). Next, the Davison-Tustin model of detection
was fit to the data simulated by the Alsop-Davison model. The obtained values of
sensitivity, which is an index of bias relative to the ratio of reinforcers (cf. Equation
1.4), and discriminability obtained from the fits of Equation 1.3 to the data generated
by Equation 1.6, are plotted in Figure 1.3. Therefore, the model proposed by Alsop
(1991) and Davison (1991), which treats discriminability among stimuli and
responses symmetrically, predicts that the extent of bias observed depends on the
level of discrimination given by ds and can be seen if an overall measure of bias,
analogous to log B in Equation 1.5, is obtained using Equation 1.6 and 1.6b (see
Equation 8 of Davison & Nevin, 1999, for the derivation).
The most important theoretical difference between the model proposed by
Alsop and Davison and the early Davison-Tustin model is the way in which stimulus
distances produces changes in the frequency of error responses (B12 & B21,
respectively). According to the Davison-Tustin model, error responses are a function
of reinforcers for correct responses (measured by ar) and a constant level of bias
towards the correct responses, given by a parameter relating the difference between
the sample stimuli (log d). The model implies that error responses are due to the
degree of stimulus generalization and does not include a role for response
generalization or induction. Consequently, the model proposed by Davison and Tustin
(1978) maintains the assumption of classical signal detection theory (Green & Swets,
1966) of independence between sensory and decision variables.
According to Alsop and Davison’s model however, error responses are the
result of the spread of reinforcement from other stimuli (ds) and response classes (dr).
16
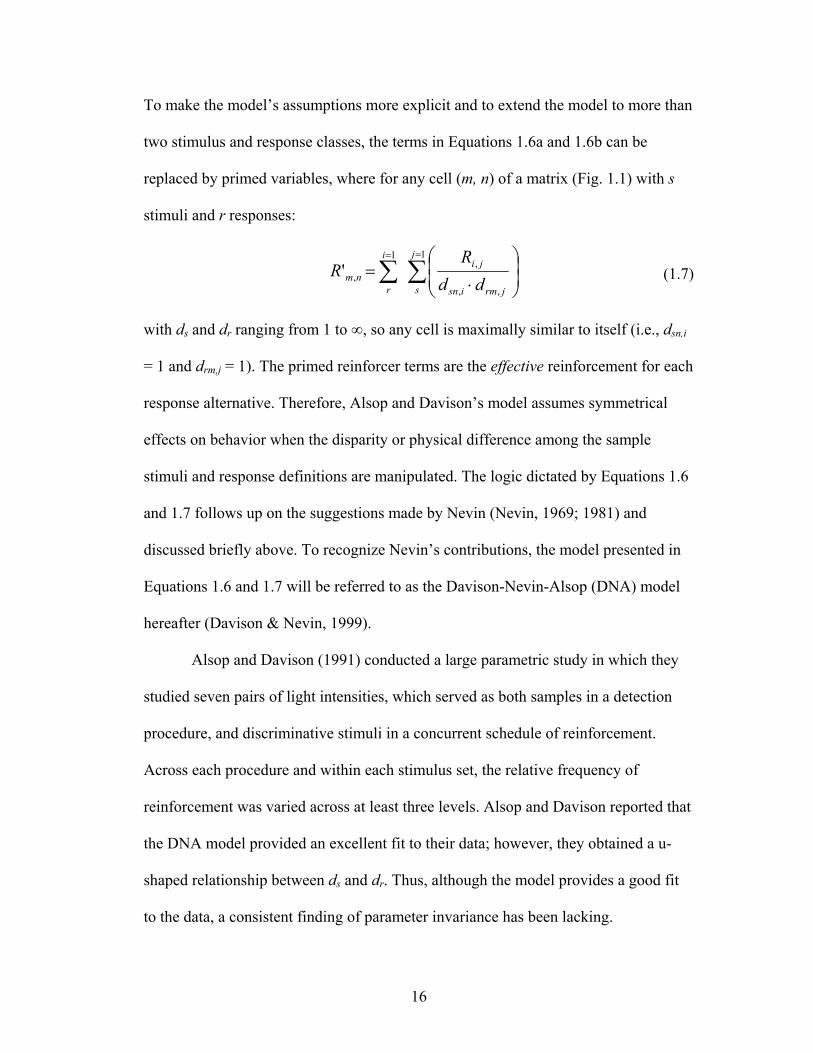
To make the model’s assumptions more explicit and to extend the model to more than
two stimulus and response classes, the terms in Equations 1.6a and 1.6b can be
replaced by primed variables, where for any cell (m, n) of a matrix (Fig. 1.1) with s
stimuli and r responses:
∑∑==
⎟⎟⎠
⎞⎜⎜⎝
⎛
⋅=
1
,,
,1
,'j
s jrmisn
jii
rnm dd
RR (1.7)
with ds and dr ranging from 1 to ∞, so any cell is maximally similar to itself (i.e., dsn,i
= 1 and drm,j = 1). The primed reinforcer terms are the effective reinforcement for each
response alternative. Therefore, Alsop and Davison’s model assumes symmetrical
effects on behavior when the disparity or physical difference among the sample
stimuli and response definitions are manipulated. The logic dictated by Equations 1.6
and 1.7 follows up on the suggestions made by Nevin (Nevin, 1969; 1981) and
discussed briefly above. To recognize Nevin’s contributions, the model presented in
Equations 1.6 and 1.7 will be referred to as the Davison-Nevin-Alsop (DNA) model
hereafter (Davison & Nevin, 1999).
Alsop and Davison (1991) conducted a large parametric study in which they
studied seven pairs of light intensities, which served as both samples in a detection
procedure, and discriminative stimuli in a concurrent schedule of reinforcement.
Across each procedure and within each stimulus set, the relative frequency of
reinforcement was varied across at least three levels. Alsop and Davison reported that
the DNA model provided an excellent fit to their data; however, they obtained a u-
shaped relationship between ds and dr. Thus, although the model provides a good fit
to the data, a consistent finding of parameter invariance has been lacking.
17
Furthermore, the finding of parameter covariation in the 2x2-detection procedure is
perplexing, because the most successful extension of the DNA model has been from
the simpler identification task to classification and related procedures involving more
than two stimuli (Davison, 1991; 1996; Davison & McCarthy, 1987; 1988; 1994;
Davison & Nevin, 1999; Krägeloh, Elliffe, & Davison, 2006).
Variations in Attending.
The most recent modification of the DNA model has been the addition of
parameters measuring the probability with which subjects are assumed to attend to the
relevant stimuli in stimulus detection and matching-to-sample procedures (MTS).
Assuming that subjects do not attend to sample and comparison stimuli on every trial,
Nevin, Davison, and Shahan (2005) provided a modified version of the DNA model
that could account for : 1) previous data sets showing parameter covariation (Alsop &
Davison, 1991), 2) effects of overall rate of reinforcement on stimulus
discriminability (Schaal, Odum, & Shahan, 2000; Nevin, Milo, Odum, & Shahan,
2003), and 3) could be readily extended to describe performance in studies employing
delayed matching-to-sample (DMTS) and related procedures (Nevin, Davison, Odum,
& Shahan, 2007).
The modification of the DNA model presented by Nevin, Davison, and
Shahan (2005) assumes that subjects’ attend to the relevant sample and choice stimuli
in a detection procedure depending on the rate of reinforcement for doing so.
Specifically, the probability of attending to the sample stimuli p(As) is given by the
expression:
bas
srrxAp
)/(exp)( −
= (1.8)
18
where x is a parameter representing background distraction, scaled in units of the
particular disruptor imposed (e.g., sessions of extinction), that interferes with
attending to the sample and b is a sensitivity parameter (Nevin, 1992; Nevin & Grace,
2000). The term ra is the session-based obtained overall rate of reinforcement. The
term rs is the rate of reinforcement for attending to the samples and is given by
dividing the total number of reinforcers obtained in a session by the sum of the
intertrial intervals (ITI) and sample duration. Thus, the time required to make a
comparison choice is excluded from calculation of the rate of reinforcement for
attending to the samples. A similar equation is used to predict the probability of
attending to the choice alternatives or comparison stimuli, p(Ac):
bsc
c rrzAp
)/(exp)( −
= (1.9)
where all parameters except z and rc are as defined above. The parameter z represents
background distraction, analogous to x in Equation 1.8, which interferes with
attending to the comparison stimuli. The term rc is the rate of reinforcement for
attending to the choice or comparison stimuli and is given by dividing the total
number of reinforcers obtained in a session by mean response latencies, plus the
average retention interval in a DMTS procedure. Thus, the time required for sample
presentation and the intertrial interval are excluded from calculation of the rate of
reinforcement for attending to the comparison stimuli.
The model presented by Nevin and colleagues (2005) assumes that when
subjects do not attend to the sample stimuli, ds in Equation 1.6 is effectively 1.0.
Likewise when subjects do not attend to the choice or comparison stimuli, dr is 1.0.
Behavior in a detection task, according to the model, is assumed to result from the
19
subjects’ behavior being governed by a combination each of the four possible states
corresponding to attending to and not attending to the sample and choice stimuli.
Therefore, as the session wide reinforcer rate increases, subjects are assumed to
attend to sample and choice stimuli with greater frequency and behavior is governed
by the original DNA equations.
Although the modification provided by Nevin and colleagues allows the
original DNA model to account for some discrepant data sets and is consistent with
some previous literature on attending in detection tasks (Berryman, Cumming,
Cohen, & Johnson, 1965; Heinemann, Avin, Sullivan, & Chase, 1969; Wright &
Sands, 1981), it is uncertain as of yet whether the extra parameters pay their way
outside of applications to DMTS procedures. Moreover, in their reanalysis of archival
data sets, Nevin and colleagues assumed only that p(As) was less than 1.0 without
consideration of the actual obtained response latencies, which dictate p(Ac). Their
insight, however, that on any given trial the subjects’ behavior may not be under the
control of either ds, dr, or both, is consistent with previous findings (Alsop & Rowley,
1996; Blough, 1996; Edhouse & White, 1998) and is taken up in the next section.
Learning and Detection.
The previous sections have discussed various models that have been proposed
for signal detection performance. Obviously, each of them has had difficulties in
accounting for some data sets (Alsop, 1998; Davison, 1991; Dusoir, 1975).
Modifications to each of the models originating from the operant choice literature
(Davison & McCarthy, 1988; Williams, 1988; 1994) have been made to the way in
which the model quantifies biasing variables. In fact, it was originally thought that
20
these models would provide a better treatment of bias than those developed by
detection theorists (Nevin, 1969; Davison & Tustin, 1978; Davison & McCarthy,
1981).
It may be helpful to define three time scales over which the various models
assume the sensory and decision variables operate in a detection situation. The origin
of most modeling efforts in the operant choice tradition can be traced to classical
signal detection theory (Green & Swets, 1966) and the matching law (Herrnstein,
1961; 1970). Both of these theoretical approaches are static and focus exclusively on
aggregate or molar effects of stimulus similarity and relative payoff on performance
measures obtained from highly trained observers. Other approaches highlight the role
of between-trial sequential dependencies in detection procedures (Speeth & Mathews,
1961) and offer dynamic accounts of detection performance (Atkinson, Carterette, &
Kinchla, 1962; Atkinson & Kinchla, 1965; Friedman, Carterette, Nakatani, &
Ahumada, 1968). Many of these attempts however, have been limited to either
restricted procedures or highly experienced subjects (e.g., Luce & Green, 1974).
Finally, other accounts emphasize activities within a single trial in a signal detection
task (Nevin, Davison, & Shahan, 2005; Link & Heath, 1975; Wright, 1991; 1992).
The assumed operative temporal scale of each model originating in the operant choice
literature is summarized below.
The model proposed by Davison and Tustin (1978) assumed that the variables
affecting discrimination and bias are independent. Therefore, this model follows
directly from signal detection theory as proposed by Green, Swets, Tanner, and
Birdsall (Green, 1960; Tanner & Swets, 1954; Swets, Tanner, & Birdsall, 1961).
21
From the outset, signal detection theory has assumed that the sensory/perceptual and
decision processes involved in signal detection and psychophysical experiments were
independent of one another. Davison and Tustin’s model followed this logic, but
replaced previous measures of bias with one developed directly from the steady-state
analysis of choice (Herrnstein, 1961; 1970). The model of Davison and Tustin (1978)
is silent on the dynamics of detection performance. For present purposes, however,
we may assume that the Davison-Tustin model predicts independent effects of
sensory and decision variables on performance during any given trial.
Perhaps the greatest departure in theorizing in the operant choice literature
comes from the DNA model (Alsop, 1991; Davison, 1991; Davison & Nevin 1999;
Nevin, 1969; Nevin, 1981). The DNA model predicts that measures of bias will
depend on discrimination performance (see Fig. 1.3). This model assumes that the
perceptual and decision-making components of detection are derived from the same
process, namely the spread of reinforcement across dimensions of stimulus and
behavior. That is, the DNA model suggests a hierarchical behavioral unit (cf.,
Rescorla, 1992), in which the effect of response-produced reinforcing stimuli spread
to other response and stimulus classes by virtue of similarity along those two
dimensions. Therefore, a dynamic implementation of the DNA model suggests a
diffusion or spread of effect of reinforcement along the dimensions of stimulus and
response that depends on the local reinforcer value.
While the DNA model is the most successful and widely applicable model
developed thus far in the operant-detection literature, it too has proven to be deficient
in some cases (Nevin, Davison, & Shahan, 2005). The specific modifications to the
22
DNA model, rather than the authors’ rationale for them, are most germane to the
present discussion. The modified attending-augmented DNA model assumes that on a
certain proportion of trials within an experimental session, the subject fails to attend
to the sample stimuli, comparison stimuli or choice alternatives, or both. The
consequences of this failure depend upon which stimulus is ignored. In their review,
Nevin and colleagues needed to modify the probability of attending to the sample
stimuli p(As) to account for data from detection and MTS procedures with no delay
between sample presentation and availability of the choice alternatives. The effect of
changes in this parameter is to make ds in Equation 1.6 equal to 1.0 (i.e., no sample
discrimination) on some proportion of trials. If on some proportion of trials in each
experimental session, a subject’s behavior is not under control of the sample stimuli
(p(As) < 1.0), then are these trials of unvarying character or dependent on previous
events? That is, do we assume that on some proportion of trials subjects disengage
from the task or that performance on any trial is determined by events on the current
trial as well as events on previous trials? Clearly then, we are obliged to study the
circumstances under which subjects make choices completely based on biasing
variables.
It may be that the earliest conceptualizations of psychophysical and signal
detection performance were premature concerning the effects of biasing
manipulations. That is, the assumption of independent sensory and decision processes
may have been more a product of researcher’s interests, rather than the determinants
of the subject’s performance. That is, early researchers in psychophysics were often
exclusively interested in the pure sensory process and saw biasing variables as a
23
nuisance that must to be controlled to reveal the true nature of the sensation. This
suggestion may find support in discussions on the form of the psychometric function
(Guilford, 1954; Thurstone, 1928). As suggested by Luce (1964), it was the advent of
new methods in what came to be called local psychophysics that began to shift the
prevailing view. On this view, methods such as those used to generate a receiver
operating characteristic (ROC) suggested the importance of bias or contingency
variables in determining performance in psychophysical tasks. Therefore, it is not
surprising that many researchers did turn their attention to an analysis of the local
effects of trial outcomes.
Early in the study of local psychophysics, a number of researchers suggested
that under certain situations, performance on some trials is dependent on events in the
preceding trial (Cross, 1973; Freidman & Carterette, 1964). In fact, several
researchers proposed quantitative models to account for sequential dependencies and
learning effects in signal detection procedures (Atkinson, 1963; Luce, 1963b; 1964).
It seems quite strange that these effects have been largely ignored in the nonhuman
laboratory. Furthermore, only now that steady state or molar performance models
suggest the importance of local effects in detection procedures are these processes
beginning to receive attention (Alsop & Rowley, 1996; Lie & Alsop, 2007; Ward &
Odum, 2008).
It was the observation that on some occasions (Norman, 1963; Senders &
Sowards, 1952; Shipley, 1961) sequential dependencies arise in detection
performance and the great lengths experimenters went to in order to control response
bias that led Luce (1964) to suggest a more thorough experimental analysis of the
24
learning that takes place in psychophysical and detection experiments. Specifically,
Luce suggested that at least two classes of learning models for detection studies could
be examined. Two-process models are those which assume that learning involves
both perceptual and decision changes across the course of a detection experiment
(Atkinson, 1963; Kac, 1962). This type of model follows from the assumptions of
classical signal detection theory (Green & Swets, 1966) which assumes that
sensitivity and bias are independent. Therefore, according to Luce’s classification
scheme, the Davison-Tustin model is a steady-state version of a multi-process model.
Another class of model, Luce called single-process models, are those which assume
that the perceptual aspect of detection performance is subordinate to the feedback-
driven learning process (Bush, Luce, & Rose, 1964; Schoeffler, 1965). Thus,
according to Luce’s classification scheme, the DNA model and its offspring are
single process models.
The present research
The goal of the present work is to develop methods that allow for the study of
the learning that takes place in signal detection and related procedures. The methods
employed in the experiments presented here have been successful in recent attempts
to study the dynamics of operant choice (Hunter & Davison, 1985; Mazur, 1996;
Schofield & Davison, 1997; Grace, 2002a, 2002b; Grace, Bragason, & McLean,
2003). The experimental designs that have yielded some insight into the dynamics of
choice typically vary choice affecting variables over a much shorter time scale than
do steady-state counterparts (cf. Sidman, 1960). Such designs include varying relative
reinforcer frequency every few sessions (Mazur, 1992, 1995, 1997), potentially each
25
session (Hunter & Davison, 1985; Schofield & Davison, 1997; Grace, Bragason, &
McLean 2003), or once or more within a single experimental session (Davison &
Baum, 2000, 2002, 2003; Gallistel, Mark, King, & Latham, 2001). Findings from
each of these designs have shown that choice may adapt at an extremely high rate to
abrupt signaled and unsignaled changes in the relative frequency of reinforcement.
Moreover, such methods have stimulated theoretical developments that encompass
effects seen in both dynamic and traditional steady state procedures (Christensen &
Grace, 2008; 2009; Grace & McLean, 2006). The present experiments were
conducted with the expectation that similar methodological developments applied to
the study of signal detection performance will reopen a once promising line of inquiry
and produce similar advances. The research is composed of three experiments each
employing similar methods to investigate dynamic aspects of signal detection
performance.
The second chapter, “Rapid Acquisition of Bias in Signal Detection” presents
the first attempt to implement a procedure that yields session-to-session changes in
relative reinforcer frequency in a simple detection task. In Experiment 1, only 2
stimuli were presented in an experimental session, across conditions, however the
durations of the sample stimuli were changed to create a condition in which
discriminating the stimuli would be relatively easy and more difficult, respectively.
The novel methodological contribution of the study was that relative reinforcer
probability for correct detections varied randomly across sessions according to a
pseudorandom binary sequence (PRBS). The first experiment suggests that this
design, which has been implemented in simpler choice paradigms (Schofield &
26
Davison, 1997; Grace, Bragason, & McLean, 2003) may be useful in studying the
dynamic properties of bias in a detection situation.
The third chapter, “Rapid Shifts in the Psychometric Function for Time” is an
extension of the first experiment. Experiment 2 extends the application of the PRBS
design from the simpler identification design to a classification task in which more
than one stimulus is mapped to each of two available responses. The goal of
Experiment 2 is to produce a psychometric function for each session under conditions
of differential payoff. This experiment will allow a comparison between the speed of
bias changes in simple and complex detection procedures. The design of Experiment
2 may prove to be the most expedient method to study large ranges of stimulus
disparity and relative reinforcement variables in a signal detection task.
The fourth chapter, “Dynamics of Attending in the Repeated Acquisition of a
Temporal Discrimination” again employs a classification design. The correct
response location given a stimulus from one of two different classes and the relative
frequency of reinforcement are varied every 15 sessions. This experiment is intended
to provide information on the speed of repeated temporal discrimination acquisition
between transitions of equal and unequal payoff for correct responses. In addition,
Experiment 3 attempts to dissociate two hypotheses regarding the role of sample and
choice stimuli in the repeated learning of a temporal discrimination.
Table 1.1 provides an outline of the experiments to be reported in the
following chapters. Each experiment employed a detection task in which the duration
of a stimulus presentation served as a sample stimulus. Common to all experiments is
manipulation of the relative frequency of reinforcement for correct responses. In
27
Experiments 1 and 2, the relative frequency of reinforcement for correct responses
was changed each session. Therefore, these two experiments explored the speed of
changes in response bias when the relative frequency of reinforcement changed each
session. In Experiment 3, both the relative frequency of reinforcement for correct
responses and the mapping between stimulus class and correct response location
changed every 15 sessions. Therefore, the first two experiments explored the speed
and extent of changes in response bias while the stimuli to be discriminated are held
constant and the third experiment manipulated stimulus and reinforcement variables
simultaneously in order to investigate the development of both facets of detection
performance.
In conclusion, the intended contribution of this dissertation is to begin a new
research program utilizing considerably more dynamic experimental designs in the
study of non-human signal detection performance. To this end, the goal of the
research program consists of two phases: first to provide methodological advances
and second to foreshadow the potential theoretical developments that are warranted
by the present studies. The methodological goals can be met by obtaining aggregate
data that are largely consistent with previous non-human studies of signal detection
performance. The secondary goal of this work is to provide an accurate
characterization of the time course of repeated acquisition of discrimination and bias
in widely used variants of the classic “yes-no” detection procedure. Furthermore, the
present experiments will provide substantial data sets on the local effects of both
sensory and decision variables on detection performance, and perhaps provide a
framework for an exclusively dynamic quantitative account of local reinforcer value
28
on stimulus and response generalization (Shepard, 1958a) in various psychophysical
choice procedures.
29
CHAPTER 2
RAPID ACQUISITION OF BIAS IN SIGNAL DETECTION.
Behavior allocation, measured as relative response rate, in concurrent
variable-interval (VI), VI schedules of reinforcement is well described by the
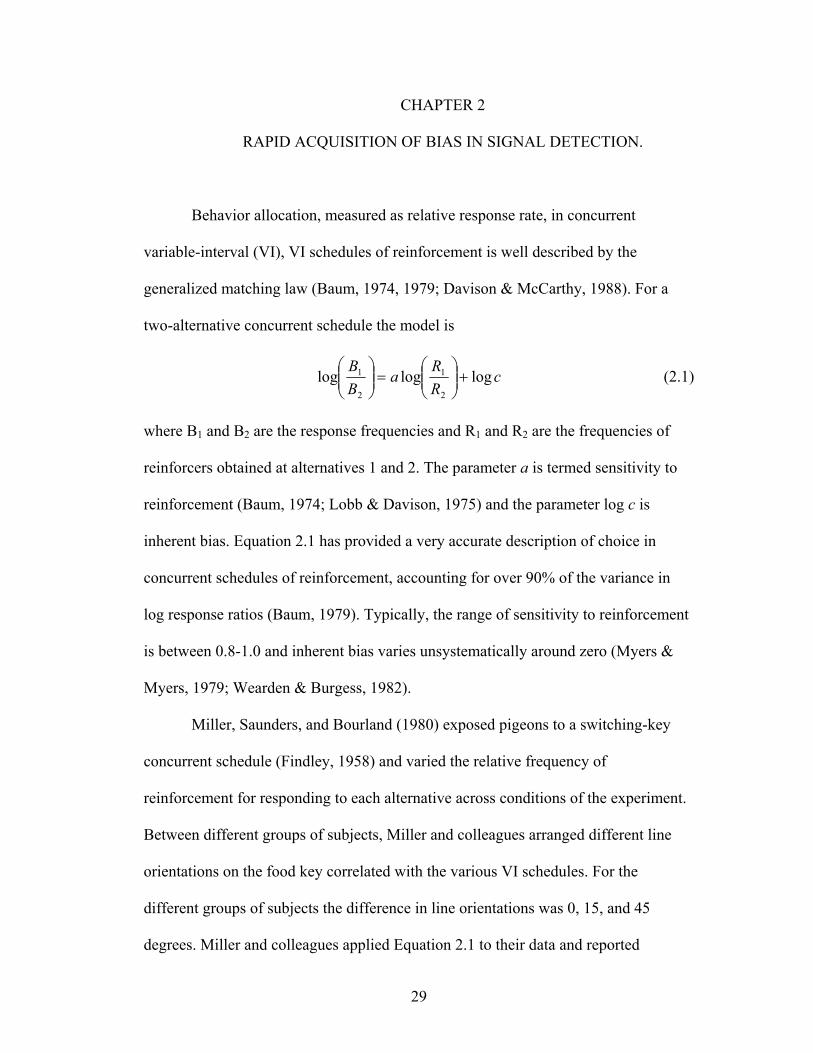
generalized matching law (Baum, 1974, 1979; Davison & McCarthy, 1988). For a
two-alternative concurrent schedule the model is
cRR
aBB
logloglog2
1
2
1 +⎟⎟⎠
⎞⎜⎜⎝
⎛=⎟⎟
⎠
⎞⎜⎜⎝
⎛ (2.1)
where B1 and B2 are the response frequencies and R1 and R2 are the frequencies of
reinforcers obtained at alternatives 1 and 2. The parameter a is termed sensitivity to
reinforcement (Baum, 1974; Lobb & Davison, 1975) and the parameter log c is
inherent bias. Equation 2.1 has provided a very accurate description of choice in
concurrent schedules of reinforcement, accounting for over 90% of the variance in
log response ratios (Baum, 1979). Typically, the range of sensitivity to reinforcement
is between 0.8-1.0 and inherent bias varies unsystematically around zero (Myers &
Myers, 1979; Wearden & Burgess, 1982).
Miller, Saunders, and Bourland (1980) exposed pigeons to a switching-key
concurrent schedule (Findley, 1958) and varied the relative frequency of
reinforcement for responding to each alternative across conditions of the experiment.
Between different groups of subjects, Miller and colleagues arranged different line
orientations on the food key correlated with the various VI schedules. For the
different groups of subjects the difference in line orientations was 0, 15, and 45
degrees. Miller and colleagues applied Equation 2.1 to their data and reported
30
increasing estimates of sensitivity to reinforcement of 0.17, 0.32, and 1.0 with
increasing differences in the line orientations correlated with the VI schedules. Alsop
and Davison (1991) systematically replicated and extended Miller, Saunders, and
Bourland’s (1980) findings of changes in sensitivity to reinforcement with changes in
the disparity of the discriminative stimuli correlated with the concurrent alternatives.
Alsop and Davison (1991) analyzed their data according to both the generalized
matching law and a contingency discriminability model proposed by Davison and
Jenkins (1985).
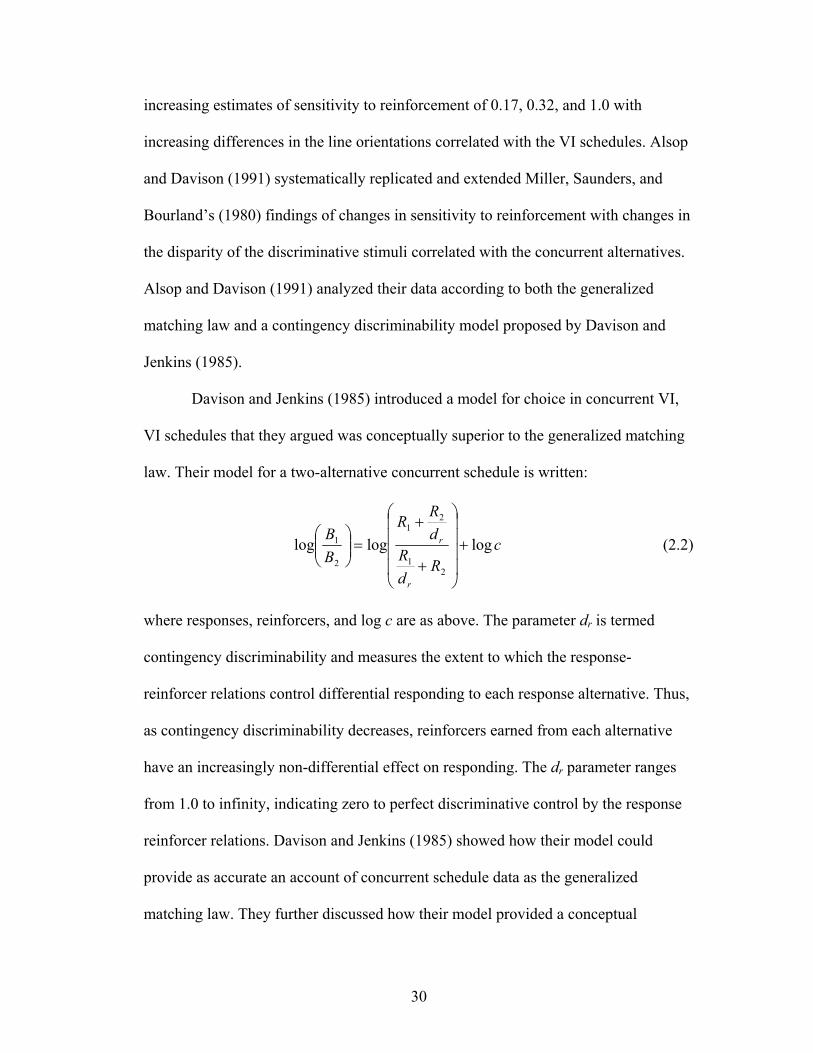
Davison and Jenkins (1985) introduced a model for choice in concurrent VI,
VI schedules that they argued was conceptually superior to the generalized matching
law. Their model for a two-alternative concurrent schedule is written:
cR
dR
dRR
BB
r
r logloglog2
1
21
2
1 +⎟⎟⎟⎟
⎠
⎞
⎜⎜⎜⎜
⎝
⎛
+
+=⎟⎟
⎠
⎞⎜⎜⎝
⎛ (2.2)
where responses, reinforcers, and log c are as above. The parameter dr is termed
contingency discriminability and measures the extent to which the response-
reinforcer relations control differential responding to each response alternative. Thus,
as contingency discriminability decreases, reinforcers earned from each alternative
have an increasingly non-differential effect on responding. The dr parameter ranges
from 1.0 to infinity, indicating zero to perfect discriminative control by the response
reinforcer relations. Davison and Jenkins (1985) showed how their model could
provide as accurate an account of concurrent schedule data as the generalized
matching law. They further discussed how their model provided a conceptual
31
mechanism to account for the findings of Miller and colleagues (1980; see also Alsop
and Davison, 1991). That is, the contingency discriminability model explains the
effects of stimulus control on choice as response generalization or induction between
the two alternatives engendered by less that perfect discriminability between the
concurrent response reinforcer relations.
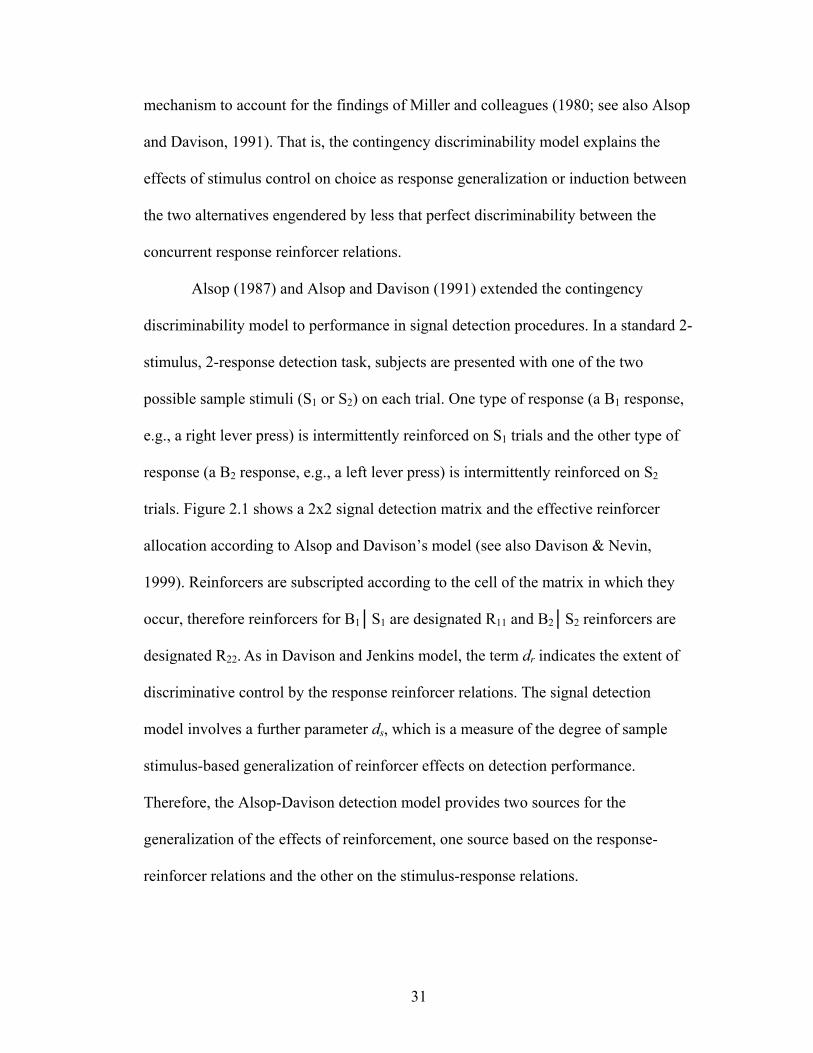
Alsop (1987) and Alsop and Davison (1991) extended the contingency
discriminability model to performance in signal detection procedures. In a standard 2-
stimulus, 2-response detection task, subjects are presented with one of the two
possible sample stimuli (S1 or S2) on each trial. One type of response (a B1 response,
e.g., a right lever press) is intermittently reinforced on S1 trials and the other type of
response (a B2 response, e.g., a left lever press) is intermittently reinforced on S2
trials. Figure 2.1 shows a 2x2 signal detection matrix and the effective reinforcer
allocation according to Alsop and Davison’s model (see also Davison & Nevin,
1999). Reinforcers are subscripted according to the cell of the matrix in which they
occur, therefore reinforcers for B1│S1 are designated R11 and B2│S2 reinforcers are
designated R22. As in Davison and Jenkins model, the term dr indicates the extent of
discriminative control by the response reinforcer relations. The signal detection
model involves a further parameter ds, which is a measure of the degree of sample
stimulus-based generalization of reinforcer effects on detection performance.
Therefore, the Alsop-Davison detection model provides two sources for the
generalization of the effects of reinforcement, one source based on the response-
reinforcer relations and the other on the stimulus-response relations.
32
Alsop and Davison (1991) reported an extensive experiment, carried out with
pigeons serving as subjects, in which they varied the stimulus difference between S1-
S2 pairs in both a concurrent schedule and a detection task. In the signal detection
conditions, they varied the difference between stimuli in a 2-stimulus, 2-response
detection task across seven levels by holding the intensity of S1 constant and
changing the intensity of S2 across conditions. The relative frequency of
reinforcement for correct responses was varied over at least three levels at each level
of stimulus difference. They reported that the contingency discriminability model
gave an excellent account of their data. However, the dr parameter varied in an
inverse-U shaped pattern across levels of stimulus difference. That is, contingency
discriminability varied as a function of variables that should only affect stimulus
discriminability, ds. Therefore, in Alsop and Davison’s (1991) study, the model was
unable to provide a parameter invariant account of their data (Nevin, 1984).
Recently, investigations of choice in concurrent schedules have been reported
in which the relative frequency of reinforcement changes rapidly either within or
between sessions (Davison & Baum, 2000; Hunter & Davison, 1985). Generally,
these studies have found that relative response rate can adapt quickly to abrupt,
unsignaled changes in relative reinforcer frequency. In Davison and Baum’s (2000,
2002) procedure, where relative reinforcer frequency varies across seven levels
within session, preference for the more frequently reinforced response emerges after
the occurrence of a few reinforcers. Reports of control by changing reinforcement
contingencies within a single session are also consistent with those that have shown
33
control by contingencies changing from session to session (Schofield & Davison,
1997).
Hunter and Davison (1985) introduced a procedure for investigating rapid
changes in preference where relative reinforcer frequency changes randomly between
two values across sessions. Hunter and Davison found that variation of the relative
frequency of reinforcers in a concurrent schedule according to a pseudorandom
binary sequence (PRBS) produced rapid changes in preference. They also found that
after several sessions of exposure to the PRBS that preference was only sensitive to
the current session reinforcer ratio, with little discernable effects of previous sessions.
Schofield and Davison (1997) reported a replication and extension of Hunter and
Davison’s (1985) study by extending the PRBS procedure to several reinforcer ratios
and dependent versus independent schedules. Schofield and Davison (1997) provided
an extended generalized matching model to describe control over responding in the
current session by the current and previous nine sessions’ reinforcer ratios. They
reported that performance in the current session was mostly determined by the current
session’s reinforcer ratio and to a smaller degree by previous session reinforcer ratios.
Schofield and Davison also reported that sensitivity to current session reinforcer
ratios increased with extended exposure to the PRBS procedure. Finally, they
reported no effect of the size of reinforcer ratio (8:1, 4:1, 2:1, 1:2, 1:4. 1:8) on
sensitivity to current session reinforcer ratios. Based on these findings, Schofield and
Davison (1997) argued that the PRBS design was a useful method for quick
determination of sensitivity to reinforcement.
34
More recently, Grace, Bragason, and McLean (2003) have extended the PRBS
design to concurrent-chained schedules of reinforcement. Specifically, in the first
experiment of their study they varied the delay to reinforcement in one terminal link
while holding the other constant. Thus, the immediacy ratio (reciprocal of delay ratio)
changed randomly between sessions from 1:2 to 2:1. Grace and colleagues exposed
their pigeons to three, 31-session sequences of the PRBS and reported that across
sequences, preference came under increasing control of current session immediacy
ratios (see also Grace & McLean, 2006). Extension of the PRBS design to concurrent
chained schedules is important because it shows that preference is not only sensitive
to random changes in primary reinforcer rate ratios, but also to changes in the value
of stimuli correlated with primary reinforcement (Grace, 1994; Mazur, 2001, Nevin,
Davison, & Shahan, 2005; Shahan, Podlesnik, & Jimenez-Gomez, 2006).
The present study sought to extend the PRBS method of varying relative
reinforcer frequency to a signal detection procedure. Specifically, the relative
frequency of reinforcement for correct responses in 2-stimulus, 2-response detection
task employing temporal stimuli (short vs. long houselight presentations) was varied
according to a 31-session PRBS. Across different PRBS presentations, the difference
between the temporal sample stimuli was varied, creating two levels of discrimination
difficulty. We asked whether detection performance and specifically if bias could
come under control or random changes in the reinforcer ratio for correct responses.
We also sought to determine the relationship between bias and discrimination under
the PRBS design and these measures in studies employing designs that are more
typical in this literature.

35
Hypotheses
1) Stimulus discriminability, measured as log d, will be lowest in conditions
where the sample stimulus durations are 3.5 and 5.5 seconds, respectively.
2) By the end of each PRBS, response bias, measured as log b, will be primarily
under control of the current session reinforcer ratio.
3) Within experimental sessions, bias will gradually shift from control by the
previous sessions’ to the current sessions’ reinforcer ratio.
4) Based on previous findings, the speed and extent of changes in bias will be
greater when discrimination accuracy is lower (i.e., stimulus durations of 3.5
& 5.5-s).
METHOD
Subjects
The subjects were four male Long Evans Hooded rats J85, J86, J87, and J88.
All subjects were experimentally naïve at the beginning of the experiment. Food
deprivation was held constant for each subject by post-session feeding (15g). The rats
were housed individually and had free access to water when in their home cages in a
vivarium with a 12:12 hr light/dark cycle (lights on at 6:00 a.m.). Sessions were
conducted daily, at approximately the same time with few exceptions. Experimental
sessions were conducted during the rats’ light period.
Apparatus
The experiment was conducted in two standard operant conditioning
chambers (Colbourn Instruments H10-11R-TC) measuring 29 cm high by 29 cm wide
36
by 24 cm deep. The chambers were enclosed in a sound attenuating cubicle with
white noise masking extraneous sounds.
On the front wall were two identical response levers, one 2.2 cm from the left
wall and the other 2.2 cm from the right wall, 6 cm above the grid floor. The levers
were 3.5 cm across and extended 2 cm into the chamber. A downward force on the
lever of at least 0.3 N operated a switch that was connected to the lever and thereby
generated a recordable response. Three small lights arranged in a horizontal row 3.5
cm apart center to center were located 2.5 cm above each lever. Only the center light
was used in the current experiment. In the first chamber, the light above the left lever
was lit white and the light above the right lever was lit blue. In the second chamber,
the light above the left lever was lit red and the light above the right lever was lit
green. A houselight, located centrally, at the top of the intelligence panel, provided
general illumination of the chamber.
Centered on the front wall, 1.5 cm above the floor was a rectangular opening
(4.1 cm high and 6.3 cm wide) through which the rat could obtain the reinforcer
(sweetened condensed milk). The liquid dipper normally rested in a reservoir outside
the chamber. The size of the dipper cup was 0.05 ml. The milk solution was made by
diluting ordinary commercial sweetened condensed milk with tap water to make a
milk and water mixture (one part milk/ three parts water).
One digital I/O card (Computer Boards, Inc.) Model # CIO-PDISO16
interfaced to an IBM-compatible computer located in an adjacent room controlled all
experimental events and recorded data. All control software was written and compiled
in Quickbasic®.
37
Procedure
Preliminary Training. Initially, left and right lever pressing was established via
autoshaping. Once lever pressing was established, the rats were placed directly on the
basic temporal discrimination procedure. Initially, each subject was trained on a
procedure in which each correct short and long response was reinforced (FR1). That
is, each right lever press following a 2-s houselight presentation and each left lever
press following an 8-s houselight presentation were reinforced. Training sessions
involved 150 discrete trials in which each trial began with illumination of the
houselight for either 2 or 8 seconds. Upon termination of the houselight, the lights
above each lever were lit and trials ended after either a lever press or 5 seconds,
whichever occurred first. Each sample stimulus was presented 75 times in each
session and stimulus presentation was randomized every block of 30 trials. Correct
responses were reinforced with two, 2-s milk deliveries, followed by the intertrial
interval (ITI) and incorrect responses led directly to the ITI. During the ITI all
stimulus lights were turned off for a duration of 15-s, the ITI duration was constant
throughout the experiment. Initial pretraining on the 2 versus 8 second stimulus
durations lasted approximately 50 sessions. During the 50 pretraining sessions, the
overall probability of reinforcement for correct responses was gradually decreased to
0.70. As the overall density of reinforcement was decreased, reinforcers were now
arranged dependently (Stubbs & Pliskoff, 1969) such that a reinforcer assigned to a
particular correct response was held and no other response could be reinforced until
that reinforcer was obtained. Correct responses that were not eligible for
reinforcement and incorrect responses led directly to the ITI. Between the first and
38
second PRBS presentations, subjects were returned to the pretraining conditions and
the stimulus durations were changed to 3 and 5.5 seconds. This training continued for
approximately 25 sessions for each subject.
PRBS conditions. When accuracy on the 2 versus 8-s duration discrimination
stabilized, as judged by visual inspection of graphical representations of the data,
subjects were exposed to the first PRBS presentation. Under this condition, correct
short (right lever presses following 2-s houselight presentation) and correct long (left
lever presses following 8-s houselight presentation) responses continued to be
reinforced according to a dependent schedule with an overall reinforcement
probability of 0.70. Sessions lasted for 150 trials (75 of each type) and the ITI
duration was 15-s. The PRBS arranged for reinforcement of correct short responses at
a probability of either 0.75 or 0.25 across different sessions. The probability of
reinforcement of correct long responses was the compliment of the above
probabilities. Immediately following the 31-sessions under the first PRBS, subjects
were returned to the final pretraining conditions noted above and the durations were
changed to 3 and 5.5-s and the probability of reinforcement for correct responses was
0.50. The correspondence between right-left lever presses and short-long stimulus
presentations remained constant. Once accuracy stabilized at these durations, subjects
were again exposed to a 31-session PRBS with the same reinforcement probabilities
as noted above. Three of the four subjects were exposed to a third PRBS presentation
(J88 died shortly after completion of the second PRBS). Subjects J85 and J86 were
exposed a PRBS under 2 and 8–s stimulus durations, and J88 was a PRBS under 3
and 5.5-s stimulus durations.
39
RESULTS
First, to demonstrate that the different stimulus conditions produced different
levels of accuracy, Figure 2.2 shows accuracy expressed as log D (Davison & Tustin,
1978). To display discrimination performance for each condition simultaneously, the
data plotted in Figure 2.2 are from the final five sessions at each relative reinforcer
probability for each PRBS condition. Discrimination accuracy (log D) is plotted as a
function of the logarithm of the reinforcer frequency ratio of the session from which
the measure is calculated. This measure is calculated as:
⎟⎟⎠
⎞⎜⎜⎝
⎛⋅⋅=
21
22
12
11log5.0logBB
BB
D (2.3)
where Bij refers to the frequency of response in the different cells of the matrix of
Figure 2.1. This measure of discrimination performance is the geometric mean of the
logarithm (base 10) of the ratio of correct to error responses and indicates the overall
tendency for a subject to make a correct response independent of any response bias
(Davison & Tustin, 1978). Figure 2.2 indeed shows that the different pairs of
temporal durations produced changes in the propensity to make a correct response
(supporting Hypothesis 1). Note that log D is not plotted for sessions where subjects
made zero errors (this occurred in two sessions one subject, J85, following
presentation of the 2-s stimulus).
Overall, changes in relative reinforcer probability for correct responses
arranged according to the PRBS produced between session changes in response bias,
log B (Davison & Tustin, 1978). Figure 2.3 shows response bias plotted as a function
of PRBS sessions completed by each subject. Bias (log B) is calculated as:
40
⎟⎟⎠
⎞⎜⎜⎝
⎛⋅⋅=
22
21
12
11log5.0logBB
BB
B (2.4)
were Bij refers to the frequency of response in the different cells of the matrix of
Figure 2.1. This measure of bias is the geometric mean of the logarithm (base 10) of
the ratio of right and left responses and indicates the overall tendency for a subject to
make a right (B1) or left (B2) lever press (Davison & Tustin, 1978). Each data point in
Figure 2.3 represents performance in a single session. Inspection of Figure 2.3 reveals
that bias tracked changes in the reinforcer frequency (supporting Hypothesis 2).
Individual differences in performance are also readily apparent. One rat, J85, showed
an overall tendency to respond more on the right lever (B1) regardless of the relative
frequency of reinforcement or stimulus conditions. The performance of rat J86
showed greater control by the changing reinforcer ratios that of the other subjects.
Levels of response bias as measured by log B for subjects J87 and J88 were
intermediate compared to that observed for the other two subjects.
Previous studies employing the PRBS design have sought to determine the
extent to which performance in a given session is determined by that session’s
reinforcer ratio and the reinforcer ratios in previous sessions (Davison & McCarthy,
1988; Grace, Bragason, & McLean, 2003; Schofield & Davison, 1997). These
analyses have been based on a generalized matching model where performance in the
current session is predicted by including the current and previous sessions’ reinforcer
ratios. Such an analysis of the current data set requires extension of the detection
model of Davison-Nevin-Alsop (Alsop, 1991; Davison; 1991; Davison & Nevin,
1999) to include previous session reinforcer ratios. The reinforcer matrix in Figure
2.1 gives the effective reinforcer terms used to predict detection performance

41
according to the model. The notation used to describe the effective reinforcer
frequency in each cell of the matrix is ijR′ , where ij corresponds to the cells of the 2x2
matrix. The present analysis extended the model by using the current and previous
three sessions’ reinforcer ratios to predict current session performance, as previous
studies have shown little effect of greater lags (Grace, Bragason, & McLean, 2003;
Kyonka & Grace, 2008; Schofield & Davison, 1997). We employed perhaps the
simplest extension of the model, assuming an additive effect of current and previous
sessions’ effective log reinforcer ratios on current session performance (see also
Davison & Baum, 2207). This model may be written:
cRR
RR
RR
RR
BB
ni
ni
ni
ni
ni
ni
ni
ni
i
i loglogloglogloglog)3(2
)3(1
)2(2
)2(1
)1(2
)1(1
2
1
2
1 +⎟⎟⎠
⎞⎜⎜⎝
⎛
′
′+⎟
⎟⎠
⎞⎜⎜⎝
⎛
′
′+⎟
⎟⎠
⎞⎜⎜⎝
⎛
′
′+⎟⎟
⎠
⎞⎜⎜⎝
⎛′′
=⎟⎟⎠
⎞⎜⎜⎝
⎛
−
−
−
−
−
− (2.5)
where Bi1, B i2, R' i1, and R' i2 refer to the right and left response frequencies and
effective reinforcer frequencies following S1 and S2 presentations, respectively.
Reinforcer frequencies are subscripted by n for the current session, n-1 for the
previous session, and so on. In Equation 2.5 the parameter log c represents a constant
bias towards one response that is independent of changes in the reinforcer frequency
ratio. Equation 2.5 was applied to the data from the fourth session on of each PRBS
presentation. Each fit required one ds parameter, one log c parameter, and four dr(n-i)
parameters measuring the contribution of each past sessions’ reinforcer ratios (n = 0-
4) to current session performance. Equation 2.5 was fit to the log response ratios
following each stimulus (S1 and S2) simultaneously by nonlinear least squares
regression using the Solver tool in Microsoft Excel©.
42
Figure 2.4 shows contingency discriminability (dr) estimates for each session
lag and each PRBS presentation obtained from fits of Equation 2.5. In general,
Equation 2.5 provided an excellent description of the data, on average accounting for
93% of the variance (all %VAC > 0.87) in the log response ratios across subjects and
conditions. Contingency discriminability for the current session (lag 0) reinforcer
ratio was highest and previous session reinforcer ratios had little effect on
performance. For all subjects contingency discriminability was higher when stimulus
discriminability was highest (disconfirming Hypothesis 4). That is, behavior came
under greater control of the current session reinforcer frequency ratio when
discrimination accuracy was higher (Fig. 2.2). When subjects J85 and J86 were
returned to the easier discrimination (2:8-s stimulus presentations), lag 0 contingency
discriminability increased to similar, albeit lower levels than the first PRBS
presentation. For subject J87 the PRBS replication of the easier discrimination (3:5-s
stimulus presentations) produced slightly higher estimates of lag 0 contingency
discriminability.
Although the previous analysis showed that behavior in a given session was
largely under control of the current session reinforcer ratio, it is likely that the
previous sessions’ reinforcer ratio has some effect at the beginning of the current
session. Therefore, I sought to assess control over current session performance by
current and past reinforcer ratios by estimating values of contingency discriminability
(dr) within an experimental session as a function of the current and previous sessions’
reinforcer ratios. Therefore, an analysis similar to the session-aggregate lag
contingency discriminability analyses were performed, however for the within-
43
session analyses log response ratios were calculated over 5 30-trial blocks.
Regressions were then carried out using the current and immediately prior sessions’
programmed reinforcer ratio to predict performance in each fifth of the current
session (see, Davison & Baum, 2000; Grace, Bragason, & McLean, 2003). Equations
similar to Equation 2.6 were fit simultaneously to log behavior ratios following S1
and S2, respectively for each session fifth using the programmed reinforcer ratio from
the previous and current sessions. Data from each session of the first and second
PRBS were used to estimate the model parameters. Each fit required a fixed ds and
log c parameter and a contingency discriminability (dr(n) and dr(n-1)) parameter
estimated for each block, representing the within session adjustment to the current
reinforcer ratio. The results of the within session changes in contingency
discriminability are displayed for the first and second PRBS exposures separately in
Figures 2.5 and 2.6.
Figure 2.5 shows that in the first PRBS, where the S1-S2 difference was
greater, control by the current session reinforcer ratio was acquired rapidly with little
discernable effect by the previous sessions’ reinforcer ratio (supporting Hypothesis
3).. Figure 2.5 shows that there was little effect of the previous sessions’ reinforcer
ratio, as assessed by dr values of approximately 1.0, the minimum value of this
parameter. Furthermore, some control by the current session reinforcer ratio was
apparent within the first session fifth for 3 of 4 subjects (J87, being the exception) as
evidenced by dr values above 1.0. Estimates of contingency discriminability
continued to increase throughout the session and appeared to stabilize for each subject
44
about midway through the session. Finally, the regression fits from which the dr
estimates in Figure 2.5 are based were quite good (all VAC > 0.90).
Figure 2.6 shows the results of the within session analyses for the second
PRBS in which the sample stimuli were 3 and 5.5-s, producing a less accurate
discrimination (Figure 2.2) than in the first PRBS. Overall, the regressions carried out
on the data from the second PRBS, resulted in relatively low percentages of variance
accounted for across subjects (mean VAC = 0.66). The deviations from predicted
response ratios, however, were small (mean MSE = 0.02) and unsystematic.
Regressions conducted on the obtained versus predicted data from each subject gave
slopes and y-intercepts not appreciably different from 1.0 and 0, respectively.
Inspection of Figure 2.6 shows that estimates of within-session contingency
discriminability were much lower in the second PRBS, where the difference in
sample stimulus duration was only 2.5 seconds (see Figs. 2.3-2.4). More notable
though was the finding that for each subject the estimates of contingency
discriminability for the previous session remained above 1.0 throughout most of the
session for most of the subjects. Furthermore, control by the previous sessions’
reinforcer ratio was sometimes greater than that of the current session by the end of a
session (partially disconfirming Hypothesis 3). This relationship is especially
apparent in the parameter estimates obtained from J85. For this subject, control over
response allocation seemingly switched approximately midway through a session
from the current to previous sessions’ reinforcer ratio, often producing indifference
between the response alternatives (Fig. 2.3).
45
DISCUSSION
In the present study, the pseudorandom binary sequence method of varying
relative reinforcer frequency was extended to a signal detection procedure. The
findings presented here demonstrate that response bias (log B) in a signal detection
task can change rapidly when the relative frequency of reinforcement changes
between sessions. An extended form of the DNA detection model provided an
accurate description of the effects of current and previous session reinforcer ratios on
current session performance. In the first PRBS presentation, under large differences
in the temporal durations defining S1 and S2, bias changed rapidly between sessions.
Contingency discriminability was greatest at lag 0 and was largely unaffected by
previous session reinforcer ratios. In the second PRBS presentation the S1 and S2
stimulus durations were changed such that accuracy, measured as log D, decreased
(Figure 2.2). Under lower levels of discrimination accuracy, variation of the
reinforcer ratio had a smaller effect on bias. Contingency discriminability was higher
at lag 0 reinforcer ratios however, relative to reinforcer ratios in previous sessions.
Estimates of contingency discriminability changed however, as the discrimination
was made more difficult (Fig. 2.4). It is unclear why contingency discriminability
decreased in the second PRBS exposure when accuracy decreased.
The more typical finding in studies of detection performance is that
contingency discriminability is either constant or increases when stimulus
discriminability decreases (for a review see Alsop & Porritt, 2006). It might be
argued that the decrease in contingency discriminability seen here is the result of the
use of a PRBS procedure to vary relative reinforcer frequency per se. However, at
46
least two arguments can be made against this conclusion. First, previous studies that
have varied relative reinforcer frequency or immediacy in concurrent and concurrent-
chained schedules have typically shown an increased sensitivity to the conditions of
reinforcement with increasing exposure to the PRBS (Grace, Bragason, & McLean,
2003; Grace & McLean, 2006; Kyonka & Grace, 2007; Schofield & Davison, 1997).
Second, at least one study that we are aware of has shown a similar effect on
bias under similar procedures. McCarthy and Davison (1980) conducted a study
similar to the present one in which stimulus presentations of different durations
served as samples in a 2-stimulus, 2-response detection procedure. McCarthy and
Davison varied the reinforcer ratio for correct responses across two levels of stimulus
duration difference across several conditions with pigeons serving as subjects. In their
first set of conditions, a 5-second illumination of the center key served as S1 and a 30-
second center key illumination served as S2. In their second set of conditions, S1 and
S2 were 20- and 30-second center key light presentations, respectively. As expected,
discrimination accuracy was higher in the first condition, however for some subjects;
sensitivity to reinforcement, as estimated from the Davison & Tustin, (1978)
detection model, was also higher in this condition. Such a result would be consistent
with the present findings; however, McCarthy and Davison (1980) reported that any
apparent changes were not statistically significant according to a Sign test. However,
McCarthy and Davison (1980) analyzed their data according to a detection model
based on the generalized matching law and a more direct comparison of the results of
their study with the current findings might be achieved be a reanalysis of their data
according to the DNA model (i.e., Fig. 2.1).

47
Figure 2.7 presents parameter estimates from the present study and a
reanalysis of McCarthy and Davison’s (1980) data fit by the DNA detection model. In
Figure 2.7, estimates of stimulus discriminability (ds) are plotted as a function of
estimates of contingency discriminability (ds) from both studies. It is apparent that the
results of the present study are consistent with the findings of McCarthy and Davison
(1980) employing a similar detection task. Furthermore, the data from both studies
suggest a degree of generality in these findings in that the studies differed in the
procedure used to vary relative frequency of reinforcement and species of subject.
The present findings suggest that the PRBS method of varying relative
reinforcement variables may be extended to signal detection tasks. Whether these
findings hold for more complex detection procedures (Davison & McCarthy, 1989)
and other stimulus dimensions will be informed by future research. However, in a
research area of that has seen a large degree of quantification (Davison, 1991;
Davison & Nevin, 1999), procedures that produce high quality data and rapid
determination of parameter estimates are needed. Furthermore, recent research
employing procedures in which contingencies change randomly have shed some light
on some of the local processes governing simple concurrent choice (Krägeloh,
Davison, & Elliffe, 2005). Perhaps with the further procedural development, similar
advances can be made in the study of signal detection.
48
CHAPTER 3
RAPID SHIFTS IN THE PSYCHOMETRIC FUNCTION FOR TIME
In recent years, a considerable body of literature on the performance of non-
human animals in signal detection and conditional discrimination procedures has
emerged (for reviews see Davison & McCarthy, 1988; Davison & Nevin, 1999;
Nevin, Davison, & Shahan, 2005). A number of studies have employed tasks in
which only two stimuli are presented in a given experimental session (McCarthy &
Davison, 1979; 1980b; Nevin, Olson, Mandell, & Yarensky, 1975). Although the 2-
stimulus, 2-response detection procedure has been employed more frequently and has
served to guide theoretical development (Alsop & Davison, 1991; McCarthy &
Davison, 1984), far fewer studies have been reported in which several stimuli are
presented within a single session.
In a standard 2-stimulus, 2-response detection task, subjects are presented
with one of the two possible stimuli (S1 or S2) on each trial. One type of response (a
B1 response, e.g., a right lever press) is deemed correct and intermittently reinforced
on S1 trials and the other type of response (a B2 response, e.g., a left lever press) is
deemed correct and intermittently reinforced on S2 trials. In the n-stimulus, 2-
response detection task, subjects are presented with one of n possible stimuli on each
trial. With only two responses available to the subject, each response (B1 or B2) is
correct and intermittently reinforced following presentation of more than one
stimulus. Thus, the n-stimulus, 2-response detection procedure involves a many-to-
one mapping between stimulus classes and responses.
49
Davison (1991) provided a model to describe performance in n-stimulus, m-
response detection procedures (see also Davison & McCarthy, 1989). The model
offered by Davison (1991) was an extension of an earlier contingency
discriminability model for concurrent schedule performance (Davison & Jenkins,
1985) and in the 2-stimulus, 2-response procedure is the same model proposed by
Alsop (1991). The model for a 4-stimulus, 2-response detection procedure is outlined
in Figure 3.1. As suggested by Davison (1991) the model assumes that in a signal
detection task, reinforcers delivered for a correct response in the presence of one
stimulus generalize to other stimulus-response pairs to the extent that they are similar
to one another. In Figure 3.1, dsij and drij represent the inverse of generalization (i.e.
discriminability) between the stimulus-response and response-reinforcer pairs,
respectively.
Davison and Nevin (1999) expanded upon the quantitative model of detection
introduced by Alsop (1991) and Davison (1991) (DNA model hereafter) and detailed
a theory of effective reinforcement. Effective reinforcement, in Davison and Nevin’s
(1999) account is an intervening variable (analogous to the subjective or discounted
value of a reinforcer) representing the sum of direct and generalized reinforcement for
a particular response class. Their theory proposes that response allocation in signal
detection and related procedures strictly matches the effective reinforcer ratio. Thus,
Davison and Nevin’s (1999) theory is a matching law (Baum & Rachlin, 1969;
Killeen, 1972; Rachlin, 1971), where the transformation of various reinforcer
dimensions are assumed to result from imperfect discriminative control on one or
more dimensions of the concurrent three-term contingencies under investigation.
50
Davison and McCarthy (1989) conducted the most extensive evaluation of
Davison’s (1991) model that has been reported to date. In the major portion of their
study, pigeons were presented one of eight different wavelengths of light (measured
in nanometers, nm) on each trial. Responses to the left key (B1) were intermittently
reinforced following a wavelength of 574 nm or less (559, 564, 569, 574 nm) and
right responses (B2) were intermittently reinforced after stimulus presentations of 579
nm or greater (579, 584, 589, 594 nm). Across several conditions, the relative
frequency of reinforcement for correct responses following a shorter wavelength was
varied from 0.1-0.9. Davison and McCarthy (1989) reported that the logarithm of the
left/right response ratio (B1/B2) plotted as function of wavelength was an ogive, the
functional form typically observed in psychophysical studies. Furthermore, the
horizontal ordering of the curves depended on the relative frequency of reinforcement
such that subjects demonstrated an overall bias to report the stimulus with the higher
relative reinforcer frequency. Davison and McCarthy (1989) reported that Davison’s
(1991) model provided an excellent description of their data. Moreover, the model
provided estimates of stimulus discriminability (dsij) for adjacent wavelengths that
were in approximate agreement with previous work on the pigeon’s sensitivity to
wavelength (Wright & Cumming, 1971).
While the literature on performance in simple 2x2 detection procedures
continues to expand (Davison & Nevin, 1999) and extensions of models for
performance in such procedures have shown some promise in more complex
situations (Nevin, Davison, Odum, and Shahan, 2007), little is currently known about
detection performance in transition. An important question concerns the temporal
51
scale at which stimulus and contingency discriminability operates in order to produce
an effective reinforcer value for each response alternative. Davison and Nevin
suggested that their account is sequential and dynamic, implying that effective
reinforcement is determined at a local level. Therefore, their theory suggests a
renewed research emphasis concerned with characterizing detection performance in
transition.
Recently, several investigators have employed a design to investigate choice
in which the relative rates, delays, or magnitudes of reinforcement change from
session to session. Hunter and Davison (1985) adapted a systems identification
technique from engineering to present stochastic changes in input, in this case relative
reinforcer frequency, to pigeons responding for food in a concurrent schedule of
reinforcement. This procedure, called a pseudorandom binary sequence (PRBS),
consists of presenting one of two reinforcer rate ratios each session. The sequence of
reinforcer ratios is random, thus a current session’s reinforcer ratio cannot be
predicted from that of the previous session. Hunter and Davison’s (1985) analysis
showed that pigeons’ relative response rates adapted to abrupt changes in the
reinforcer rate ratio in approximately five sessions, although the pigeons were less
sensitive to these changes than in more typical steady-state experimental designs.
The findings of Hunter and Davison (1985), as well as several others to follow
(Mazur, 1992, 1995, 1997; Schofield & Davison, 1997), are somewhat surprising in
light of most research on choice (see Davison & McCarthy, 1988). That is, the use of
traditional steady-state designs, in which a single reinforcer rate ratio is in effect for
many sessions (20-30) until preference is relatively stable, seems to suggest that
52
behavior in several choice paradigms is slow to change. Numerous studies,
employing what may be considered as variations on the PRBS design have shown
that choice adapts rapidly to frequent changes in outcomes (Davison & Baum, 2000,
2002, 2003; Gallistel, Mark, King, & Latham, 2001; Landon, Davison, & Elliffe,
2003)
Some recent work employing the PRBS design or other means of producing
frequent changes in reinforcer parameters, has shown that preference not only adapts
rapidly to abrupt changes in relative rates of primary reinforcement, but also to
changes in conditioned reinforcement value (Grace, 2002; Grace, Bragason, &
McLean, 2003; Mazur 2002; Mazur, Blake, & McManus, 2001). The concurrent
chains procedure involves a choice period or initial link in which repeated choices are
made between two options. Occasionally, choice of one option produces an outcome
period or terminal link, signaled by a change in stimulus conditions, in which further
responding leads to the availability of food. Responding in the choice or initial link
phase is usually assumed to be maintained by conditioned reinforcing value of access
to the terminal link stimuli (Fantino, 1969; 1977; Herrnstein, 1964; Mazur, 2001).
These studies have manipulated the value of terminal link stimuli in concurrent chains
procedures by varying the frequency of encountering the stimuli and by varying the
delays to primary reinforcement in the presence of the terminal link stimuli.
Grace, Bragason, and McLean (2003) showed that pigeons’ response
allocation, measured, as relative response rate in the initial links of a concurrent
chain, is sensitive to changes made to primary reinforcement delays in the terminal
links according to a 31-session PRBS. In their Experiment 1, Grace and colleagues
53
held the delay to primary reinforcement constant in one terminal link (8-s), while the
delay to reinforcement in the other terminal link varied from session to session
between two values (4- or 16-s). After the first 31-sessions of exposure, the pigeon’s
sensitivity to the relative terminal link delays to reinforcement was largely under
control of the current sessions’ relative delays. Grace and colleagues exposed their
pigeons to the PRBS twice more and showed that control by current session
reinforcement conditions continued to increase for all four subjects. Subsequent
analyses, from the third PRBS, showed that the birds’ preference adapted to the
current session reinforcer delay ratio within approximately one third of the session or
24 choice cycles. In their Experiment 2, Grace et al. held the delay to reinforcement
in one terminal link constant (8-s) while varying the other delay each session between
2-s and 32-s. Thus, according to this arrangement the delay to reinforcement for one
alternative is sampled from a potentially infinite population each session. Grace et al.
showed that under these conditions, pigeons’ choices adapted to the session-to-
session changes in delays to reinforcement in a very similar manner to the delays in
their Experiment 1.
Following Grace et al (2003, see also Grace & McLean, 2006; Kyonka &
Grace, 2007), Kyonka and Grace (2008) presented data, again on pigeons’ choices in
concurrent chains schedules, under more complex variations in reinforcer parameters
according to the PRBS design. In their Experiment 1, Kyonka and Grace employed a
concurrent chains procedure in which the relative delays and magnitudes of
reinforcement in the terminal links varied from session to session each according to a
separate PRBS. Kyonka and Grace’s findings were entirely consistent with their
54
previous work in that pigeons’ choices adapted rapidly each session to both
dimensions of reinforcement. Kyonka and Grace’s data supported the assumption that
reinforcer rate and magnitude ratios have independent effects on choice. Additionally,
these results are consistent with published findings obtained from more traditional
designs previously employed to test the assumption of the generalized matching law
(Killeen, 1972; Rachlin, 1971) that different dimensions of reinforcement combine
independently to determine reinforcer value.
The studies reviewed here provide support for the use of designs employing
dynamic changes in reinforcer parameters to investigate choice behavior in transition.
However, no such studies employing a PRBS design to investigate choice in a signal
detection procedure have been published. The present study sought to extend the
PRBS design to a 5-stimulus, 2-response signal detection procedure to determine the
extent to which response bias following a particular stimulus develops within a single
experimental session. The experiment reported here provides both an extension of the
PRBS design to signal detection and conditional discrimination procedures, as well as
a much-needed systematic replication of Davison and McCarthy (1989). Furthermore,
we sought to extend Davison’s (1991; see also Davison & Nevin, 1999) n-stimulus
model of detection to quantify the extent of carryover from previous sessions’
reinforcer ratios on current session response ratios. In addition, one of the sample
stimuli presented each session was never followed by food presentation regardless of
which response was made; analogous to a maintained generalization procedure
(Blough, 1969). I asked whether performance following this stimulus (technically an
SΔ) was similarly biased towards the higher reinforcer probability response alternative
55
as was responding that actually produced reinforcer deliveries. If so, this would
provide some support for Davison and Nevin’s (1999) notion of effective
reinforcement.
Hypotheses
1) By the end of the first PRTS, the current session response bias, assessed by
lag dr, will be primarily under control of the current session reinforcer ratio.
Contingency discriminability at lag 0 will increase across PRTS presentations.
2) Within experimental sessions, bias will gradually shift from control by the
previous sessions’ to the current sessions’ reinforcer ratio.
3) The response ratio following presentation of S3 will be biased towards the
response alternative correlated with the higher probability of reinforcement.
4) Modeling within-session adjustment to the current session reinforcer ratio by
changes in contingency discriminability will produce orderly shifts in the
psychometric function according to the programmed relative reinforcer
probabilities.
METHOD
Subjects
The subjects were three female Long Evans Hooded rats J93, J94, and J99.
Rats J94 and J99 had prior exposure to a free-operant temporal discrimination
procedure. Food deprivation was held constant for each subject by post-session
feeding (12g). The rats were housed individually and had free access to water when in
their home cages in a vivarium with a 12:12 hr light/dark cycle (lights on at 6:00
56
a.m.). Sessions were conducted daily, at approximately the same time with few
exceptions. Experimental sessions were conducted during the rats’ light period.
Apparatus
Same as the second chamber described in Experiment 1.
Procedure
Preliminary Training. Prior to discrimination training, J94 and J99 were placed on a
concurrent random-ratio (RR), RR schedule of reinforcement. For rat J93, lever
pressing was shaped by the method of successive approximation and then placed on
the concurrent RR, RR schedule. Throughout this preliminary lever-press training,
reinforcers were programmed for each response according to a dependent schedule
(Stubbs & Pliskoff, 1969) such that in the event that a reinforcer was assigned to one
response alternative, no other reinforcer could be assigned until the previously
allocated reinforcer was obtained by the subject. Subjects were exposed to this
procedure for approximately four weeks and the ratio requirements for both levers
were increased to a terminal value of RR 3.
Subsequently, each subject was exposed to the basic temporal discrimination
procedure. On each trial, the houselight was illuminated for one of five durations (2,
3.5, 4.5, 5.5, or 8-s). Following the sample stimulus presentation, both lever lights
were illuminated and responses to the right lever were reinforced following sample
durations of 2 and 3.5-s and responses to the left lever were reinforced following
sample durations of 5.5 and 8-s. Left and right lever presses following a 4.5-s sample
presentation were never reinforced. Initially, each correct response was followed by
two, 2-s presentations of the dipper, with a 0.5-s delay between the presentations.
57
Incorrect responses led directly to the intertrial interval (ITI) in which all lights in the
chamber were extinguished for 7-s. Each session consisted of 200 trials, with 40
presentations of each sample. Following approximately 30 sessions for each subject,
the overall density of reinforcement was decreased by implementing a dependent
schedule of reinforcement. The dependent schedule or controlled reinforcer ratio
procedure (McCarthy & Davison, 1984) ensured an approximately equal number of
reinforcers were obtained for responding to both correct response alternatives. No
attempt to equate the number of reinforcers within a stimulus class (2.0-3.5 and 5.5-
8.0-s) was made. Upon transition to the dependent schedule correct responses that
were not eligible for reinforcement had the same consequences as error responses (7-s
ITI) and correct responses that were eligible for reinforcement continued to produce
4-s of access to the dipper followed by a 2.5-s blackout. This training phase continued
for each subject until the percentage of correct responses following each stimulus was
deemed stable by visual inspection of the data. For rats J94 and J99 training was
deemed complete after 45 sessions and for J93 after 80 sessions.
Upon completion of training on the dependent schedule phase, each subject
was exposed to a procedure in which the relative probabilities of reinforcement
changed each session. The relative probability of reinforcement for correct responses
following one of the shorter stimulus durations was 0.25, 0.5, or 0.75. This is in effect
a pseudorandom ternary sequence (PRTS). The sequence lasted for a total of 36
sessions; each reinforcer probability was allowed to occur three times in each block
of nine sessions. The order of reinforcer probability session was determined
separately for each of the four blocks of nine sessions according to the random
58
number generator tool in Microsoft© Excel. Figure 3.2 illustrates one 36 session
PRTS, where the logarithm (base 10) of the programmed relative reinforcer frequency
ratio (RR/RL) is plotted according to session.
Each subject was exposed to the 36-session PRTS three times.
RESULTS
As in Experiment 1 and previous studies employing the pseudorandom
sequence design (cf. Schofield & Davison, 1997), it is important to quantify the
extent of control by the present and past reinforcer frequency ratios on current session
performance. The data from Experiment 2 can be fit by Equation 2.5, but require the
addition of a stimulus discriminability (dsij) estimate for each pair of sample stimuli.
Following Davison and Nevin (1999), we fit Equation 2.5 to the present data with
four stimulus discriminability parameters for each adjacent pair of stimuli: ds12, ds23,
ds34, and ds45. Estimates of dsij for all other combinations of stimuli were obtained by
multiplying the above estimates, so that for example, ds14 is the product of ds12, ds23,
and ds34 (see also, Davison & Nevin, 1999; Krägeloh, Elliffe, & Davison, 2006). A
matrix of the summed reinforcer frequencies divided by the appropriate
discriminability parameters were created for each session giving the effective
reinforcer frequency for each response alternative. The logarithm of the ratio of the
effective reinforcer frequencies was used to predict log response ratios following each
stimulus. For example, following sample S3, the effective reinforcer frequency for
each response is:
1235
52
1234
42
23
21
13
1131'
rsrsss ddR
ddR
dR
dRR +++= (3.1)
and
59
35
52
34
42
1223
21
1213
1132'
ssrsrs dR
dR
ddR
ddRR +++= (3.2)
The log effective reinforcer ratio (R'31/R'32) obtained in the current and previous three
sessions were used to predict the response ratio following each stimulus in each
session of the three PRTS exposures. The effect of each sessions’ effective reinforcer
ratio on current session response ratios were assumed to additive as in Experiment 1.
Therefore, fits of Equation 2.5 to the data of Experiment 2 required that four stimulus
discriminability parameters, an inherent bias term (log c), and four contingency
discriminability parameters be estimated.
Figure 3.2 shows lag contingency discriminability estimates obtained from fits
of Equation 2.6 for each rat and PRTS. Overall, contingency discriminability was
highest at lag 0 and near 1.0 at greater lags. Between the first and second PRTS
presentations the effects of previous sessions’ reinforcer ratios decreased for each
subject. For J94 and J99, lag 0 contingency discriminability increased from the first
and second PRTS exposures and then decreased on the final PRTS to levels similar to
the first exposure. For J93, little change in lag 0 contingency discriminability
occurred between the first two PRTS exposures, however, lag 0 contingency
discriminability increased to high levels on the third PRTS exposure for this subject.
Therefore, the data from Experiment 2 conform to previous studies (supporting
Hypothesis 1) employing the PRBS design showing that the extent of control by the
current session reinforcer ratio primarily occurs in the first two exposures (Schofield
& Davison, 1997; Grace, Bragason, & McLean, 2003).
To examine within-session changes in contingency discriminability as in
Experiment 1, the data from each session of the third PRTS exposure of Experiment 2
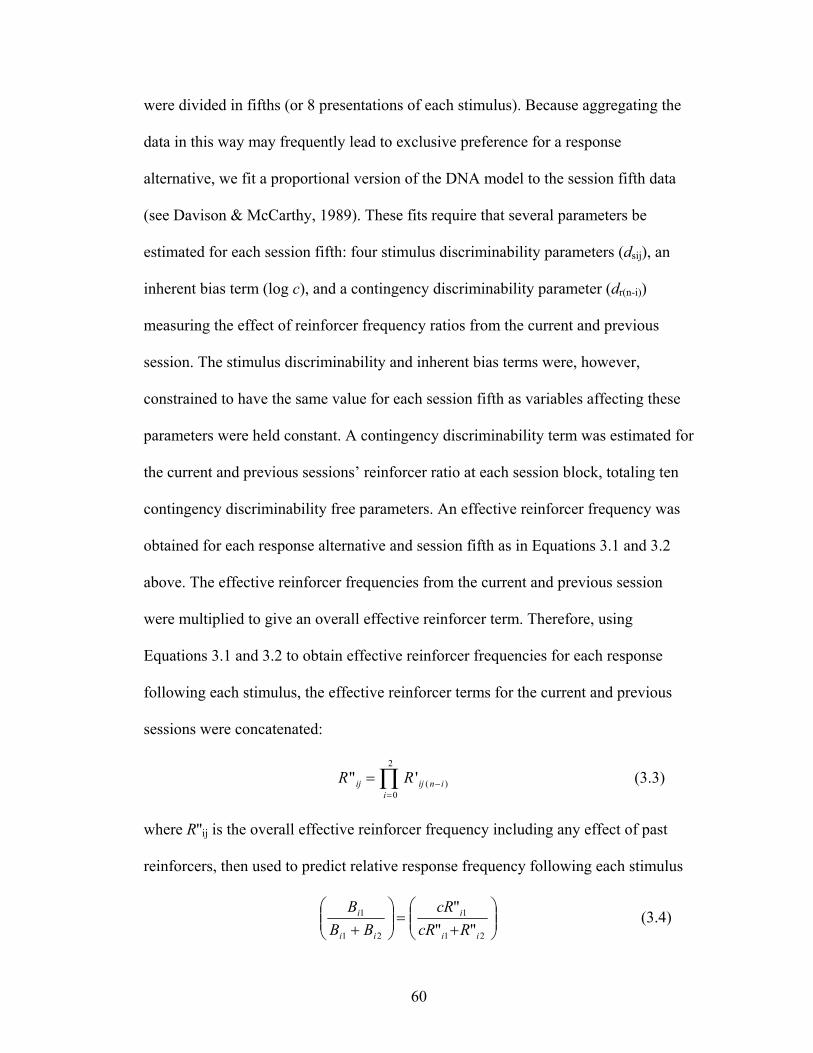
60
were divided in fifths (or 8 presentations of each stimulus). Because aggregating the
data in this way may frequently lead to exclusive preference for a response
alternative, we fit a proportional version of the DNA model to the session fifth data
(see Davison & McCarthy, 1989). These fits require that several parameters be
estimated for each session fifth: four stimulus discriminability parameters (dsij), an
inherent bias term (log c), and a contingency discriminability parameter (dr(n-i))
measuring the effect of reinforcer frequency ratios from the current and previous
session. The stimulus discriminability and inherent bias terms were, however,
constrained to have the same value for each session fifth as variables affecting these
parameters were held constant. A contingency discriminability term was estimated for
the current and previous sessions’ reinforcer ratio at each session block, totaling ten
contingency discriminability free parameters. An effective reinforcer frequency was
obtained for each response alternative and session fifth as in Equations 3.1 and 3.2
above. The effective reinforcer frequencies from the current and previous session
were multiplied to give an overall effective reinforcer term. Therefore, using
Equations 3.1 and 3.2 to obtain effective reinforcer frequencies for each response
following each stimulus, the effective reinforcer terms for the current and previous
sessions were concatenated:
∏=
−=2
0)('"
iinijij RR (3.3)
where R''ij is the overall effective reinforcer frequency including any effect of past
reinforcers, then used to predict relative response frequency following each stimulus
⎟⎟⎠
⎞⎜⎜⎝
⎛+
=⎟⎟⎠
⎞⎜⎜⎝
⎛+ 21
1
21
1
"""
ii
i
ii
i
RcRcR
BBB
(3.4)
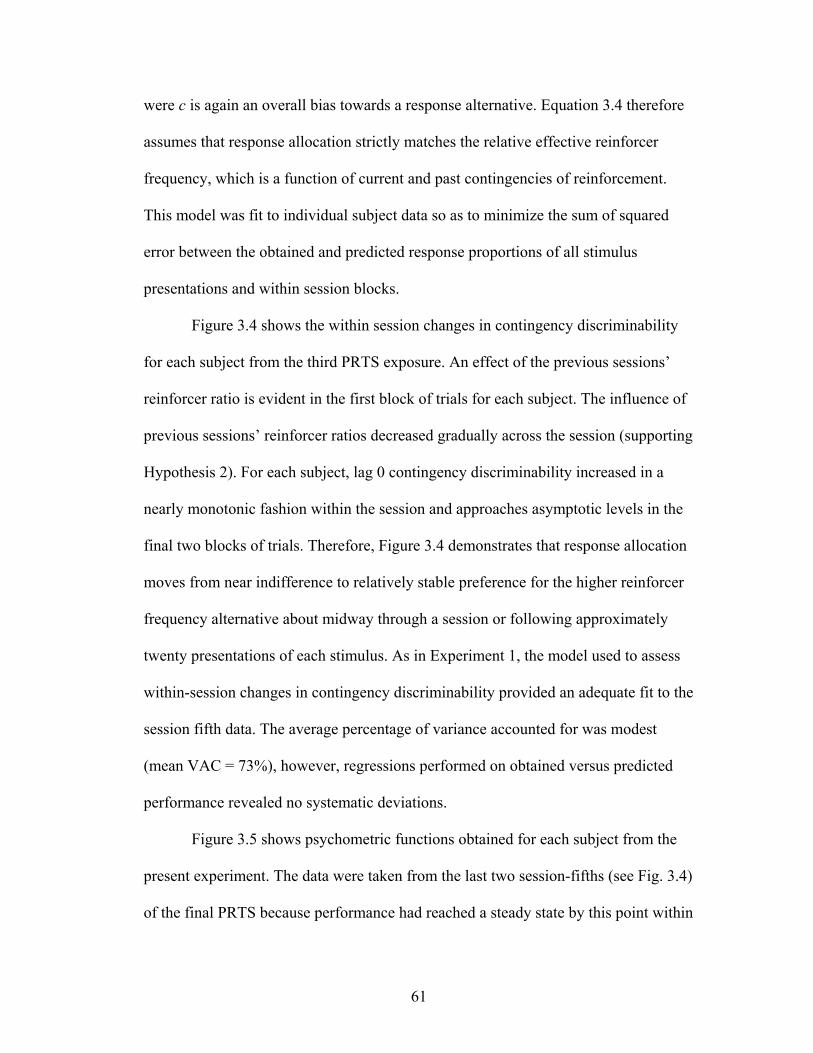
61
were c is again an overall bias towards a response alternative. Equation 3.4 therefore
assumes that response allocation strictly matches the relative effective reinforcer
frequency, which is a function of current and past contingencies of reinforcement.
This model was fit to individual subject data so as to minimize the sum of squared
error between the obtained and predicted response proportions of all stimulus
presentations and within session blocks.
Figure 3.4 shows the within session changes in contingency discriminability
for each subject from the third PRTS exposure. An effect of the previous sessions’
reinforcer ratio is evident in the first block of trials for each subject. The influence of
previous sessions’ reinforcer ratios decreased gradually across the session (supporting
Hypothesis 2). For each subject, lag 0 contingency discriminability increased in a
nearly monotonic fashion within the session and approaches asymptotic levels in the
final two blocks of trials. Therefore, Figure 3.4 demonstrates that response allocation
moves from near indifference to relatively stable preference for the higher reinforcer
frequency alternative about midway through a session or following approximately
twenty presentations of each stimulus. As in Experiment 1, the model used to assess
within-session changes in contingency discriminability provided an adequate fit to the
session fifth data. The average percentage of variance accounted for was modest
(mean VAC = 73%), however, regressions performed on obtained versus predicted
performance revealed no systematic deviations.
Figure 3.5 shows psychometric functions obtained for each subject from the
present experiment. The data were taken from the last two session-fifths (see Fig. 3.4)
of the final PRTS because performance had reached a steady state by this point within
62
an experimental session. The proportion of “long” or left responses following each
sample stimulus were averaged across sessions and grouped according to
programmed reinforcer ratio (Fig. 3.2). Figure 3.5 shows that the proportion of
responses to the left lever, indicating a long classification, increased as an ogival
function of the preceding sample stimulus duration. Furthermore, each psychometric
function shifted along the x-axis according to the programmed reinforcer ratio
(supporting Hypothesis 4). Therefore, Figure 3.5 affirms that the data obtained from
the present method of varying reinforcer frequency produces reliable psychometric
functions and the shift in each curve produced by varying the relative frequency of
reinforcement for correct responses is similar to that observed in traditional steady-
state procedures (Bizo & White, 1995; Davison & McCarthy, 1989).
As a further check on the adequacy of the extension of the DNA model
proposed here to model within-session adjustments to a frequently varying reinforcer
ratio we assessed the model’s ability to fit the psychometric data in Figure 3.5.
Keeping in mind that the extended DNA model of Equations 3.3 and 3.4 were fit to
all the data of the third PRTS from each block of 40 trials gave 900 data points per
subject. The models’ predictions for the last two blocks of trials (trials 161-200) were
averaged in the same manner as the obtained data (Fig. 3.5). Table 3.1 gives the
parameters of the DNA model along with goodness of fit indices for the data from
blocks four and five. The fits of the DNA model incorporating carryover from the
previous session’s reinforcer ratio were excellent. Furthermore, the assumption of
constant stimulus discriminabilities and an increasing contingency discriminability,
63
and thus increasing bias towards the higher reinforcer frequency alternative, provided
an accurate description of the individual subject data.
Finally, a measure of response allocation following each sample stimulus
presentation was sought that characterizes the changing response allocations as a
function of the opportunity to observe them. Cumulative response proportion was
chose as a measure of preference because this measure naturally smoothes the data
(for discussion see Gallistel et al, 2007). Data from the third PRTS were used for
theses analyses and response totals were summed across each session by order of
stimulus presentation. Therefore, cumulative relative response frequency is plotted as
a function of successive presentations of a particular sample stimulus.
The cumulative proportions of B1 choices (p) for each subject have been
converted to a logit p (logit p = log(p/(1-p)) and are plotted in Figures 3.6-3.8. The
cumulative choice proportion plots in Figures 3.6-3.8 show changes in preference
within experimental sessions that were similar to those reported in other studies
employing similar procedures (Krägeloh & Davison, 2003; Krägeloh, Elliffe, &
Davison, 2006). Figures 3.6-3.8 shows that a preference for the higher reinforcer
frequency alternative typically emerged within five to ten presentations of a sample
stimulus duration. A relatively large degree of variability in response allocation in the
first few trials is evident for each subject as expected. Recall that responding
following S3 never produced a food presentation throughout the experiment yet
choice is governed by the overall reinforcer frequency ratio. The cumulative choice
proportions, therefore suggest a fairly rapid local process by which effective
reinforcer allocation operates on response allocation (supporting Hypothesis 3).
64
DISCUSSION
In the current experiment, bias changed rapidly when the reinforcer frequency
ratio for correct choices changed between sessions. An extension of the DNA model
that incorporated the effects of current and previous sessions’ effective reinforcer
ratios provided a good description of both aggregate and within-session changes in
response bias. Control by the current sessions’ reinforcer ratio generally increased
with increasing exposure to the PRTS, particularly with respect to effects of previous
sessions’ reinforcer ratios decreasing between the first and second exposures. Within-
session adjustment to the current session reinforcer ratio was most rapid between the
first and second session fifths (Fig. 3.4).
The session-aggregate lag contingency discriminability estimates portrayed in
Figure 3.3 are consistent with previous data obtained from the pseudorandom
sequence method of varying relative reinforcer frequency in a simple detection task
and in simple concurrent and concurrent chained schedules of reinforcement
(Experiment 1; Schofield & Davison, 1997; Grace, Bragason, & McLean, 2003;
Grace & McLean, 2006; Kyonka & Grace, 2008). The model employed here assumed
an additive effect of previous sessions’ reinforcer ratios, which is consistent with
previous modeling; however all previous studies have employed a generalized
matching law analysis of carryover effects in the pseudorandom sequence procedure
(Davison & Hunter, 1979; Davison & McCarthy, 1988). The extension of the
generalized matching law to account for the effects of previous sessions’ reinforcer
ratios was inspired by research in which multiple reinforcer dimensions (i.e., rate and
magnitude) have been varied simultaneously and the assumption of an additive effect
65
of each dimension has provided an accurate account of choice between alternatives
differing on multiple reinforcer dimensions (Davison & Baum, 2003; Keller &
Gollub, 1977; McLean & Blampied, 2001; but see Elliffe, Davison, & Landon, 2008).
Therefore, the present use of an additive version of the DNA model may be a possible
means of extending this model to multiple reinforcer dimensions (Alsop & Porritt,
2006; Davison & Nevin, 1999).
The within-session adjustments to the current session reinforcer frequency
ratio were fairly rapid, occurring mostly between the first and second session fifths.
The finding of rapid within-session adjustment to current reinforcer ratios is
consistent with previous findings (Grace, Bragason, & McLean, 2003; Grace&
McLean, 2006) and suggests that behavior is effected by both short- and long-term
effects of the reinforcer ratio. The adaptation of within-session responding to current
reinforcer frequency ratios was the product of two processes; an increase in control
by current session contingencies and a decrease by previous session contingencies
(Fig. 3.4). Therefore, at the beginning of a session, there was little or no overall bias
towards a particular response alternative. That is, between sessions behavior
regressed toward indifference, consistent with previous findings that in rapidly
changing environments, preference reverts to levels reflecting long-term reinforcer
allocations (Landon, Davison, & Elliffe, 2003). Because the present procedure
employed reinforcer ratios that varied symmetrically around 1:1, the finding of
approximate indifference at the beginning of an experimental session was expected.
Although the within-session changes in behavior (Fig. 3.5) are well
summarized by changes in the estimates in contingency discriminability, the changes
66
in behavior allocation displayed in Figure 3.6 highlight the speed of changes in bias
and the spread of effect of the reinforcer ratio across stimuli. The cumulative
preference data showed that responding following each stimulus was often biased
towards the higher reinforcer frequency alternative before ten presentations.
Therefore, as suggested by the DNA model, reinforcers delivered following a
particular response and following one stimulus effected behavior following all other
stimuli. Given that the stimuli were presented randomly, it is possible that preference
for a response alternative could be observed on the first presentation of a particular
stimulus. Krägeloh, Elliffe, and, Davison (2006; see also Krägeloh & Davison, 2003)
reported similar effects when they varied the reinforcer ratio across several seven
values within session and each reinforcer ratio was signaled by a different stimulus.
The present findings and those of Krägeloh and colleagues suggest that the spread of
reinforcer effects along stimulus and response dimensions can be observed at a local
level and that any serious attempt to model behavior at this level will require
incorporating such findings.
Finally, as discussed previously the DNA model performed well in several
respects as applied to the present experiment. An extension of the model
incorporating previous sessions’ reinforcer ratios described both session-aggregate
and within-session changes in bias (Figs. 3.3-3.4). The changes in response allocation
following each sample stimulus were rapid and showed evidence of generalization
across both stimulus and response dimensions, as suggested by the DNA model. Of
special interest, the changes in bias following presentation of S3 were similar to that
observed following other stimuli in which responding actually produced reinforcer
67
deliveries. Therefore, the present study provides a strong demonstration of an
important assumption of the DNA model. According to the model reinforcers
delivered following one stimulus or response will have an effect on behavior
following all other stimuli to the extent that the stimuli or responses in question are
similar to one another. The spread of reinforcer effect along stimulus and response
dimensions produces an effective or perceived number of reinforcers that may differ
from that actually delivered by the experimenter (Davison & Jenkins, 1985; Killeen,
1994). In the case of behavior following presentation of S3, the effective allocation of
reinforcers produced a preference for a response alternative when no reinforcers were
ever actually delivered for either response following presentation of this stimulus.
Therefore, the present results lend support to the theoretical assumption that behavior
in detection procedures is determined by the effective allocation of reinforcement
(Davison & Nevin, 1999). Furthermore, these findings suggest not only that a
reinforcement-based theoretical approach to understanding signal detection
performance may be of some value to those studying perception, but also that
studying perceptual phenomena may provide important insights into the process of
reinforcement itself.
68
CHAPTER 4
DYNAMICS OF ATTENDING IN THE
REPEATED ACQUISITION OF A TEMPORAL DISCRIMINATION
The role of attending has long been recognized as an important feature in the
establishment of stimulus control of operant behavior (Hull, 1950; Wyckoff, 1952,
1969). Dinsmoor (1985) pointed to the decrease in induction or transfer between
stimuli correlated with reinforcement and those that are not as training progresses to
be the hallmark of discrimination learning. On this view, it is the differential
correlation between discriminative stimuli and the training context with
reinforcement that comes to exert control over behavior in the formation of stimulus
control.
Early work by Heinemann and colleagues (Heinemann, Avin, Sullivan, and
Chase, 1969) showed that once asymptotic levels of performance on a sound intensity
generalization task had been achieved, accuracy at the tested end points (65 and 100
dB, respectively) of the intensity continuum was less than perfect. Their
generalization testing procedure entailed brief presentations of white noise followed
by the availability of two response alternatives. In different experiments, responses to
one key following a class of stimuli less than a critical value were reinforced and
responses to the other key following a class of stimuli greater than a critical value
were reinforced. Psychometric functions of the proportion of responses to the “high
intensity” key as a function of intensity of white noise were obtained for each subject.
Heinemann and colleagues found that the proportion of responses to the high intensity
69
key were often greater than zero and less than one at the extreme lower (65 dB) and
upper (100 dB) ends of the intensity values tested, respectively.
To account for the less than unit range of their obtained psychometric
functions, Heinemann and colleagues provided a theoretical treatment based on
attention. Specifically, they assumed that on some trials, their subjects’ choices were
controlled by unspecified stimuli other than the auditory dimension. To assess the
degree to which stimuli other than auditory stimuli controlled the subjects’ behavior,
Heinemann and colleagues used the following equation as a correction for inattention
( )⎟⎟
⎠
⎞
⎜⎜
⎝
⎛
−−
=)()(
)()(
1
1RpuRp
RpRpARp (4.1)
where p(R│A) is the probability of a response p(R) given attention (A) to the prior
stimulus. The terms p(Ru) and p(R1) denote the obtained upper and lower asymptotes
of the psychometric function. With this correction, Heinemann and colleagues fit
normal ogives to the obtained psychometric functions and showed that the probability
of attending depended on training conditions prior to generalization testing.
Specifically, subjects trained on a more difficult discrimination before generalization
testing gave steeper (i.e., more step like) psychometric functions than those subjects
who had been trained on an easier discrimination.
Heinemann & Avin (1973) trained pigeons on a maintained generalization
procedure, in which right or left key pecks following different intensities of white
noise produced access to food. In their experiment 2, subjects were presented one of
ten possible intensities ( 60-96 dB, in 4 dB steps) of white noise on each trial and
were required to peck the left key given an intensity of 76 dB or less and a peck to the
right key given an intensity of 80 dB or greater. Heinemann and Avin analyzed
70
psychometric curves from separate 10 session blocks of training (100 sessions total).
Applying the same asymptote correction as above (Eq. 4.1), Heinemann and Avin
(1973) showed that the probability of attending to the sample stimuli increased in a
negatively accelerated fashion towards 1.0 across training blocks.
Blough (1996) attempted to isolate different factors that contribute to errors in
the matching-to-sample (MTS) performance of pigeons. He distinguished three
separate sources of error that may occur in various stimulus control procedures.
Blough’s analyses were based on fitting a normal ogive to psychometric functions,
which provide an estimate of mean and standard deviation. The standard deviation or
slope of the obtained psychometric curve is commonly referred to as sensitivity or
d ′ in signal detection theory terminology (Green & Swets, 1966). The mean or point
of subjective equivalence (PSE) of the psychometric curve is an estimate of response
bias or the propensity to report one stimulus more frequently than the other. Finally,
Blough provided estimates of the lower and upper asymptotes of the obtained
psychometric functions. These different error sources are analogous to those provided
by Heinemann et al (1969) with their attention-corrected ogive fits. In a series of
experiments, Blough (1996) showed that some manipulations, such as sample
duration and the length of a retention interval, produced independent effects on the
parameters of the psychometric function.
More recently, Nevin, Davison, and Shahan (2005) provided an account of
attending in conditional discriminations partly informed by the observing response
literature. Their model is an extension of a previous model of signal detection and
conditional discrimination (Alsop & Davison, 1991; Davison & Nevin, 1999),
71
furthermore, the model is more general than previous attempts in that it can provide
estimates of attending in the absence of obtaining a complete psychometric function.
The model provided by Alsop and Davison (the DNA model) is presented in Figure
4.1. This model of detection and conditional discrimination performance assumes that
reinforcers delivered for correct responses (corresponding to cells 11 and 22)
generalize to the other cells via the psychometric distances between the responses and
stimuli present in the task. The parameters used to estimate psychometric distances
are dr and ds, the distance between the responses, as defined by the comparison
stimuli or locations, and sample stimuli, respectively. It is important to note that these
parameters are assumed to represent the physical differences among stimuli and the
sensory capacities of the organism under study.
Nevin, Davison, and Shahan (2005) showed that with the addition of
parameters representing the probability of attending to the sample and comparison
stimuli, the model could account for previous data sets that the DNA model, which
assumed perfect attending, could not. Nevin, Davison, & Shahan (2005) provided
equations derived from behavioral momentum theory (Grace & Nevin, 1997; Nevin
& Grace, 2000) which predict that the probability of attending is related to the rates of
reinforcement correlated with the sample and comparison stimuli relative to the
background reinforcer rate in the experimental context. In essence, the equations
predict that higher rates of reinforcement will produce a negatively accelerated
increase in rates of attending (Shahan, 2002), analogous to free-operant response rates
(Catania & Reynolds, 1968; Herrnstein, 1970). Although precise prediction requires
the use of the attending equations (i.e., Eq. 1.8 & 1.9), an illustration of the role of
72
attending in the model does not require the equations, therefore, those equations will
not be repeated here. The model assumes that the subject attends to the sample and
the comparison stimuli with probability p(As) and p(Ac) on each trial. This process
may be represented by a Markov chain as in Nevin, Davison, and Shahan’s (2005)
Figure 4 (presented here in Fig. 4.2). The Markov chain consists of four states
corresponding to complete attention (State 1) or inattention (State 4) to the samples
and comparisons, attention to the samples, but not the comparisons (State 2), and
inattention to the samples, but attention to the comparisons (State 3). If the subject
attends to the sample stimulus and the comparisons on a given trial (i.e., p(As) =
p(Ac) = 1), then behavior is assumed to be governed by the equations presented in
State 1 of Figure 4.2 (i.e., the DNA model). If the subject attends to the sample
stimuli, but does not attend to the comparisons, then behavior is governed by the
equations for State 2 in Figure 4.2. States 3 and 4 correspond to trials in which the
subject does not attend to the sample and either attends (State 3) or does not attend
(State 4) to the comparisons. Note that only in States 1 and 3, do the parameters
estimating psychometric distances contribute to predicting differential responding to
the comparisons. States 2 and 4 both predict that the subject responds with equal
probability to either comparison. Nevin, Davison, & Shahan (2005) showed that by
assuming that subjects do not attend to the samples on every trial (p(As) < 1.0; p(Ac)
= 1.0) their model was able to account for findings that were discrepant with the DNA
model. Therefore, their analysis suggests that in many conditional discrimination and
signal detection procedures without a retention interval, behavior is governed by
States 1 and 3 of the model as illustrated in Figure 4.2.
73
As mentioned above, Nevin, Davison, and Shahan’s (2005) account of
attending is predicated on the functional similarity between attending in conditional
discrimination procedures and behavior in observing response procedures. Research
with observing response procedures (Wyckoff, 1952, 1969; Fantino, 1977) has been
the empirical basis for behavior analytic accounts of attending. An extensive
empirical literature (Dinsmoor, 1983) has shown that observing responses are
acquired (Dinsmoor, Mueller, Martin, & Bowe, 1982; Dinsmoor et al., 1983) and
maintained (Dinsmoor, Brown, & Lawrence, 1972) by the conditioned reinforcing
value of stimuli (SD) correlated with primary reinforcement. Therefore, the account of
Nevin et al. suggests that the probability of a subject observing the sample and
comparison stimuli in a conditional discrimination is determined by the conditioned
reinforcing value (Fantino, 1969; Herrnstein, 1964, Grace, 1994; Mazur, 2001) of
those stimuli. That is, the extent to which differences among the sample stimuli and
comparison stimuli actually exert discriminative control over behavior exists on a
continuum ranging from no control to that determined by maximal conditioned
reinforcing value, limited by psychophysical differences among the stimuli.
The present research provides a systematic replication and extension of the
work of Heinemann and Avin (1973). Rather than provide a single acquisition curve
for each subject, however, the present work seeks to provide within subject
replications by employing a successive reversal or repeated acquisition design
(Boren, 1969; Thompson, 1970; 1971). Specifically, subjects will learn a temporal
classification task in which stimuli from the short duration class is correctly identified
by one of two responses (for example, a right response) and stimuli from the long
74
duration class are correctly identified by the other response alternative (for example, a
left response). Following a fixed number of experimental sessions, the relation
between the short and long stimulus classes and the correct comparison response
location is reversed. Furthermore, the present experiment sought to characterize
repeated acquisition under conditions in which each correct response is reinforced
with both equal and unequal probabilities.
The present experiment also provides a test of the predictions of Nevin et al.’s
model of attending and perhaps may shed some light on the role of conditioned
reinforcement in conditional discriminations. As discussed above, it is clear that the
acquisition of a conditional discrimination may be understood as the gradual increase
in control by the relevant stimulus dimension correlated with reinforcement
(Heinemann & Avin, 1973). The approach of Nevin et al. provides two possible
sources of control over the subjects’ discrimination performance; attending to the
sample and the comparison stimuli, respectively. Assuming that these processes can
be dissociated, the repeated acquisition of a conditional discrimination may be
inferred to result predominately from changes in the probability of attending to either
the sample stimuli or the comparison stimuli as training progresses.
Research on the acquisition of preference in the concurrent-chains procedure
has shown that evidence of control by primary reinforcement occurs before any
preference is observed (Grace, 2001; Grace & Nevin, 1999). That is, initial link
preference for the shorter terminal link delay, which is assumed to be mediated by the
value of the terminal link stimuli as conditioned reinforcers, develops once subjects
have already learned the delays to primary reinforcement in the respective terminal
75
links. If conditional discrimination performance is mediated by the value of the
sample and comparison stimuli, one might expect to see the development of
preference among comparisons in a conditional discrimination emerge before
evidence of conditional stimulus control by the samples, analogous to backward
chaining. Consequently, the goal of the present study is to assess the degree of
independence in the acquisition of attending to the sample and comparison stimuli by
manipulating the relative value of these stimuli by varying the relative probabilities of
reinforcement for correct comparison choices.
Hypotheses
1) Subjects will show rapid repeated acquisition of a temporal discrimination.
Furthermore, changing the location across repeated-acquisitions of the correct
response following each stimulus class will have no effect on the speed of
acquisition.
2) When the probabilities of reinforcement for correct responding are unequal,
biased responding will approach asymptotic levels at a rate higher than that of
discrimination accuracy.
3) The attending-augmented DNA model will portray the differences in the
speed of acquisition between bias and discrimination as a difference in the
probabilities of attending to the sample and comparison stimuli, respectively.
Specifically, attending to the comparison stimuli will increase at a rate higher
than that of attending to the sample stimuli.
76
METHOD
Subjects
The subjects were five male Long Evans Hooded rats (J105, J106, J107, J08,
and J109). All subjects were experimentally naïve at the beginning of the experiment.
Food deprivation was held constant for each subject by post-session feeding (15g).
The rats were housed individually and had free access to water when in their home
cages in a vivarium with a 12:12 hr light/dark cycle (lights on at 6:00 a.m.). Sessions
were conducted daily, at approximately the same time with few exceptions.
Experimental sessions were conducted during the rats’ light period.
Apparatus
Same as the first chamber described in Experiment 1.
Procedure
Preliminary Training. Initially, left and right lever pressing was established via
autoshaping. Subsequently, subjects were exposed to a discrete trials procedure in
which the light above either the left or the right lever was lit and a response to the
appropriate lever ended the trial with a 3 second milk presentation. This training
phase lasted approximately five days or until each rat was reliably pressing each
lever. Next, each subject was exposed to a similar procedure although both lever
lights were illuminated on each trial and reinforcers were programmed for responses
to only one lever on each trial. Reinforcers were equally likely to be programmed for
each alternative, and once set up for a particular response, held until that reinforcer is
obtained. Thus, during this portion of training, subjects were exposed to a dependent
77
concurrent fixed-ratio (FR) 1, FR 1. This training procedure was conducted daily for
approximately twenty days for each subject.
Repeated Acquisition. After subjects were reliably responding on each lever,
switching between levers within a trial, and pressing each lever with near equal
frequency, they were placed on the initial temporal discrimination procedure. On each
trial the houselight was illuminated and sonalert were turned on for one of six
durations (2, 2.6, 3.48, 4.6, 6.1, or 8-s). Following the sample stimulus, both lever
lights were illuminated and responses to one lever were reinforced following sample
durations less than 4-s and responses to the other lever will be reinforced following
sample durations greater than 4-s. The mapping of stimulus class to the correct
response location was counter-balanced across subjects. The mapping between
stimulus class and correct response locations will be denoted by whether the short or
long classes of durations are correct following B1 (right) responses, thus (S)B1
signifies that right responses are correct following one of the short duration samples
and left (B2) responses are correct following one of the long duration samples.
Subjects J105, J107, and J109 were initially assigned to (S)B1, in which B1 responses
were deemed correct and reinforced following short durations and B2 responses
following long durations were deemed correct and reinforced. The mapping between
short and long stimuli and correct response locations was the opposite [(L)B1] for
subjects J106 and J108. All correct responses produced 3-s access to milk followed
by 2-s of blackout. Errors led directly to an intertrial interval (ITI) lasting 5-s during
which the chamber was dark. Each sample stimulus duration was presented 42 times
per session, resulting in 252 trials total per session. After 20 sessions of training, the
78
sample-stimulus correct-response mappings were reversed for each subject. The first
reversal was carried out for 20 experimental sessions.
Once each subject had been exposed to a complete reversal (i.e., both levers
being correct following short (or long) durations for 20 sessions), the scheduling
arrangement for correct responses was changed to a dependent schedule (Stubbs &
Pliskoff, 1969). Thus, reinforcers were scheduled for each correct response with equal
probability and once a reinforcer was assigned to a particular correct response, no
other reinforcers could be obtained until that particular correct response was made.
Two subjects J105 and J106 required several more sessions than the others to
learn the initial discriminations. These subjects also demonstrated took considerably
longer to relearn the discriminations after reversals. Subsequently these subjects were
trained using a procedure in which all correct responses resulted in feedback (brief-
paired stimulus presentations). After multiple reversals with a correction procedure
these subjects fell behind the others considerably and their data will not be reported.
Prior to being exposed to experimental conditions, the remaining subjects
were exposed to five reversals such that they experienced (S)B1 and (L)B1 twice.
Each reversal lasted at least 15 sessions, but where changed before behavior
completely stabilized.
Unequal reinforcer probabilities. The primary conditions of the experiment consisted
of exposing subjects to a series of discrimination reversals ((S)B1 & (L)B1) in which
reinforcer probabilities are equal in some conditions (p(RL) = 0.5) or favor the left or
right response alternative (p(RL)) = 0.8 or p(RL)) = 0.2) in other conditions. Each
condition lasted 15 sessions. The sequence of experimental conditions, sample-to-
79
comparison mapping, and reinforcer probabilities for each subject are displayed in
Table 4.1. Note that conditions in which correct responses were reinforced with equal
probability intervened between each condition of unequal reinforcer probabilities.
These equal reinforcer probability conditions served as an effective baseline in
attempt to reestablish unbiased discriminative performance. According to this design,
unequal reinforcer probability conditions occur with the sample stimulus-class,
correct-response location mapping for each subject, but differ between subjects (see
in Table 4.1). Note that for J108 the same unequal reinforcer probabilities were ran
due to an experimenter error.
RESULTS
Repeated Acquisition Performance: Equal reinforcer probability conditions
Each subject experienced ten total discrimination reversals; therefore the two
response alternatives were correct following short and long stimulus durations on five
separate exposures. Figure 4.3 shows percent correct plotted as a function of session,
averaged across the last three exposures to a particular type of reversal. The figure
shows that discrimination accuracy increased across sessions for each subject and that
whether B1 responses were correct following either short or long stimulus durations
had little effect on the rate of relearning the discrimination or the asymptotic levels of
accuracy achieved (supporting Hypothesis 1). Furthermore, each subject exhibited
strong carryover effects which manifest as a percent correct for a particular session
that falls below 0.5. For subject J107 there was some difference in learning rate
across the first three sessions of a reversal when B1 was correct following short
stimulus durations (especially for sessions 2-3) however, this difference disappeared
80
by session five and asymptotic accuracies were similar. For subject J109 there
appears to be a difference in the abruptness with which performance reached
asymptote. That is, discrimination was similar across the first three sessions for (S)B1
and (L)B1, but during (L)B1 correct responding abruptly reached asymptotic levels at
session five.
Although percent correct provides an overall measure of discrimination
performance, this measure does not give an indication of the acquisition of stimulus
control following any particular sample stimulus duration. Figures 4.4-6 show
psychometric functions obtained for each subject, which plot the relative frequency of
responses to the correct response location following long stimulus durations as a
function of stimulus duration. The data in Figures 4.4-6 come from the same
preliminary training sessions as used to construct the percent correct functions
portrayed in Figure 4.3. The psychometric functions in Figures 4.4-6 have been
grouped by successive blocks of three sessions and have been plotted separately for
(S)B1 (top) and (L)B2 (bottom).
Although Figures 4.4-6 give the impression that the psychometric functions
were flat at the beginning of a reversal, in fact during the first session (and sometimes
subsequent sessions, see Fig. 4.3) each rats’ performance exhibited strong carryover
effects. The upper plot [(S)B1] for J107 in Figure 4.4 provides evidence of this effect,
where responding following a stimulus is in accordance with the previous relation
between stimulus duration and correct response location. Therefore, following a
reversal, subjects demonstrated a hysteresis effect followed by a fairly smooth rate of
learning. Overall, across training sessions the major effect on the psychometric
81
functions is an increase in the range of the function. Comparison of each subjects’
psychometric function along with the overall percent correct data presented in Figure
4.3 demonstrate that even at the shortest and longest durations, discrimination was not
errorless. The data from the training conditions, in which correct responses were
reinforced with equal probability, is therefore consistent with the acquisition data
reported by Heinemann and colleagues (Heinemann, Avin, Sullivan, & Chase, 1969;
Heinemann & Avin, 1973).
Unequal Reinforcer Probabilities
The major goal of the present study was to track changes in accuracy and
response bias (defined as preference for the response alternative with the higher
probability of reinforcement) and compare the onset of these performance measures
during the course of repeated acquisition. Therefore, beginning with the first session
of a reversal, a cumulative percent correct and percent bias measure was calculated
for each subject. These curves should converge on the condition-wide percent correct
and percent bias as more and more data are included in the calculation. Figures 4.7-
4.9 present the cumulative accuracy [Cumulative Correct/(Cumulative Correct +
Cumulative Error)] and bias [Cumulative BRich/(Cumulative BRich + Cumulative
BLean)] measures for each subject separately for each condition in which reinforcer
probabilities for correct responses were unequal (see Table 4.1). Each percent bias
plot has been constructed so that percent biased responding is for the alternative with
the higher reinforcer probability (i.e., location is ignored). Also, the percent bias
measure was normalized so that a bias of zero represents equal responding to each
alternative.
82
Figures 4.7-4.9 demonstrate that both discrimination and bias changed in
orderly ways as function of training and that these measures were quite consistent
within subjects. Discrimination accuracy increased at a high rate within the first three
experimental sessions (Mdn = 231 reinforcers) and approached asymptotic values
after approximately the fifth session. Bias also changed rapidly within the first few
sessions of a reversal. Visual inspection of the cumulative bias plots suggests that this
aspect of performance approached asymptotic levels faster than discrimination
accuracy.
To provide a quantitative summary and comparison of the discrimination and
bias measures for each subject a Weibull function was fit to each subjects’ data (see
Gallistel, Fairhurst, & Balsam, 2004). Applied to the cumulative percent correct and
bias data, the function is written:
)])/[(1(sLReAy −= (4.2)
where y equals the cumulative performance measure under consideration, R is the
cumulative number of reinforcers, and e is the base of natural logarithms. The
parameters A, L, and S are the asymptote, latency, and shape of the function. The
asymptote and latency parameters are straightforward, as they represent the
asymptotic performance level achieved and the number of reinforcers to half the
asymptotic value, respectively. The shape parameter is a measure of the abruptness of
onset normalized to latency and allows the Weibull to assume very different
functional forms. Small values of the shape parameter (S < 1.0) produce a function
that is monotonically increasing and resembles other functions used to model
acquisition data such as the exponential and hyperbolic. As the shape parameter
83
increases above 1.5, it becomes sigmoidal in shape; asymmetrically so for values less
than 2.0 and symmetrically for values of 4.0 and higher.
The best fitting Weibull functions for each subject and condition to the
cumulative accuracy and bias measures are also presented in Figures 4.7-4.9. The
Weibull functions were fit to each subjects’ data via nonlinear least squares
regression. Table 4.2 provides parameter estimates and measures of goodness of fit.
In general the Weibull function provided an adequate fit to the cumulative
performance measures with the exception of the data from J108 in two conditions
(conditions 2 & 4). Across subjects and conditions, the onset latency or number of
reinforcers to half asymptotic performance was smaller for cumulative bias in seven
of nine comparisons, the exceptions being J108 in the second and fourth conditions
(partially supporting Hypothesis 2). The shape parameter was greater for the
cumulative bias measure in all cases. A closer analysis of the data for J108 revealed
that this subject often showed bidirectional changes in bias. That is, this subject often
showed a bias towards the higher reinforcer frequency alternative in the first post-
reversal session, which dissipated only to appear again a few sessions later. Overall,
the analysis of the cumulative discrimination and bias data via fits of the Weibull
function demonstrates that the onset of bias appeared before discrimination in the
majority of cases and that the onset of bias appeared more abruptly.
Theoretical Analyses of Attending
The primary theoretical motivation of the current study has two parts: 1) to
provide a novel test of the attending-augmented DNA model (Nevin, Davison, &
Shahan, 2005) by fitting the model to acquisition data and 2) to examine the degree of
84
independence in the models’ attending parameters. As stated in the introduction,
research using the concurrent-chains procedure to study the acquisition of choice has
shown that control over behavior by primary reinforcement and over choice by
conditioned reinforcement can be dissociated (Grace, 2002). Specifically, this
research has shown that preference which is assumed to be mediated by conditioned
reinforcing value develops slower than that maintained by primary reinforcement.
The analog of this finding in the present procedure would presumably correspond to
observing biased responding to the comparison stimuli before discriminative control
by the sample stimuli. The present data are largely consistent with a dissociation
among bias and discrimination in signal detection performance. Therefore, the
attending version of the DNA model was fit to the obtained data in order to assess the
independence of its attending parameters.
The present procedure employed a 6-stimulus, 2-response detection procedure
and fitting the DNA model (Fig.4.1) requires 5 parameters measuring the
discriminabilities between each pair of sample stimuli (d12, d23, d34, d45, d56), a single
parameter measuring the discriminability between the two comparison responses (dr),
and an inherent bias term (c) measuring any preference towards a particular response
alternative that is independent of the biasing effects of the relative frequency of
reinforcement for correct responses. Furthermore, to fit the model to the data from
each session of the present experiment requires estimates of the probability of
attending to the sample p(As) and comparison stimuli p(Ac), respectively as a
function of training.
85
In their original proposal of the attending-augmented DNA model, Nevin,
Davison, and Shahan (2005) proposed equations from behavioral momentum theory
(Nevin & Grace, 2000) to describe the changes in attending to the sample and
comparison stimuli as a function of the rate of reinforcement correlated with these
stimuli. Preliminary analyses with these equations suggested that the obtained rate of
reinforcement did not vary substantially over the course of a condition. That is,
although accuracy decreased in the first few sessions of a condition and then rose to
high levels thereafter, the rate of reinforcement did not differ enough to produce the
large changes in attending probabilities needed to fit the present data. Therefore,
rather than using the momentum equations to produce changes in attending
parameters, two other candidate functions were employed and compared in their
ability to fit the data.
The first equation is the Weibull presented above as Equation 4.2 and its
parameters may be interpreted similarly. The second candidate function used to
model changes in attending was a simple linear-operator model which has been
exploited many times in the study of learning (e.g., Bush & Mosteller, 1955; Rescorla
& Wagner, 1972). The Weibull equation again contains three free parameters and
these parameters were adjusted such that the probability of attending increased as a
function of sessions. The linear-operator equation employed is
)()1( nasympnx AAA −=Δ + α (4.3)
where ΔAx(n+1) is the change in attending probability resulting from a single session of
training. The term Aasymp represents the asymptotic probability of attending, which
86
was set to 1.0 in the fits, and An representing the attending probability in the previous
session. The parameter α determines the rate of increase in attending probability.
Note that two separate equations are needed to model increases in the
probability of attending to the sample stimuli and comparison stimuli, respectively.
Therefore, the Weibull fits require 6 more parameters to be estimated, while the
linear-operator requires 2 extra parameters be estimated. The data used for the model
fits were the proportion of responses to the alternative deemed correct following a
long duration stimulus and were taken from each session from all conditions,
providing 270 data points per subject for the fits.
The fits of the DNA model using a Weibull and linear-operator function to
describe the increase in attending was carried out by nonlinear least squares
regression using the Solver tool in Microsoft© Excel. The parameter estimates and
goodness of fit measures for the fits are presented in Table 4.3. The table shows that
generally the fits were satisfactory, with small estimates of root mean squared error
(RMSE). Furthermore, little difference in the quality of fits was obtained when either
the Weibull or linear-operator equations were used to estimate the attending
probabilities. Because these models differed in the number of free-parameters k
employed, the Akaike (AIC) and Bayesian (BIC) information criteria were used to
assess quantitatively the tradeoff in goodness of fit and difference in free parameters
between the models (Burnham & Anderson, 2002; Pitt & Myung, 2003). The major
difference between these criteria is that the BIC penalizes a model more strictly for
more free parameters. For both indices, a smaller (more negative) value indicates the
model to be preferred. Although the differences between AIC and BIC values were
87
small, each gave a smaller value for the attending model employing the Weibull
function. Therefore, further results presented will focus on this model.
Figure 4.10 provides the estimated changes in attending to the sample and
comparison stimuli through the course of training plotted as a function of sessions
since transition as estimated by the Weibull function. Across subjects, the attending
parameters varied considerably. According to the attending model parameters, the
probability of attending to the comparison stimuli increased at high rate for subjects
J107 and J108, however the opposite effect occurred for subject J109. For all
subjects, the probability of attending to the sample stimuli increased either gradually
(J107 and J108) or abruptly (J109) with training (partially supporting Hypothesis 3).
Attending to the sample stimuli corresponds to States 1 and 2 of Figure 4.2, however
only in State 1 can the sample stimuli exert discriminative control over responding.
Because the probability of entering State 1 is given by the product of p(As) and p(Ac)
these values must both increase in order for discrimination performance to improve
with training. To the extent that p(Ac) is greater than p(As),behavior is governed by
State 3 of Figure 4.2 in which behavior is solely controlled by differential
reinforcement to the extent that the response alternatives are discriminable from one
another. For subject J107, the change in attending probabilities given by the model
accounts for the early onset of bias before accurate discriminative control reappears
(supporting Hypothesis 3). For subject J108, the probability of attending to the
comparisons rises quickly, but then is overtaken by attending to the samples
(disconfirming Hypothesis 3). Therefore, the model describes the brief appearance of
bias in the first few sessions of a reversal, as well as the slightly poorer discrimination
88
for this subject. The probability of attending to the samples appears maximally within
the first reversal session for subject J109 (disconfirming Hypothesis 3). The
probability of attending to the comparisons then increases monotonically across
sessions. These parameter values imply that for J109, States 1 and 2 governed this
subject’s performance, which gives a mixture of random responding to the
comparisons, and behavior controlled jointly by both sample and comparison stimuli,
respectively. The fact that bias appeared before discrimination accuracy for J109,
much like that of subject J107, yet the attending parameters differed greatly between
these subjects might be accounted for by the much greater values of contingency
discriminability dr obtained for J109 (Table 4.3) which means that reinforcer
differences had a greater impact on this subject’s performance.
DISCUSSION
The present experiment employed a successive – or repeated-acquisition
procedure in which the relationship between classes of short and long sample stimuli
and their respective correct comparison location were changed every few sessions.
After subjects had experienced several reversals, the probabilities of reinforcement
for correct responses following each stimulus class were manipulated. The
simultaneous discrimination reversal and reinforcer probability manipulations
provided the opportunity to observe the acquisition of both discrimination and bias
within individual subjects. The purpose of the experiment was to track changes in
both discrimination and bias over the course of acquisition in order to compare the
rate of acquisition among these two measures. The secondary goal of the present
study was to provide a novel test of a behavioral model of signal detection
89
performance that includes separate theoretical terms representing the probabilities of
attending to sample and comparison stimuli, respectively (Nevin, Davison, & Shahan,
2005). Specifically the theoretical goal of the present study was to apply a steady-
state performance model to acquisition data. Therefore, it was asked if discrimination
and bias can be dissociated during the course of acquisition, then could the model
provide independent changes in parameters representing attending to sample and
comparison stimuli.
The results from training conditions in which the probabilities of
reinforcement for correct responses were equal provided a systematic replication
previous of a report by Heinemann and Avin (1973). The present study however,
provided within subject replications using a repeated reversal design. The
psychometric functions presented in Figures 4.4-4.6 are consistent with Heinemann
and Avin’s finding that the primary effect of continued training is on the range of the
psychometric functions. Heinemann and Avin (1973) also showed that both the
midpoint (PSE) and slope of psychometric functions changed throughout the course
of acquisition. Although the same quantitative analyses were not performed in this
study, the present data are consistent with Heinemann and Avin’s contention that the
principal effects of continued training are to increase attention to the relevant stimulus
dimension.
Over the primary conditions of the experiment, the relation between stimulus
class and correct response location were reversed every fifteen sessions. Every other
condition also introduced a biasing manipulation in which the relative frequency of
reinforcement for correct responses was unequal. These two manipulations allowed
90
for the simultaneous assessment of the acquisition of discrimination and bias. The key
dependent variables were the cumulative percent of responses correct and the
cumulative percent of responses to the alternative with the higher probability of
reinforcement. To provide a quantitative assessment of acquisition, a Weibull
function including estimates of asymptotic performance, latency to half-asymptote,
and the abruptness of the onset were fit to each subjects’ acquisition curves. The
Weibull analyses (Table 4.2) showed that the onset of bias occurred before
discrimination as measured by latency in seven of nine cases and that the onset of
bias was more abrupt on all nine occasions. These data are the first, to my knowledge,
to demonstrate a dissociation between discrimination and bias during acquisition in a
signal detection procedure.
Nevin, Davison, and Shahan (2005) provided an extension of an earlier model
of signal detection performance (see Davison & Nevin, 1999) which includes a role
for attending based on the rate of reinforcement correlated with sample and
comparison stimuli. This model was fit to the acquisition data of the present
experiment. Fitting the model to the present data required modification of the
originally proposed equations that modulate the probabilities of attending. Nevin et
al. suggested that attending in conditional discrimination procedures increased with
the rate of reinforcement correlated with sample and comparison stimuli according to
equations derived from behavioral momentum theory (Nevin, 1992; Nevin, Mandell,
& Atak, 1983; Nevin & Grace, 2000). The discrimination reversals produced only
small changes in the obtained rate of reinforcement in the present experiment.
Therefore, two other candidate functions were used to model the changes in attending
91
probabilities as training within a condition progressed. A comparison of both
candidate functions showed that the increase in attending probabilities by a three-
parameter Weibull function provided a better account of the present data than did a
one parameter linear-operator equation.
The overall performance of the attending-augmented version of the DNA
model were good considering the model was developed for steady-state application
and the present data are the first attempt to apply the model to acquisition data. The
parameters measuring the discriminability among sample stimuli and comparison
stimuli were largely consistent with results from Experiments 1-2. The major
discrepancy between the data and model predictions arose from the first few sessions
after a transition (not shown). This is because the DNA model with attending
probabilities set at zero produce flat psychometric functions; whereas the data from
the first post-reversal sessions resembled an inverse S-shaped functions. The model
might be adapted to account for these carryover effects, but this would require the
addition of further parameters. It is not exactly clear how best to incorporate
carryover in the present procedure, so no attempt will be made here.
It should be noted that while the attending version of the DNA model applied
to the present experiment contains several free parameters (13 were required in the
Weibull function fits), other models would require a similar number if not many more
parameters. An attempt to model the present data using, for example, a four-
parameter cumulative normal function would require several times the number of
parameters used here. Although not reported, the analysis reported by Heinemann and
Avin (1973) using a cumulative normal function with lower and upper asymptotes,
92
likely employed forty free-parameters per subject. Perhaps a simplification of
Heinemann and Avin’s analysis could be achieved by holding some parameters
constant, but it is unclear which should be held constant and such an attempt was not
made here. Furthermore, the DNA model provided an account of the present data
with parameters representing the discriminability among sample stimuli and
comparison stimuli, respectively that remained fixed across conditions and training
sessions and is therefore a more parsimonious treatment.
Finally, the constancy of stimulus and contingency discriminability
parameters across the course of acquisition has several implications for discrimination
learning. The attending-augmented DNA model implies that the discriminability
among sample stimuli and comparison stimuli do not change across reversals.
According to the model, discriminability terms are psychometric distances which are
long-term structural features of the environment and the sensory capacities of the
specific species and individual organism under study. What changes across training,
according to this model, is the probability with which subjects attend or engage in
observing behavior directed towards the sample and comparison stimuli. In turn the
probability of observing the relevant stimuli is a function of their correlation with
primary reinforcement, the conditioned reinforcing value of these stimuli. In the
present study, reinforcer rates were not directly manipulated, however the correlation
between a class of sample stimuli and the correct comparison location were reversed
every few sessions. Thus, the correlation between a particular sample stimulus and its
correct comparison was disrupted. The attempt to model the changes in attending
probabilities as a function of training directly parallels that of associative learning
93
models that describe the acquisition of a conditioned response (e.g., Rescorla &
Wagner, 1972; for recent reviews see Pearce & Bouton, 2001; Wasserman & Miller,
1997). Therefore, the present analyses suggest that the learning process in signal
detection may be primarily due to contingency variables and future research on
discrimination learning should be directed towards an analysis of these processes.
94
CHAPTER 5
GENERAL DISCUSSION
The research reported in this dissertation was conducted with two
general aims: 1) to develop a dynamic research methodology that allows for a
characterization of learning in signal detection procedures, and 2) to apply static
models of detection performance to performance in transition and therefore provide a
test of some of the assumptions of these models. Such a research methodology would
allow for the dynamic characterization of the key performance measures in a signal
detection procedure: discrimination and bias. In turn, a dynamic characterization of
discrimination and bias would presumably shed light on whether these measures are
truly independent as well as the basic learning mechanisms that produce these
asymptotic performance measures. Chapters 2 and 3 reported experiments examining
the extent of within-session changes in response bias in both simple and complex
signal detection tasks when the consequences for correct responses changed randomly
from session to session. Chapter 4 reported an attempt to study learning of
discrimination and response bias simultaneously by employing a successive reversal
design in which the correct response location following a stimulus class was changed
every few sessions.
The experiment reported in Chapter 1 was the first attempt to apply a method
of frequently varying the relative frequency of reinforcement among concurrently
available response alternatives to a signal detection task. Specifically, Experiment 1
employed a pseudorandom binary sequence where the probability of reinforcement
95
for correct responses can change between two reciprocal values (3:1 and 1:3) each
session. Across two conditions, the difference between sample stimulus durations was
manipulated such that in one condition the discrimination was more difficult than in
the other. The DNA model of detection (Alsop & Davison, 1991; Davison & Nevin,
1999) was extended to incorporate the possible effects of previous sessions’
reinforcer frequency ratios and thus quantify any carryover effects of response bias.
The two major findings of Experiment 1 were that at the session-aggregate level,
response bias was largely unaffected by previous sessions’ reinforcer ratios (Fig. 2.4)
and that the degree of adaptation to the current session reinforcer ratio differed across
conditions (i.e., discrimination difficulty). In the condition were discrimination was
most accurate, response bias increased monotonically within experimental sessions
(Fig. 2.5), which according to the model, was due a decrease in the effect of the
previous session’s reinforcer ratio and an increase in control by the current session
reinforcer rate ratio. In the condition were discrimination performance was less
accurate, session-aggregate response bias was also reduced. Within-session analyses
revealed little difference between the effects of previous and current session
reinforcer ratio (Fig. 2.6). The condition 2 data of Experiment 1 provide no indication
as to whether something about the within-session dynamics themselves or the
difference among sample stimuli contributed to the reduced response bias observed in
the second condition. It is unlikely that the within-session dynamics are the reason for
the difference as the data from the first condition of Experiment 1 and data from
Experiment 2 suggest an orderly within-session adjustment to current session
reinforcer ratios. It is possible that if subjects mediated the to-be-timed stimuli by
96
their own behavior, then contingency discriminability decreased as a result of
similarity of classes of mediating behavior. While this suggestion is plausible, as
behavioral mediation of temporal intervals is well established in the literature (Laties,
Weiss, & Weiss, 1969; Killeen & Fetterman, 1988; Richelle & Lejeune, 1980;
Staddon & Simmelhag, 1971), no systematic observations of behavior during sample
presentations were made in Experiment 1.
Experiment 2, reported in Chapter 3, provided a systematic replication of
Experiment 1. Rather than presenting different stimuli across experimental
conditions, however Experiment 2 employed an n-stimulus procedure in which five
different sample stimuli were presented in each session. Again, like Experiment 1,
the probability of reinforcement for correct responses varied from session-to-session
according to a pseudorandom sequence, however in some sessions of Experiment 2
the reinforcer probabilities were equal. The extension of the pseudorandom sequence
design to an n-stimulus procedure is important because it allows for simultaneous
assessment of response bias at a range of discrimination accuracies. Furthermore,
Experiment 2 provided a test of an n-stimulus model of detection proposed by
Davison (Davison, 1991; Davison & Nevin, 1999) which asserts that each reinforcer
delivery contingent on a particular correct response in such procedures affect all other
stimulus-response pairs to the extent that each are similar to one another. The major
results of Experiment 2 replicated the findings of Experiment 1 in that, after sufficient
exposure to the pseudorandom sequence, aggregate performance in a given
experimental session was predominately under control of the current session’s
reinforcer ratio (Fig. 3.3). Analyses of within-session performance showed an
97
approximately monotonic decrease in control by the previous session’s reinforcer
ratio along with an increase in control by the current session reinforcer ratio (Fig.
3.4). Further analyses, at a trial-by-trial level, showed that response bias appeared
very early in a session, often within a few presentations of a given sample stimulus
(Figs. 3.6-8). The ability of an extended form of Davison’s n-stimulus detection
model to capture both session-aggregate and within-session changes in control by
previous and current reinforcer ratios, in addition to the rapid changes in bias
following each sample stimulus, suggest that assumptions of the model may be
profitably extended to dynamic performance.
Finally, in Chapter 4, an experiment was reported in which the development
of both discrimination and bias were examined simultaneously. Experiment 3
employed a 6-stimulus classification task in which one response was correct
following the three shorter stimulus durations and another response was correct
following the three longer durations. The correct response location following each
stimulus class was switched across successive blocks of sessions. In the major
conditions of the experiment, the reversal between stimulus class and correct response
location continued, however every other reversal included unequal reinforcer
probabilities for correct responding following the two stimulus classes. Therefore,
these experimental conditions allowed for a simultaneous assessment of the speed of
acquisition of discrimination and bias simultaneously. Although asymptotic levels of
discrimination and bias differed, the time to half-asymptotic levels was shorter for
bias on seven of nine occasions. Analyses of the development of performance by an
attending-augmented version of the Davison-Nevin-Alsop model of detection were
98
performed. This model includes separate roles for the sample and comparison stimuli
in determination of detection performance. The test of this model involved assessing
whether the attending parameters of the model took on consistent values across
subjects in order to predict the faster onset of bias that was observed. Although the
model gave an accurate quantitative description of the development of discrimination
and response bias, the model’s attending parameters differed widely across subjects.
Therefore, the data from Experiment 3 showed a clear dissociation of discrimination
and bias during acquisition, however theoretical analyses based on the attending-
augmented DNA model did not reveal a common mechanism that might be
hypothesized to bring about the observed performance dynamics.
There were a few notable differences between the findings of Experiments 1
and 2. Both session aggregate estimates of lag 0 dr and within-session control by the
current session reinforcer ratio were highest in the easier discrimination condition of
Experiment 1 and lowest in the more difficult discrimination condition. The estimates
of control by current session reinforcer ratios were intermediate in Experiment 2
relative to that observed in the two conditions of Experiment 1; also a small effect of
the previous sessions’ reinforcer ratio was evident throughout most of the session. It
remains puzzling that in Experiment 1, contingency discriminability was lower when
the S1-S2 difference was small, however, in Experiment 2 the same stimuli were all
presented within session yet a constant value of dr provided an adequate description
of the effects of the reinforcer frequency ratio. Godfrey and Davison (1999) showed
that the DNA model provided consistent estimates of both ds and dr when different
sample and comparison stimuli were added and removed from a set of up to five
99
sample and comparison stimuli. Of course, comparing estimates of contingency
discriminability across Experiments 1 and 2 of the present study is difficult as
different subjects were used in each and exposure to the PRBS was much shorter in
Experiment 1.
Perhaps the most consistent finding across each experiment reported was the
speed of changes in bias. In Experiments 1 and 2, where reinforcer ratios changed
each session, rapid changes in bias were expected (Schofield & Davison, 1997). The
observed changes in bias in Experiment 3 were however, at least as fast when taking
into account the speed of environmental change in that experiment. A review of
recent studies investigating choice behavior in transition suggests that the speed of
behavior change is partly dependent on the frequency of environmental change. These
studies have varied the reinforcer ratio either within each session (Davison & Baum,
2000), between sessions (Hunter & Davison, 1985), or across several sessions
(Mazur, 1997) and the speed of behavioral adaptation is faster when change is more
frequent. Therefore, it would seem likely that response bias should have been much
slower to develop in Experiment 3. This was not the case. Across subjects, the
number of reinforcers to 50% of eventual asymptotic response bias was 120
reinforcers, which corresponds to the second post-reversal session. Thus, even when
reinforcer contingencies changed at a much slower rate in Experiment 3, bias still
adapted very quickly. While the broader implications of the speed of changes in bias
will require further research, these findings may prove to be consistent with a single-
process learning view where sensory processes are secondary to a locally driven,
reinforcement-dependent behavioral mechanism.
100
Finally, the most notable differences among the present experiments is that
stimulus variables were held constant in Experiments 1 and 2, while the
discriminative function of the stimulus classes and biasing variables were both
manipulated in Experiment 3. Therefore, Experiments 1 and 2 only investigated
acquisition of bias with stimulus conditions held constant and Experiment 3
investigated acquisition of discrimination and bias. Future research may employ
designs like that of Experiments 1 and 2 in order to compare acquisition of bias under
manipulations other than reinforcer frequency. Designs like that of Experiment 3,
however are indispensable when investigating the concurrent development of
discrimination and bias, and thus the independence of learning mechanisms
responsible for both performance measures.
Assessment of Dynamic Methodology
Overall, the methodology employed in the experiments reported here was
successful in that the transition data were orderly and aggregate data replicated
previous findings. Therefore, the methods employed here may prove to be viable
alternatives to traditional steady-state experimental designs employed in the
experimental analysis of behavior (Sidman, 1960). The use of more dynamic
experimental designs allow for the manipulation of several independent variables in a
substantially shorter time frame. Furthermore, such designs are excellent for rats,
which are short-lived, or people, who have limited time to participate in experiments.
Rats also provide a mammalian model, which may be useful for investigating the
biological bases of learning. Moreover, the use of dynamic designs which produce
101
rapid adjustment to experimental contingencies provide numerous possibilities for the
investigation of behavior in transition.
The ability to conduct large parametric studies within a reasonable time frame
is of increasing importance. Researchers in the area of signal detection, like those
investigating simple choice in other paradigms, are typically interested in
understanding the effects of several variables on performance simultaneously (i.e.,
Elliffe, Landon, & Davison 2008). Therefore, it may be reasonable to ask how many
variables may be manipulated in a random fashion across experimental sessions (i.e.,
pseudorandom sequence designs) while being able to maintain experimental control.
A recent study reported by Kyonka and Grace (2008) manipulated two (Experiment
1) and three (Experiment 2) dimensions of reinforcement according to independent
pseudorandom sequences in the context of a concurrent-chains procedure. They found
that control by each reinforcer dimension developed within each session and that both
session aggregate and local measure of performance supported the assertion of molar
models that each reinforcer dimension has an independent effect on behavior.
The report of independent effects by different dimensions of reinforcement by
Kyonka and Grace (2008) is an important one as quantitative analyses become more
pervasive (Mazur, 2006). Schofield and Davison (1997) argued that the PRBS
methodology may be a profitable way of measuring sensitivity to reinforcement. Thus
designs like the PRBS are critically important for future advances where model
parameters become fundamental dependent measures. Therefore, it seems that rapid
estimation of higher-order dependent measures is of special importance in the area of
signal detection research. Experiment 3 suggests that the usual model parameters that
102
have been estimated in detection experiments may not even be the most critical
determinants of performance. That is to say, measures such as stimulus and
contingency discriminability may be best conceptualized as long-term structural
features of the task and subject. Whereas performance variables, such as the
conditioned reinforcing value of the sample and comparison stimuli, may ultimately
determine the level of discrimination or bias observed with stimulus differences held
constant.
Implications for Theory
The central theoretical goal of the present experiments was to extend current
theory to detection performance in transition. This was done by extending previous
quantitative models of signal detection performance to the present studies in which
both stimulus and reinforcer variables were manipulated over much shorter time
scales than that of experiments typically reported in the literature. In other words,
most prominent models of detection performance have been formulated to describe
stable performance; however the present research sought to extend these models to
detection performance in transition. As discussed in Chapter 1, a model proposed by
Davison, Nevin, and Alsop (Alsop & Davison, 1991; Davison & Nevin, 1999) is
currently the most prominent model of detection and conditional discrimination
performance in the non-human literature. Although some failures of this model have
been noted (Jones, 2003), and modifications have been proposed (Nevin, Davison, &
Shahan, 2005), the model is more broadly applicable and its assumptions are more
easily testable than its generalized matching-based predecessor(s) (Davison, 1991;
Davison & Jenkins, 1985; Davison & Jones, 1998; Jones & Davison, 1998). The
103
success of extending this theory was evaluated both in the ability of the model to fit
transition data and by the extent to which the assumptions of the model were upheld.
Furthermore, applying the most widely utilized model in the literature to detection
performance in transition should prove advantageous in pointing out gaps in current
understanding.
Beginning with Experiment 1, reported in Chapter 2, the DNA model of
detection performance was extended to incorporate the effects of previous sessions’
reinforcer ratios on current session performance. This was done by assuming that the
effect of current and previous sessions’ effective reinforcer ratios combined
additively to produce current session levels of bias. Because within an experimental
condition the difference among sample stimuli were held constant, the parameter
measuring stimulus discriminability ds were held constant across sessions. The
influence of current and previous effective reinforcer ratios on response bias in the
current session was modeled by allowing for individual contingency discriminability
parameters (dr) in determining each session’s effective reinforcer ratio. With stimulus
discriminability held constant, an increase in contingency discriminability results in a
negatively accelerated increase in response bias for the higher reinforcer frequency
alternative.
The extension of the DNA model to both session aggregate (Fig. 2.4) and
within session (Fig. 2.5-6) changes in bias provided an accurate description of the
data from both conditions of Experiment 1. Furthermore, the degree of control by
current and previous sessions’ reinforcer ratios was similar to that reported in
research were the PRBS method has been used to study preference in concurrent and
104
concurrent-chained schedules and similar analyses were performed (Davison &
McCarthy, 1988; Grace, Bragason, & McLean, 2003; Kyonka & Grace, 2008;
Schofield & Davison, 1997).
Perhaps the most notable result of Experiment 1 was that estimates of
contingency discriminability decreased across conditions when the difference among
sample stimuli was manipulated. Thus, as the sample stimuli were made more similar,
the parameter measuring the difference among comparison stimulus locations
changed. A reanalysis of an experiment reported by McCarthy and Davison (1980)
suggests that the observed parameter covariation was not due to the use of the
pseudorandom sequence procedure. While other studies have reported parameter
covariation (Nevin, Cate, & Alsop, 1993), it may be possible that this finding is due
to the use of temporal stimuli (Ward, 2008). The DNA model has only been applied
to a few detection studies employing temporal stimuli, but to my knowledge each has
found some parameter covariation. Therefore, further analyses of temporal
discrimination performance by the DNA model are warranted before a definitive
conclusion can be offered. This is not to suggest that temporal stimuli are necessarily
unique, the majority of research suggests that the psychophysics of time are similar to
other stimulus dimensions (Gibbon, 1977; Killeen & Weiss, 1987). It may be,
however that the unequal delays to reinforcement that are inherent in temporal
discrimination procedures pose difficulties for the contemporary models as it is
uncertain how to relate the value and discriminability of reinforcers (Alsop & Porritt,
2006; Davison & Nevin, 1999; Nevin, Davison, Odum, & Shahan, 2007).
105
The experiment reported in Chapter 3 provided another opportunity to
evaluate an extension of the DNA model to account for possible carry-over effects.
The extension of the model to Experiment 2 provided a more challenging assessment
because the study employed an n-stimulus procedure. Application of the DNA model
to an n-stimulus procedure allows for a more thorough evaluation of the way in which
the model conceptualizes the spread of effect of reinforcement between sample
stimuli and comparison responses. The DNA model was applied to the data of
Experiment 2 as above with the following modification: four ds parameters were used
to estimate discriminabilities between each pair of stimuli. As in Experiment 1,
separate contingency discriminability parameters were used to assess the effects of
past and present effective reinforcer ratios, and the stimulus discriminability
parameters used to estimate effective reinforcer ratios were constrained to be
constant. Again the extension of the DNA model including past effective reinforcer
ratios provided an accurate account of the data. Both session-aggregate and within-
session changes in bias were well accounted for. Additionally, the predicted changes
in control by the current and previous sessions’ reinforcer ratios provided an excellent
description of the psychometric functions obtained from the latter portion of
experimental sessions.
Although the analyses conducted in Experiments 1 and 2 and discussed above
provided a reasonable way of characterizing the rapid changes in bias observed in
those studies. It is important here to note that modeling the observed changes in bias
with different estimates of contingency discriminability is incoherent given the
particular theoretical interpretation offered here. Recall that contingency
106
discriminability (dr) is assumed to be a measure of the psychological distance
between comparison responses. In the present experiments dr is assumed to be a
function of the difference in the spatial locations of the levers. Therefore, as dr is
defined, suggesting that the discriminative impact of the distance between levers
changed within an experimental session or as a function of changes in the reinforcer
ratio makes little theoretical sense.
It is important to note that dr has been interpreted differently throughout the
development of the DNA model (Davison & Nevin, 1999; Nevin, Davison, Odum, &
Shahan, 2007; Nevin, Davison, & Shahan, 2005). The interpretation of dr assumed in
the present work is based on the model’s forbearers from the psychophysics literature
(Luce, 1959; Shepard, 1958a, 1958b) as different interpretations have been given
(Davison & Nevin, 1999). In their original presentations of the model, Alsop (1991)
and Davison (1991) suggested that dr was a measure of the discriminability among
response alternatives in standard detection (i.e., “yes-no”) procedures, which is
consistent with Shepard’s (1957) and Luce’s (1959) interpretations. When Davison
and Nevin (1999) extended the model to conditional discrimination procedures where
response location and comparison stimuli varied across trials, they suggested that dr
could also provide a measure of discriminability among comparison responses. They
assumed that response location and comparison stimulus disparity produce
functionally equivalent effects on behavior and, thus, that a single parameter (dr) was
sufficient. Jones (2003, personal communication, May 22, 2009) has argued that the
contingencies in matching-to-sample procedures are more complex than simple
detection and involve multidimensional comparison stimuli (see Alsop & Jones,
107
2008). It may be that previous modeling efforts have all allowed the effects of several
different independent variables all of which may contribute to contingency
discriminability to be absorbed by a single free parameter, dr (c.f., Davison & Baum,
2007; Jones & Davison, 1998; Nevin, Cate, & Alsop, 1993). Although these
theoretical objections were anticipated, the modeling reported seemed to be the most
reasonable means of communicating the effect of the experimental manipulations. In
addition, it may be argued that the ability of the DNA model to account for changes
in bias with changes in contingency discriminability with comparison stimulus
differences held constant suggests that the model may be too flexible. I will return to
the issue of model flexibility after discussing the attending version of the DNA
model.
The data presented in Experiment 3 were modeled by employing the DNA
detection model assuming that attending to the sample and comparison stimuli were
disrupted following each reversal of the discrimination. As discussed in Chapter 4,
the attending-augmented DNA model assumes that the probability of attending to
sample and comparison stimuli, respectively is a function of the rate of reinforcement
correlated by those stimuli (Nevin, Davison, & Shahan, 2005). Because the rate of
reinforcement was only indirectly affected by the discrimination reversal and the
range of variation in overall reinforcer rate was too small to produce the changes in
attending probabilities required to fit the data, other equations assuming increases in
attending probabilities with continued training were used to model the data.
Assuming probabilities of attending to the sample and comparison stimuli
increasing as a function of amount of training according to a sigmoidal acquisition
108
function provided an accurate description of the data. Therefore, the analyses reported
in Experiment 3 provide mixed support for the attending-augmented DNA model.
First, the analyses provide support for an attending model. Because subjects had
substantial experience with the procedure, employing various stimulus and
contingency parameters to model discrimination acquisition is theoretically
incoherent. What seems to change during the learning of a discrimination is the
behavioral impact or expression of the psychological distances among the sample and
comparison stimuli as learning progresses. Whether a learning-performance
distinction in signal detection performance is warranted awaits further research.
Second, the present research suggests that the probability of attending to the relevant
stimuli in a discrimination task, particularly during learning, is not only affected by
stable rates of reinforcement but to changes in the conditional relation between
discriminative stimuli and reinforcement. For this reason, formulations of attending
based on stable rates of reinforcement may be successfully applied to steady-state
performance; however other ways of defining the value of discriminative stimuli
(Wixted, 1989) are worth exploring to extend current theory to the learning processes.
Finally, I will comment briefly on the flexibility of the DNA model, in
particular with respect to the addition of attending parameters to the model. In their
initial presentation of the attending-augmented model, Nevin, Davison, and Shahan
(2005) discussed the degree to which changes in the attending parameters and
discriminability parameters produced similar effects in predicted discrimination
accuracy and response bias. Furthermore, they illustrated via simulated plots that
while the probability of attending to the sample p(As) and stimulus discriminability ds
109
produced distinguishable affects, variation in comparison attending p(Ac) and
contingency discriminability dr parameters did not lead to distinguishable predicted
functions. Thus, the similar abilities of the two parameters to produce similar
predictions was noted from the outset, however Nevin and colleagues suggested that
because attending to the comparisons and contingency discriminability are identified
with different experimental operations the effects of each parameter should be
empirically distinguishable. The present discussion suggest that at the very least,
future research should specifically address the role of comparison stimuli in detection
performance and perhaps the most proximal increases in understanding will come
from the resolution of this issue.
The Spread of Effect
The present research has several implications for other research domains as
well as direct application. To study signal detection performance in the laboratory
necessitates an analysis of several fundamental determinants of behavior. Thus, it
should not be surprising that basic laboratory research on detection performance can
be informative to both researchers and practitioners in a number of areas. Historically,
signal detection methods and analytic techniques have been applied to a number of
areas in decision making and diagnostics (Swets, 1988, 1992; Swets, Dawes, &
Monahan, 2000). While these areas of application remain important and the present
research can contribute, here I will instead outline some implications that specifically
relate to an improved understanding of detection and discrimination learning.
A historically important area of application of basic behavior analytic
principles has been in the domain of developmental disabilities. Laboratory research
110
on stimulus control has had a prominent role in the transfer of technology to applied
settings (Skinner, 1953; Stokes & Baer, 1977). More recently, a number of
investigators have become increasingly concerned with the basic processes involved
in discrimination learning (Dube & McIlvane, 2002; McIlvane & Dube, 2003;
McIlvane, Dube, & Callahan, 1999). With the hope that a more thorough
understanding of the role of attention in the acquisition of a discrimination may
provide caregivers with better tools for more effective instruction for individuals with
severe developmental disabilities (McIlvane, Dube, & Callahan, 1999). For example,
the concept of stimulus control shaping (Sidman & Stoddard, 1967), which directly
parallels response shaping, has been used to train individuals with developmental
disabilities to discriminate among different forms (i.e., an upright versus inverted T).
Thus, interventions that increase the conditioned value of stimuli should increase
attending to them, which in turn ought to facilitate learning about stimulus function.
As with the direct application to teaching methods, another important
contribution of the present work may be a more comprehensive understanding of the
necessary conditions to establish more effective consequences and more persistent
socially-appropriate behavior for individuals with developmental disabilities (Dube &
McIlvane, 2002; Dube, McIlvane, Mazzitelli, & McNamara, 2003; Mace, Mauro,
Boyajian, & Eckert, 1997). While the generalized matching law has proven to be of
substantial applied importance (McDowell, 1981, 1982; Pierce & Epling, 1995), basic
laboratory research had begun to question its conceptual value (cf. Davison &
Jenkins, 1985; Krägeloh, Elliffe, & Davison, 2006). Therefore, considerations based
on the contingency discriminability model would lead practitioners to different
111
conclusions about the insensitivity to concurrent sources of reinforcement in
populations with developmental disabilities and therefore lead to other intervention
strategies (McIlvane & Dube, 2003). For example, the contingency discriminability
model may suggest where the disparity between the intervention and the actual
environmental contingencies exist. To the extent that discriminative stimuli are
improperly arranged for the individual, the developmental disabled individual’s
perception of what behavior effectively produces reinforcement may differ from that
of the practitioner.
The present research also has numerous applications in several areas of
neuroscience. A rapidly growing subfield of neuroscience called neuroeconomics
(Glimcher, 2002; 2003; Glimcher & Rustichini, 2004), has employed both similar
procedures and analyses as those employed in the present research (Gold & Shadlen,
2007; Sugrue, Corrado, & Newsome, 2004). As suggested by the name, the goal of
neuroeconomics is to provide converging principles and experimental techniques
toward the goal of understanding choice and decision making at both behavioral and
neural levels. A number of researchers have utilized complex choice procedures and
single cell recordings of neurons in various areas of nonhuman primate cortex in their
work (Sugrue, Corrado, & Newsome, 2005). Moreover, Sugrue and colleagues (2005)
have argued that the goals of such research are best served by combining an analysis
of the local determinants of individual choices with momentary changes in the
underlying neurophysiology. A critical aspect of this research involves correlating the
activity of a given set of neurons with the estimation of the local value of an animal’s
choices by various reinforcement learning algorithms (Barraclough, Conroy, & Lee,
112
2004; Lau & Glimcher, 2008; Sugrue, Corrado, & Newsome, 2005). Accordingly,
future efforts to model learning processes in signal detection can easily be exported to
aide researchers seeking to understand the neural mechanisms of perception and
decision making.
Other active areas of research in the neurosciences are concerned with the
neurobiology of reinforcement (Schultz, 1998, 2002, 2007) and changes in
reinforcement due to disorders, lesions, and exposure to environmental contaminants.
As in the study of neural mechanisms of choice and valuation discussed above,
accurate characterizations of neurobiological mechanisms of reinforcement are
frequently enhanced by well-established behavioral theories (Schultz, 2004, 2006;
Schultz, Dayan, & Montague, 1997; Schultz & Dickinson, 2000). Formal behavioral
theories of reinforcement are often advantageous, particularly when reinforcement
processes are disrupted.
For example, in laboratory animal models of attention-deficit/hyperactivity
disorder (ADHD), Sagvolden and colleagues (Sagvolden, Johansen, Aase, & Russell,
2005) have suggested that deficits in catecholamine function produce a reinforcement
deficit. Sagvolden and colleagues have advanced a behavioral theory proposing that
the changes in reinforcement functioning for ADHD diagnosed individuals may be a
result of a steepened delay of reinforcement gradient. Their account suggests that the
ability of reinforcers to couple with the responses that produce them may be altered in
ADHD diagnosed individuals. That is, the delay of reinforcement gradient becomes
shallower for these individuals. An alternative account would suggest that altered
dopamine function may result in a decreased contingency discriminability value for
113
affected individuals. To bring a contingency discriminability account to bear on such
a problem requires extending the model to estimate the discriminability among both
concurrently and successively occurring instances of behavior. Johansen and
colleagues (Johansen et al, 2009) suggest a number of interventions based on their
proposed behavioral mechanism. Many of them consist of employing stimuli to
bridge gaps between behavior and reinforcement and presenting stimuli that better
capture attention. Basic laboratory research on changes in attending and contingency
discriminability processes may suggest other intervention strategies.
Future Directions
Each experiment reported here has made use of methods that are novel to the
area of signal detection research. Consequently, these experiments have raised far
more questions than they have answered. The use of dynamic experimental
procedures in the quantitative analysis of behavior has only really begun (Davison,
1998). As a result, numerous avenues for future research on the dynamics of signal
detection performance exist. Here I will briefly sketch what I think may be the most
promising future directions.
Several recent findings from Davison, Baum, and colleagues have highlighted
the importance of the discriminative properties of reinforcer sequences in governing
choice at the local level. In their procedure, (Belke & Heyman, 1994; Davison &
Baum, 2000) subjects are exposed to seven different unsignaled relative reinforcer
frequency ratios in different components, each of which is separated by a 10 s
blackout and lasts until 10 reinforcers are obtained. Davison and Baum (2000) found
that the rate of change in relative response rate as a function of the relative reinforcer
114
frequency increased as reinforcers were earned within a component. By the end of a
component, the slope of the relation between relative response and reinforcer
frequency was slightly less than that obtained in traditional steady-state designs
(Baum, 1974, 1979; Wearden & Burgess, 1982). To investigate the choice dynamics
within this procedure, Davison and Baum (2000) plotted the obtained preference level
between each successive reinforcer obtained within components. That is, preference,
scaled as the logarithm (base 10) of the left/right response ratio, was plotted for each
possible sequence of reinforcers obtained from responding to the left and right
response alternatives, respectively. Davison and Baum reported that the effect of a
single reinforcer obtained from one alternative that interrupted (“discontinuation”) a
sequence of reinforcers obtained from the other alternative had the greatest effect on
choice. Thus, a single discontinuation produced large changes in preference towards
indifference, whereas continuations or successive reinforcers obtained from the same
alternative had diminishing effects upon preference.
Findings such as those discussed above have important implications for
models of performance in conditional discrimination and signal detection procedures.
Existing models of conditional discrimination performance (Davison & Tustin, 1978;
Davison & Nevin, 1999) do not directly address the issue of whether discriminative
stimuli and reinforcers exert simultaneous control over behavior on each trial or
whether behavior on any given trial is under control of only one these dimensions.
The model offered by Davison and Tustin (1978) predicts that the effects of sample
stimuli and relative reinforcer frequency have independent effects on performance.
This might seem to imply that the model would predict that behavior is under joint
115
control by these two sources on each trial. However, the model is actually silent on
the issue, as it was originally formulated for steady-state procedures and furthermore,
the independence assumption has not held up in some studies (Alsop & Davison,
1991). The model of Davison and Nevin (1999) predicts that the control exerted on
behavior by the discriminative stimuli and relative reinforcer frequencies interact to
determine performance. In fact, Davison and Nevin state (pp. 449) that the processes
invoked by their model are sequential and dynamic, suggesting that discriminative
stimuli and reinforcers interact to determine the effective value of each choice
alternative on a trial-by-trial basis. Testing either of these sets of assumptions
empirically is made difficult by the nature of conditional discrimination procedures.
Signal detection and conditional discrimination procedures involve discrete trials in
which only a single response is made at a time. Thus, analyses of behavior at a local
level in these procedures are more difficult than in other procedures used to
investigate choice (Davison & Baum, 2000). Other measures of performance in signal
detection and conditional discrimination procedures may, however, produce orderly
changes at a local level.
Alsop and Rowley (1996) reported a series of analyses on the local effects of
reinforcers on relative response frequency and choice latency in a simple detection
task. They found that choice latencies tended to be faster on trials immediately
following reinforcement. Further analyses of response bias on trials immediately
following reinforcement showed some evidence of a preference for the response
alternative correlated with a higher reinforcer frequency. Analyses at this level
provided no systematic changes in discriminability. Therefore, the relation between
116
Alsop and Rowley’s (1996) findings on preference immediately following
reinforcement differ from those in concurrent schedules (Davison & Baum, 2000;
2002) and the lack of systematic data reported by the authors on trial sequence effects
cannot be directly compared to those reported previously (White, Parkinson, Brown,
& Wixted 2004).
It seems that some particularly promising future directions involve designs
like those employed in the present experiments and an even greater emphasis on
analyses of local performance. The most important goal of this research would be to
characterize subjects’ choices on a trial-to-trial level as a function of the effects of
individual reinforcers and the generalization of these effects due to stimulus and
contingency discriminability and local reinforcer value. The aforementioned
experimental work may allow for the development of an exclusively local model to
explain molar performance in signal detection procedures.
Conclusion
In conclusion, this dissertation has shown that dynamic research
methodologies from other domains, adapted to the study of signal detection
performance, are valid instruments by which to study aspects of conditional
discrimination learning. Moreover, discrimination performance and response bias
adapt rapidly to frequent changes in experimental contingencies. Extant quantitative
models formulated to describe static signal detection performance can be readily
adapted to describe such performances in transition. These models provide accurate
quantitative descriptions of the transition data; however some theoretical assumptions
are violated. Therefore, an emphasis on detection performance in transition will

117
require modification of current theory. Conventional thinking about which model
parameters give rise to stable levels of discrimination accuracy and response bias,
suggest that modifications to existing models must include a role for the conditioned
reinforcing value of sample and comparison stimuli during the course of learning.
118
Table 1.1 Outline of the Experiments presented in each Chapter. The number of stimuli presented in an experimental session and the mapping between stimuli and correct responding is indicated. Also indicated is the relative frequencies of reinforcement for correct responses that were studied in each experiment. The number of sessions for a given condition within each experiment is also given. The variables that either changed or were held constant for a condition is discussed in the text.
Short Long Reinforcer Sessions per
Experiment Stimuli Correct Response Ratio Condition
1 2* B1 B2 1:3;3:1 31
2 5 B1 B2 1:3,1:1,3:1 36
3 6 B1 or B2 B1 or B2 1:4,1:1,4:1 15
* In Experiment 1, 2 stimulus durations were presented each session, but the durations changed across conditions.
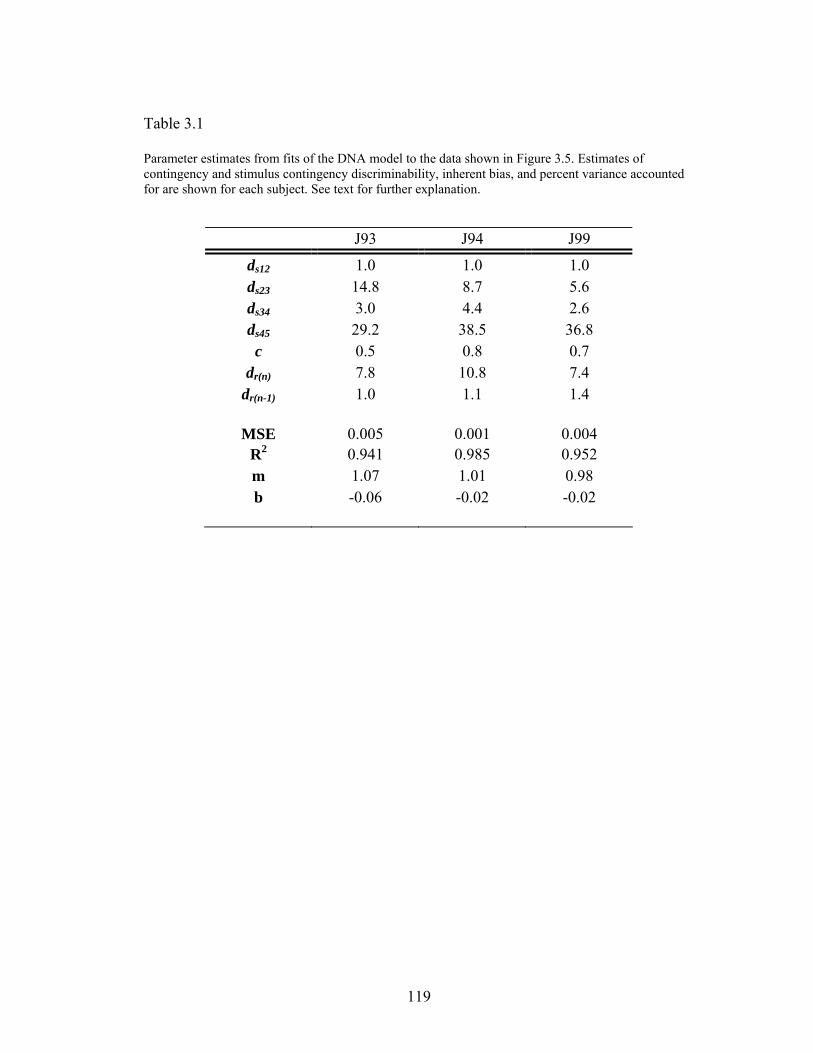
119
Table 3.1 Parameter estimates from fits of the DNA model to the data shown in Figure 3.5. Estimates of contingency and stimulus contingency discriminability, inherent bias, and percent variance accounted for are shown for each subject. See text for further explanation.
J93 J94 J99
ds12 1.0 1.0 1.0 ds23 14.8 8.7 5.6 ds34 3.0 4.4 2.6 ds45 29.2 38.5 36.8 c 0.5 0.8 0.7
dr(n) 7.8 10.8 7.4 dr(n-1) 1.0 1.1 1.4
MSE 0.005 0.001 0.004
R2 0.941 0.985 0.952 m 1.07 1.01 0.98 b -0.06 -0.02 -0.02
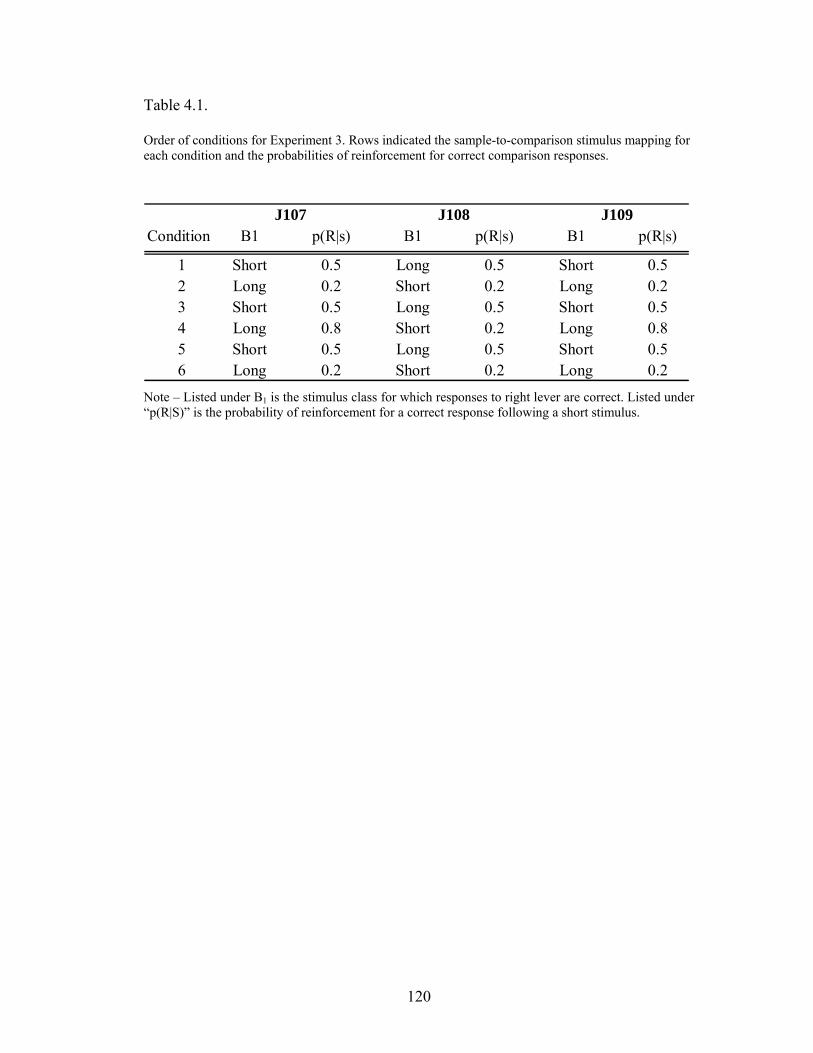
120
Table 4.1. Order of conditions for Experiment 3. Rows indicated the sample-to-comparison stimulus mapping for each condition and the probabilities of reinforcement for correct comparison responses.
Note – Listed under B1 is the stimulus class for which responses to right lever are correct. Listed under “p(R|S)” is the probability of reinforcement for a correct response following a short stimulus.
J107 J108 J109Condition B1 p(R|s) B1 p(R|s) B1 p(R|s)
1 Short 0.5 Long 0.5 Short 0.52 Long 0.2 Short 0.2 Long 0.23 Short 0.5 Long 0.5 Short 0.54 Long 0.8 Short 0.2 Long 0.85 Short 0.5 Long 0.5 Short 0.56 Long 0.2 Short 0.2 Long 0.2
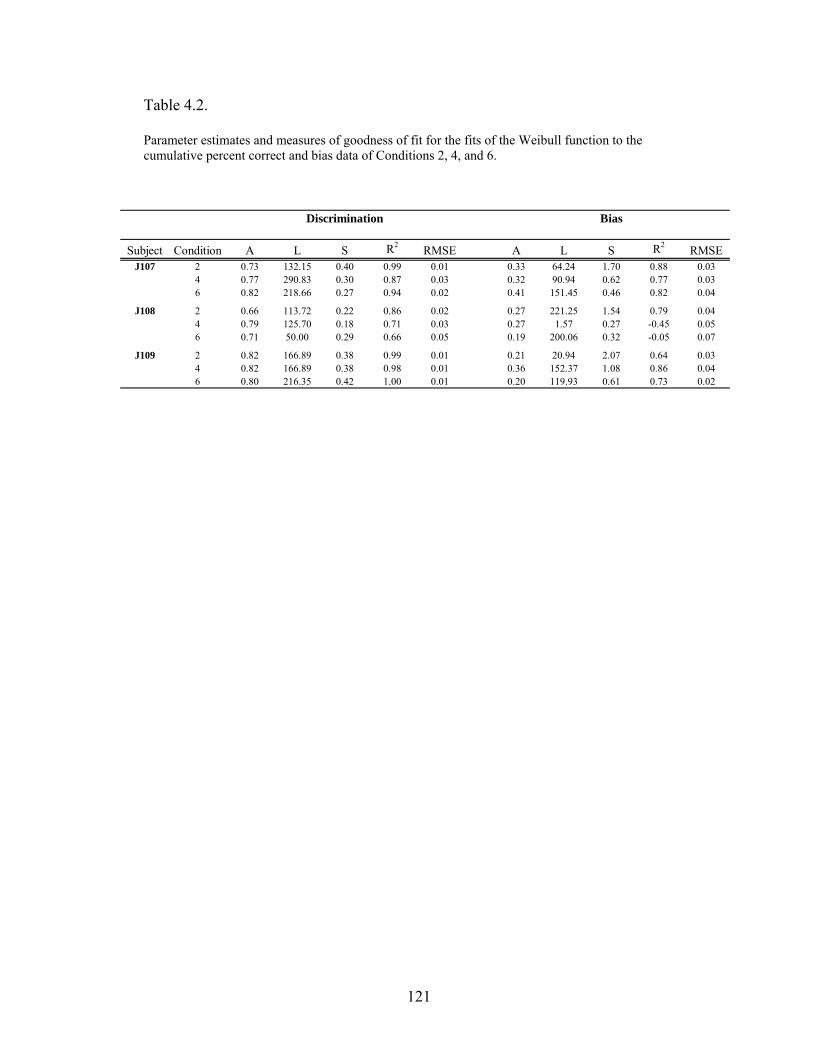
121
Table 4.2. Parameter estimates and measures of goodness of fit for the fits of the Weibull function to the cumulative percent correct and bias data of Conditions 2, 4, and 6.
Discrimination Bias
Subject Condition A L S R2 RMSE A L S R2 RMSEJ107 2 0.73 132.15 0.40 0.99 0.01 0.33 64.24 1.70 0.88 0.03
4 0.77 290.83 0.30 0.87 0.03 0.32 90.94 0.62 0.77 0.036 0.82 218.66 0.27 0.94 0.02 0.41 151.45 0.46 0.82 0.04
J108 2 0.66 113.72 0.22 0.86 0.02 0.27 221.25 1.54 0.79 0.044 0.79 125.70 0.18 0.71 0.03 0.27 1.57 0.27 -0.45 0.056 0.71 50.00 0.29 0.66 0.05 0.19 200.06 0.32 -0.05 0.07
J109 2 0.82 166.89 0.38 0.99 0.01 0.21 20.94 2.07 0.64 0.034 0.82 166.89 0.38 0.98 0.01 0.36 152.37 1.08 0.86 0.046 0.80 216.35 0.42 1.00 0.01 0.20 119.93 0.61 0.73 0.02
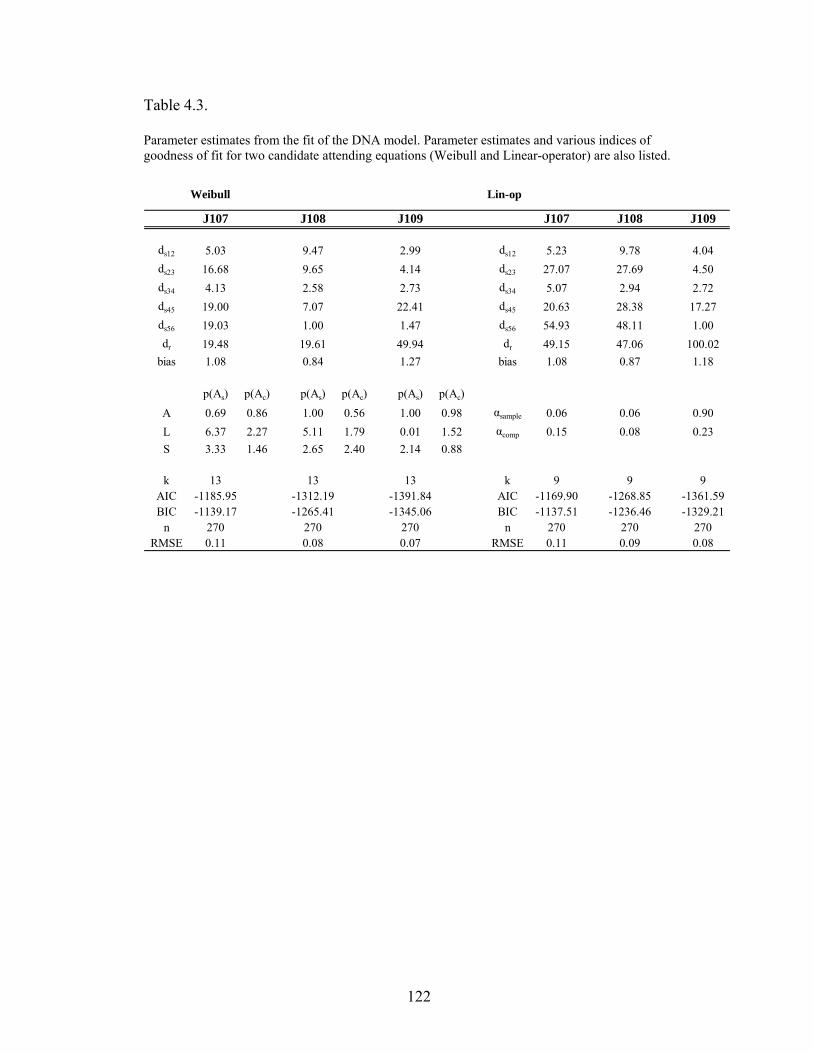
122
Table 4.3. Parameter estimates from the fit of the DNA model. Parameter estimates and various indices of goodness of fit for two candidate attending equations (Weibull and Linear-operator) are also listed.
Weibull Lin-op
J107 J108 J109 J107 J108 J109
ds12 5.03 9.47 2.99 ds12 5.23 9.78 4.04ds23 16.68 9.65 4.14 ds23 27.07 27.69 4.50ds34 4.13 2.58 2.73 ds34 5.07 2.94 2.72ds45 19.00 7.07 22.41 ds45 20.63 28.38 17.27ds56 19.03 1.00 1.47 ds56 54.93 48.11 1.00dr 19.48 19.61 49.94 dr 49.15 47.06 100.02
bias 1.08 0.84 1.27 bias 1.08 0.87 1.18
p(As) p(Ac) p(As) p(Ac) p(As) p(Ac)
A 0.69 0.86 1.00 0.56 1.00 0.98 αsample 0.06 0.06 0.90L 6.37 2.27 5.11 1.79 0.01 1.52 αcomp 0.15 0.08 0.23S 3.33 1.46 2.65 2.40 2.14 0.88
k 13 13 13 k 9 9 9AIC -1185.95 -1312.19 -1391.84 AIC -1169.90 -1268.85 -1361.59BIC -1139.17 -1265.41 -1345.06 BIC -1137.51 -1236.46 -1329.21
n 270 270 270 n 270 270 270RMSE 0.11 0.08 0.07 RMSE 0.11 0.09 0.08
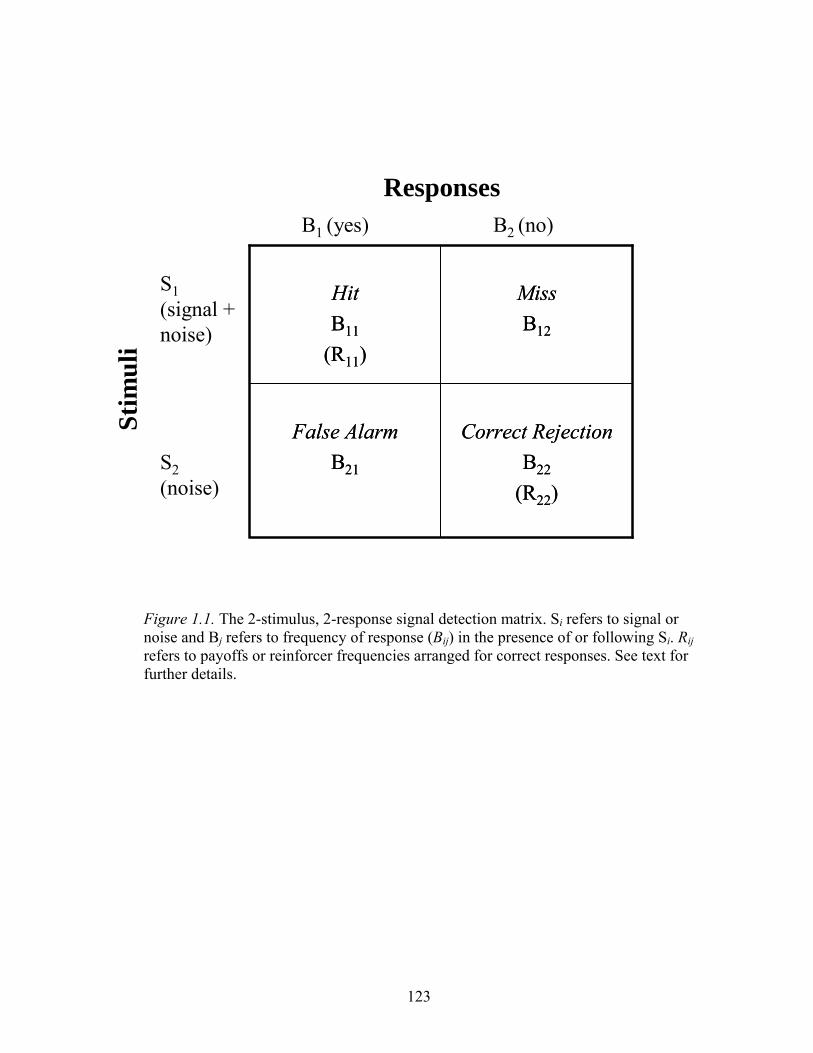
123
Figure 1.1. The 2-stimulus, 2-response signal detection matrix. Si refers to signal or noise and Bj refers to frequency of response (Bij) in the presence of or following Si. Rij refers to payoffs or reinforcer frequencies arranged for correct responses. See text for further details.
Correct RejectionB22
(R22)
False AlarmB21
MissB12
HitB11
(R11)
Correct RejectionB22
(R22)
False AlarmB21
MissB12
HitB11
(R11)
Responses
Stim
uli
B1 (yes) B2 (no)
S1(signal + noise)
S2 (noise)
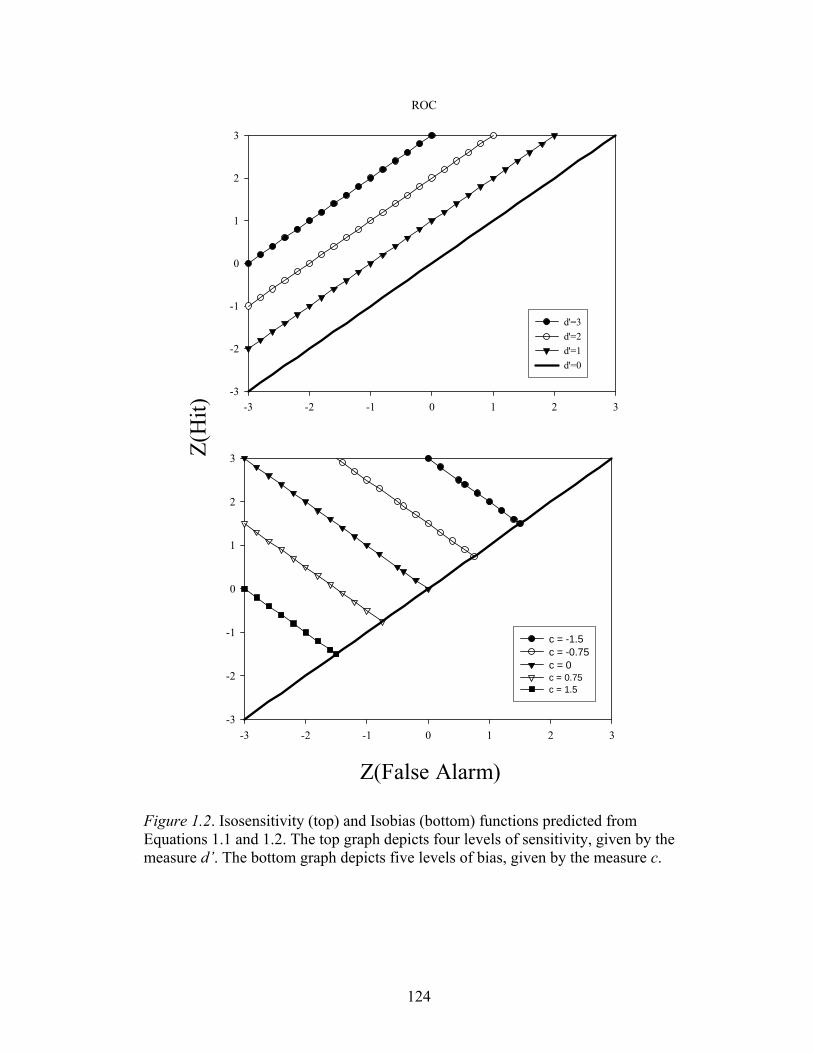
124
Figure 1.2. Isosensitivity (top) and Isobias (bottom) functions predicted from Equations 1.1 and 1.2. The top graph depicts four levels of sensitivity, given by the measure d’. The bottom graph depicts five levels of bias, given by the measure c.
ROC
-3 -2 -1 0 1 2 3-3
-2
-1
0
1
2
3
d'=3d'=2d'=1d'=0
-3 -2 -1 0 1 2 3-3
-2
-1
0
1
2
3
c = -1.5c = -0.75c = 0c = 0.75c = 1.5
Z(False Alarm)
Z(H
it)
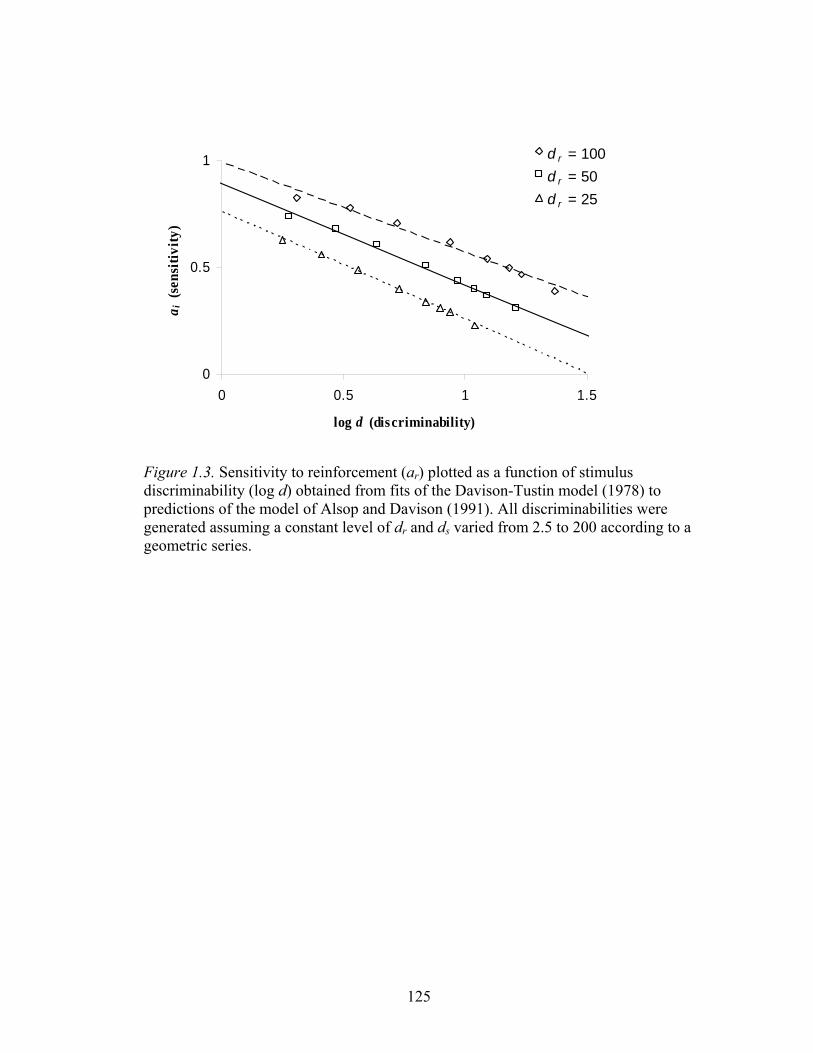
125
Figure 1.3. Sensitivity to reinforcement (ar) plotted as a function of stimulus discriminability (log d) obtained from fits of the Davison-Tustin model (1978) to predictions of the model of Alsop and Davison (1991). All discriminabilities were generated assuming a constant level of dr and ds varied from 2.5 to 200 according to a geometric series.
0
0.5
1
0 0.5 1 1.5
log d (discriminability)
a i (s
ensi
tivity
)dr = 100dr = 50dr = 25
d r = 100d r = 50d r = 25
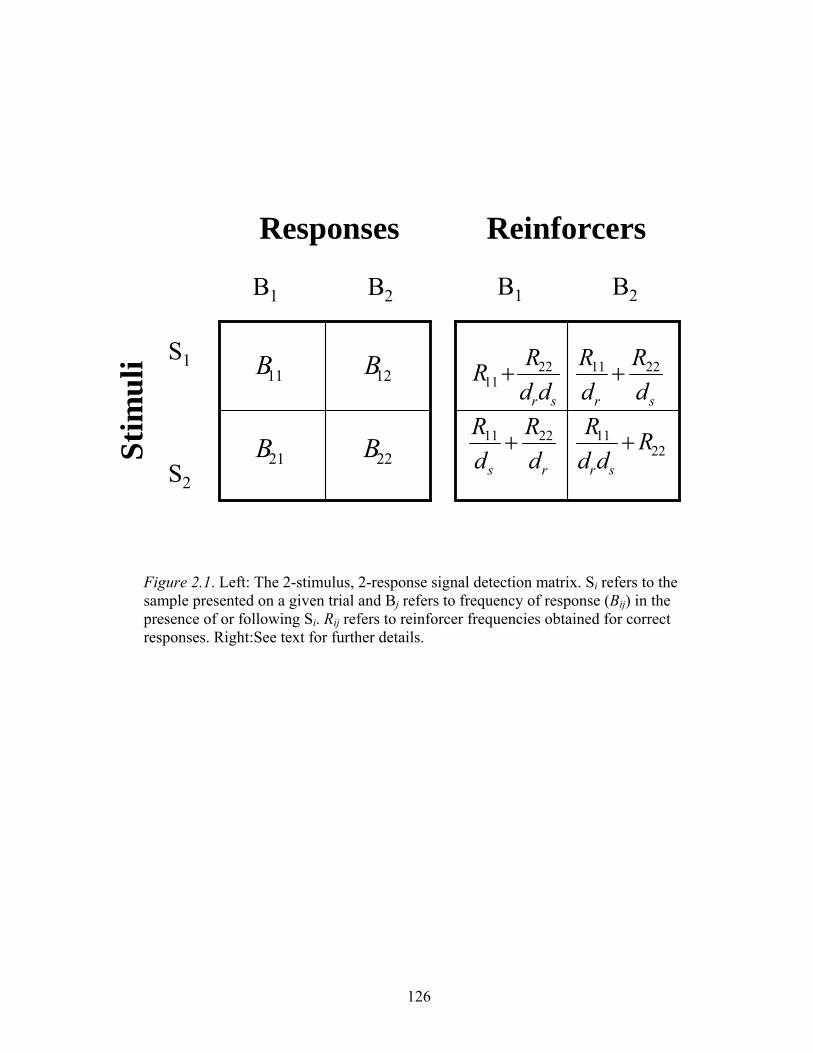
126
Figure 2.1. Left: The 2-stimulus, 2-response signal detection matrix. Si refers to the sample presented on a given trial and Bj refers to frequency of response (Bij) in the presence of or following Si. Rij refers to reinforcer frequencies obtained for correct responses. Right:See text for further details.
Responses
Stim
uli S1
S2
B1 B2
srddRR 22
11+sr d
RdR 2211 +
rs dR
dR 2211 + 22
11 Rdd
R
sr
+
12B11B
21B 22B
B1 B2
Reinforcers
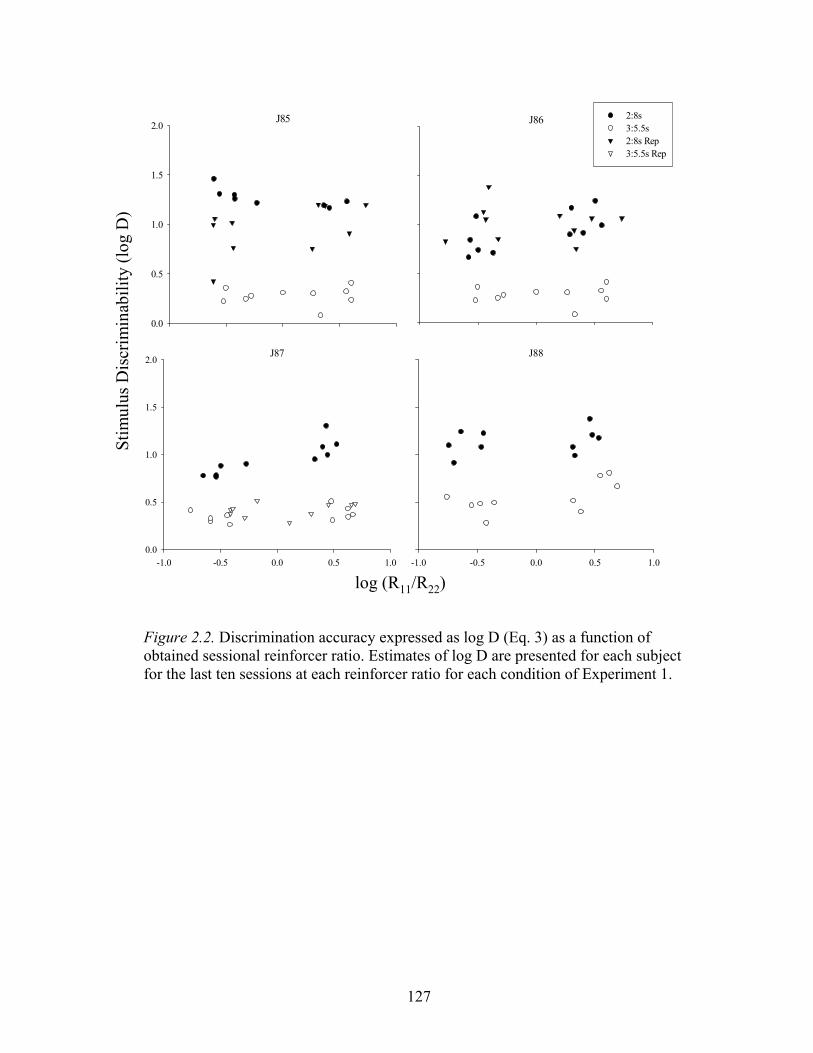
127
Figure 2.2. Discrimination accuracy expressed as log D (Eq. 3) as a function of obtained sessional reinforcer ratio. Estimates of log D are presented for each subject for the last ten sessions at each reinforcer ratio for each condition of Experiment 1.
J85
0.0
0.5
1.0
1.5
2.0 J86 2:8s3:5.5s2:8s Rep3:5.5s Rep
J87
-1.0 -0.5 0.0 0.5 1.00.0
0.5
1.0
1.5
2.0J88
-1.0 -0.5 0.0 0.5 1.0
log (R11/R22)
Stim
ulus
Dis
crim
inab
ility
(log
D)
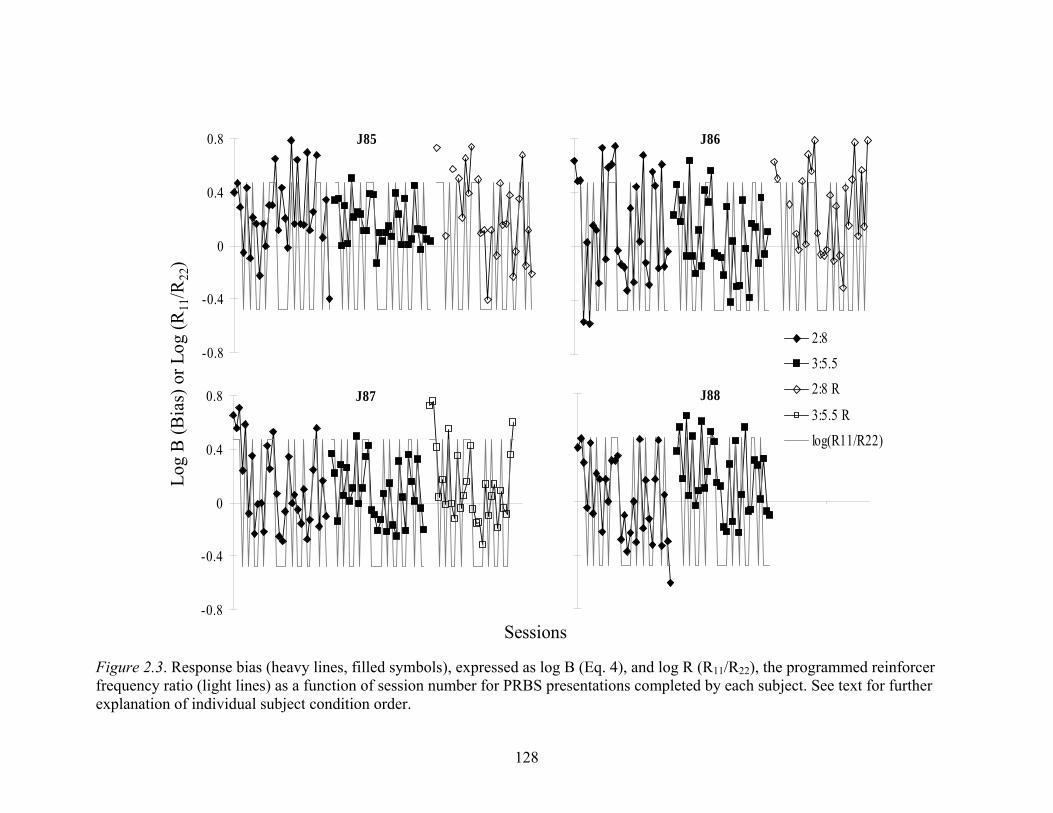
128
Figure 2.3. Response bias (heavy lines, filled symbols), expressed as log B (Eq. 4), and log R (R11/R22), the programmed reinforcer frequency ratio (light lines) as a function of session number for PRBS presentations completed by each subject. See text for further explanation of individual subject condition order.
Sessions
Log
B (B
ias)
or L
og (R
11/R
22)
J85
-0.8
-0.4
0
0.4
0.8 J86
J87
-0.8
-0.4
0
0.4
0.8 J88
2:83:5.52:8 R
3:5.5 Rlog(R11/R22)
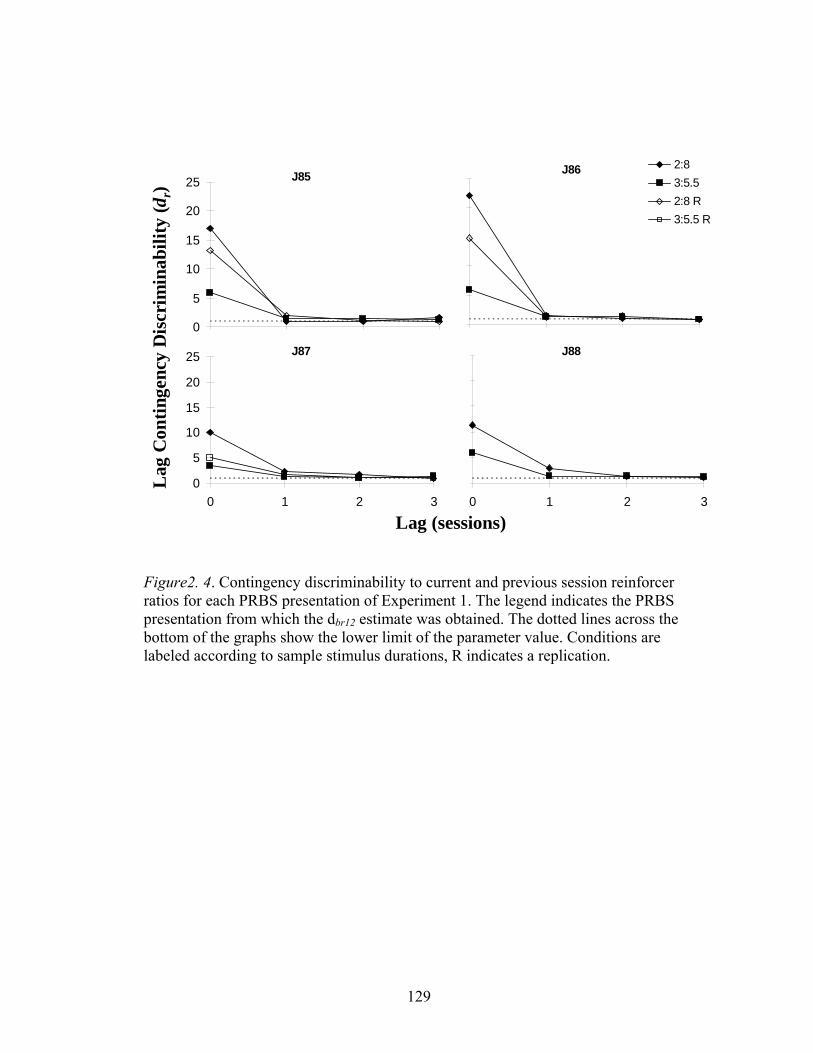
129
Figure2. 4. Contingency discriminability to current and previous session reinforcer ratios for each PRBS presentation of Experiment 1. The legend indicates the PRBS presentation from which the dbr12 estimate was obtained. The dotted lines across the bottom of the graphs show the lower limit of the parameter value. Conditions are labeled according to sample stimulus durations, R indicates a replication.
Lag
Con
tinge
ncy
Dis
crim
inab
ility
(dr)
Lag (sessions)
J85
0
5
10
15
20
25
J87
0
5
10
15
20
25
0 1 2 3
J88
0 1 2 3
J86 2:83:5.52:8 R3:5.5 R
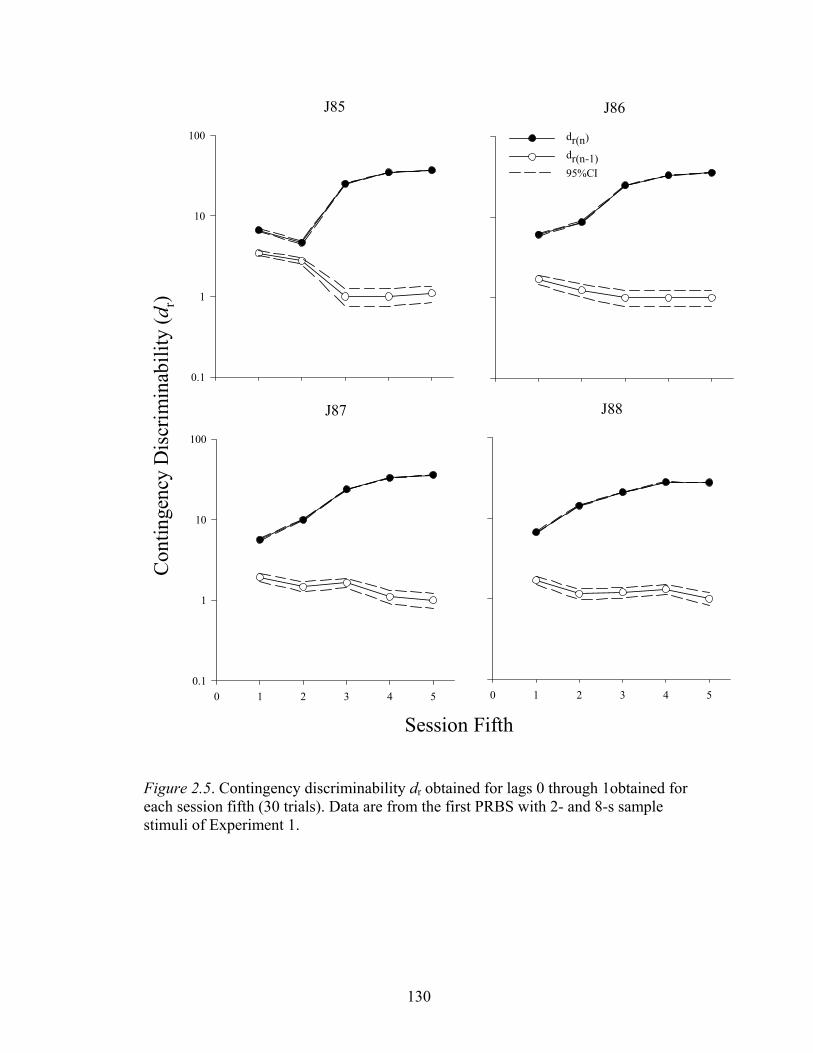
130
Figure 2.5. Contingency discriminability dr obtained for lags 0 through 1obtained for each session fifth (30 trials). Data are from the first PRBS with 2- and 8-s sample stimuli of Experiment 1.
Session Fifth
Con
tinge
ncy
Dis
crim
inab
ility
(dr)
J85
0.1
1
10
100
J86
dr(n)dr(n-1)95%CI
J87
0 1 2 3 4 50.1
1
10
100
J88
0 1 2 3 4 5
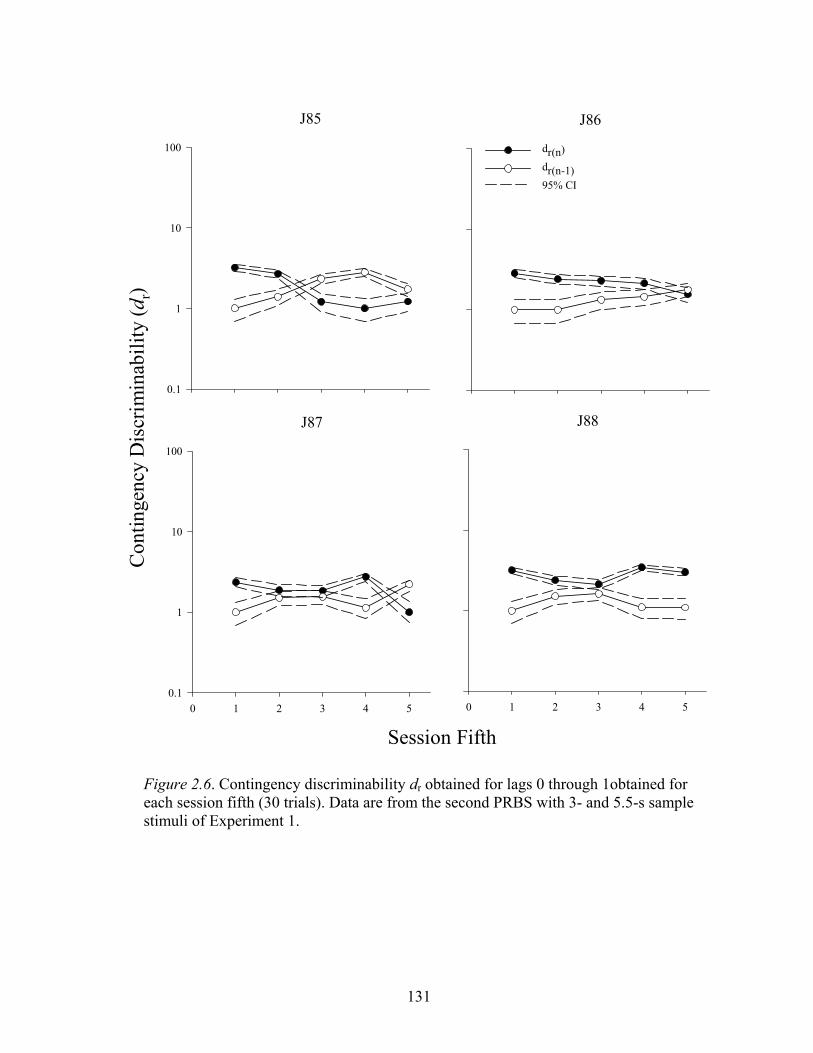
131
Figure 2.6. Contingency discriminability dr obtained for lags 0 through 1obtained for each session fifth (30 trials). Data are from the second PRBS with 3- and 5.5-s sample stimuli of Experiment 1.
Session Fifth
Con
tinge
ncy
Dis
crim
inab
ility
(dr)
J85
0.1
1
10
100
J86
dr(n)dr(n-1)95% CI
J87
0 1 2 3 4 50.1
1
10
100
J88
0 1 2 3 4 5
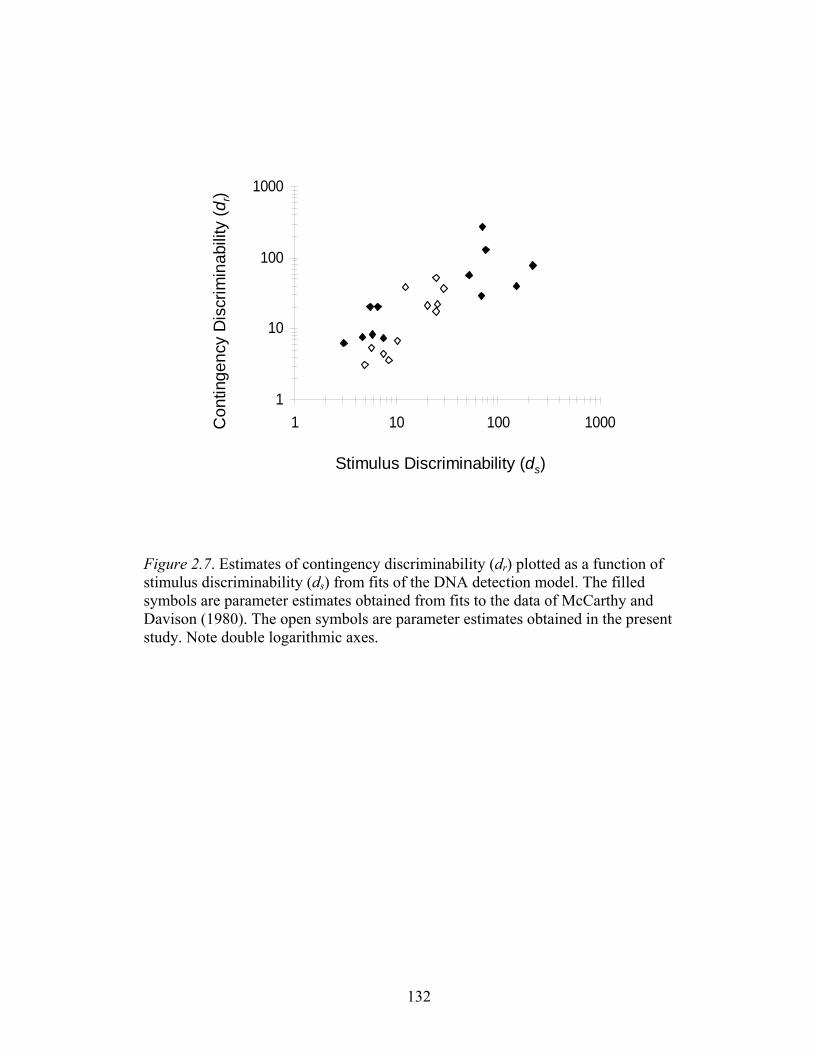
132
Figure 2.7. Estimates of contingency discriminability (dr) plotted as a function of stimulus discriminability (ds) from fits of the DNA detection model. The filled symbols are parameter estimates obtained from fits to the data of McCarthy and Davison (1980). The open symbols are parameter estimates obtained in the present study. Note double logarithmic axes.
Con
tinge
ncy
Dis
crim
inab
ility
(dr)
Stimulus Discriminability (ds)
1
10
100
1000
1 10 100 1000

133
Figure 3.1. The effective reinforcer allocation for the eight cells of the 4x2 signal detection matrix for a 4-stimulus, 2-response detection procedure assuming reinforcers for correct responses only.
B1 B2
S1
S2
S3
S4
1214
42
1213
32
12
2111
rsrss ddR
ddR
dR
R +++
14
42
13
32
1212
21
12
11
ssrsr dR
dR
ddR
dR
+++
1224
42
1223
3221
12
11
rsrss ddR
ddR
RdR
+++
24
42
23
32
12
21
1212
11
ssrrs dR
dR
dR
ddR
+++
1234
42
12
32
23
21
13
11
rsrss ddR
dR
dR
dR
+++
34
4232
1223
21
1213
11
srsrs dR
Rdd
Rdd
R+++
12
42
1234
32
24
21
14
11
rrsss dR
ddR
dR
dR
+++
4234
32
1224
21
1214
11 RdR
ddR
ddR
srsrs
+++
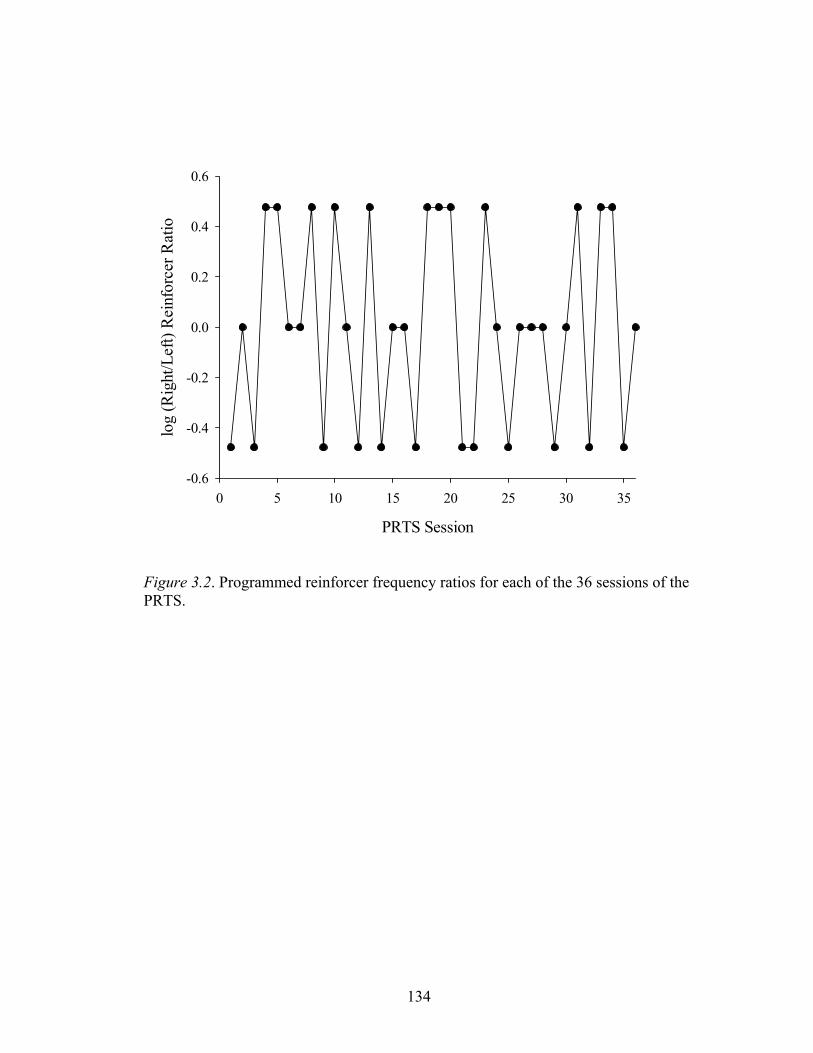
134
Figure 3.2. Programmed reinforcer frequency ratios for each of the 36 sessions of the PRTS.
PRTS Session
0 5 10 15 20 25 30 35
log
(Rig
ht/L
eft)
Rei
nfor
cer R
atio
-0.6
-0.4
-0.2
0.0
0.2
0.4
0.6
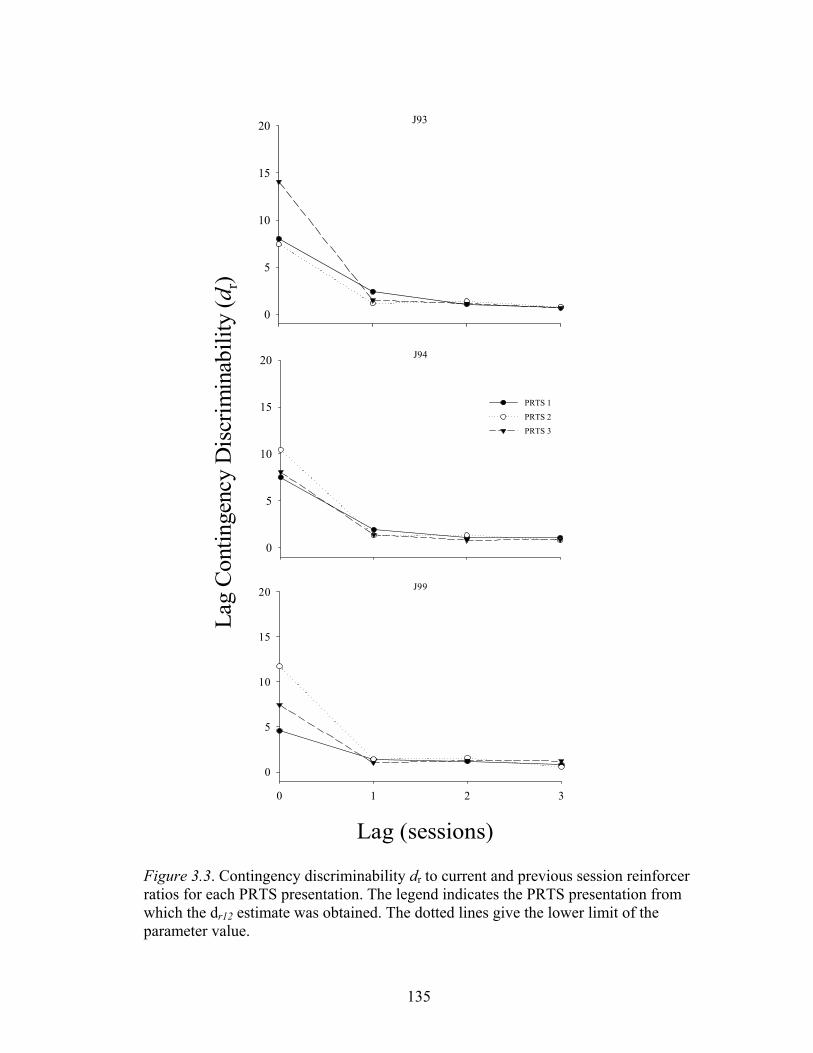
135
Figure 3.3. Contingency discriminability dr to current and previous session reinforcer ratios for each PRTS presentation. The legend indicates the PRTS presentation from which the dr12 estimate was obtained. The dotted lines give the lower limit of the parameter value.
Lag (sessions)
Lag
Con
tinge
ncy
Dis
crim
inab
ility
(dr)
J93
0
5
10
15
20
J94
0
5
10
15
20
PRTS 1
PRTS 2
PRTS 3
J99
0 1 2 3
0
5
10
15
20
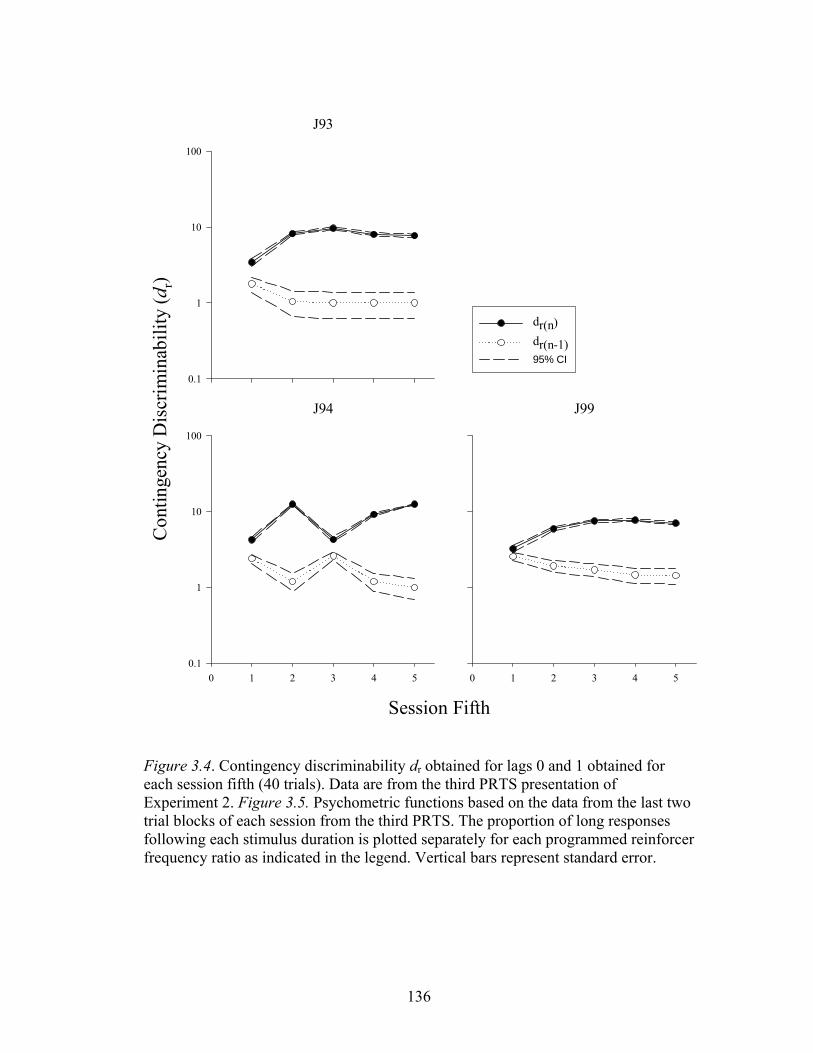
136
Figure 3.4. Contingency discriminability dr obtained for lags 0 and 1 obtained for each session fifth (40 trials). Data are from the third PRTS presentation of Experiment 2. Figure 3.5. Psychometric functions based on the data from the last two trial blocks of each session from the third PRTS. The proportion of long responses following each stimulus duration is plotted separately for each programmed reinforcer frequency ratio as indicated in the legend. Vertical bars represent standard error.
Session Fifth
Con
tinge
ncy
Dis
crim
inab
ility
(dr)
J93
0.1
1
10
100
J94
0 1 2 3 4 50.1
1
10
100
J99
0 1 2 3 4 5
dr(n)dr(n-1)95% CI
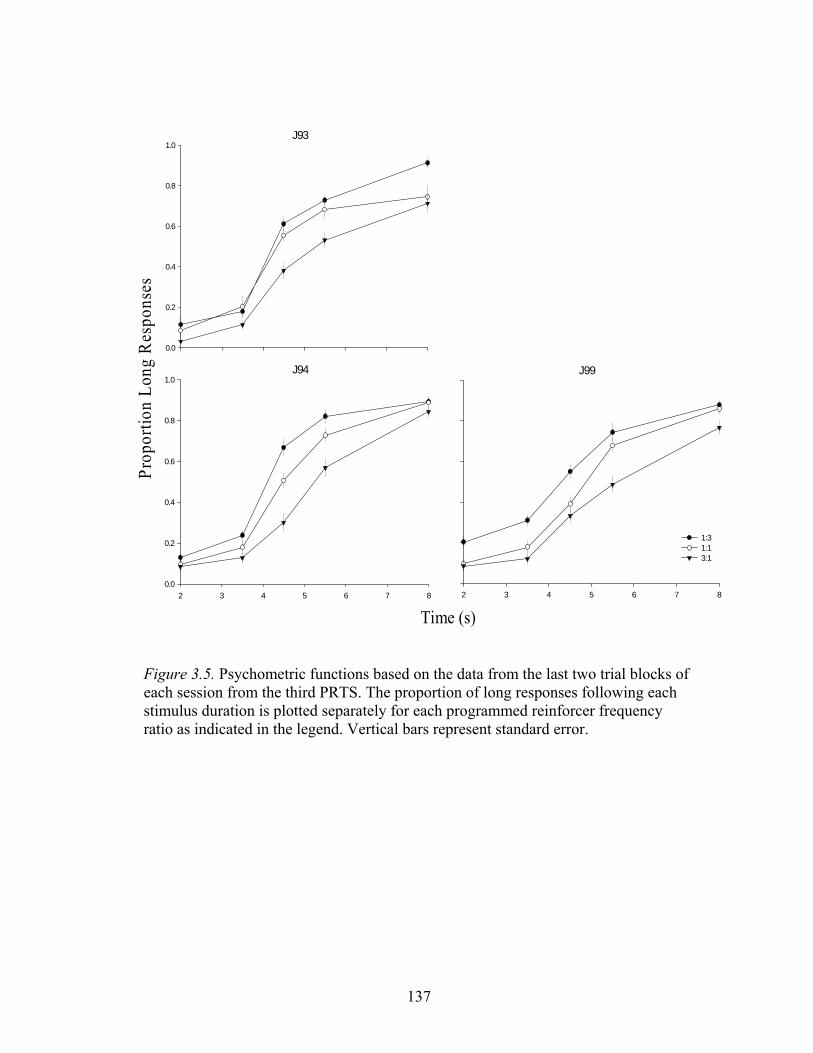
137
Figure 3.5. Psychometric functions based on the data from the last two trial blocks of each session from the third PRTS. The proportion of long responses following each stimulus duration is plotted separately for each programmed reinforcer frequency ratio as indicated in the legend. Vertical bars represent standard error.
J93
0.0
0.2
0.4
0.6
0.8
1.0
J94
2 3 4 5 6 7 80.0
0.2
0.4
0.6
0.8
1.0J99
2 3 4 5 6 7 8
1:3 1:13:1
Time (s)
Prop
ortio
n Lo
ng R
espo
nses
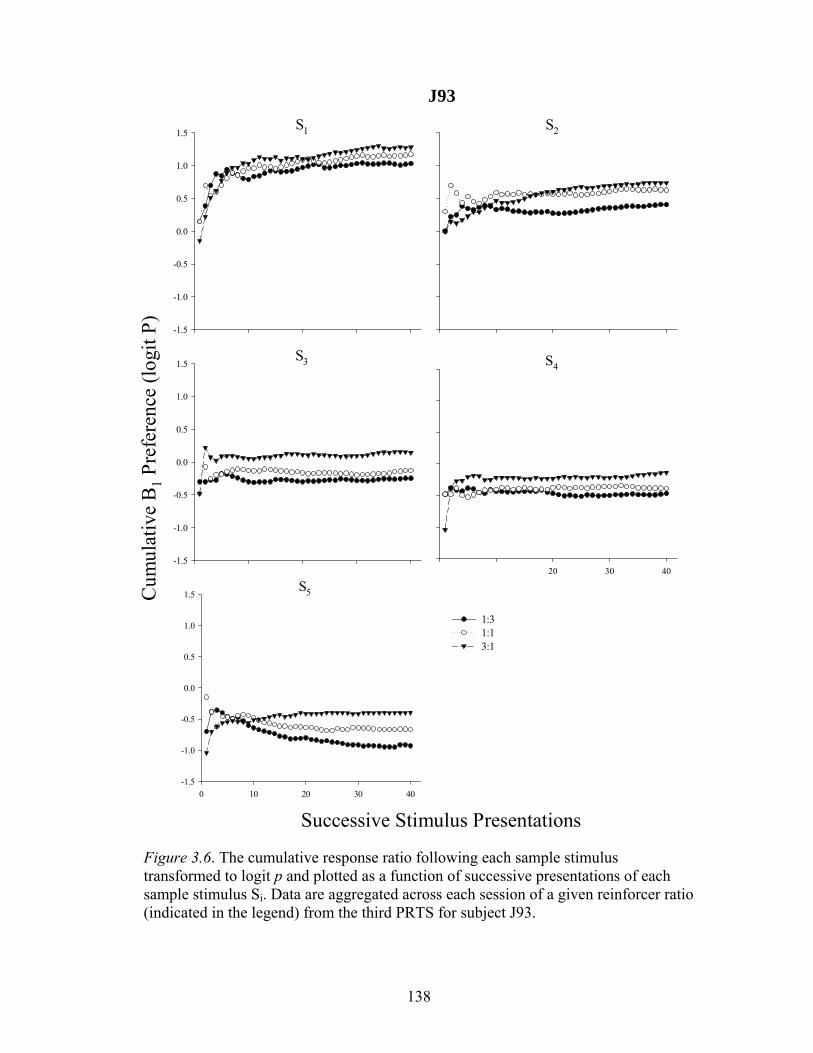
138
Figure 3.6. The cumulative response ratio following each sample stimulus transformed to logit p and plotted as a function of successive presentations of each sample stimulus Si. Data are aggregated across each session of a given reinforcer ratio (indicated in the legend) from the third PRTS for subject J93.
S1
-1.5
-1.0
-0.5
0.0
0.5
1.0
1.5
J93S2
S3
-1.5
-1.0
-0.5
0.0
0.5
1.0
1.5 S4
0 10 20 30 40
S5
0 10 20 30 40-1.5
-1.0
-0.5
0.0
0.5
1.0
1.5
1:31:13:1
Successive Stimulus Presentations
Cum
ulat
ive
B1
Pref
eren
ce (l
ogit
P)
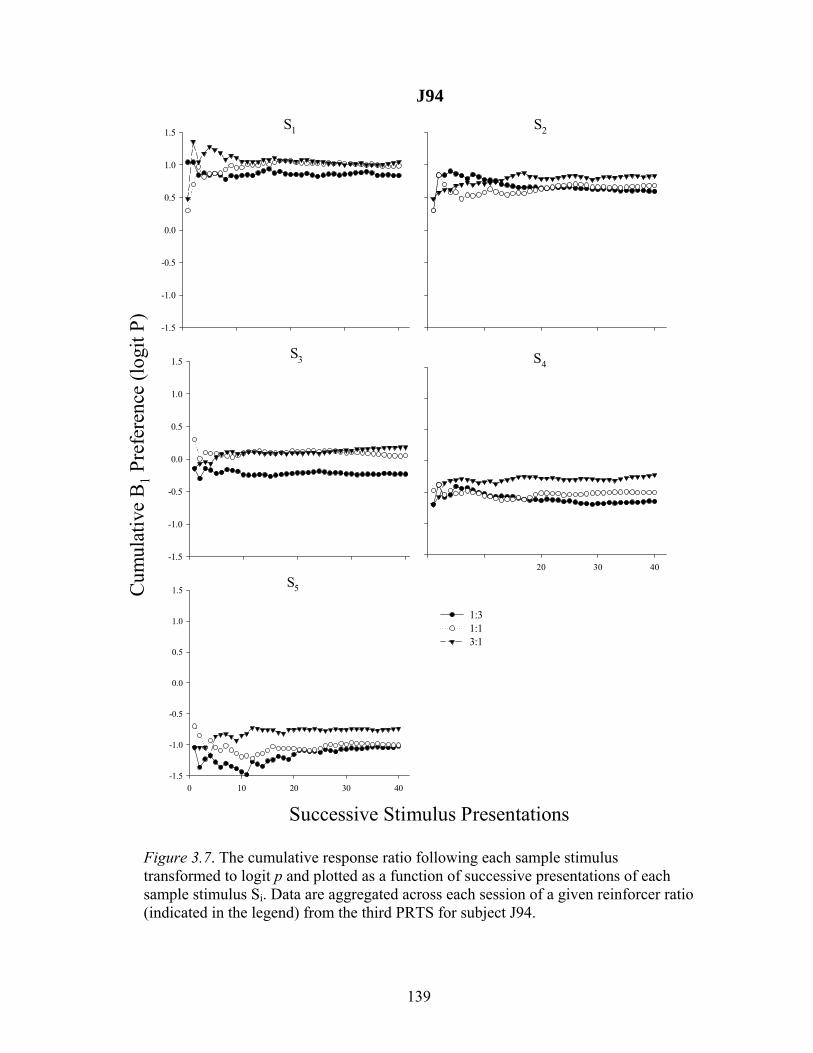
139
Figure 3.7. The cumulative response ratio following each sample stimulus transformed to logit p and plotted as a function of successive presentations of each sample stimulus Si. Data are aggregated across each session of a given reinforcer ratio (indicated in the legend) from the third PRTS for subject J94.
Successive Stimulus Presentations
Cum
ulat
ive
B1
Pref
eren
ce (l
ogit
P)
J94S1
-1.5
-1.0
-0.5
0.0
0.5
1.0
1.5S2
S3
-1.5
-1.0
-0.5
0.0
0.5
1.0
1.5 S4
0 10 20 30 40
S5
0 10 20 30 40-1.5
-1.0
-0.5
0.0
0.5
1.0
1.5
1:31:13:1
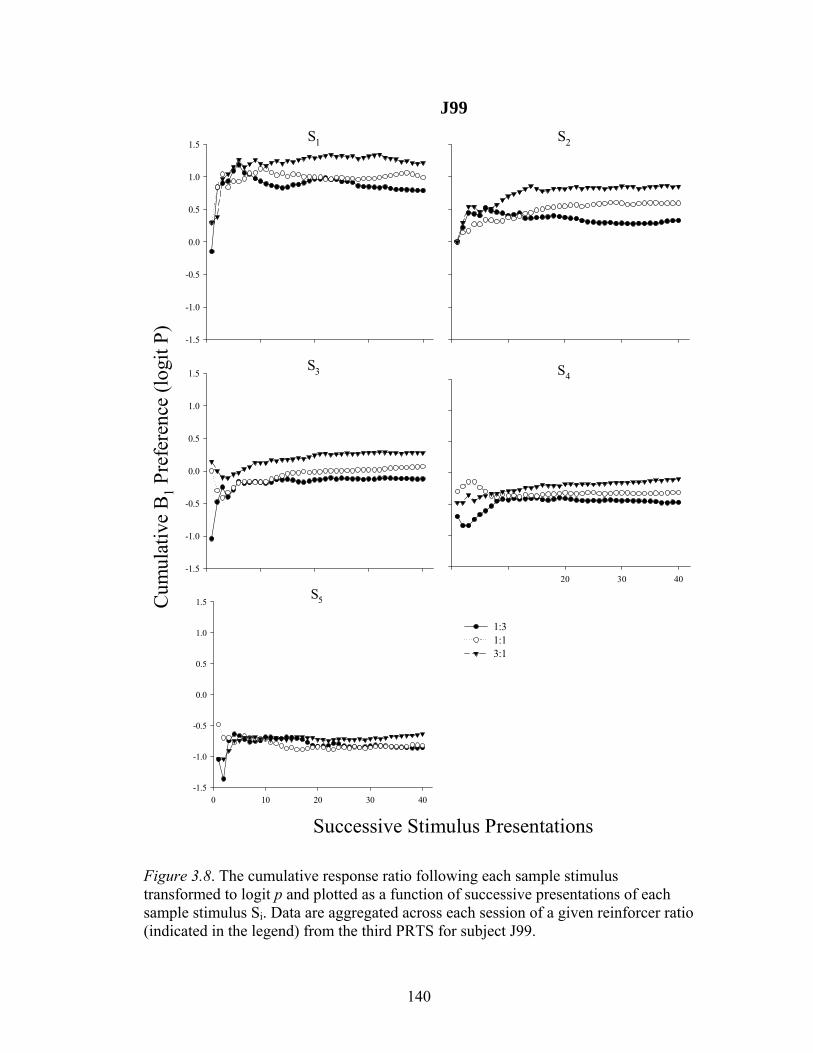
140
Figure 3.8. The cumulative response ratio following each sample stimulus transformed to logit p and plotted as a function of successive presentations of each sample stimulus Si. Data are aggregated across each session of a given reinforcer ratio (indicated in the legend) from the third PRTS for subject J99.
Successive Stimulus Presentations
Cum
ulat
ive
B1
Pref
eren
ce (l
ogit
P)S1
-1.5
-1.0
-0.5
0.0
0.5
1.0
1.5
J99S2
S3
-1.5
-1.0
-0.5
0.0
0.5
1.0
1.5 S4
0 10 20 30 40
S5
0 10 20 30 40-1.5
-1.0
-0.5
0.0
0.5
1.0
1.5
1:31:13:1
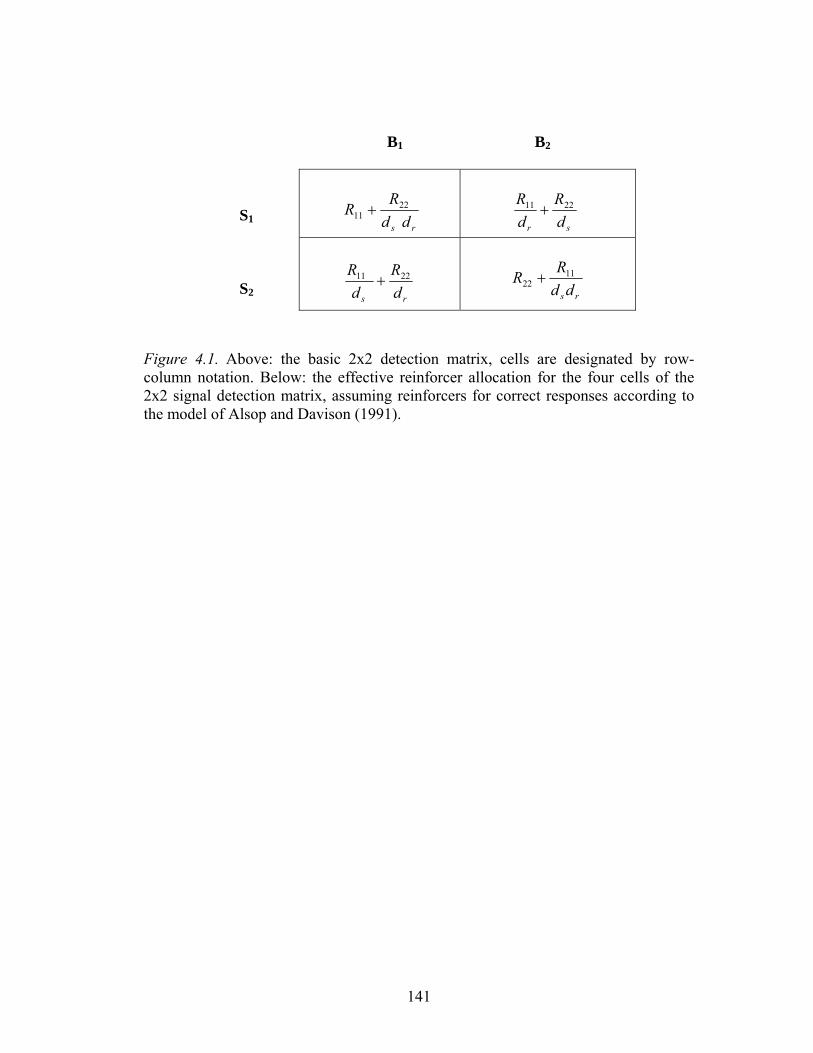
141
B1 B2
S1
S2
Figure 4.1. Above: the basic 2x2 detection matrix, cells are designated by row-column notation. Below: the effective reinforcer allocation for the four cells of the 2x2 signal detection matrix, assuming reinforcers for correct responses according to the model of Alsop and Davison (1991).
rs dd
RR 22
11 +
sr d
RdR 2211 +
rs dR
dR 2211 +
rs ddRR 11
22 +
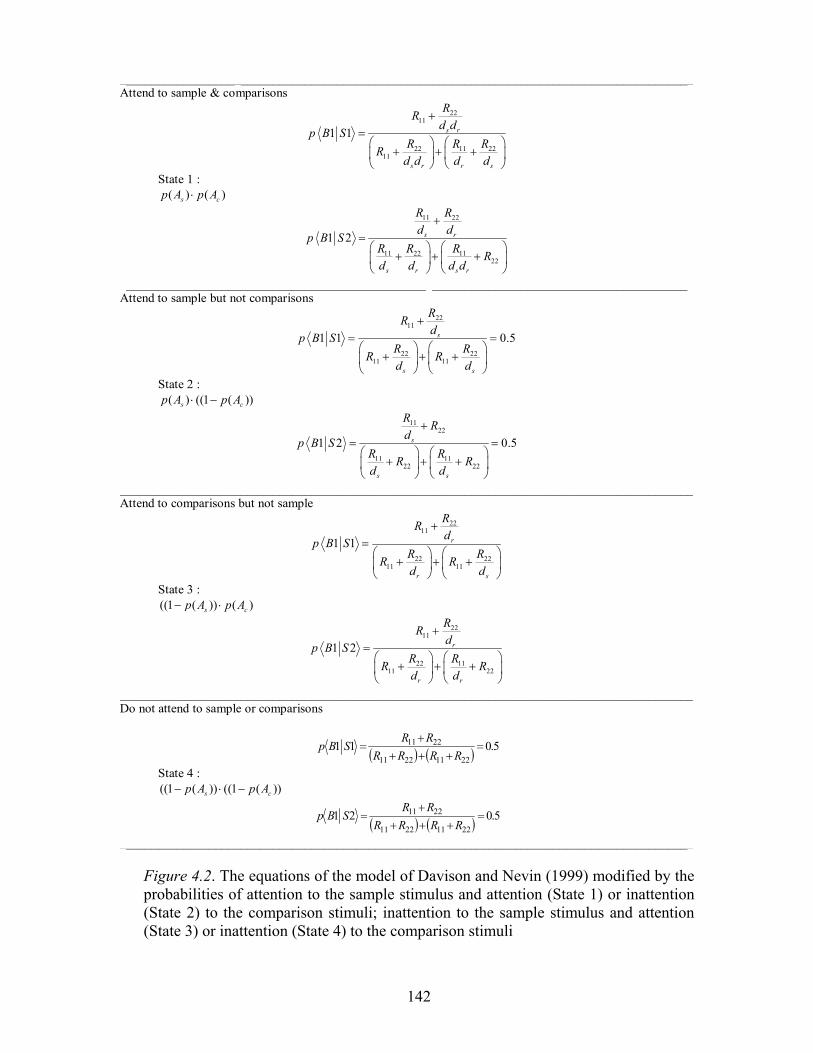
142
Figure 4.2. The equations of the model of Davison and Nevin (1999) modified by the probabilities of attention to the sample stimulus and attention (State 1) or inattention (State 2) to the comparison stimuli; inattention to the sample stimulus and attention (State 3) or inattention (State 4) to the comparison stimuli
__________________________________________________________________________________________Attend to sample & comparisons
2211
22 11 2211
1 1 s r
s r r s
RRd dp B S
R R RRd d d d
+=⎛ ⎞ ⎛ ⎞
+ + +⎜ ⎟ ⎜ ⎟⎝ ⎠ ⎝ ⎠
State 1 : ( ) ( )s cp A p A⋅
11 22
11 22 1122
1 2 s r
s r s r
R Rd dp B S
R R R Rd d d d
+=⎛ ⎞ ⎛ ⎞
+ + +⎜ ⎟ ⎜ ⎟⎝ ⎠ ⎝ ⎠
__________________________________________________________________________________________Attend to sample but not comparisons
2211
22 2211 11
1 1 0.5s
s s
RRdp B S
R RR Rd d
+= =⎛ ⎞ ⎛ ⎞
+ + +⎜ ⎟ ⎜ ⎟⎝ ⎠ ⎝ ⎠
State 2 : ( ) ((1 ( ))s cp A p A⋅ −
1122
11 1122 22
1 2 0.5s
s s
R Rdp B S
R RR Rd d
+= =⎛ ⎞ ⎛ ⎞
+ + +⎜ ⎟ ⎜ ⎟⎝ ⎠ ⎝ ⎠
__________________________________________________________________________________________Attend to comparisons but not sample
2211
22 2211 11
1 1 r
r s
RRdp B S
R RR Rd d
+=
⎛ ⎞⎛ ⎞+ + +⎜ ⎟⎜ ⎟
⎝ ⎠ ⎝ ⎠
State 3 : ((1 ( )) ( )s cp A p A− ⋅
2211
22 1111 22
1 2 r
r r
RRdp B S
R RR Rd d
+=⎛ ⎞ ⎛ ⎞
+ + +⎜ ⎟ ⎜ ⎟⎝ ⎠ ⎝ ⎠
__________________________________________________________________________________________Do not attend to sample or comparisons
( ) ( ) 5.01122112211
2211 =+++
+=
RRRRRR
SBp
State 4 : ((1 ( )) ((1 ( ))s cp A p A− ⋅ −
( ) ( ) 5.02122112211
2211 =+++
+=
RRRRRR
SBp
__________________________________________________________________________________________
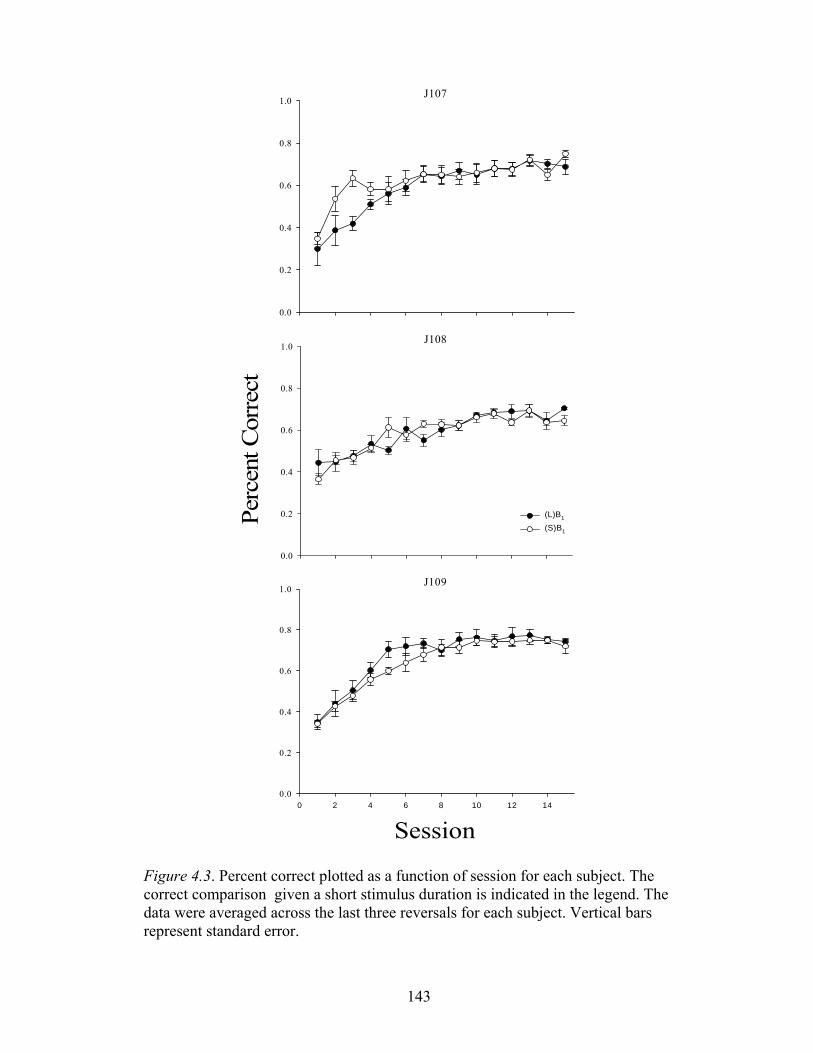
143
Figure 4.3. Percent correct plotted as a function of session for each subject. The correct comparison given a short stimulus duration is indicated in the legend. The data were averaged across the last three reversals for each subject. Vertical bars represent standard error.
J107
0.0
0.2
0.4
0.6
0.8
1.0
J108
0.0
0.2
0.4
0.6
0.8
1.0
(L)B1
(S)B1
J109
0 2 4 6 8 10 12 140.0
0.2
0.4
0.6
0.8
1.0
Session
Perc
ent C
orre
ct
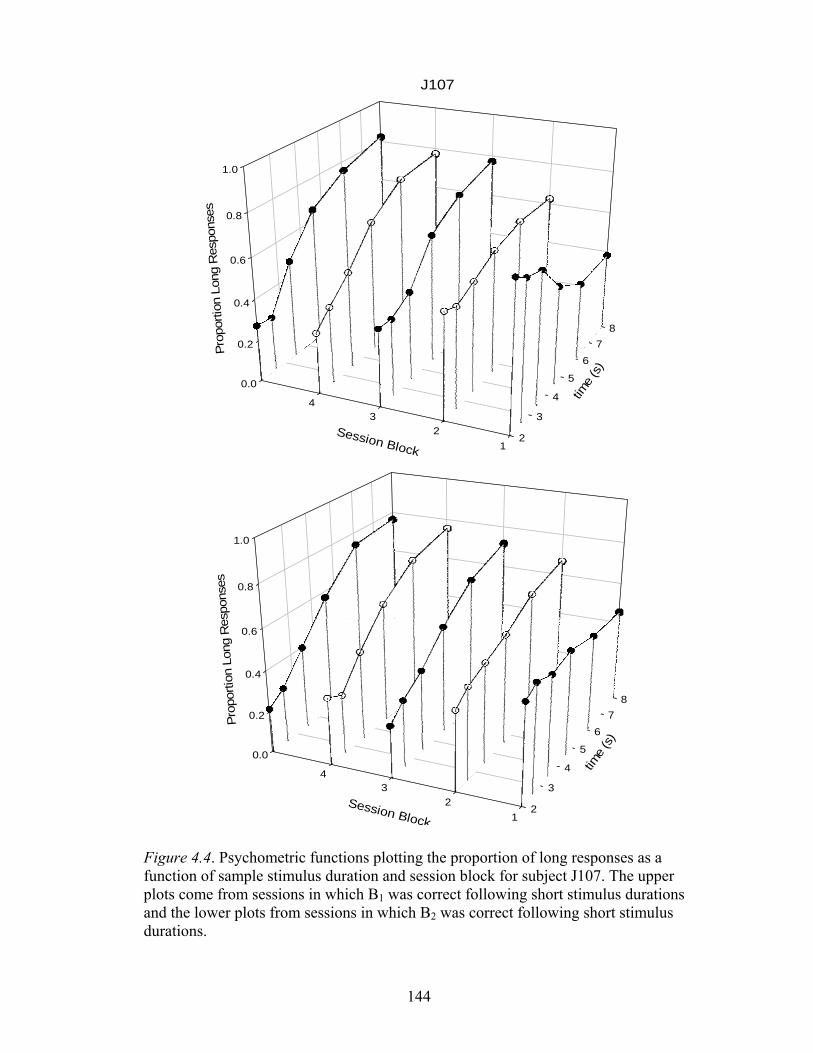
144
Figure 4.4. Psychometric functions plotting the proportion of long responses as a function of sample stimulus duration and session block for subject J107. The upper plots come from sessions in which B1 was correct following short stimulus durations and the lower plots from sessions in which B2 was correct following short stimulus durations.
0.0
0.2
0.4
0.6
0.8
1.0
2
3
4
5
67
8
12
34
Prop
ortio
n Lo
ng R
espo
nses
time
(s)
Session Block
J107
0.0
0.2
0.4
0.6
0.8
1.0
2
3
4
5
67
8
12
34
Prop
ortio
n Lo
ng R
espo
nses
time
(s)
Session Block
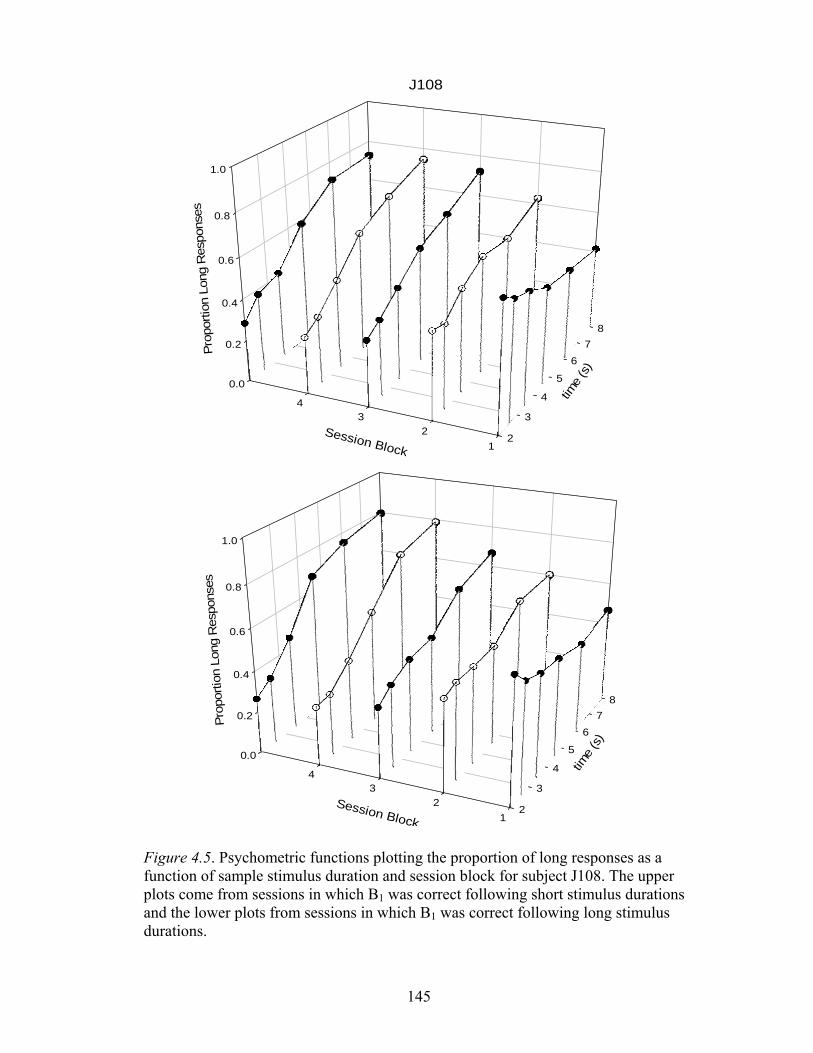
145
Figure 4.5. Psychometric functions plotting the proportion of long responses as a function of sample stimulus duration and session block for subject J108. The upper plots come from sessions in which B1 was correct following short stimulus durations and the lower plots from sessions in which B1 was correct following long stimulus durations.
0.0
0.2
0.4
0.6
0.8
1.0
2
3
4
5
67
8
12
34
Prop
ortio
n Lo
ng R
espo
nses
time
(s)
Session Block
J108
0.0
0.2
0.4
0.6
0.8
1.0
2
3
4
5
67
8
12
34
Prop
ortio
n Lo
ng R
espo
nses
time
(s)
Session Block
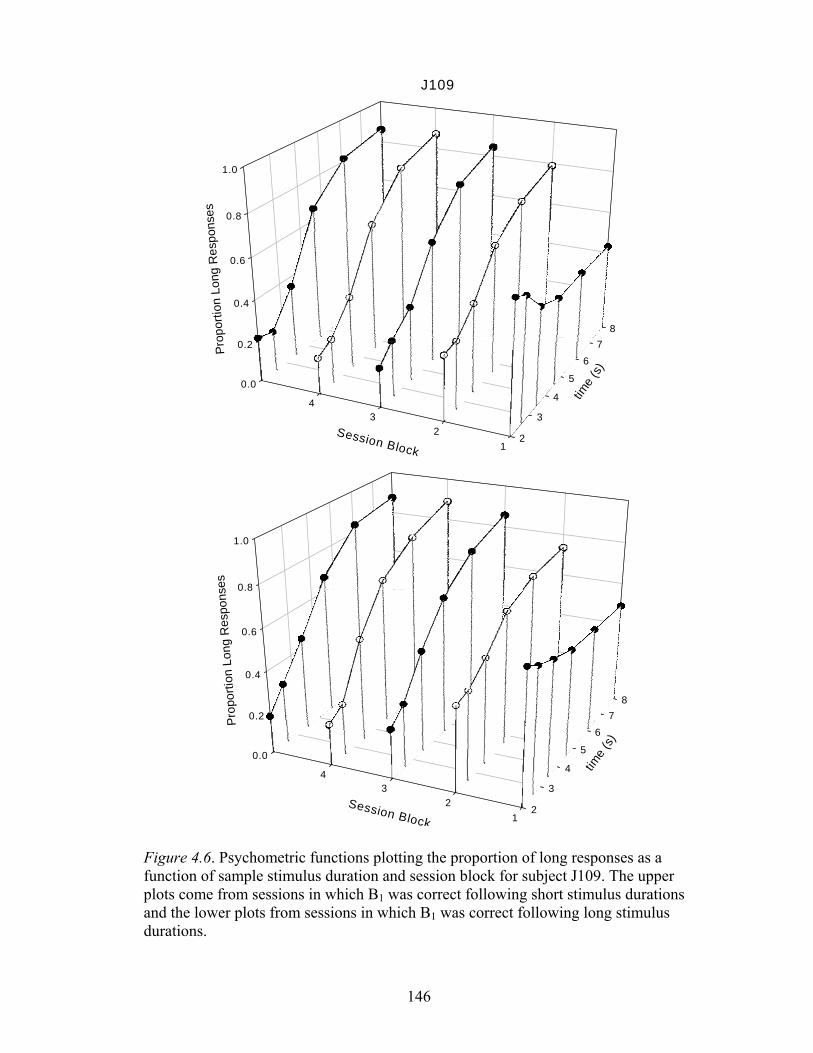
146
Figure 4.6. Psychometric functions plotting the proportion of long responses as a function of sample stimulus duration and session block for subject J109. The upper plots come from sessions in which B1 was correct following short stimulus durations and the lower plots from sessions in which B1 was correct following long stimulus durations.
0.0
0.2
0.4
0.6
0.8
1.0
2
3
4
5
67
8
12
34
Prop
ortio
n Lo
ng R
espo
nses
time
(s)
Session Block
J109
0.0
0.2
0.4
0.6
0.8
1.0
2
3
4
5
67
8
12
34
Prop
ortio
n Lo
ng R
espo
nses
time
(s)
Session Block
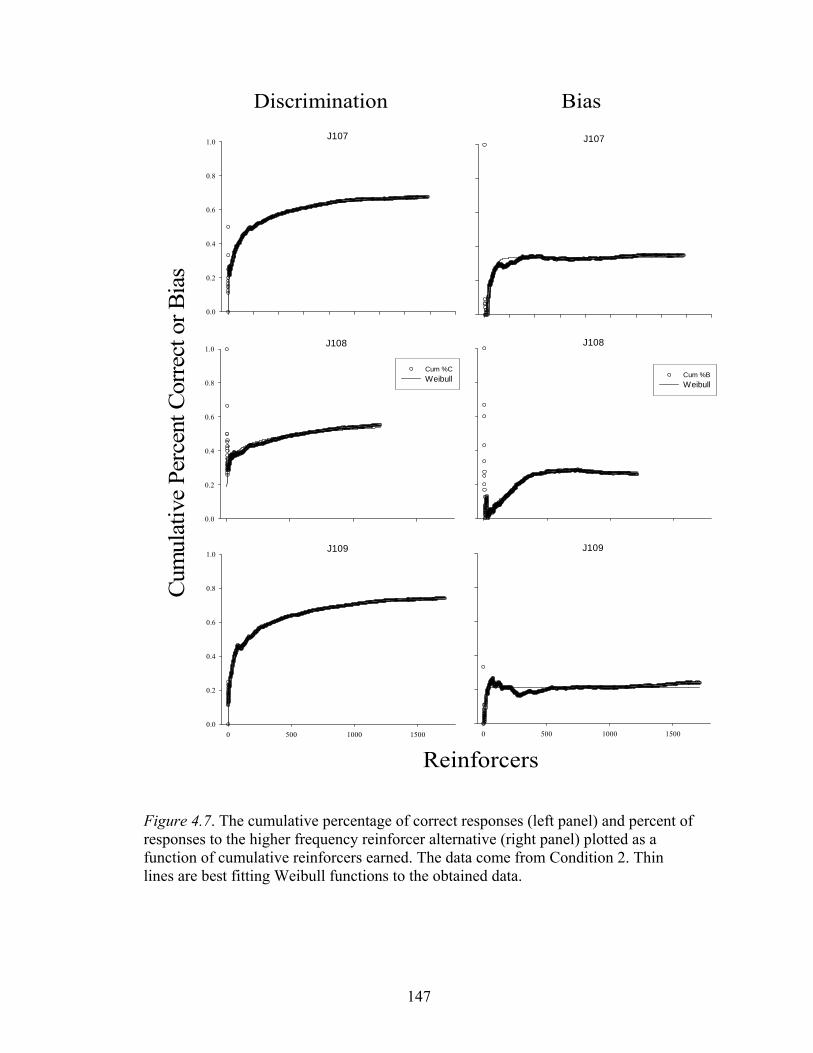
147
Figure 4.7. The cumulative percentage of correct responses (left panel) and percent of responses to the higher frequency reinforcer alternative (right panel) plotted as a function of cumulative reinforcers earned. The data come from Condition 2. Thin lines are best fitting Weibull functions to the obtained data.
Reinforcers
Cum
ulat
ive
Perc
ent C
orre
ct o
r Bia
s
Discrimination BiasJ107
0.0
0.2
0.4
0.6
0.8
1.0
J108
0.0
0.2
0.4
0.6
0.8
1.0
Cum %CWeibull
J109
0 500 1000 15000.0
0.2
0.4
0.6
0.8
1.0
J107
J108
Cum %BWeibull
J109
0 500 1000 1500
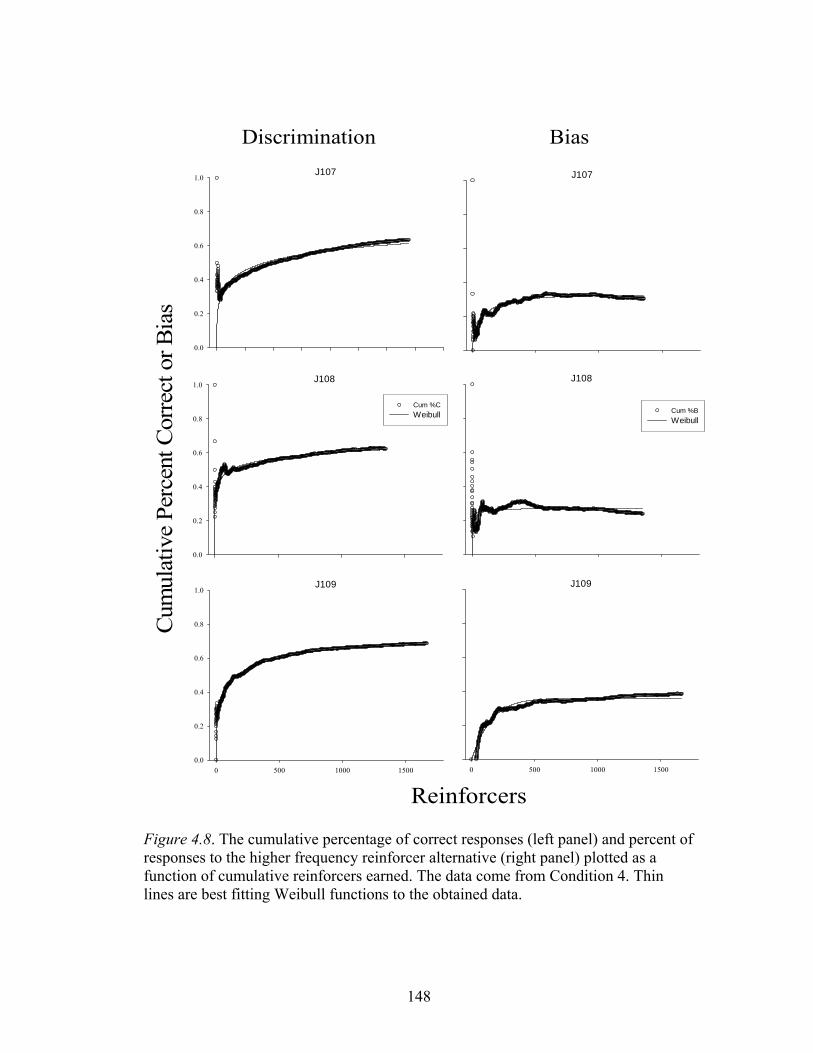
148
Figure 4.8. The cumulative percentage of correct responses (left panel) and percent of responses to the higher frequency reinforcer alternative (right panel) plotted as a function of cumulative reinforcers earned. The data come from Condition 4. Thin lines are best fitting Weibull functions to the obtained data.
Reinforcers
Cum
ulat
ive
Perc
ent C
orre
ct o
r Bia
sDiscrimination Bias
J107
0.0
0.2
0.4
0.6
0.8
1.0
J108
0.0
0.2
0.4
0.6
0.8
1.0
Cum %CWeibull
J109
0 500 1000 15000.0
0.2
0.4
0.6
0.8
1.0
J107
J108
Cum %BWeibull
J109
0 500 1000 1500
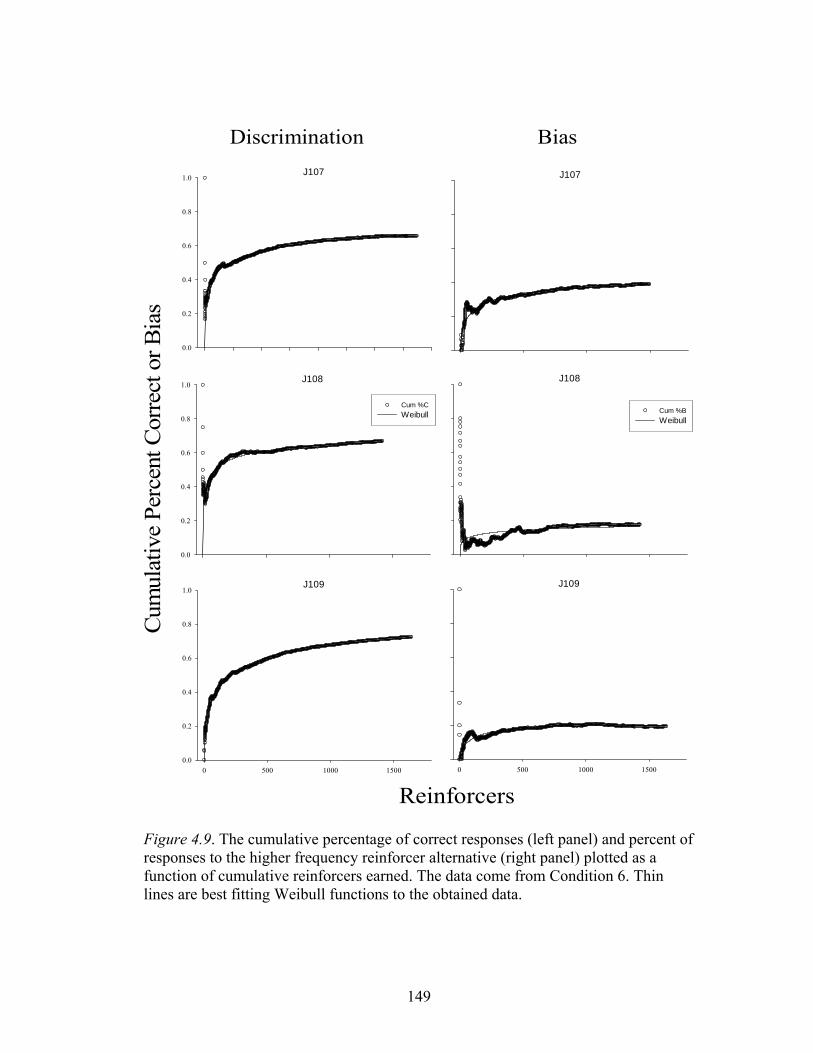
149
Figure 4.9. The cumulative percentage of correct responses (left panel) and percent of responses to the higher frequency reinforcer alternative (right panel) plotted as a function of cumulative reinforcers earned. The data come from Condition 6. Thin lines are best fitting Weibull functions to the obtained data.
Reinforcers
Cum
ulat
ive
Perc
ent C
orre
ct o
r Bia
sDiscrimination Bias
J107
0.0
0.2
0.4
0.6
0.8
1.0
J108
0.0
0.2
0.4
0.6
0.8
1.0
Cum %CWeibull
J109
0 500 1000 15000.0
0.2
0.4
0.6
0.8
1.0
J107
J108
Cum %BWeibull
J109
0 500 1000 1500

150
Figure 4.10. The probabilities of attending to the sample and comparison stimuli according the best fitting Weibull function to each subjects’ data. See text for further explanation.
J107
0.0
0.2
0.4
0.6
0.8
1.0
J108
0.0
0.2
0.4
0.6
0.8
1.0
p(As)p(Ac)
J109
0 2 4 6 8 10 12 14
0.0
0.2
0.4
0.6
0.8
1.0
Sessions Since Reversal
Prob
abili
ty o
f Atte
ndin
g
151
REFERENCES
Alsop, B. (1991). Behavioral models of signal detection and detection models of
choice.In M. L. Commons, J. A. Nevin, & M. C. Davison (Eds.), Signal
detection: Mechanisms, models, and applications (pp. 39-55). Hillsdale, NJ:
Erlbaum.
Alsop, B. (1998). Receiver operating characteristics from nonhuman animals: some
implications and directions for research with humans. Psychonomic Bulletin &
Review, 5 (2), 239-252.
Alsop, B. & Davison, M. (1991). Effects of varying stimulus disparity and the
reinforcer ratio in concurrent-schedule and signal-detection procedures.
Journal of the Experimental Analysis of Behavior, 56, 67-80.
Alsop, B. & Jones, B. M. (2008). Reinforcer control by comparison-stimulus color
and location in a delayed matching-to-sample task. Journal of the
Experimental Analysis of Behavior, 89, 311-331.
Alsop, B., & Rowley, R. (1996). Types of responding in a signal detection task.
Journal of the Experimental Analysis of Behavior, 65, 561-574.
Alsop, B. & Porritt, M. (2006). Discriminability and sensitivity to reinforcer
magnitude in a detection task. Journal of the Experimental Analysis of
Behavior, 85, 41-56.
Anderson, K. G., & Woolverton, W. L. (2000). Concurrent variable-interval drug
self-administration and the generalized matching law: A drug class
comparison. Behavioural Pharmacology, 11, 413–420.
Atkinson, R. C. A variable sensitivity theory of signal detection. Psychological
152
Review, 1963, 70, 91-106.
Barraclough, D. J., Conroy, M. L., & Lee, D. (2004). Prefrontal cortex and decision
making in a mixed strategy game. Nature Neuroscience, 7, 404–410.
Baum, W. M. (1974). On two types of deviation from the matching law: Bias and
undermatching. Journal of the Experimental Analysis of Behavior, 22, 231–
242.
Baum, W. M. (1979). Matching, undermatching, and overmatching in studies of
choice. Journal of the Experimental Analysis of Behavior, 32, 269–281.
Belke, T. W., & Heyman, G. M. (1994). Increasing and signaling background
reinforcement: Effect on the foreground response-reinforcer relation. Journal
of the Experimental Analysis of Behavior, 61, 65–81.
Berryman, R., Cumming, W. W., Cohen, L. R., & Johnson, D. F. (1965). Acquisition
and transfer of simultaneous oddity. Psychological Reports, 17, 767-775.
Blough, D. S. (1963). Interresponse time as a function of continuous variables: A new
method and some data. Journal of the Experimental Analysis of Behavior, 6,
237–246.
Blough, D. S. (1996). Error factors in pigeon discrimination and delayed matching.
Journal of Experimental Psychology: Animal Behavior Processes, 22, 118–
131.
Blough, D. S. (2004). Reaction time signatures of discriminative processes:
differential effects of stimulus similarity and incentive. Learning & Behavior,
32, 157-172.
Boren, J. Some variables affecting the superstitious chaining of responses. Journal of
153
the Experimental Analysis of Behavior, 1969, 12, 959-969.
Buckner, R. L., Green, L., & Myerson, J. (1993). Short-term and long-term effects of
reinforcers on choice. Journal of the Experimental Analysis of Behavior, 59,
293–307.
Burnham, K. P., & Anderson, D. R. (2002). Model selection and multimodel
inference: A practical information-theoretic approach (2nd. Ed.). New York:
Springer-Verlag.
Bush, R. R., Galanter, E., & Luce, R. D. (1963). Characterization and classification of
choice experiments. In R. D. Luce, R. R. Bush, & E. Galanter (Eds.),
Handbook of Mathematical Psychology. (Vol. 1, pp. 77-102). New York:
Wiley.
Bush, R. R., Luce, R. D., & Rose, R. M. (1964). Learning models for psychophysics.
In R. C. Atkinson (Ed.), Studies in mathematical psychology. (pp. 201-217)
Stanford: Stanford University Press.
Bush, R. R., & Mosteller, F. (1955). Stochastic models for learning. New
York: Wiley.
Catania, A. C. (1963a). Concurrent performances: reinforcement interaction and
response independence. Journal of the Experimental Analysis of Behavior, 6,
253-263.
Catania, A. C. (1963b). Concurrent performances: a baseline for the study of
reinforcement magnitude. Journal of the Experimental Analysis of Behavior,
6, 299-300.
Catania, A. C. (1966). Concurrent operants. In W. K. Honig (Ed.), Operant behavior:
154
areas of research and application. (pp. 213-270). New York: Appleton-
Century-Crofts.
Catania, A. C. (1998). Learning. New Jersey: Prentice-Hall.
Catania, A. C., & Reynolds, G. S. (1968). A quantitative analysis of the responding
maintained by interval schedules of reinforcement. Journal of the
Experimental Analysis of Behavior, 11, 327–383.
Christensen, D. R., & Grace, R. C. (2008). Rapid acquisition in concurrent chains:
effects of initial-link duration. Behavioural Processes, 78, 217–223.
Christensen, D. R., & Grace, R. C. (2009). Response allocation in concurrent chains
when terminal-link delays follow an ascending and descending series. Journal
of the Experimental Analysis of Behavior, 91, 1-20.
Cross, D. V. (1973). Sequential dependencies and regression in psychophysical
judgments. Perception & Psychophysics, 14, 547-552.
Davison, M. C. (1991). Stimulus discriminability, contingency discriminability, and
complex stimulus control. In M. L. Commons, J. A. Nevin, & M. C. Davison
(Eds.), Signal detection: Mechanisms, models, and applications (pp. 57-78).
Davison, M. (1996). Stimulus effects on behavior allocation in three-alternative
choice. Journal of the Experimental Analysis of Behavior, 66, 149-168.
Davison, M. (1998). Experimental design: problems in understanding the dynamical
behavior-environmental system. The Behavior Analyst, 21, 219-240.
Davison, M. & Baum, W. M. (2000). Choice in a variable environment: every
reinforcer counts. Journal of the Experimental Analysis of Behavior, 74, 1-24.
Davison, M. & Baum, W. M. (2002). Choice in a variable environment: effects of
155
blackout duration and extinction between components. Journal of the
experimental Analysis of Behavior, 77, 65-89.
Davison, M., & Baum, W. M. (2003). Every reinforcer counts: Reinforcer magnitude
and local preference. Journal of the Experimental Analysis of Behavior, 80,
95–129.
Davison, M., & Baum, W. M. (2007). Local effects of delayed food. Journal of
the Experimental Analysis of Behavior, 87, 241–260.
Davison, M., & Jenkins, P. E. (1985). Stimulus discriminability, contingency
discriminability, and schedule performance. Animal Learning & Behavior, 13,
77–84.
Davison, M., & McCarthy, D. (1988). The matching law: A research review.
Hillsdale, NJ: Erlbaum.
Davison, M., & McCarthy, D. (1987). The interaction of stimulus and reinforcer
control in complex temporal discrimination. Journal of the Experimental
Analysis of Behavior,48, 97–116.
Davison, M. & McCarthy, D. (1989). Effects of relative reinforcer frequency on
Complex color detection, Journal of the Experimental Analysis of Behavior,
51, 291-315.
Davison, M. & McCarthy, D. (1994). Effects of the discriminability of alternatives in
three-alternative concurrent-schedule performance. Journal of the
Experimental Analysis of Behavior, 61, 45-63.
Davison, M. & Nevin, J. A. (1999). Stimuli, reinforcers, and behavior: An
integration. Journal of the Experimental Analysis of Behavior, 71, 439-482.
156
Davison, M. C. & Tustin, R. D. (1978). The relation between the generalized
matching law and signal-detection theory. Journal of the Experimental
Analysis of Behavior, 29, 331-336.
Diederich, A. & Busemeyer, J. R. (2006). Modeling the effects of payoff on response
bias in a perceptual discrimination task: bound-change, drift-change, or two-
stage-processing hypothesis. Perception & Psychophysics, 68(2), 194-207.
Dinsmoor, J. A. (1983). Observing and conditioned reinforcement. Behavioral and
Brain Sciences, 6, 693–728.
Dinsmoor, J. A. (1985). The role of observing and attention in establishing stimulus
control. Journal of the Experimental Analysis of Behavior, 43, 365–381.
Dinsmoor, J. A. (1995). Stimulus control: Part I. Behavior Analyst, 18, 51–68.
Dinsmoor, J. A., Browne, M. P., & Lawrence, C. E. (1972). A test of the negative
discriminative stimulus as a reinforcer of observing. Journal of the
Experimental Analysis of Behavior, 18, 79–85.
Dinsmoor, J. A., Bowe, C. A., Dout, D. L., Martin, L. T., Mueller, K. L., &
Workman, J. D. (1983). Separating the effects of salience and disparity on the
rate of observing. Journal of the Experimental Analysis of Behavior, 40, 253-
264.
Dinsmoor, J. A., Mueller, K. L., Martin, L. T., & Bowe, C. A. (1982). The acquisition
of observing. Journal of the Experimental Analysis of Behavior, 38, 249-263.
Dube, W. V., & Mcllvane, W. J. (2002). Quantitative assessments of sensitivity to
reinforcement contingencies in mental retardation. American Journal on
Mental Retardation, 107, 136-145.
157
Dube, W. V., McIlvane, W. J., Mazzitelli, K., & McNamara, B. (2003). Reinforcer
rate effects and behavioral momentum in individuals with developmental
disabilities. American Journal of Mental Retardation, 108, 134–143.
Dusoir, A. E. (1975). Treatments of bias in detection and recognition models: A
review. Perception & Psychophysics, 17, 167–178.
Edhouse, W. V., & White, K. G. (1988). Sources of proactive interference in animal
memory. Journal of Experimental Psychology: Animal Behavior Processes,
14, 56–71.
Elliffe, D., Davison, M., & Landon, J. (2008). Relative reinforcer rates and
magnitudes do not control concurrent choice independently. Journal of the
Experimental Analysis of Behavior, 90, 169-185.
Fantino, E. (1977). Conditioned reinforcement: Choice and information. In W. K.
Honig & J. E. R. Staddon (Eds.), Handbook of operant behavior (pp. 313–
339). Englewood Cliffs, NJ: Prentice-Hall.
Fantino, E., & Royalty, P. (1987). A molecular analysis of choice on concurrent-
chains schedules. Journal of the Experimental Analysis of Behavior, 48, 145–
159.
Ferster, C. B. & Skinner, B. F. (1957). Schedules of reinforcement. New York:
Appleton-Century-Crofts.
Findley, J. D. (1958). Preference and switching under concurrent scheduling. Journal
of the Experimental Analysis of Behavior, 1, 123–144.
Friedman, M. P. & Carterette, E. C. (1964). Detection of Markovian sequences of
signals. Journal of the Acoustical Society of America, 36, 2334-2339

158
Gallistel, C. R., Mark, T. A., King, A. P., & Latham, P. (2001). The rat approximates
an ideal detector of changes in rates of reward: Implications for the law of
effect. Journal of Experimental Psychology: Animal Behavior Processes, 27,
354–372.
Gallistel, C. R., Balsam, P. D., & Fairhurst, S. (2004). The learning curve:
Implications of a quantitative analysis. Proceedings of the National Academy
of Sciences, 101, 13124–13131.
Gibbon, J. (1977). Scalar expectancy theory and Weber's law in animal timing.
Psychological Review, 84, 279-325.
Glimcher, P. W. (2002). Decisions, decisions, decisions: Choosing a biological
science of choice. Neuron, 36, 323–332.
Glimcher, P.W. (2003) The neurobiology of visual saccadic decision making. Annual
Review of Neuroscience, 26, 133-179.
Glimcher, P.W. and Rustichini, A. (2004). Neuroeconomics: The concilience of brain
and decision. Science, 306, 447-452.
Godfrey, R & Davison, M. (1999). The effects of number of sample stimuli and
number of choices in a detection task on measures of discriminability.
Journal of the Experimental Analysis of Behavior, 72, 33–55.
Gold, J. I. & Shadlen, M. N. (2007). The neural basis of decision making. Annual
Review of Neuroscience, 30, 535-574.
Grace, R. C. (1994). A contextual model of concurrent chains choice. Journal of the
Experimental Analysis of Behavior, 61, 113–129.
Grace, R. C. (1999). The matching law and amount-dependent exponential
159
discounting as accounts of self control choice. Journal of the Experimental
Analysis of Behavior, 71, 27–44.
Grace, R. C. (2002a). Acquisition of preference in concurrent chains: Comparing
linear-operator and memory-representational models. Journal of Experimental
Psychology: Animal Behavior Processes, 28, 257–276.
Grace, R. C. (2002b). The value hypothesis and acquisition of preference in
concurrent chains. Animal Learning & Behavior, 30, 21–33.
Grace, R. C., Bragason, O., & McLean, A. P. (2003). Rapid acquisition of preference
in concurrent chains. Journal of the Experimental Analysis of Behavior, 80,
235–252.
Grace, R. C., & McLean, A. P. (2006). Rapid acquisition in concurrent chains:
Evidence for a decision model. Journal of the Experimental Analysis of
Behavior, 85, 181–202.
Grace, R. C., & Nevin, J. A. (1997). On the relation between preference and
resistance to change. Journal of the Experimental Analysis of Behavior, 67,
43–65.
Grant, D. S. (1975). Proactive interference in pigeon short-term memory. Journal of
Experimental Psychology: Animal Behavior Processes, 104, 207–220.
Green, D. M. (1960). Psychoacoustics and detection theory. Journal of the Acoustical
Society of America, 32, 1189-1203.
Green, D. M., & Swets, J. (1966). Signal detection theory and psychophysics. New
York: Wiley.
Guttman, N. & Kalish, H. I. (1956). Discriminability and stimulus generalization.
160
Journal of Experimental Psychology, 51, 79-88.
Heinemann, E. G., Avin, E., Sullivan, M. A., & Chase, S. (1969). Analysis of
stimulus generalization with a psychophysical method. Journal of
Experimental Psychology, 80, 215-224.
Heinemann, E. G., & Avin, E. (1973). On the development of stimulus control.
Journal of the Experimental Analysis of Behavior, 20, 183–195
Herrnstein, R. J. (1961). Relative and absolute strength of response as a function of
frequency of reinforcement. Journal of the Experimental Analysis of
Behavior, 4, 267–272.
Herrnstein, R. J. (1964). Aperiodicity as a factor in choice. Journal of the
Experimental Analysis of Behavior, 7, 179–182.
Herrnstein, R. J. (1970). On the law of effect. Journal of the Experimental Analysis of
Behavior, 13, 243–266.
Hineline, P. N. (1992). A self-interpretive behavior analysis. American Psychologist,
47, 1274-1286.
Hogan, D. E., Edwards, C. A., & Zentall, T. R. (1981). Delayed matching in the
pigeon: Interference produced by the prior delayed matching trial. Animal
Learning & Behavior, 9, 395–400.
Honig, W. K., & Urcuioli, P. J. (1981). The legacy of Guttman and Kalish (1956): 25
years of research on stimulus generalization. Journal of the Experimental
Analysis of Behavior, 36, 405-445.
Hull, C. L. (1950). Simple qualitative discrimination learning. Psychological Review,
57, 303-313.
161
Hunter, I. & Davison, M. (1985). Determination of a behavioral transfer function:
White-noise analysis of session-to-session response-ratio dynamics on
concurrent VI VI schedules. Journal of the Experimental Analysis of
Behavior, 43, 43-59.
Johansen, E. B., Killeen, P. R., Russell, V., Tripp, G., Wickens, J.R., Tannock, R.,
Williams, J., & Sagvolden, T. (2009). Origins of altered reinforcement effects
in ADHD. Behavioral and Brain Functions, 5:7.
Johnston, J. M., & Pennypacker, H. S. (1993). Strategies and tactics of behavioral
research (2nd ed.). Hillsdale, NJ: Erlbaum.
Jones, B. M. (2003). Quantitative analyses of matching-to-sample performance.
Journal of the Experimental Analysis of Behavior, 79, 323–350.
Jones, B. M., & Davison, M. C. (1998). Reporting contingencies of reinforcement in
concurrent schedules. Journal of the Experimental Analysis of Behavior, 69,
161–183.
Kac, M. (1962). A note on learning signal detection. I.R.E. Transactions on
Information Theory, IT-8, 126-1 28.
Killeen, P. R., Hall, S. S., Reilly, M. P., & Kettle, L. C. (2002). Molecular analyses of
the principal of response strength. Journal of the Experimental Analysis of
Behavior, 78, 127-160.
Killeen, P. (1970). Preference for fixed-interval schedules of reinforcement. Journal
of the Experimental Analysis of Behavior, 14, 127–131.
Killeen, P. (1972). The matching law. Journal of the Experimental Analysis of
Behavior, 17, 489-495.
162
Killeen, P. R. (1992). Mechanics of the animate. Journal of the Experimental
Analysis of Behavior, 57, 429-463.
Killeen, P. R. (1994). Mathematical principles of reinforcement. Behavioral and
Brain Sciences, 17, 105-172.
Killeen, P. R. (2001). Writing and overwriting short-term memory. Psychonomic
Bulletin & Review, 8(1), 18-43.
Killeen, P. R., & Weiss, N. (1987). Optimal timing and the Weber function.
Psychological Review, 94, 455-468.
Killeen, P., & Fetterman, J. G. (1988). A behavioral theory of timing. Psychological
Review, 95, 274–295.
Krägeloh, C. U., Davison, M., & Elliffe, D. M. (2005). Local preference in concurrent
schedules: The effects of reinforcer sequences. Journal of the Experimental
Analysis of Behavior, 84, 37–64.
Krägeloh, C. U., Elliffe, D. M., & Davison, M. (2006). Contingency discriminability
and peak shift in concurrent schedules. Journal of the Experimental Analysis
of Behavior, 86, 11-30
Kyonka, E. G. E., & Grace, R. C. (2007). Pigeons’ choice and timing behavior in a
rapid acquisition concurrent- chains procedure. Journal of Experimental
Psychology: Animal Behavior Processes, 33, 392–408.
Kyonka, E. G. E., & Grace, R. C. (2008). Rapid acquisition of preference in
concurrent chains when alternatives differ on multiple dimensions of
reinforcement. Journal of the Experimental Analysis of Behavior, 89, 49–69.
Landon, J., Davison, M., & Elliffe, D. (2002). Concurrent schedules: Short- and long-
163
term effects of reinforcers. Journal of the Experimental Analysis of Behavior,
77, 257–271.
Landon, J., Davison, M., & Elliffe, D. (2003). Choice in a variable environment:
Effects of unequal reinforcer distributions. Journal of the Experimental
Analysis of Behavior, 80, 187–204.
Laties, V. G., Weiss, B., & Weiss, A. B. (1969). Further observation of ‘‘overt’’
mediating behavior and the discrimination of time. Journal of the
Experimental Analysis of Behavior, 12, 43–57.
Lie, C. & Alsop, B. (2007). Reinforcement and punishment in behavioral models of
signal detection. Mexican Journal of Behavior Analysis, 33, 45-55.
Laming, D. (1968). Information theory of choice reaction times. New York:
Academic Press.
Link, S. W., & Heath, R. A. (1975). A sequential theory of psychological
discrimination. Psychometrika, 40, 77-105.
Link, S. W. (1992). The wave theory of difference and similarity. Hillsdale, NJ:
Erlbaum.
Luce, R. D. (1986). Response times. New York: Oxford University Press.
Lobb, B., & Davison, M. C. (1975). Performance in concurrent interval schedules: A
systematic replication. Journal of the Experimental Analysis of Behavior, 24,
191-197.
Luce, R. D. (1959). Individual choice behavior. New York: Wiley.
Luce, R. D. (1963a). Detection and recognition. In R. D. Luce, R. R. Bush, & E.
Galanter (Eds.), Handbook of Mathematical Psychology. (Vol. 1, pp. 103-
164
190). New York: Wiley.
Luce, R. D. (1963b) A threshold theory for simple detection experiments.
Psychological Review, 70, 61-79.
Luce, R. D. (1964). Asymptotic learning in psychophysical theories. British Journal
of Statistical Psychology, 17, 1-14.
Luce, R. D. (1986). Response times: Their role in inferring elementary mental
organization. New York: Oxford University Press.
Luce, R. D. & Galanter, E. (1963a). Discrimination. In R. D. Luce, R. R. Bush, & E.
Galanter (Eds.), Handbook of Mathematical Psychology. (Vol. 1, pp. 191-
244). New York: Wiley.
Luce, R. D. & Galanter, E. (1963b). Psychophysical Scaling. In R. D. Luce, R. R.
Bush, & E. Galanter (Eds.), Handbook of Mathematical Psychology. (Vol. 1,
pp. 245-308). New York: Wiley.
Luce, R. D., & Green, D. M. (1974). Detection, Discrimination, and recognition. In E.
C. Carterette & M. P. Friedman (Eds.), Handbook of perception, Vol. 2. New
York: Academic Press.
Macmillan, N. A., & Creelman, C. D. (1991). Detection theory: A user's guide.
Cambridge, England: Cambridge University Press.
Mace, F. C., Mauro, B. C., Boyajian, A. E., & Eckert, T. L. (1997). Effects of
reinforcer quality on behavioral momentum: Coordinated applied and
basic research. Journal of Applied Behavior Analysis, 30, 1-20.
Mazur, J. E. (1992). Choice behavior in transition: Development of preference with
ratio and interval schedules. Journal of Experimental Psychology: Animal

165
Behavior Processes, 18, 364–378.
Mazur, J. E. (1995). Development of preference and spontaneous recovery in choice
behavior with concurrent variable-interval schedules. Animal Learning
and Behavior, 23, 93–103.
Mazur, J. E. (1996). Past experience, recency, and spontaneous recovery in choice
behavior. Animal Learning and Behavior, 24, 1–10.
Mazur, J. E. (1997). Effects of rate of reinforcement and rate of change on choice
behavior in transition. Quarterly Journal of Experimental Psychology, 50B,
111–128.
Mazur, J. E. (2001). Hyperbolic value addition and general models of animal choice.
Psychological Review, 108, 96–112.
Mazur, J. E., & Hastie, R. (1978). Learning as accumulation: A reexamination of the
learning curve. Psychological Bulletin, 85, 1256-1274.
Mazur, J. E., Blake, N., & McManus, C. (2001). Transitional choice behavior in
concurrent-chain schedules. Behavioural Processes, 53, 171–180.
McCarthy, D., & Davison, M. (1979). Signal probability, reinforcement, and signal
detection. Journal of the Experimental Analysis of Behavior, 32, 373–386.
McCarthy, D., & Davison, M. (1980a). Independence of sensitivity to relative
reinforcement rate and discriminability in signal detection. Journal of the
Experimental Analysis of Behavior, 34, 273–284.
McCarthy, D., & Davison, M. (1980b). On the discriminability of stimulus duration.
Journal of the Experimental Analysis of Behavior, 33, 187–211.
McCarthy, D. C., & Davison, M. C. (1981a). Towards a behavioral theory of bias in
166
signal detection. Perception & Psychophysics, 29, 371-382.
McCarthy, D. C., & Davison, M. C. (1981b). Matching and signal detection. In M. L.
Commons & J. A. Nevin (Eds.), Quantitative analyses of behavior: Vol. 1.
Discriminative properties of reinforcement schedules (pp. 393 – 417).
Cambridge, MA: Ballinger.
McCarthy, D., & Davison, M. (1984). Isobias and alloiobias in animal psychophysics.
Journal of Experimental Psychology: Animal Behavior Processes, 10, 390–
409.
McDowell, J. J. (1981). On the validity and utility of Herrnstein's hyperbola in
applied behavior analysis. In C. M. Bradshaw, E. Szabadi, & C. F. Lowe
(Eds.), Quantification of steady-state operant behaviour (pp. 311-324).
Amsterdam: Elsevier/North-Holland.
McDowell, J. J. (1982). The importance of Herrnstein's mathematical statement of the
law of effect for behavior therapy. American Psychologist, 37, 771-779.
McGill, W. J. (1963). Stochastic latency mechanisms. In R. R. Bush & E. Galanter
(Eds.), Handbook of mathematical psychology. (Vol. 1, pp. 309–360). New
York: Wiley.
Mcllvane, W. J., & Dube, W. V. (2003). Stimulus control topography coherence
theory: foundations and extensions. The Behavior Analyst, 26, 195-213.
McIlvane, W. J., Dube, W. V., & Callahan, T. D. (1996). Attention: A behavioral
analytic perspective. In G. R. Lyon & N. A. Krasnegor (Eds.), Attention,
memory, and executive function (pp. 97–117). Baltimore, MD: Paul H.
Brookes.
167
Menlove, R. L. (1975). Local patterns of responding maintained by concurrent and
multiple schedules. Journal of the Experimental Analysis of Behavior, 23,
309–337.
Miller, J. T., Saunders, S. S., & Bourland, G. (1980). The role of stimulus disparity in
concurrently available reinforcement schedules. Animal Learning &Behavior,
8, 635–641.
Myers, D. L. & Myers, L. E. (1977). Undermatching: A reappraisal of performance
on concurrent variable-interval schedules of reinforcement. Journal of the
Experimental Analysis of Behavior, 27, 203-214.
Nelson, K. R., & Wasserman, E. A. (1978). Temporal factors influencing the pigeon's
successive matching-to-sample performance: Sample duration, intertrial
interval and retention interval. Journal of the Experimental Analysis of
Behavior, 30, 153-162.
Nevin, J. A. (1969). Signal detection theory and operant behavior: A review of David
M. Green and John A. Swets’ Signal Detection Theory and Psychophysics.
Journal of the Experimental Analysis of Behavior, 12, 475–480.
Nevin, J. A. (1981). Psychophysics and reinforcement schedules: An integration. In
M. L. Commons & J. A. Nevin (Eds.), Quantitative analyses of behavior: Vol.
1. Discriminative properties of reinforcement schedules (pp. 3 – 27).
Cambridge, MA: Ballinger.
Nevin, J. A. (1984). Quantitative analysis. Journal of the Experimental Analysis of
Behavior, 42, 421-434.
Nevin, J. A. (1992). An integrative model for the study of behavioral momentum.
168
Journal of the Experimental Analysis of Behavior, 57, 301–316.
Nevin, J. A., Jenkins, P., Whittaker, S., & Yarensky, P. (1982). Reinforcement
contingencies and signal detection. Journal of the Experimental Analysis of
Behavior,37, 65–79.
Nevin, J. A., Mandell, C. & Atak, J. R. (1983). The analysis of behavioral
momentum. Journal of the Experimental Analysis of Behavior 39:49–59.
Nevin, J. A., Olson, K., Mandell, C., & Yarensky, P. (1975). Differential
reinforcement and signal detection. Journal of the Experimental Analysis of
Behavior, 24, 355–367.
Nevin, J. A., & Grace, R. C. (2000). Behavioral momentum and the law of effect.
Behavioral and Brain Sciences, 23, 73–130.
Nevin, J. A., Milo, J., Odum, A. L., & Shahan, T. A. (2003). Accuracy of
discrimination, rate of responding, and resistance to change. Journal of the
Experimental Analysis of Behavior, 79, 307–321.
Nevin, J. A., Davison, M., & Shahan, T. A. (2005). A theory of attending and
reinforcement in conditional discriminations. Journal of the Experimental
Analysis of Behavior, 84, 281–303.
Norman, D. A. (1963). Sensory thresholds and response bias. Journal of the
Acoustical Society of America, 35, 1432-1441.
Palmer, J., Huk, A. C., &Shadlen, M. N. (2005). The effect of stimulus strength on
the speed and accuracy of a perceptual decision. Journal of Vision, 5, 376–
404.
Palya, W. L. (1992). Dynamics in the fine structure of schedule-controlled behavior.
169
Journal of the Experimental Analysis of Behavior, 57, 267–287.
Pearce, J. M. & Bouton, M. E. (2001). Theories of associative learning in animals.
Annual Review of Psychology, 52, 111-139.
Pitt, M. A. & Myung, I. J. (2003). When a good fit can be bad. Trends in Cognitive
Sciences, 16 (10), 421-425.
Pierce, W. D., & Epling, W. F. (1995). The applied importance of research on the
matching law. Journal of Applied Behavior Analysis, 28, 237-241.
Pliskoff, S. S., Shull, R. L., and Gollub, L. R. (1968). The relation between response
rates and reinforcement rates in a multiple schedule. Journal of the
Experimental Analysis of Behavior, 11, 271-284.
Rachlin, H. (1971). On the tautology of the matching law. Journal of the
Experimental Analysis of Behavior, 15, 249–251.
Rachlin, H., & Green, L. (1972). Commitment, choice and self-control. Journal of the
Experimental Analysis of Behavior, 17, 15–22.
Ratcliff, R., & Smith, P. L. (2004). A comparison of sequential sampling models for
two-choice reaction time. Psychological Review, 111, 333-367.
Rescorla, R. A., & Wagner, A. R. (1972). A theory of Pavlovian conditioning:
Variations in the effectiveness of reinforcement and nonreinforcement.
In A. H. Black & W. F. Prokasy (Eds.), Classical conditioning: II. Current
research and theory (pp. 64–99). New York: Appleton-Century-Crofts.
Richelle, M., & Lejeune, H. (Eds.). (1980). Time in animal behaviour. London:
Pergamon Press.
Roberts, W. A. (1980). Distribution of trials and intertrial retention in delayed
170
matching to sample with pigeons. Journal of Experimental Psychology:
Animal Behavior Processes, 6, 217-237.
Roberts, W. A., & Grant, D. S. (1976). Studies of short-term memory in the pigeon
using the delayed matching to sample procedure. In D. L. Medin, W. A.
Roberts, & R. T. Davis (Eds.), Processes of animal memory (pp. 79–112).
Hillsdale, NJ: Erlbaum.
Roberts, W. A., & Kraemer, P. J. (1982). Some observations of the effects of intertrial
interval and delay on delayed matching to sample in pigeons. Journal of
Experimental Psychology: Animal Behavior Processes, 8, 342–353.
Roitblat, H. L., & Scopatz, R. A. (1983). Sequential effects in pigeon delayed
matching-to-sample performance. Journal of Experimental Psychology:
Animal Behavior Processes, 9, 202-221.
Senders, V. L., & Sowards, A. (1952). Analysis of response sequences in the setting
of a psychophysical experiment. The American Journal of Psychology, 65,
358-374.
Sagvolden, T., Johansen, E. B., Aase, H., & Russell, V. A. (2005). A dynamic
Developmental theory of Attention-Deficit/Hyperactivity Disorder (ADHD)
predominantly hyperactive/impulsive and combined subtypes. Behavioral and
Brain Sciences, 28, 397-419.
Schaal, D. W., Odum, A. L., & Shahan, T. A. (2000). Pigeons may not remember the
stimuli that reinforced their behavior. Journal of the Experimental Analysis of
Behavior, 73, 125–139.
Schultz, W. (1998). Predictive reward signal of dopamine neurons. Journal of
171
Neurophysiology, 80, 1–27.
Schultz, W. (2002). Getting formal with dopamine and reward. Neuron, 36, 241-263.
Schultz, W. (2004). Neural coding of basic reward terms of animal learning theory,
game theory, microeconomics and behavioural ecology. Current Opinion in
Neurobiology, 14, 139–147.
Schultz, W. (2006). Behavioral theories and the neurophysiology of reward. Annual
Review of Psychology, 57, 87-115.
Schultz, W. (2007). Behavioral dopamine signals. Trends in Neurosciences, 30, 203-
210.
Schultz, W., Dayan, P., & Montague, P. R. (1997). A neural substrate of prediction
and reward. Science, 275, 1593–1599.
Schultz, W., & Dickinson, A. (2000). Neuronal coding of prediction errors. Annual
Review of Neuroscience, 23, 473-500.
Schoeffler, M. S. (1965). Theory for psychophysical learning. Journal of the
Acoustical Society of America, 37, 1124-1 133.
Schofield, G., & Davison, M. (1997). Nonstable concurrent choice in pigeons.
Journal of the Experimental Analysis of Behavior, 68, 219–232.
Shahan, T. A. (2002). Observing behavior: Effects of rate and magnitude of primary
reinforcement. Journal of the Experimental Analysis of Behavior, 78, 161–
178.
Shahan, T. A., Podlesnik, C. A., & Jimenez-Gomez, C. (2006). Matching and
conditioned reinforcement rate. Journal of the Experimental Analysis of
Behavior, 85, 167–180.
172
Shepard, R. N. (1957). Stimulus and response generalization: a stochastic model
relating generalization to distance in psychological space. Psychometrika, 22,
325-345.
Shepard, R. N. (1958a). Stimulus and response generalization: deduction of the
generalization gradient from a trace model. Psychological Review, 65, 242-
256.
Shepard, R. N. (1958b). Stimulus and response generalization: tests of a model
relating generalization to distance in psychological space. Journal of
Experimental Psychology, 55, 509-523.
Shipley, E. F. (1961). Dependence of successive judgments in detection tasks:
Correctness of the response. Journal of the Acoustical Society of America,
1961, 33, 1142-1143.
Shull, R. L. (1991). Mathematical description of operant behavior: An introduction.
In I. H. Iversen & K. A. Lattal (Eds.), Experimental analysis of behavior (Vol.
2, pp. 243–282). New York: Elsevier.
Shull, R. L. (1999). Editorial: Behavior Analysis and Signal-detection Theory.
Journal of the Experimental Analysis of Behavior, 71, 438–438.
Shull, R. L., Gaynor, S. T., & Grimes, J. A. (2001). Response rate viewed as
engagement bouts: Effects of relative reinforcement and schedule type.
Journal of the Experimental Analysis of Behavior, 75, 247–274.
Sidman, M. (1960). Tactics of scientific research. New York: Basic Books.
Sidman, M., & Stoddard, L. T. (1967). The effectiveness of fading in programming a
simultaneous form discrimination for retarded children. Journal of the
173
Experimental Analysis of Behavior, 10, 3-15.
Skinner, B. F. (1957). Science and human behavior. New York: Macmillan.
Stokes, T.F. & Baer, D. M. (1977). An implicit technology of generalization. Journal
Of Applied Behavior Analysis, 10, 349-367.
Staddon, J. E. R., & Simmelhag, V. L. (1971). The ‘‘superstition’’ experiment: A re-
examination of its implications for the principles of adaptive behavior.
Psychological Review, 78, 3–43.
Stubbs, D. A. (1976). Response bias and the discrimination of stimulus duration.
Journal of the Experimental Analysis of Behavior, 25, 243-250.
Stubbs, D., & Pliskoff, S. S. (1969). Concurrent responding with fixed relative rate of
reinforcement. Journal of the Experimental Analysis of Behavior, 12,
887–895.
Sugrue, L. P., Corrado, G. S., & Newsome, W. T. (2004, June 18). Matching behavior
and the representation of value in parietal cortex. Science, 304, 1782–1787.
Sugrue, L. P., Corrado, G. S., & Newsome, W. T. (2005). Choosing the greater of two
goods: Neural currencies for valuation and decision making. Nature Reviews
in Neuroscience, 6, 363–375
Swets, J. A. (1986a). Indices of discrimination or diagnostic accuracy: Their ROCs
and implied models. Psychological Bulletin, 99, 100-117.
Swets, J. A. (1986b). Form of empirical ROCs in discrimination and diagnostic tasks:
Implications for theory and measurement of performance. Psychological
Bulletin, 99, 181-198.
Swets, J.A. (1988). Measuring the accuracy of diagnostic systems. Science,
174
240, 1285–1293.
Swets, J.A. (1992). The science of choosing the right decision threshold in
high-stakes diagnostics. American Psychologist, 47, 522–532.
Swets, J. A,, Tanner, W. P., Jr., & Birdsall, T. G. (1961). Decision processes in
perception. Psychological Review, 68, 301-340.
Swets, J. A., Dawes, R. M., & Monahan, J. (2000). Psychological science can
improve diagnostic decisions. Psychological Science in the Public Interest, 1,
1-26.
Tanner, W. P. & Swets, J. A. (1954). A decision-making theory of visual detection.
Psychological Review, 59, 431-442.
Thompson, D. M. (1970). Repeated acquisition as a behavioral baseline.
Psychonomic Science, 21, 156-157.
Thompson, D. M. (1971). Transition to a steady state of repeated acquisition.
Psychonomic Science, 1971, 24, 236-238.
Thurstone, L. (1927a). A law of comparative judgment. Psychological Review, 34,
273-286.
Thurstone, L. L. (1927b). Psychophysical analysis. American Journal of Psychology,
38, 368-389.
Voss, P., McCarthy, D., & Davison, M. (1993). Stimulus control and response bias in
an analogue prey-detection procedure. Journal of the Experimental Analysis of
Behavior, 60, 387-413.
Ward, R. D. (2008). Testing the functional equivalence of retention intervals and
sample-stimulus disparity in conditional discrimination. Unpublished doctoral
175
dissertation, Utah State University.
Ward, R. D. & Odum, A. L. (2008). Sensitivity of conditional-discrimination
performance to within-session variation in reinforcer frequency. Journal of the
Experimental Analysis of Behavior, 90, 301-311.
Wasserman, E. A. & Miller, R. R. (1997). What’s elementary about associative
learning? Annual Review of Psychology, 48, 573-607.
Wearden, J. H. & Burgess, I. S. (1982). Matching since Baum (1979). Journal of the
Experimental Analysis of Behavior, 38, 339-348.
White, K. G. (1985). Characteristics of forgetting functions in delayed matching to
sample. Journal of the Experimental Analysis of Behavior, 44, 15–34.
White, K. G., & Wixted, J. T. (1999). Psychophysics of remembering. Journal of the
Experimental Analysis of Behavior,71, 91–113.
White, K. G., Parkinson, A. E., Brown, G. S., & Wixted, J. T. (2004). Local proactive
interference in delayed matching to sample: the role of reinforcement. Journal
of Experimental Psychology: Animal Behavior Processes, 30 (2), 83-95.
Williams, B. A. (1988). Reinforcement, choice, and response strength. In R. C.
Atkinson, R. J. Herrnstein, G. Lindzey, & R. D. Luce (Eds.), Stevens’
handbook of experimental psychology: Vol. 2. Learning and cognition (2nd
ed., pp. 167–244). New York: Wiley.
Williams, B. A. (1994). Reinforcement and choice. In N. J. Mackintosh (Ed.), Animal
learning and cognition (pp. 81–108). San Diego: Academic Press.
Wixted, J. D. (1989). Nonhuman short-term memory: A quantitative analysis of
selected findings. Journal of the Experimental Analysis of Behavior, 52, 409–
176
426.
Wright, A. A., & Cumming, W. W. (1971). Color-naming functions for the pigeon.
Journal of the Experimental Analysis of Behavior, 15, 7–17.
Wright, A. A., & Sands, S. F. (1981). A model of detection and decision processes
during matching to sample by pigeons: Performance with 88 different
wavelengths in delayed and simultaneous matching tasks. Journal of
Experimental Psychology: Animal Behavior Processes, 7,191–216.
Wright, A. A., Urcuioli, P. J., & Sands, S. F. (1986). Proactive interference in animal
memory. In D. F. Kendrick, M. E. Rilling, & M. R. Denny (Eds.), Theories of
animal memory (pp. 101–125). Hillsdale, NJ: Erlbaum.
Wyckoff, L. B., Jr. (1952). The role of observing responses in discrimination
learning: Part I. Psychological Review, 59, 431-442.
Wyckoff, L. B., Jr. (1969). The role of observing responses in discrimination
learning. In D. P. Hendry (Ed.), Conditioned reinforcement (pp. 237-260).
Homewood, IL: Dorsey Press.
177
VITA
Graduate School Southern Illinois University
Blake A. Hutsell Date of Birth: July 29, 1980 1595 Logan Drive Apartment 3, Carbondale, Illinois 62901 4061 Highway 90 West, Pocahontas, Arkansas 72455 [email protected] Arkansas State University Bachelor of Science, Psychology, May 2003 Southern Illinois University Carbondale Mater of Arts, Psychology, May 2008 Special Honors and Awards: Honor’s Pass, Written Preliminary Examination Dissertation/Thesis Title:
Mechanics of Stimulus and Response Generalization in Signal Detection and Psychophysics: Adaptation of Static Theory to Dynamic Performance.
Major Professor: Eric A. Jacobs
Recommended


![From Photons to Faces: An Overview of the Primate Visual ...€¦ · Fields (first step in stimulus generalization) ... [Talbot & Marshall; Hubel and Wiesel] •By the 70’s a multiplicity](https://img.pdfslide.net/doc/110x75/605adb020f78ea61344a73d4/from-photons-to-faces-an-overview-of-the-primate-visual-fields-first-step.jpg)