Mechanisms of Venture Capital Co-Investment Networks:
Evolution and Performance Implications
Denis Trapido
Stanford University
Students of high technology industry routinely acknowledge that communities knit
together by networks of social relations are essential for the development of the industry
(Saxenian 1994; Bernasconi et al. 2005) and emphasize that venture capitalists hold central
positions in these networks (Banatao and Fong 2000; Castilla et al. 2000). Regis McKenna, a
highly reputed IT industry expert, called the venture capital (VC) ‘catalyst for [industrial social]
networks’ (Kenney and Florida 2000: 101). Other experts have compared the job of venture
capitalists in high technology to that of coaches in professional sports (Hellmann 2000). These
metaphors reflect the intuition that the role of VC in the development of high technology goes far
beyond that of a mere provider of funds. More importantly, venture capitalists integrate the
technological community and manage its human resources. Thus, understanding the
consequences of their activity is essential to explaining the organization and the performance of
the industry.
Yet the venture capitalists are not autonomous actors and themselves crucially depend on
resources conveyed through peer networks. The majority of significant venture investment
projects are managed collectively by several VC firms. Therefore, we can hardly obtain valuable
insights into the role of VC in the development of the industry or single companies unless we
extend the analysis to account for relationship-level and network-level processes. Researchers’
recent acknowledgement of this requirement led to notable advancement of our knowledge on
the functioning of venture capital networks. For example, Podolny (2001) argued that networks
serve to reduce market uncertainty by conveying information and signals of actor’s social status.

2
Sorenson and Stuart (2001) demonstrated that distance-spanning social networks help venture
capitalists sort into new geographically remote markets.
We are, however, still left with a patchy picture. Most importantly, we lack the overview
of the evolution of these networks over time and of the relationship between the functioning of
the networks and the performance of organizations in the high technology industry. This study
contributes to filling this gap. Relying on the literature, I distinguish four mechanisms through
which venture capitalists’ syndication networks (or, synonymously, co-investment networks)
may affect investment recipients’ performance. Next I construct operational measures of those
mechanisms and describe the evolution of the whole VC co-investment network in the United
States in terms of these measures. Finally, the effect of these indicators on the performance of
investment recipient companies is examined. Thus, this work has a methodological, a descriptive,
and an explanatory aspect.
The Venture Capital Industry and Its Syndication Networks
The Scope of VC Involvement in High Technology
The venture capital did not emerge as a distinct industry until the early 1970s, yet just a
decade later it was already playing a vital role in nurturing technical innovation in the United
States. By the end of 2000, venture-backed technology companies that had gone public
accounted for over 20 percent of the total number of public companies in existence in the U.S.
and 32 percent of the total market value of all public companies in the country (Gompers and

3
Lerner 2001: 67). The impact of venture capital was especially strong in Silicon Valley, which is
the world’s leading venture capital center.
Monetary support of a growing company is just one of the various ways in which venture
capitalists contribute its development. Venture capitalists have a decisive say in the formation of
a startup company’s leadership team. They continue to exert their influence in the hiring and
governance process until the funded company is sold or goes public, so it is not uncommon that a
CEO or another high executive of a company funded by venture capitalists gets replaced on their
demand. Typically a VC firm representative holds at least one seat on the board of directors of
the funded company. As one venture capitalist put it, ‘the average duration of a relationship
between a venture capitalist and the entrepreneur is probably longer than the average duration of
a marriage in California, and rarely less intense’ (quoted in Hellmann 2000: 280). The
performance of venture capitalists is wholly determined by the performance of the companies
which they have helped to build, just the way the performance of coaches is judged by the results
of the athletes they train. This is one reason why the coaches metaphor seems so apt when
applied to venture capitalists.
Mechanisms of Co-Investment Networks
Lasting personal relationships (or embeddedness) and trust are probably the most often
mentioned positive by-products of economic interaction (Woolthuis et al. 2005). Mark
Granovetter’s early statement of the importance of trust and embeddedness in economic relations
(1985) was formulated as a critique of Oliver Williamson’s Markets and Hierarchies research
program. Williamson (1975) had pointed out that actors in modern markets are out for their own
4
interest and argued that taking advantage of other actors is often the best way to achieve their
goals. Williamson’s theoretical scheme did not see an efficient way of preventing the use of
force and fraud by market participants except vertical integration, i.e. channeling market
transactions into multi-divisional corporations and other hierarchical structures. He regarded
vertical integration and mechanisms of corporate control as the remedy against ubiquitous
economic malfeasance.
Granovetter reacted by pointing out that Williamson’s conception of an economic actor is
‘undersocialized’. Williamson views economic actors (individuals or firms) as isolated,
concerned with their self-interest and seeing others solely as competitors. According to
Granovetter, this is not the case in actual economic life. He claims that market participants tend
to develop lasting relationships, i.e. repetitively engage in transactions with the same partners. In
these relationships malfeasance is less likely than cooperation, and this is for reasons completely
different than those that Williamson emphasizes. This is because actors know and trust each
other. Their economic action cannot be understood just as constant utility maximization, for it is
greatly shaped by social relations with their partners; to use Granovetter’s favorite term, it is
embedded in those relations. Where this is the case, vertical integration is unnecessary; if it
nevertheless happens, it is because people trust each other and even derive pleasure from
interacting with the same partners and colleagues (Granovetter 1985: 498).
Venture capital is a textbook example of non-hierarchical network-based economic
community, and Granovetter’s argument has been successfully applied to explain its
development (see e.g. Saxenian 1994). One of the ways in which trust develops among venture
capitalists is repetitive collaboration in investment projects, i.e. stable co-investment partnership.
Thus, I hypothesize that stability of partners has a positive effect on venture capital firms’ and

5
their investment recipients’ performance. Stable partnerships generate trust and thereby increase
the potential for productive cooperation and eliminate incentives for malfeasance.
Admati and Pfleiderer (1994) point out another mechanism, related to the Granovetter-
Williamson debate, through which co-investment networks may benefit venture capital firms.
They argue that some members of venture investment syndicates gain information advantages
over other members. The investors enjoying information advantages have an incentive to exploit
these advantages later in the investment cycle at the cost of other investors. So, they will increase
their equity share in the company shortly before it goes public if they know that this company’s
prospects are particularly attractive. If, on the contrary, the information that they have tells them
that company’s prospects look unfavorable, they will let others provide more capital in later
rounds. Co-investment, Admati and Pfleiderer argue, provides a mechanism to control such
opportunistic behavior of firms that enjoy informational advantages in later investment rounds.
They suggest that an implicit agreement between venture capital firms must exist to maintain the
same equity shares throughout all investment rounds. Gompers and Lerner (1999) find support
for this suggestion in their data on venture-backed biotechnology firms from the period between
1978 and 1989.
Although Gompers and Lerner see Admati and Pfleiderer’s argument as one possible
answer to the question ‘Why do venture capitalists syndicate investments?’, the answer is hardly
complete. It adduces an explanation of why firms keep co-investing once they started doing so,
not why they co-invest in the first place. Besides, the idea that maintaining stable investment
shares indicates that venture capitalists are trying to avoid exploitation of information
asymmetries is merely a guess. This rationale has been attributed to venture capitalists without
obtaining first-hand evidence from them.

6
This said, we must acknowledge that Admati and Pfleiderer suggested a practicable way
to operationalize opportunism. Relying on their ideas, one can calculate a measure of
opportunism for both individual firms and whole networks of firms as a function of change in the
equity share of syndicate partners. Williamson’s reasoning implies that opportunistic behavior in
the absence of vertical integration is rewarding for an economic actor. Williamson’s opponents
would probably argue that in the long run it is self-destructive, especially if actors heavily
depend on their social networks. I will leave it to the data to decide which of the two predictions
holds. If the impact of opportunism can be clearly interpreted as supporting Williamson or his
critics, we should probably hold back our doubts about the validity of the measure that Admati
and Pfleiderer suggested.
Thirdly, I argue that co-investment networks provide a mechanism for sharing and
management of expertise and experience (Gompers and Lerner 1999: 187-188). Investing with
experienced partners brings additional expertise into the investors’ decision-making process and
thus reduces the risk of making bad decisions. Conversely, investments made by or with
inexperienced venture capital firms are considered riskier. So, established venture capital firms
avoid investing with inexperienced investors in the early investment stages, especially in the seed
investment round, because this would involve admitting those investors into the early decision-
making stages where most crucial decisions are made. Yet they may syndicate their investments
with inexperienced investors in later rounds. In this way less experienced investors get an
opportunity of acquiring experience without taking excessive risks, and co-investment networks
perform a surprising function of a training institution for beginning venture capitalists. The
above gives us the reason to hypothesize that co-investment has a positive effect on venture

7
capital firms’ and their investment recipients’ performance inasmuch as it creates a mechanism
for optimal distribution of investment expertise.
Risk sharing and management is yet another mechanism apparently at work in co-
investment networks. Some venture capital firms take more risks by frequently investing in start-
up companies; others try to minimize risks by investing mainly in later investment rounds. Both
types of investors are dependent on each other: risk-takers often need additional funds in later
investment rounds which can be supplied by conservative investors; conservatives investors, on
the other hand, cannot stick to their strategy unless risk-takers nourish the companies in early
stages. The dynamics of risk sharing and its implications for the outcomes of investment
recipient companies are not well understood. The process may be seen either as symbiosis, or as
a variation of ‘specialization’ (see e.g. Carroll 1985), or as a cynical zero-sum game where
investors are trying to free-ride. My analysis will examine the relationship between the extent of
risk sharing among companies’ investors and the companies’ economic outcomes.
Data and Measures
My data were extracted from the SDC Platinum database. SDC Platinum purports to
record every venture investment in the world made since the early 1970s. I selected only those
companies that were founded and received venture funding from 1970 through 2002. Earlier data
are incomplete and come from the period when venture capital did not exist as a distinct industry.
Where necessary, e.g. in computing the firms’ experience, I use available data from all years.
This yields a sample of 6,486 firms investing in 29,568 companies. (For the sake of clarity, I
8
refer to investor organizations as ‘firms’ and to their investment recipients as ‘companies’
throughout this paper.)
I use the specification of Cox regression for competing risks suggested by Lunn and
McNeil (1995) to study the effects of VC firms’ network mechanisms on their portfolio
companies’ outcomes. I construct a discrete-time model with year as the time interval. This is a
good approximation of continuous time models (de Graaf and Kalmijn 2003:1477). Going public
is the favorable exit event in the analysis; bankruptcy or liquidation constitute the unfavorable
exit event. In the absence of reliable data on acquisitions, which is another common exit option
for venture-backed companies, the companies that were neither public nor bankrupt nor
liquidated by the end of 2002 are censored. Note that the incidence of favorable exits exceeds
that of unfavorable exits by a margin of almost 3 to 1. On the one hand, one could argue that low
failure rates are exactly what the venture capitalists’ due diligence procedures, which all
companies in the data have gone through, are intended to achieve. Therefore, low failure rates
among venture-funded companies in comparison to other companies should not be surprising.
This is probably part of the explanation. However, I suspect that the other part is that
bankruptcies and liquidations are underreported in the SDC Platinum data, so the results for this
outcome should be treated with more caution than the results for initial public offerings (IPO).
The basic competing risks model includes covariates alongside each covariate’s
interaction with a dummy indicator of failure type. Before this model is run, the dataset is
expanded to add N×(t - 1) additional cases, where N is the initial number of cases and t is the
number of different failure types. The added cases are identical to the initial cases except in the
dummy indicators of failure type, which are necessarily different in the initial and the added
cases. If there are just two failure types in such a design, the regression coefficients of the
9
covariates are the effects on the hazard type coded as “0” (IPO in this case) and the coefficients
of the interaction terms are the effects of the same covariates on the hazard type coded as “1”
(bankruptcy or liquidation). The choice of the best further specification of this basic model
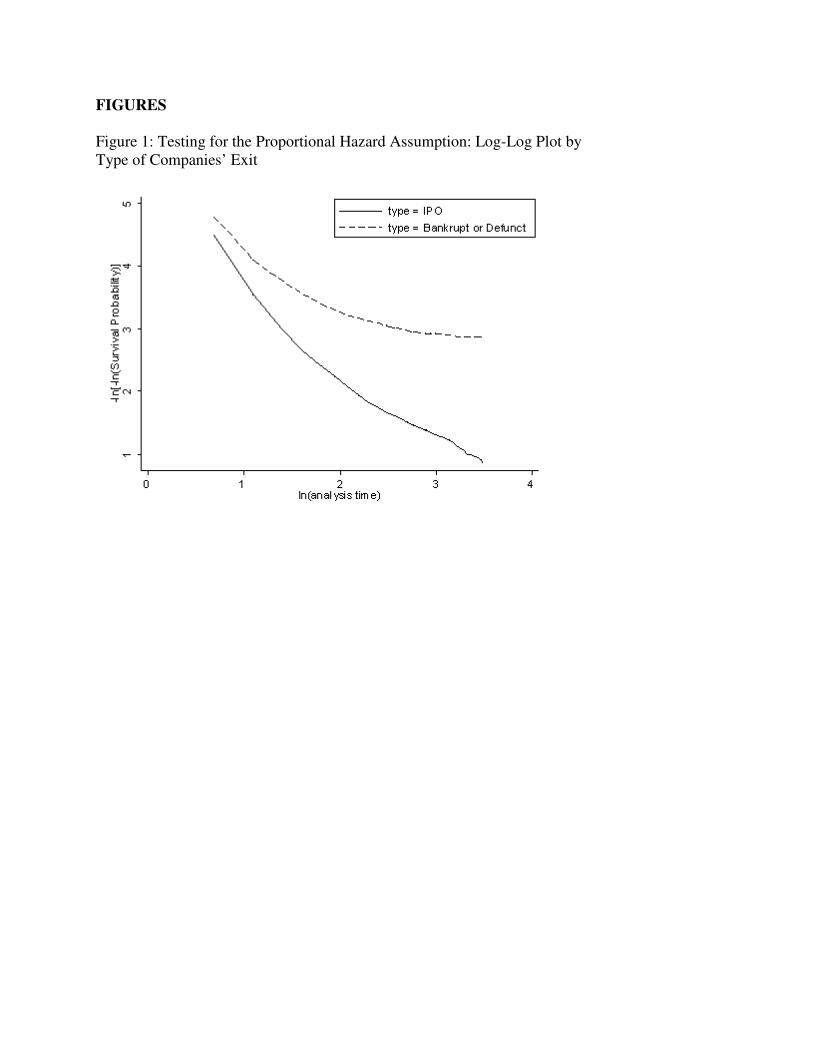
depends on the test of the assumption that the ratio of baseline hazard functions for all competing
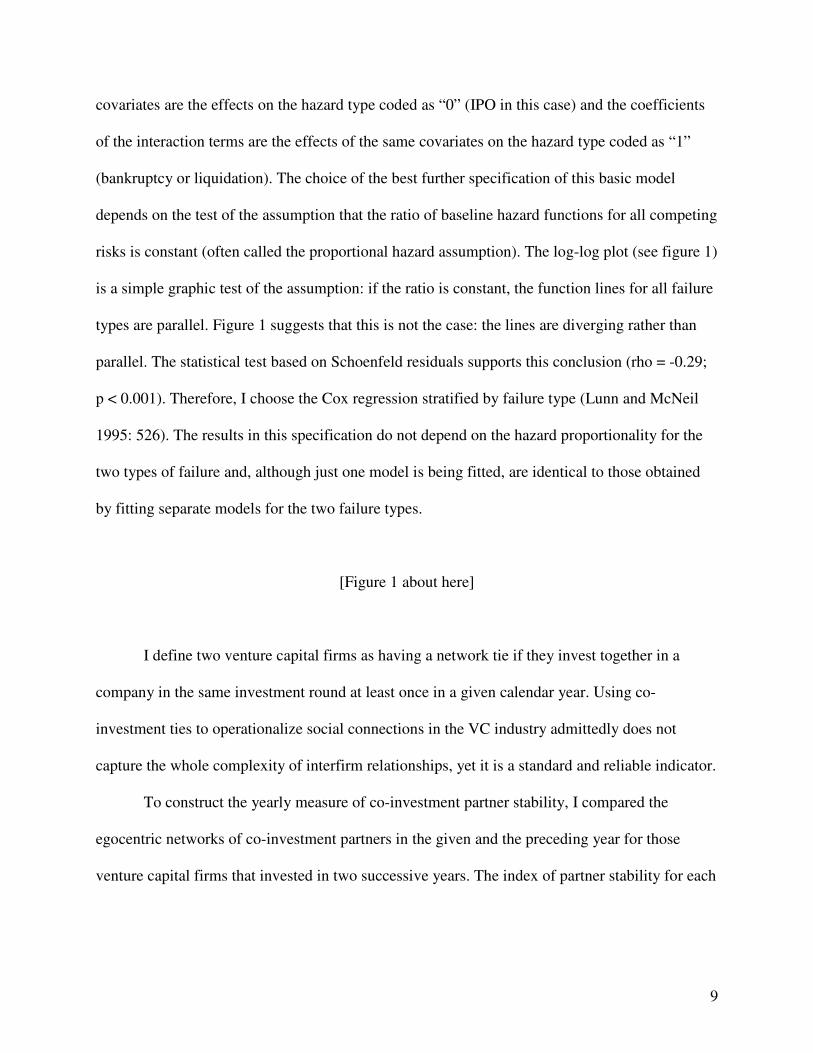
risks is constant (often called the proportional hazard assumption). The log-log plot (see figure 1)
is a simple graphic test of the assumption: if the ratio is constant, the function lines for all failure
types are parallel. Figure 1 suggests that this is not the case: the lines are diverging rather than
parallel. The statistical test based on Schoenfeld residuals supports this conclusion (rho = -0.29;
p < 0.001). Therefore, I choose the Cox regression stratified by failure type (Lunn and McNeil
1995: 526). The results in this specification do not depend on the hazard proportionality for the
two types of failure and, although just one model is being fitted, are identical to those obtained
by fitting separate models for the two failure types.
[Figure 1 about here]
I define two venture capital firms as having a network tie if they invest together in a
company in the same investment round at least once in a given calendar year. Using co-
investment ties to operationalize social connections in the VC industry admittedly does not
capture the whole complexity of interfirm relationships, yet it is a standard and reliable indicator.
To construct the yearly measure of co-investment partner stability, I compared the
egocentric networks of co-investment partners in the given and the preceding year for those
venture capital firms that invested in two successive years. The index of partner stability for each

10
firm was calculated as the number of partners in the current year who were partners also in at
least one of the previous two years, divided by the total number of current partners:
ST T
Tfy
f y fy
fy
=− ∩( )1
,
where Tfy is the set of co-investment ties of the venture capital firm f in year y. To obtain the
aggregate measure of network stability for a company’s investor firms, I compute the average of
investors’ partner stability indices Sfy weighted by their investment contribution to the company:
S
S W
Fcy
fy fcy
f
c
=
∑,
where Fc is the total number of investors in company c and the investment contribution weight is
Wfcy = I
I
fc
fc
f
∑.
Ifc denotes the investment amount of firm f in company c. The overall network stability index
can be calculated as the ratio of the number of stable ties and the total number of ties among the
firms that invested in the focal and the preceding year. Note that network stability is undefined
for a firm if it is an isolate, i.e. has no co-investment ties in a given year.
The information asymmetry exploitation index (IAEI) was initially computed for each
firm in each investment round where it participated. For each firm in each round except the first
11
one (the measure is undetermined in the first round because there is no comparison base), it is
defined as the absolute value of the difference between the firm’s share in the focal and the
preceding investment round. This measure is then averaged across all firms investing in a
company and rounds in which they participate:
( )IAEI
I r I
Rc
f f r
rf
f
f
=
− −∑∑
∑
( )1
,
where r indexes the investment round (r ≥ 2), Rf is the number of investment rounds where firm f
participated, and the other notations are the same as above. Obviously, the measure is undefined
if the company had just one investment round. The network-level IAEI is the average of
company-level indices computed for all investment rounds in a given period.
The venture capital firm’s experience in a given year is calculated as the natural
logarithm of the number of investments it had made by the beginning of that year. Computing
the logarithm of the number of investments makes this measure correspond better to the
underlying theoretical concept of experience, which is hardly a linear function of the number of
investments made. The logarithmic measure reflects the idea that the marginal experience
acquired in investing is decreasing rather than constant. Averaged across each company’s
investors and weighted by their contribution Wfcy, this measure enters the company-level
regression model below. I also report results based on age as an alternative measure of firms’
experience (see figure 3b in the next section).
To gauge the experience sharing among the company’s investors, I dichotomized the
experience variable. The newcomers to the industry in a given year are coded as inexperienced

12
in that year and the firms that entered earlier are coded as experienced. (The proportion of
inexperienced active venture capital firms rose above 30 percent in the second half of the 1990s,
but generally remained just below 20 percent.) The experience sharing variable has three
categories: 1) at least one inexperienced investor in the first investment round; 2) inexperienced
investor(s) in a later but not the first round; 3) only experienced investors.
Investors’ readiness to take higher risks, or risk tolerance, is expressed as the share of
their all-time total investment that they invested in startups. Averaging this indicator across all
firms investing in a company (weight Wfcy applied here again) brings it to the company level of
analysis. I also compute within-company standard deviation of this indicator to get to the idea of
risk sharing among venture investors. High standard deviation indicates that investors with
different degrees of risk tolerance fund the company. Low standard deviation, on the contrary,
signals that partners with a similar propensity to take risk formed the syndicate. The standard
deviation of zero is assigned to companies having just one investor.
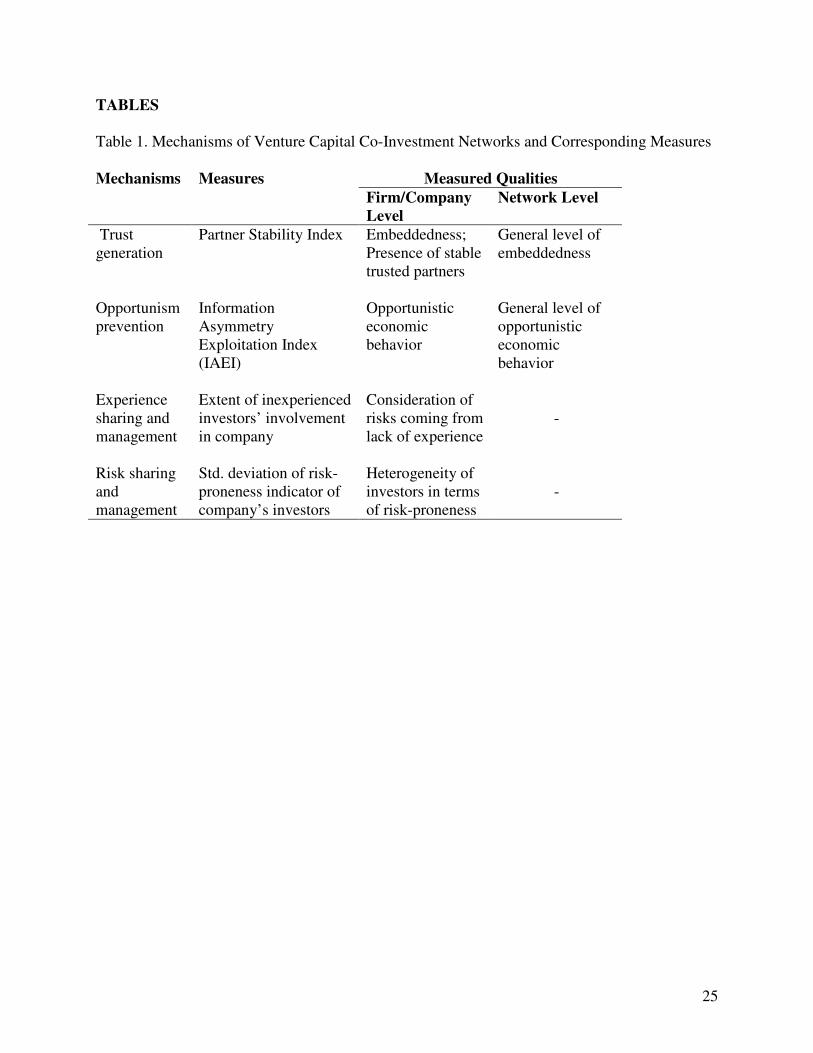
The network indicators described above are summarized in table 1. They will be the
independent variables in my regression analysis. The control variables are (1) the average
betweenness centrality of the company’s investors, (2) a dummy variable indicating whether the
company is located in Silicon Valley, (3) the company’s industry group, (4) the proportion of
network isolates among the company’s investors, and (5) the interaction of the proportion of
network isolates with the network stability indicator Scy.
The last control variable requires a further comment. The network stability indicator Sfy is
undefined for isolates, i.e. for those venture capital firms that never co-invest in the same
investment round with other firms in a given year. Therefore, if some of the company’s investors
are isolates, this indicator is computed from an incomplete set of its investors. The interaction

13
term will help determine how the effect of network stability depends on the completeness of the
investor set. If the effect of the interaction term proved negligible, this would suggest that
investor set completeness does not affect the results. However, inclusion of the interaction term
does not solve the incompleteness problem when all company’s investors are isolates (this is the
case for 54 per cent of the companies). Scy cannot be computed for such companies, so they are
not included in the event history analysis. To understand how being an isolate affects their
performance and whether excluding the companies funded by isolate investors introduces
selection on the dependent variable, I will compare their hazards of IPO and failure to those of
other companies.
Please see table 1 for a descriptive summary of the measures introduced in this section
and table 2 for means, standard deviations, and a correlation matrix of all independent variables
in the analysis.
[Table 1 about here]
[Table 2 about here]
Findings
Co-Investment Network Dynamics since the 1980s
Can we detect meaningful trends in the evolution of the venture capital co-investment
network? In this section I will apply the suggested measures of co-investment network

14
mechanisms to describe this evolution, looking most closely at the period between 1986 and
2001 and in some parts going back to 1980.
Let us first examine the stability of co-investment partners. The number of investment
ties quadrupled between the late 1980s and 2000. This happened because of the increase in the
number of investors (figure 2a), not due to the networks becoming denser – the density of
venture capital co-investment network has been falling steadily and dramatically in the 1990s.
Recall that the stability index of venture capital co-investment networks, plotted in figure 2b,
reflects the general level of investors’ commitment to stable co-investment partners. After
remarkable growth in the second half of the 1980s, the partner stability index entered a ten-year
period of decline. While over a third of co-investment ties in 1990 were continued from the
previous two-year period, only 15 percent of the ties in 2000 made it from the previous period.
The trend of decline in stability was sharply reversed after 2000. The firms started returning to
the strategy of co-investing with stable partners, and 23 percent of the ties in 2002 were stable.
[Figure 2 about here]
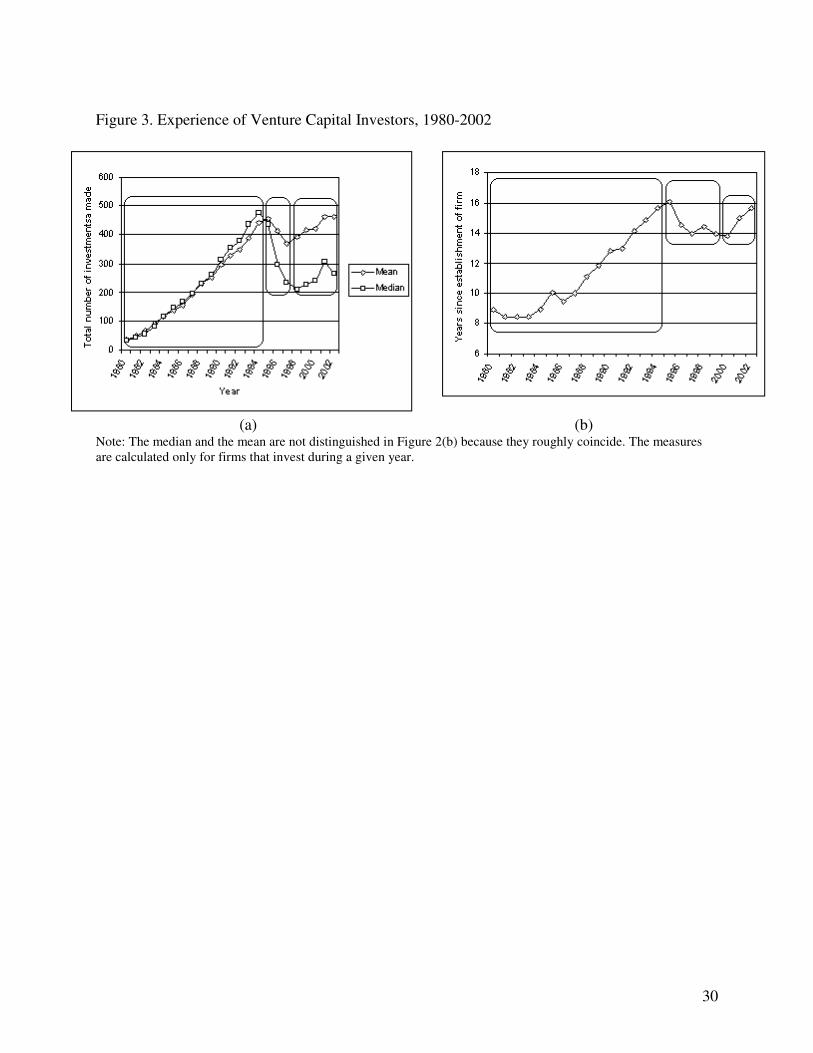
Turning now to investors’ experience, let us examine the change over time in two
different measures of experience. The first measure, used in constructing the experience
variables for the regression, is the total number of investments that a firm has made. The second
measure is the investing firm’s age, i.e. years since its establishment. Means and medians of both
indicators tend to grow over time because the age and the cumulative number of investments of
the most active and well-established venture capital firms increase. However, as can be seen in
15
figure 3, such growth has not been smooth and monotonic. There was a remarkable decline
starting in 1994-1995. It lasted until the growth resumed in 1999-2000.
So, here we again witness a trend being reversed around the time of the onset of
economic recession. This nearly simultaneous reversal of trends in network stability and
investors’ experience deserves further attention and interpretation. I will return to this finding
after examining the effects of co-investment network mechanisms on investment recipients’
performance.
[Figure 3 about here]
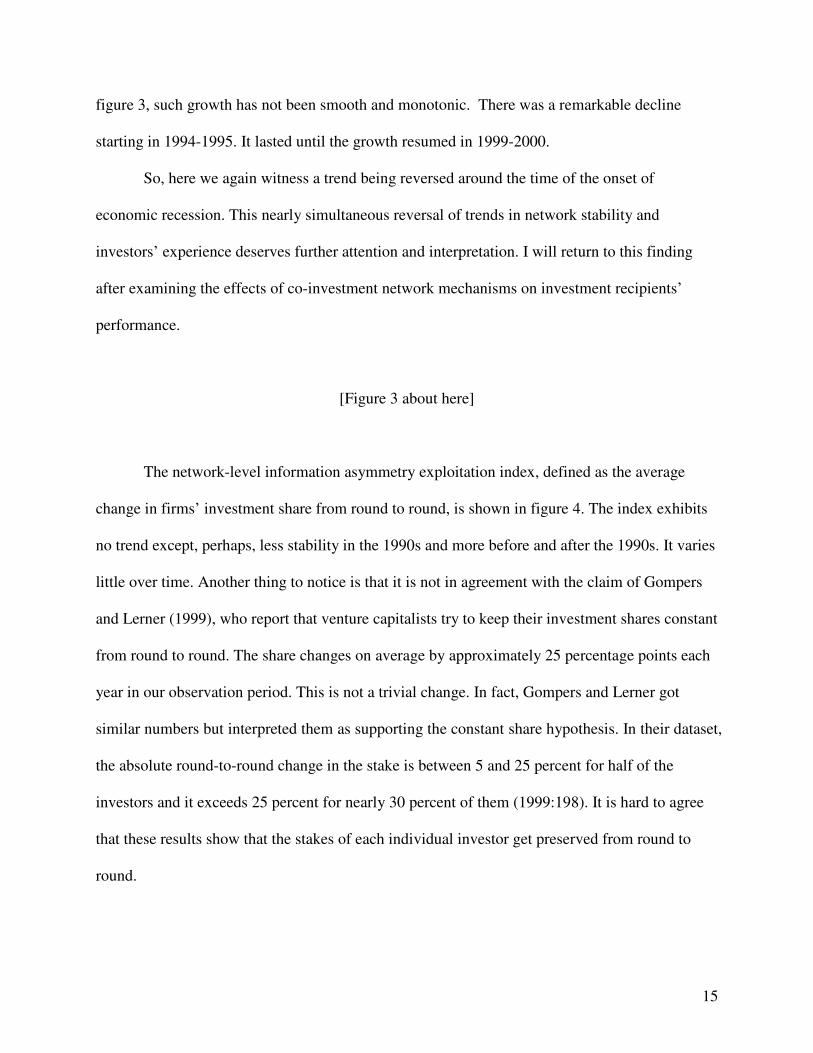
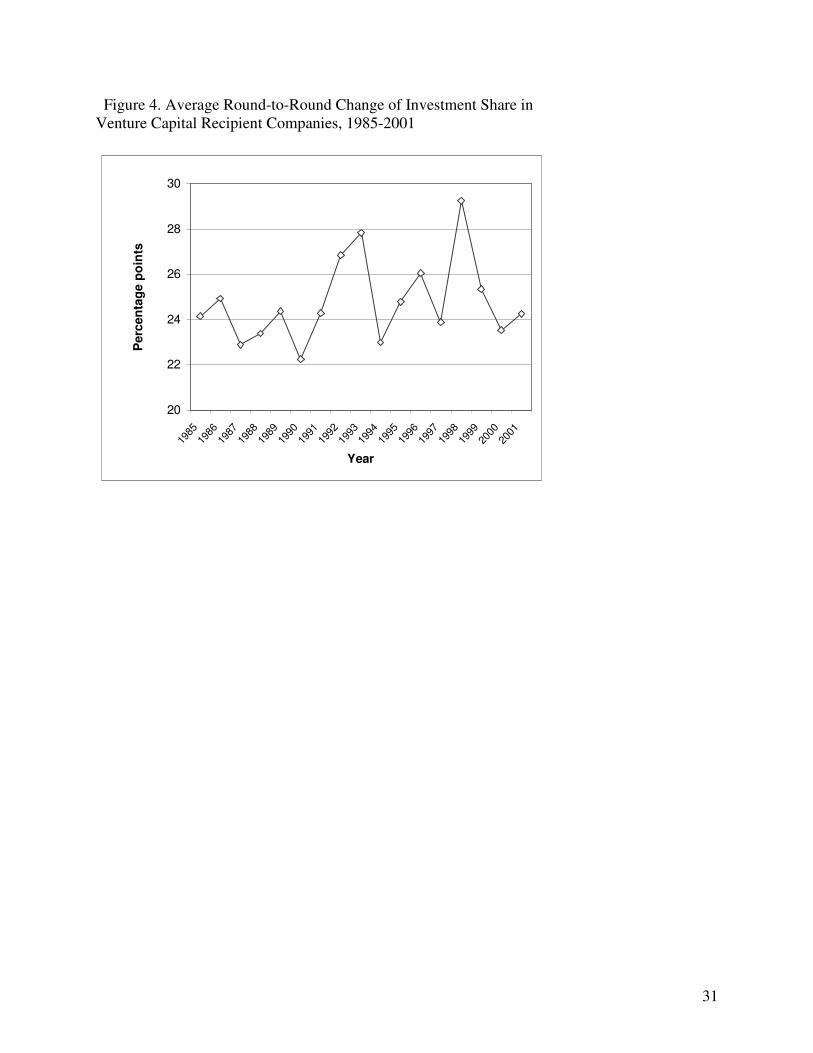
The network-level information asymmetry exploitation index, defined as the average
change in firms’ investment share from round to round, is shown in figure 4. The index exhibits
no trend except, perhaps, less stability in the 1990s and more before and after the 1990s. It varies
little over time. Another thing to notice is that it is not in agreement with the claim of Gompers
and Lerner (1999), who report that venture capitalists try to keep their investment shares constant
from round to round. The share changes on average by approximately 25 percentage points each
year in our observation period. This is not a trivial change. In fact, Gompers and Lerner got
similar numbers but interpreted them as supporting the constant share hypothesis. In their dataset,
the absolute round-to-round change in the stake is between 5 and 25 percent for half of the
investors and it exceeds 25 percent for nearly 30 percent of them (1999:198). It is hard to agree
that these results show that the stakes of each individual investor get preserved from round to
round.
16
[Figure 4 about here]
Effects of Venture Investor Network Mechanisms on Investment Outcomes
One cautionary note is due before presenting and interpreting the results. The tricky
question about the data is whether they should be considered a population or a sample. On the
one hand, the data collectors aimed at recording every venture investment announced in the press
or elsewhere. On the other hand, they certainly did not attain this goal; yet how much they fell
short of it is unknown. Given this uncertainty, I chose to report the statistical significance of the
estimated parameters in regression but will put little emphasis on it, focusing instead on the size
of the hazard ratios.
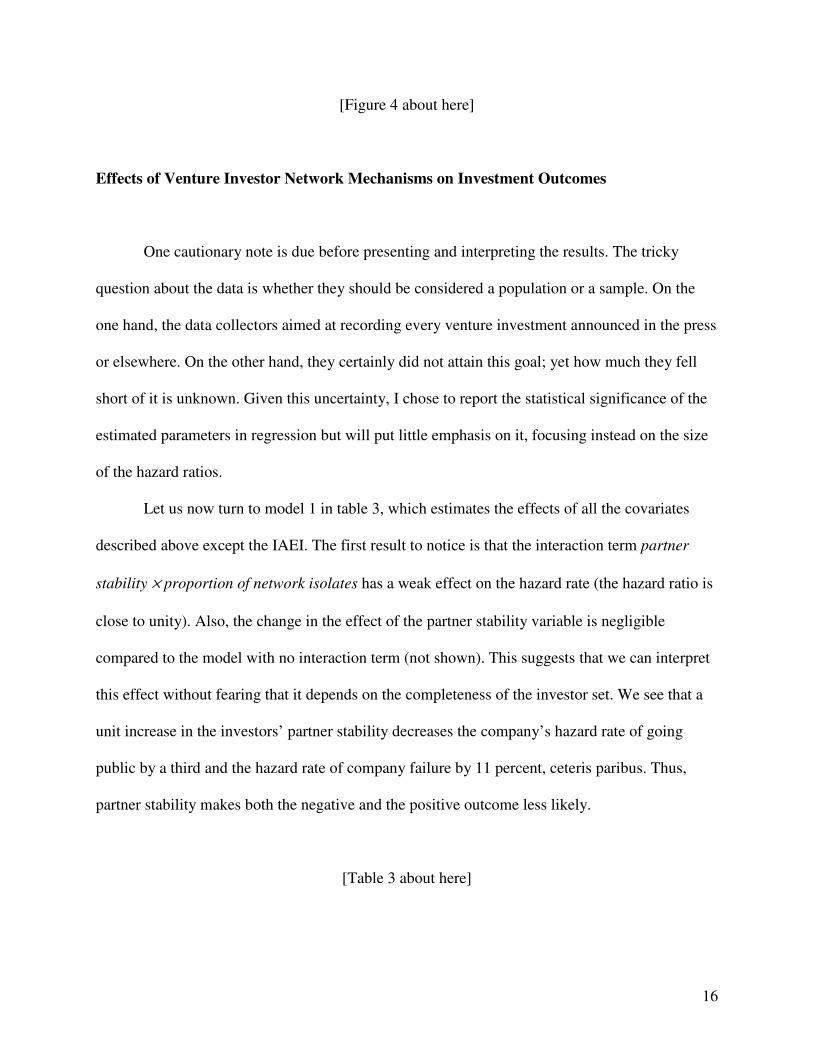
Let us now turn to model 1 in table 3, which estimates the effects of all the covariates
described above except the IAEI. The first result to notice is that the interaction term partner
stability × proportion of network isolates has a weak effect on the hazard rate (the hazard ratio is
close to unity). Also, the change in the effect of the partner stability variable is negligible
compared to the model with no interaction term (not shown). This suggests that we can interpret
this effect without fearing that it depends on the completeness of the investor set. We see that a
unit increase in the investors’ partner stability decreases the company’s hazard rate of going
public by a third and the hazard rate of company failure by 11 percent, ceteris paribus. Thus,
partner stability makes both the negative and the positive outcome less likely.
[Table 3 about here]
17
The experience of investors does not affect the hazard rate of either of the two outcomes
we examine. Neither does experience sharing have a sizeable impact. There is no difference in
outcomes between those companies whose seed investors were newcomers to the industry, those
where newcomers were kept out of the seed round but entered later, and those whose investors
were all experienced. This result certainly does not indicate that experience sharing is absent
from the VC syndication networks. It suggests that, whatever the extent and the intended
function of experience sharing, it does not affect the performance of the companies funded by
venture capital firms.
Moving further, we notice that the companies whose investors take more risks by
investing in startups faced a high failure risk and a low chance of going public. The lower chance
of going public for companies nurtured by risk-prone investors is a noteworthy result. The high
failure rate among such companies, by contrast, should probably not be emphasized given the
unreliability of the failure data. The heterogeneity of investors in terms of their risk taking creeds
strongly increased the hazard of both types of company exit. To put it another way, the risk that a
company would experience no exit, either positive or negative, fell sharply with investors having
different risk taking histories participating in the syndicate.
Examining the theta parameter offers some additional telling results. Theta is the
difference between the same covariate’s regression coefficients, computed as ln(hazard ratio
IPO) - ln(hazard ratio B/L). A large absolute value of theta suggests that distinguishing the two
risk types is justified. A theta close to zero suggests that the effect of the covariate is similar for
both risk types, so regarding them as a single exit risk would not discard any significant
information on the effect of this covariate. Note that theta is small and statistically insignificant
for all our independent variables of interest except the propensity of investors to take risks. So,
18
we have to conclude that investor network mechanisms generally affect the risk of a positive and
a negative outcome in a similar direction: they either increase or decrease both risks at the same
time, or leave both risk types unaffected.
The only difference between model 2 and model 1 is the inclusion of the information
asymmetry exploitation indicator. One unit increase in the IAEI increases the hazard rate of
going public by 28 percent and decreases the hazard rate of company failure by 18 percent. On
the one hand, the fact that the analysis has revealed sizeable effects suggests that there is
substantive content to this measure. On the other hand, note that the IAEI has a high proportion
of missing values, so adding it to the model removes more than 25 percent of the cases from the
analysis. This loss of cases is certainly not random, as we see substantial changes in the effects
of several covariates compared to model 1. The changes are not due to correlation between the
IAEI and those covariates, as this correlation is weak, but rather to systematic incompleteness of
the data due to missing values. This warrants caution when interpreting the effect of the IAEI.
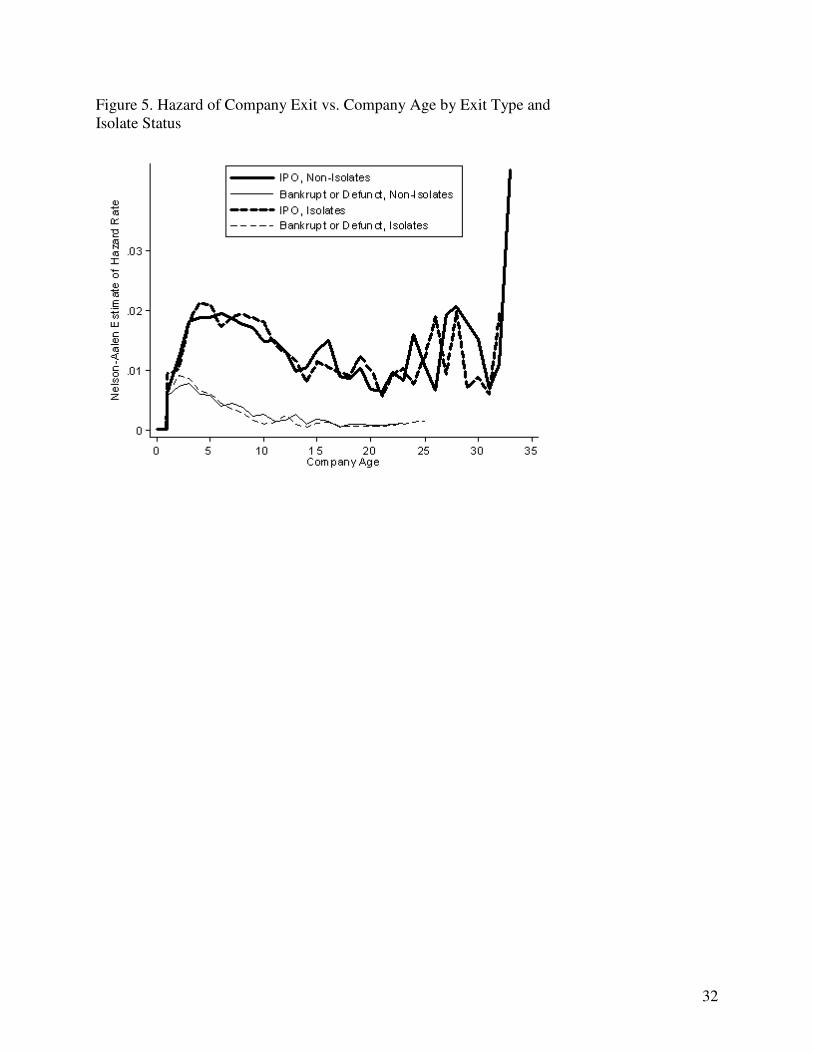
The companies whose investors were network isolates were not included in this analysis.
As an attempt to understand their performance, consider the comparison of hazard rates of exit in
figure 6. The companies funded by network isolates do not differ from other companies in terms
of the hazard rate of IPO or failure. This demonstrates that excluding the network isolates did not
introduce systematic selection on the dependent variable and thus increases the confidence in the
regression results.
[Figure 5 about here]

19
Can Rigid Social Networks Facilitate Technological Breakthroughs?
The conception of this work relied on terms having strong positive connotations. I
suggested that venture capital co-investment networks generate trust and embeddedness, provide
mechanisms for better experience sharing and for sharing and management of risks. The
economic outcomes of investment recipient companies were hypothesized to improve 1) when
more trust and embeddedness among its investors is present; 2) when investors are experienced,
or when the lack of experience of some investors is compensated by experience of their co-
investment partners; and 3) when the risks are optimally managed. In part this was a strategy of
comparing the reality against an ideal type, yet mostly it was driven by the intuitively credible
and theoretically grounded reasoning that embeddedness, experience, and wise risk management
are important assets for an economic actor.
The initial descriptive results gave indirect support to this reasoning. During the boom of
the second half of the 1990s, the co-investment partners of active venture capital firms were
becoming increasingly casual and the experience of investing firms was declining. Yet at the
onset of the recession the firms leaned towards partner stability and experience. This
development easily lends itself to interpretation in positively connoted terms. One may reason
that in the time of prosperity venture capitalists perceived less need for the benefits that they
could derive from co-investing with trusted and experienced partners. The revenue expectations
were high, the entrepreneurs’ business plans seemed to work, so the investors did not bother to
seek additional expertise and security that experienced and stable partners could provide. Yet
when the recession came, the venture capitalists returned to more rewarding conservative
20
strategies: they re-established their stable ties to partners and searched for expertise that would
enable them to distinguish between better and worse business projects.
However, the examination of network mechanisms’ effects on investment recipients’
outcomes suggests that such conservative co-investment strategy is not clearly beneficial.
Stability of investment partners makes any outcomes, positive or negative, less likely. The
outcomes of companies ‘coached’ by experienced investors do not differ from those of other
companies. Likewise, the syndicates that optimize experience and risks by including investors
with different levels of experience or different risk taking creeds do not offer clear benefits to the
funded companies. The only finding that testifies to the benefit of conservative investment is that
companies funded by risk-prone investors are less likely to go public and more likely to fail. Yet
note that risky investment strategy implies a higher failure rate by definition and does not
necessarily indicate low overall performance. As the conventional wisdom of venture capitalists
goes, you can lose your money only once but you can get it back hundredfold.
Two broader challenges arise in light of these results. The first is understanding why
embeddedness, experience and risk management are not clear economic advantages for venture
capitalists, even though there are cited as advantages by venture capitalists themselves. One path
that could lead to the answer was suggested by the work of Brian Uzzi (1997). Relying on his
data on New York City apparel industry, Uzzi argued that there is an optimal level of
embeddedness for economic actors; deviating to either side from this level has negative
consequences for actors’ outcomes. I performed a simple test of Uzzi’s hypothesis by converting
the partner stability index into a z-score, squaring it, and including in the regression model. This
did not lend support to the hypothesis, so the puzzle remains to be solved.

21
The second challenge is understanding the relationship between venture capitalists’
conservative business style and the general situation in the industry. The intuitively credible and
empirically supported proposition is that economic actors tend to form stable partnerships under
uncertain economic conditions even if forfeiting better opportunities with other partners (Kollock
1994). This suggests one possible reason why the conservative turn in VC firms’ partner stability
and experience coincided with the burst of the bubble in venture-funded high technology
industry: the uncertainty about the success prospects that came with the recession was the causal
antecedent of venture investors’ conservative strategies.
However, I urge the reader to entertain the possibility of opposite causality here. While
conservative network building strategy was hardly responsible for the 2000 crisis in high
technology industry, it may be an obstacle to overcoming it. As Sandefur and Laumann (1998)
point out, social capital has ambivalent organizational implications. On the one hand, it is an
important asset for individual and collective actors as it generates benefits like information,
influence and social solidarity. On the other hand they claim, in line with Portes and
Sensenbrenner (1993), that social capital may lead to excessive social control and ‘stifle
innovation [...] by restricting the scope of individual expression and the extent of
extracommunity contact’ (Sandefur and Laumann 1998: 493). In other words, they warn that
dense social networks tend to suppress unconventional ideas and inhibit the flow of non-
redundant information.
If so, then can rigid embedded networks of the ‘coaches’ of high technology facilitate
industrial breakthroughs like the one in the second half of the 1990s? The tentative answer is no.
It seems that venture capitalists with a bold vision and readiness to take risks detected and
developed the pathbreaking technological ideas of the 1990s and economically benefited from
22
them. By contrast, the conservative investors who have been in ascendance during the recession
appear to have invested in less revolutionary projects. Rearrangement of venture capital
networks and influx of investors ready to support unconventional ideas may be necessary before
these networks can facilitate a technological breakthrough of the magnitude that we witnessed in
the 1990s.
Note
This paper greatly benefited from Mark Granovetter’s and Dan McFarland’s expertise and encouragement.
I am indebted to Jonathan Haynes for his excellent work in preparing the dataset and to the members of
the economic sociology research group at Stanford University for their help and valuable feedback.
References
Admati, Anat R., and Paul C. Pfleiderer. 1994. ‘Robust financial contracting and the role of
venture capitalists’. Journal of Finance 49: 488-500.
Banatao, Dado P., and Kevin A. Fong. 2000. ‘The valley of deals. How venture capital helped
shape the region’. In The Silicon Valley edge. C.-M. Lee, W. F. Miller, M. G. Hancock,
and H. S. Rowen (eds), 295-313. Stanford: Stanford University Press.
Bernasconi, Michel, Ludovic Dibiaggio, and Michel Ferrary. 2005. ‘High-tech clusters:
network richness in Sophia Antipolis and Silicon Valley.’ In High-tech
entrepreneurship. M. Bernasconi, S. Harris, and M. Monsted (eds). London: Routledge.
Consulted while in press.

23
Carroll, Glenn R. 1985. ‘Concentration and specialization: dynamics of niche width in
populations of organizations.’ American Journal of Sociology 90: 1262-1283.
Castilla, Emilio J., Hokyu Hwang, Ellen Granovetter, and Mark Granovetter. 2000. ‘Social
networks in silicon valley.’ In The Silicon Valley edge. C.-M. Lee, W. F. Miller, M. G.
Hancock, and H. S. Rowen (eds), 218-247. Stanford: Stanford University Press.
de Graaf, Paul M. and Matthijs Kalmijn. 2003. ‘Alternative routes in the remarriage market:
Competing-risk analyses of union formation after divorce.’ Social Forces 81: 1459-1498.
Gompers, Paul, and Josh Lerner. 1999. The venture capital cycle. Cambridge, MA: The MIT
Press.
Gompers, Paul, and Josh Lerner. 2001. The money of invention: How venture capital creates new
wealth. Boston, MA: Harvard Business School Press.
Granovetter, Mark 1985. ‘Economic action and social structure: The problem of embeddedness.’
American Journal of Sociology 91: 481-510.
Hellmann, Thomas M. 2000. ‘Venture capitalists. The coaches of Silicon Valley.’ In The Silicon
Valley edge. C.-M. Lee, W. F. Miller, M. G. Hancock, and H. S. Rowen (eds), 276-294.
Stanford: Stanford University Press.
Kenney, Martin, and Richard Florida. 2000. ‘Venture capital in Silicon Valley: Fueling new firm
formation.’ In Understanding Silicon Valley. The anatomy of an entrepreneurial region.
M. Kenney (ed), 98-123. Stanford, Stanford University Press.
Kollock, Peter. 1994. ‘The emergence of exchange structures: An experimental study of
uncertainty, commitment, and trust.’ American Journal of Sociology 100: 313-345.
Lunn, Mary, and Don McNeil. 1995. ‘Applying Cox regression to competing risks.’ Biometrics
51: 524-532.

24
Podolny, Joel. 2001. ‘Networks as the pipes and prisms of the market.’ American Journal of
Sociology 107: 33-60.
Portes, Alejandro, and Julia Sensenbrenner. 1993. ‘Embeddedness and immigration: Notes on
the social determinants of economic action”. American Journal of Sociology 98: 1320-
1350.
Sandefur Rebecca L., and Edward O. Laumann. 1998. A paradigm for social capital. Rationality
and Society 10: 481-501.
Saxenian, AnnaLee. 1994. Regional advantage: Culture and competition in Silicon Valley and
Route 128. Cambridge, Mass.: Harvard University Press.
Sorenson, Olav and Toby E. Stuart. 2001. ‘Syndication networks and the spatial distribution of
venture capital investments.’ American Journal of Sociology 106: 1546-88.
Uzzi, Brian. 1997. ‘Social structure and competition in interfirm networks: The paradox of
embeddedness’. Administrative Science Quarterly 42: 35-67.
Williamson, Oliver. E. 1975. Markets and hierarchies: Analysis and antitrust implications. New
York: The Free Press.
Woolthuis, Rosalinde K., Bas Hillebrand, and Bart Nooteboom. 2005. ‘Trust, contract and
relationship development.’ Organization Studies 26: 813-840.
25
TABLES
Table 1. Mechanisms of Venture Capital Co-Investment Networks and Corresponding Measures
Measured Qualities Mechanisms Measures
Firm/Company
Level
Network Level
Trust
generation
Partner Stability Index Embeddedness;
Presence of stable
trusted partners
General level of
embeddedness
Opportunism
prevention
Information
Asymmetry
Exploitation Index
(IAEI)
Opportunistic
economic
behavior
General level of
opportunistic
economic
behavior
Experience
sharing and
management
Extent of inexperienced
investors’ involvement
in company
Consideration of
risks coming from
lack of experience
-
Risk sharing
and
management
Std. deviation of risk-
proneness indicator of
company’s investors
Heterogeneity of
investors in terms
of risk-proneness
-

Table 2. Means, Standard Deviations, and Correlations of Independent Variables
Variable Mean SD 1 2 3 4 5 6 7 8 9 10 11 12 13 14 15
1. Average betweenness centrality .53 .93
2. Proportion of network isolates .56 .48 0
3. Interaction var2 × var10 .14 .20 .07 .67
4. Company in Silicon Valley .09 .28 .12 0 -.02
5. Biotechnology .04 .20 .03 0 -.01 -.05
6. Communications and media .14 .35 -.01 0 -.02 .04 -.12
7. Computer related .32 .47 -.02 0 -.03 .07 -.20 -.38
8. Medical .08 .27 .04 0 .01 -.04 -.09 -.16 -.29
9. Semicond. and other electronics .06 .24 .03 -.01 -.02 .11 -.07 -.13 -.22 -.10
10. Partner stability (Scy) .26 .21 .14 .02 .58 -.03 -.02 -.03 -.06 .02 -.02
11. ln(experience) 3.38 1.58 .26 0 .31 .01 -.04 -.02 -.06 .02 -.03 .55
12. Risky investment strategy .06 .11 .08 .01 .12 .02 .04 -.06 -.03 .04 0 .22 .05
13. Inexp. investors in 1st round .17 .38 0 -.06 -.04 .01 0 -.01 -.01 0 .01 .01 .01 .01
14. Inexp. investors in later round .07 .25 0 -.23 -.15 .01 .01 0 -.01 .01 .02 -.01 -.02 -.01 -.12
15. SD of risk taking strategies .01 .03 .11 .02 -.09 .09 .06 -.02 .01 .05 .03 -.18 -.20 .14 -.01 0
16. IAEI .27 .24 0 -.01 -.05 .03 .02 -.01 .06 0 0 -.07 -.07 -.04 .01 .01 .05
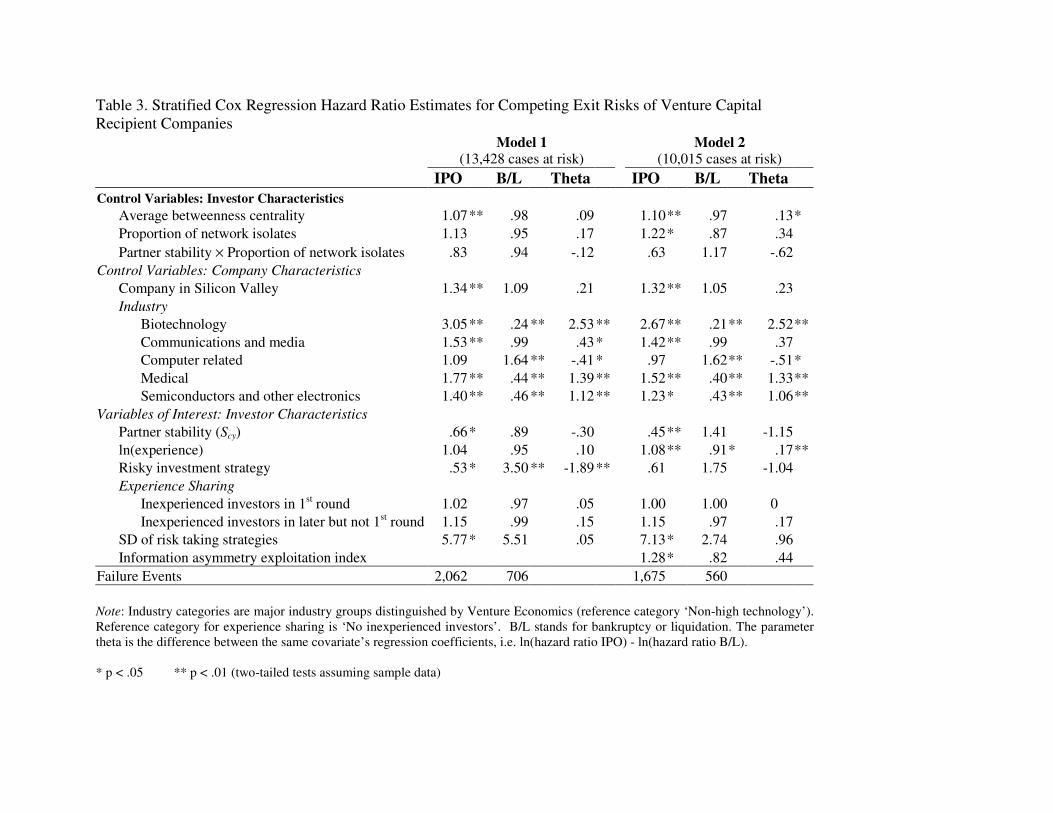
Table 3. Stratified Cox Regression Hazard Ratio Estimates for Competing Exit Risks of Venture Capital
Recipient Companies
Model 1 (13,428 cases at risk)
Model 2 (10,015 cases at risk)
IPO B/L Theta IPO B/L Theta
Control Variables: Investor Characteristics
Average betweenness centrality 1.07 ** .98 .09 1.10 ** .97 .13*
Proportion of network isolates 1.13 .95 .17 1.22 * .87 .34
Partner stability × Proportion of network isolates .83 .94 -.12 .63 1.17 -.62
Control Variables: Company Characteristics
Company in Silicon Valley 1.34 ** 1.09 .21 1.32 ** 1.05 .23
Industry
Biotechnology 3.05 ** .24 ** 2.53 ** 2.67 ** .21** 2.52**
Communications and media 1.53 ** .99 .43 * 1.42 ** .99 .37
Computer related 1.09 1.64 ** -.41 * .97 1.62** -.51*
Medical 1.77 ** .44 ** 1.39 ** 1.52 ** .40** 1.33**
Semiconductors and other electronics 1.40 ** .46 ** 1.12 ** 1.23 * .43** 1.06**
Variables of Interest: Investor Characteristics
Partner stability (Scy) .66 * .89 -.30 .45 ** 1.41 -1.15
ln(experience) 1.04 .95 .10 1.08 ** .91* .17**
Risky investment strategy .53 * 3.50 ** -1.89 ** .61 1.75 -1.04
Experience Sharing
Inexperienced investors in 1st round 1.02 .97 .05 1.00 1.00 0
Inexperienced investors in later but not 1st round 1.15 .99 .15 1.15 .97 .17
SD of risk taking strategies 5.77 * 5.51 .05 7.13 * 2.74 .96
Information asymmetry exploitation index 1.28 * .82 .44
Failure Events 2,062 706 1,675 560
Note: Industry categories are major industry groups distinguished by Venture Economics (reference category ‘Non-high technology’).
Reference category for experience sharing is ‘No inexperienced investors’. B/L stands for bankruptcy or liquidation. The parameter
theta is the difference between the same covariate’s regression coefficients, i.e. ln(hazard ratio IPO) - ln(hazard ratio B/L).
* p < .05 ** p < .01 (two-tailed tests assuming sample data)
FIGURES
Figure 1: Testing for the Proportional Hazard Assumption: Log-Log Plot by
Type of Companies’ Exit

29
Figure 2. Stability of Venture Capital Firms’ Market Participation and Their Co-Investment Ties,
1986-2001
Market Participation of Venture Capital Firms
0
500
1000
1500
2000
2500
3000
3500
4000
1986
1987
1988
1989
1990
1991
1992
1993
1994
1995
1996
1997
1998
1999
2000
2001
2002
Firmsinvesting inthis but notprevious year
Firmsinvesting inthis andprevious year
(a)
Stable Venture Capital Co-Investment Ties
As Percentage of Total
0
10
20
30
40
19
86
19
87
19
88
19
89
19
90
19
91
19
92
19
93
19
94
19
95
19
96
19
97
19
98
19
99
20
00
20
01
20
02
(b)
Note: Ties are considered stable if they existed in one or both of the previous two calendar years.
30
Figure 3. Experience of Venture Capital Investors, 1980-2002
(a) (b) Note: The median and the mean are not distinguished in Figure 2(b) because they roughly coincide. The measures
are calculated only for firms that invest during a given year.
31
Figure 4. Average Round-to-Round Change of Investment Share in
Venture Capital Recipient Companies, 1985-2001
20
22
24
26
28
3019
8519
8619
8719
8819
8919
9019
9119
9219
9319
9419
9519
9619
9719
9819
9920
0020
01
Year
Perc
en
tag
e p
oin
ts
32
Figure 5. Hazard of Company Exit vs. Company Age by Exit Type and
Isolate Status
Recommended

![VENTURE CAPITAL FOR SUSTAINABILITY 2007 REPORT [2007] Venture Capital... · growing sector as Venture Capital for Sustainability ... Venture Capitalists’ stake in ... Venture Capital](https://img.pdfslide.net/doc/110x75/5a7926b77f8b9a00168dc540/venture-capital-for-sustainability-2007-2007-venture-capitalgrowing-sector.jpg)