Presented by Berkery Noyes 1
December 2010Full Year Mergers and Acquisitions Trends Report
MEDIA INDUSTRY 2010 Key Highlights
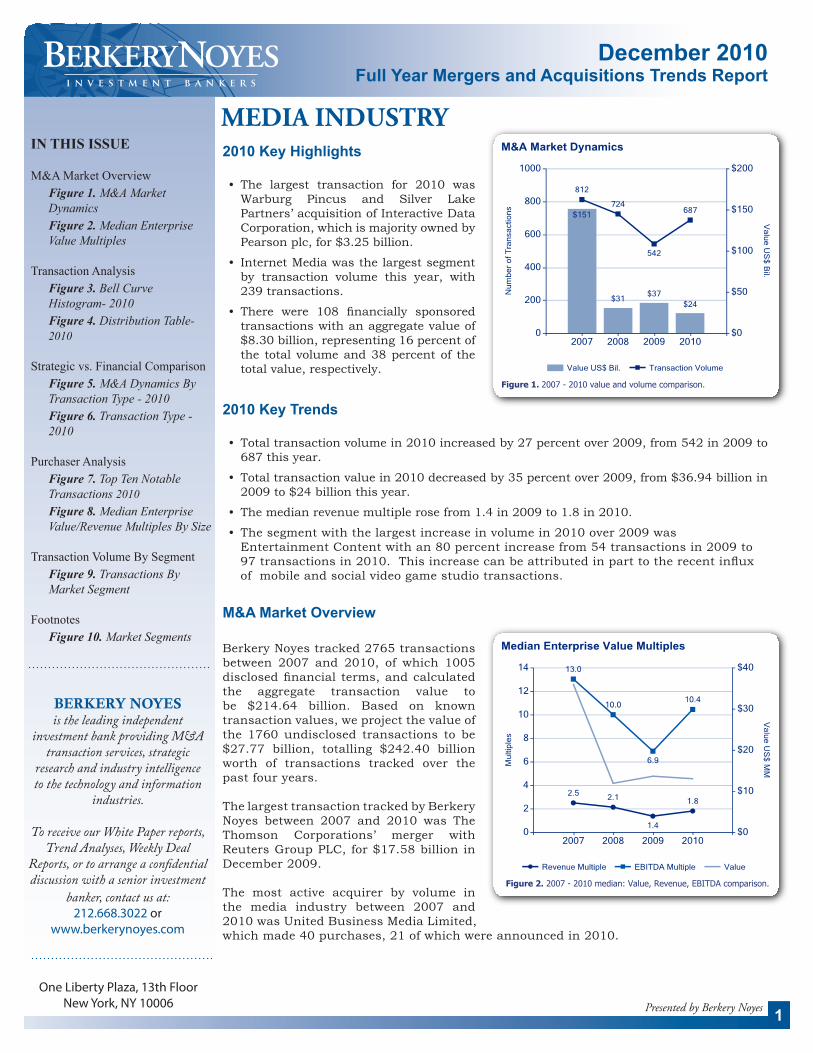
• The largest transaction for 2010 wasWarburg Pincus and Silver LakePartners’acquisitionofInteractiveDataCorporation,whichismajorityownedbyPearsonplc,for$3.25billion.
• InternetMediawasthelargestsegmentby transaction volume this year, with239transactions.
• There were 108 financially sponsoredtransactionswithanaggregatevalueof$8.30billion,representing16percentofthe totalvolumeand38percentof thetotalvalue,respectively.
2010 Key Trends
• Totaltransactionvolumein2010increasedby27percentover2009,from542in2009to687thisyear.
• Totaltransactionvaluein2010decreasedby35percentover2009,from$36.94billionin2009to$24billionthisyear.
• Themedianrevenuemultiplerosefrom1.4in2009to1.8in2010.
• Thesegmentwiththelargestincreaseinvolumein2010over2009wasEntertainmentContentwithan80percentincreasefrom54transactionsin2009to97transactionsin2010.Thisincreasecanbeattributedinparttotherecentinfluxofmobileandsocialvideogamestudiotransactions.
M&A Market OverviewBerkeryNoyestracked2765transactionsbetween 2007 and 2010, of which 1005disclosedfinancial terms,andcalculatedthe aggregate transaction value tobe $214.64 billion. Based on knowntransactionvalues,weprojectthevalueofthe 1760undisclosed transactions to be$27.77 billion, totalling $242.40 billionworth of transactions tracked over thepastfouryears.
ThelargesttransactiontrackedbyBerkeryNoyes between 2007 and 2010 was TheThomson Corporations’ merger withReutersGroupPLC,for$17.58billioninDecember2009.The most active acquirer by volume inthe media industry between 2007 and2010wasUnitedBusinessMediaLimited,whichmade40purchases,21ofwhichwereannouncedin2010.
One Liberty Plaza, 13th Floor New York, NY 10006
IN THIS ISSUE
M&A Market OverviewFigure 1. M&A Market DynamicsFigure 2. Median Enterprise Value Multiples
Transaction AnalysisFigure 3. Bell Curve Histogram- 2010 Figure 4. Distribution Table- 2010
Strategic vs. Financial ComparisonFigure 5. M&A Dynamics By Transaction Type - 2010Figure 6. Transaction Type - 2010
Purchaser AnalysisFigure 7. Top Ten Notable Transactions 2010Figure 8. Median Enterprise Value/Revenue Multiples By Size
Transaction Volume By Segment
Figure 9. Transactions By Market Segment
FootnotesFigure 10. Market Segments
BERKERY NOYESis the leading independent
investment bank providing M&A transaction services, strategic
research and industry intelligence to the technology and information
industries.
To receive our White Paper reports, Trend Analyses, Weekly Deal
Reports, or to arrange a confidential discussion with a senior investment
banker, contact us at: 212.668.3022 or
www.berkerynoyes.com
Figure 1. 2007 - 2010 value and volume comparison.
Figure 2. 2007 - 2010 median: Value, Revenue, EBITDA comparison.
2
STRATEGIC VS. FINANCIAL COMPARISON
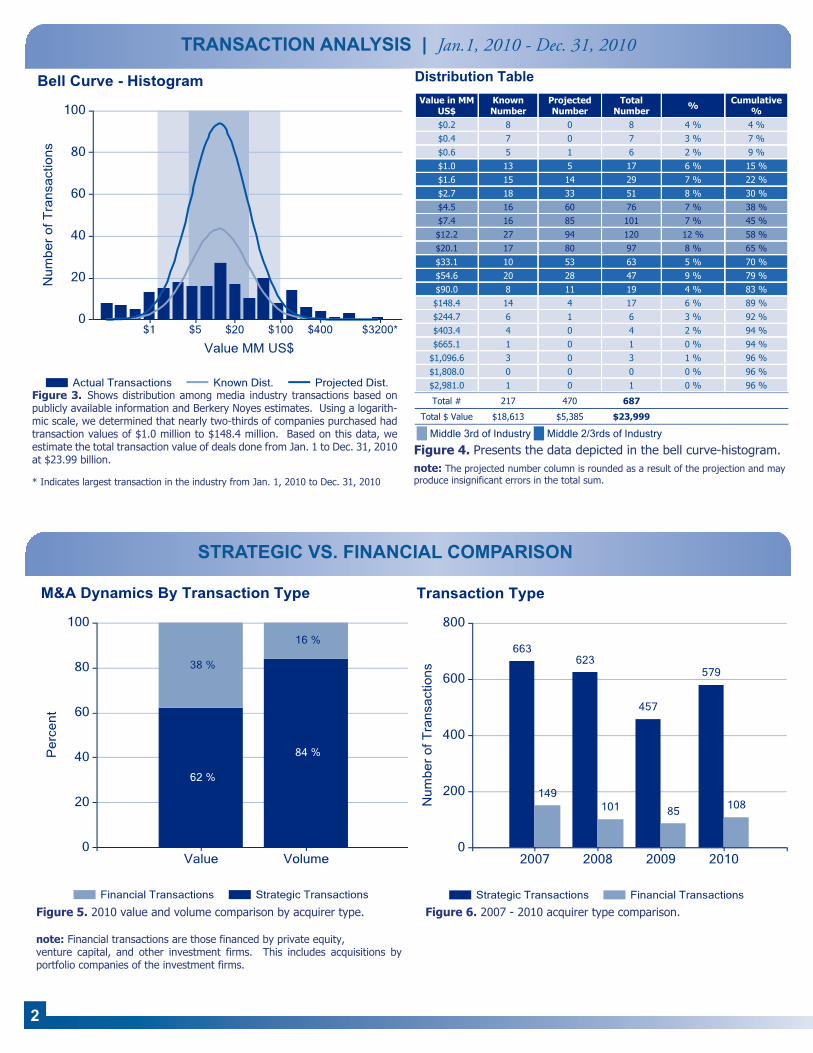
Figure 6. 2007 - 2010 acquirer type comparison.Figure 5. 2010 value and volume comparison by acquirer type.
note: Financial transactions are those financed by private equity, venture capital, and other investment firms. This includes acquisitions by portfolio companies of the investment firms.
TRANSACTION ANALYSIS | Jan.1, 2010 - Dec. 31, 2010
Distribution TableValue in MM
US$KnownNumber
Projected Number
Total Number % Cumulative
%$0.2 8 0 8 4 % 4 %$0.4 7 0 7 3 % 7 %$0.6 5 1 6 2 % 9 %$1.0 13 5 17 6 % 15 %$1.6 15 14 29 7 % 22 %$2.7 18 33 51 8 % 30 %$4.5 16 60 76 7 % 38 %$7.4 16 85 101 7 % 45 %$12.2 27 94 120 12 % 58 %$20.1 17 80 97 8 % 65 %$33.1 10 53 63 5 % 70 %$54.6 20 28 47 9 % 79 %$90.0 8 11 19 4 % 83 %$148.4 14 4 17 6 % 89 %$244.7 6 1 6 3 % 92 %$403.4 4 0 4 2 % 94 %$665.1 1 0 1 0 % 94 %
$1,096.6 3 0 3 1 % 96 %$1,808.0 0 0 0 0 % 96 %$2,981.0 1 0 1 0 % 96 %
Total # 217 470 687
Total $ Value $18,613 $5,385 $23,999
Middle 3rd of Industry Middle 2/3rds of Industry
Figure 4. Presents the data depicted in the bell curve-histogram.note: The projected number column is rounded as a result of the projection and may produce insignificant errors in the total sum.
Figure 3. Shows distribution among media industry transactions based on publicly available information and Berkery Noyes estimates. Using a logarith-mic scale, we determined that nearly two-thirds of companies purchased had transaction values of $1.0 million to $148.4 million. Based on this data, we estimate the total transaction value of deals done from Jan. 1 to Dec. 31, 2010 at $23.99 billion.
* Indicates largest transaction in the industry from Jan. 1, 2010 to Dec. 31, 2010
3©2011 Berkery Noyes
Distribution TableValue in MM
US$KnownNumber
Projected Number
Total Number % Cumulative
%$0.2 8 0 8 4 % 4 %$0.4 7 0 7 3 % 7 %$0.6 5 1 6 2 % 9 %$1.0 13 5 17 6 % 15 %$1.6 15 14 29 7 % 22 %$2.7 18 33 51 8 % 30 %$4.5 16 60 76 7 % 38 %$7.4 16 85 101 7 % 45 %$12.2 27 94 120 12 % 58 %$20.1 17 80 97 8 % 65 %$33.1 10 53 63 5 % 70 %$54.6 20 28 47 9 % 79 %$90.0 8 11 19 4 % 83 %$148.4 14 4 17 6 % 89 %$244.7 6 1 6 3 % 92 %$403.4 4 0 4 2 % 94 %$665.1 1 0 1 0 % 94 %
$1,096.6 3 0 3 1 % 96 %$1,808.0 0 0 0 0 % 96 %$2,981.0 1 0 1 0 % 96 %
Total # 217 470 687
Total $ Value $18,613 $5,385 $23,999
Middle 3rd of Industry Middle 2/3rds of Industry
PURCHASER ANALYSIS | Jan. 1, 2010 - Dec. 31, 2010
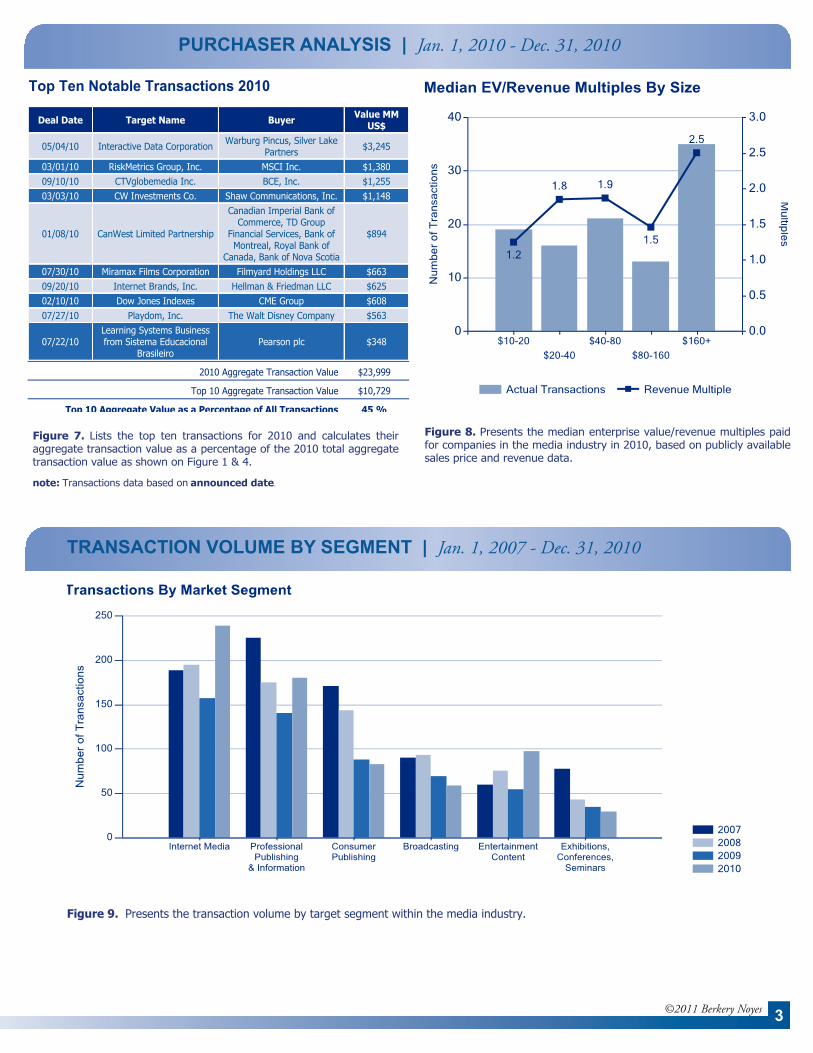
Figure 8. Presents the median enterprise value/revenue multiples paid for companies in the media industry in 2010, based on publicly available sales price and revenue data.
Figure 7. Lists the top ten transactions for 2010 and calculates their aggregate transaction value as a percentage of the 2010 total aggregate transaction value as shown on Figure 1 & 4.
note: Transactions data based on announced date.
Top Ten Notable Transactions 2010
Deal Date Target Name Buyer Value MM US$
05/04/10 Interactive Data Corporation Warburg Pincus, Silver Lake Partners $3,245
03/01/10 RiskMetrics Group, Inc. MSCI Inc. $1,38009/10/10 CTVglobemedia Inc. BCE, Inc. $1,25503/03/10 CW Investments Co. Shaw Communications, Inc. $1,148
01/08/10 CanWest Limited Partnership
Canadian Imperial Bank of Commerce, TD Group
Financial Services, Bank of Montreal, Royal Bank of
Canada, Bank of Nova Scotia
$894
07/30/10 Miramax Films Corporation Filmyard Holdings LLC $66309/20/10 Internet Brands, Inc. Hellman & Friedman LLC $62502/10/10 Dow Jones Indexes CME Group $60807/27/10 Playdom, Inc. The Walt Disney Company $563
07/22/10Learning Systems Business from Sistema Educacional
BrasileiroPearson plc $348
2010 Aggregate Transaction Value $23,999
Top 10 Aggregate Transaction Value $10,729
Top 10 Aggregate Value as a Percentage of All Transactions 45 %
TRANSACTION VOLUME BY SEGMENT | Jan. 1, 2007 - Dec. 31, 2010
Figure 9. Presents the transaction volume by target segment within the media industry.
berkerynoyes.com | One Liberty Plaza | New York, New York 10006 | 212.668.3022
About Berkery Noyes
Founded in 1980, Berkery Noyes is the leading independent investment bank specializing in the information content and technology industries. The firm has initiated, managed and closed more than 475 merger and acquisition transactions for privately held and publicly traded companies in the business, technol-ogy, education, health, financial and legal information segments. Berkery Noyes is unique among investment banking firms in that we combine truly independent strategic research and industry intelligence with senior information technology banking expertise. With no equity fund or brokerage business to manage, our partners and investment bank-ing professionals are one hundred percent focused on M&A advisory services. Berkery Noyes employs over 40 individuals with deep industry knowledge and experience who strive to exceed our clients’ expecta-tions by maximizing the full value of their information technology and content assets.
All charts in this report are based on data gathered by Berkery Noyes
research department. All time period statistics are based on the transaction announcement date.
For current intelligence on Merger and Acquisition activity in the
Information Industry please visit our online service at
www.mandasoft.com
©2011 Berkery Noyes
Contact us today for a confidential discussion of your strategic options.
4
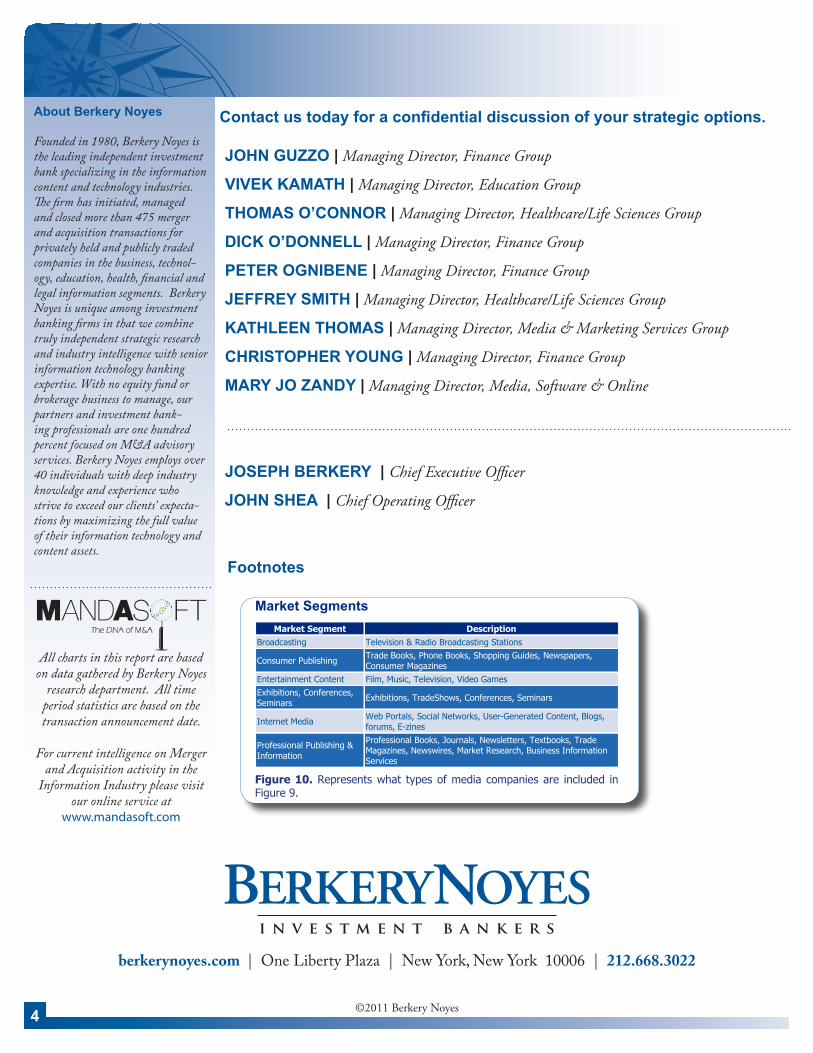
Figure 10. Represents what types of media companies are included in Figure 9.
Market SegmentsMarket Segment Description
Broadcasting Television & Radio Broadcasting Stations
Consumer Publishing Trade Books, Phone Books, Shopping Guides, Newspapers, Consumer Magazines
Entertainment Content Film, Music, Television, Video GamesExhibitions, Conferences, Seminars Exhibitions, TradeShows, Conferences, Seminars
Internet Media Web Portals, Social Networks, User-Generated Content, Blogs, forums, E-zines
Professional Publishing & Information
Professional Books, Journals, Newsletters, Textbooks, Trade Magazines, Newswires, Market Research, Business Information Services
Footnotes
JOHN GUZZO | Managing Director, Finance Group
VIVEK KAMATH | Managing Director, Education Group
THOMAS O’CONNOR | Managing Director, Healthcare/Life Sciences Group
DICK O’DONNELL | Managing Director, Finance Group
PETER OGNIBENE | Managing Director, Finance Group
JEFFREY SMITH | Managing Director, Healthcare/Life Sciences Group
KATHLEEN THOMAS | Managing Director, Media & Marketing Services Group
CHRISTOPHER YOUNG | Managing Director, Finance Group
MARY JO ZANDY | Managing Director, Media, Software & Online
JOSEPH BERKERY | Chief Executive Officer
JOHN SHEA | Chief Operating Officer
The DNA of M&A
Recommended