TEXAS EDUCATION AGENCY2017 Accountability Summary
MACARTHUR H S (015910002) - NORTH EAST ISD
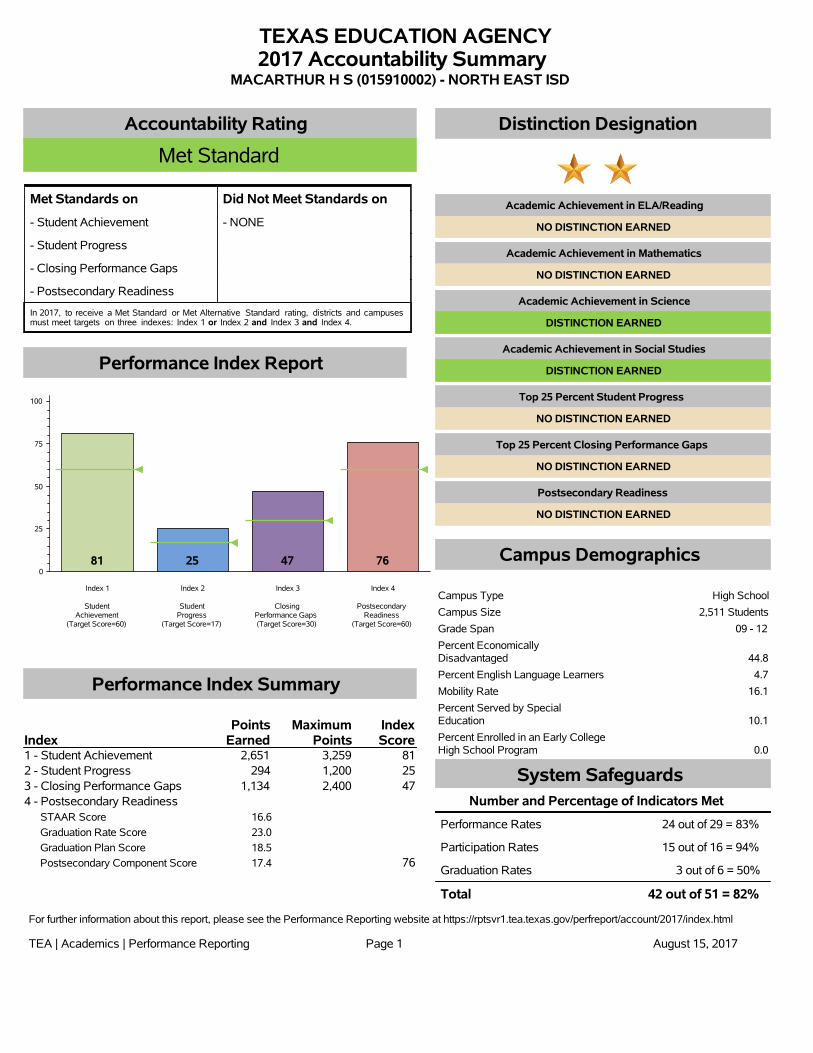
Accountability Rating
Met Standard
Met Standards on Did Not Meet Standards on
- Student Achievement - NONE
- Student Progress
- Closing Performance Gaps
- Postsecondary Readiness
In 2017, to receive a Met Standard or Met Alternative Standard rating, districts and campusesmust meet targets on three indexes: Index 1 or Index 2 and Index 3 and Index 4.
Performance Index Report
0
25
50
75
100
Index 1
StudentAchievement
(Target Score=60)
Index 2
StudentProgress
(Target Score=17)
Index 3
ClosingPerformance Gaps(Target Score=30)
Index 4
PostsecondaryReadiness
(Target Score=60)
81 25 47 76
Performance Index Summary
IndexPoints
EarnedMaximum
PointsIndexScore
1 - Student Achievement 2,651 3,259 812 - Student Progress 294 1,200 253 - Closing Performance Gaps 1,134 2,400 474 - Postsecondary Readiness
STAAR Score 16.6
Graduation Rate Score 23.0
Graduation Plan Score 18.5
Postsecondary Component Score 17.4 76
Distinction Designation
Academic Achievement in ELA/Reading
NO DISTINCTION EARNED
Academic Achievement in Mathematics
NO DISTINCTION EARNED
Academic Achievement in Science
DISTINCTION EARNED
Academic Achievement in Social Studies
DISTINCTION EARNED
Top 25 Percent Student Progress
NO DISTINCTION EARNED
Top 25 Percent Closing Performance Gaps
NO DISTINCTION EARNED
Postsecondary Readiness
NO DISTINCTION EARNED
Campus Demographics
Campus Type High School
Campus Size 2,511 Students
Grade Span 09 - 12
Percent EconomicallyDisadvantaged 44.8
Percent English Language Learners 4.7
Mobility Rate 16.1
Percent Served by SpecialEducation 10.1
Percent Enrolled in an Early CollegeHigh School Program 0.0
System SafeguardsNumber and Percentage of Indicators Met
Performance Rates 24 out of 29 = 83%
Participation Rates 15 out of 16 = 94%
Graduation Rates 3 out of 6 = 50%
Total 42 out of 51 = 82%
For further information about this report, please see the Performance Reporting website at https://rptsvr1.tea.texas.gov/perfreport/account/2017/index.html
TEA | Academics | Performance Reporting Page 1 August 15, 2017
TEA | Academics | Performance Reporting Page 1 of 2 August 15, 2017
- Indicates there are no students in the subject.
* Indicates results are masked due to small numbers to protect student confidentiality.
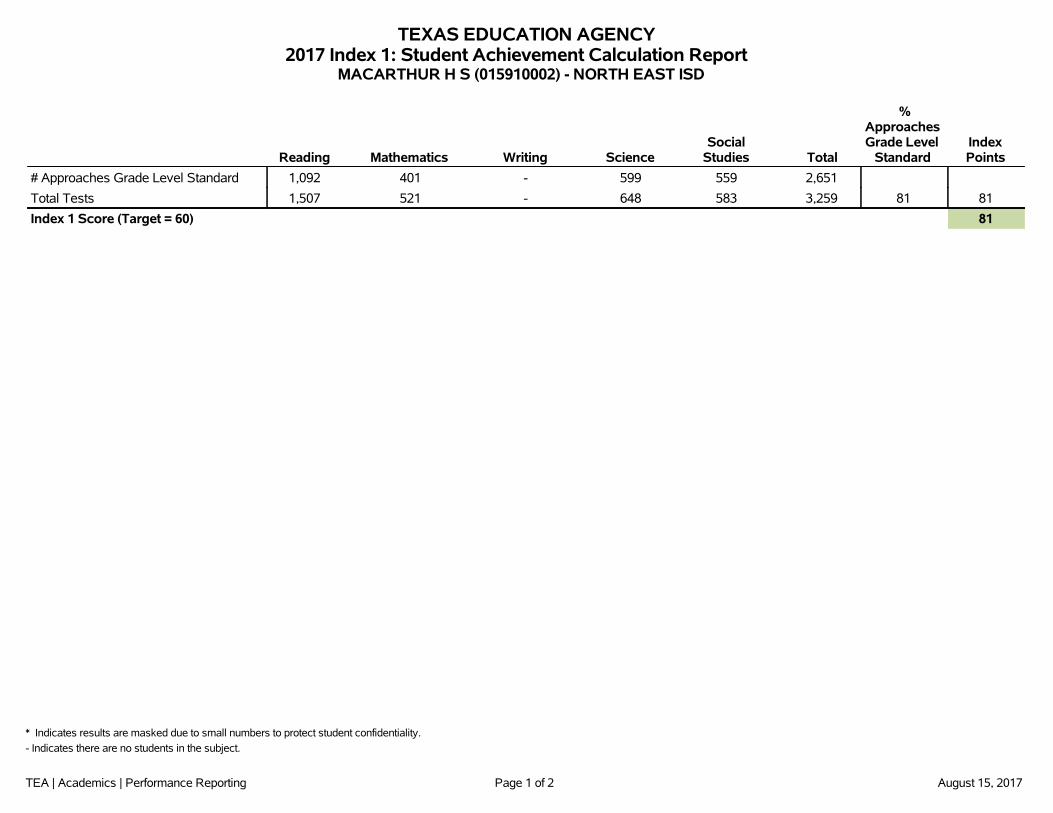
TEXAS EDUCATION AGENCY2017 Index 1: Student Achievement Calculation Report
MACARTHUR H S (015910002) - NORTH EAST ISD
Reading Mathematics Writing ScienceSocial
Studies Total
%ApproachesGrade Level
StandardIndexPoints
# Approaches Grade Level Standard 1,092 401 - 599 559 2,651
Total Tests 1,507 521 - 648 583 3,259 81 81
Index 1 Score (Target = 60) 81
TEA | Academics | Performance Reporting Page 2 of 2 August 15, 2017
- Indicates there are no students in the group.** When only one racial/ethnic group is masked, then the second smallest racial/ethnic group is masked (regardless of size).
* Indicates results are masked due to small numbers to protect student confidentiality.
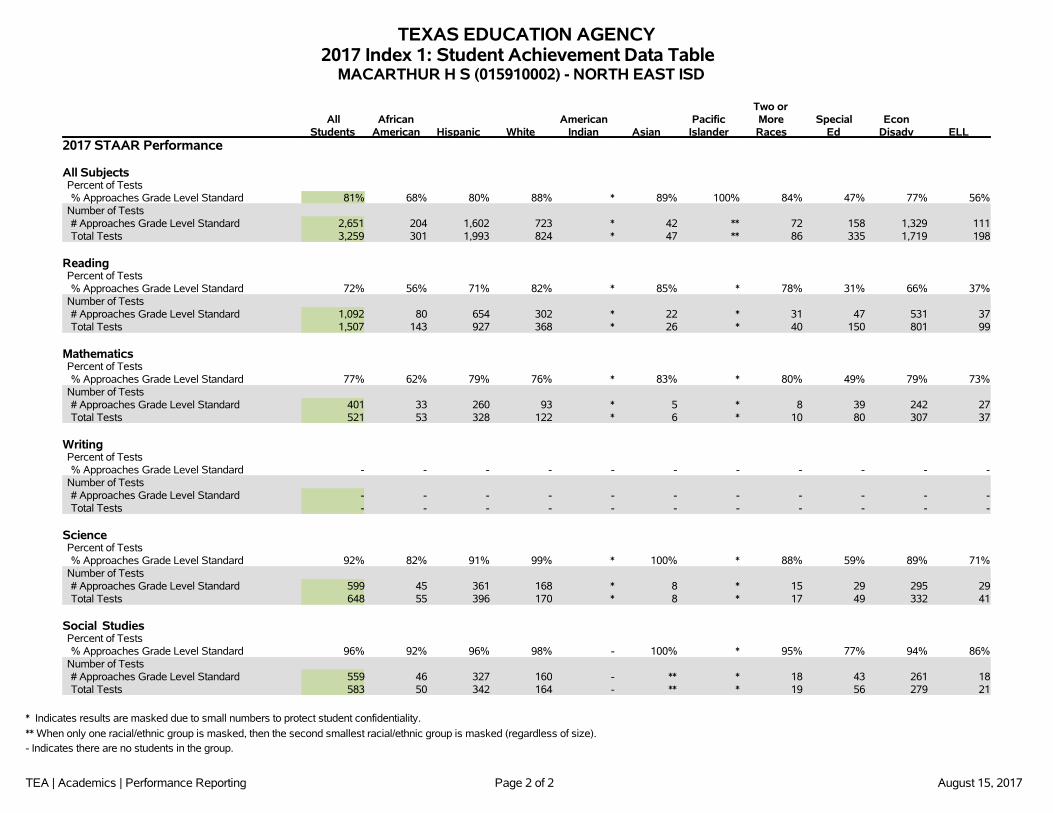
TEXAS EDUCATION AGENCY2017 Index 1: Student Achievement Data Table
MACARTHUR H S (015910002) - NORTH EAST ISD
AllStudents
AfricanAmerican Hispanic White
AmericanIndian Asian
PacificIslander
Two orMoreRaces
SpecialEd
EconDisadv ELL
2017 STAAR Performance
All SubjectsPercent of Tests% Approaches Grade Level Standard 81% 68% 80% 88% * 89% 100% 84% 47% 77% 56%
Number of Tests# Approaches Grade Level Standard 2,651 204 1,602 723 * 42 ** 72 158 1,329 111Total Tests 3,259 301 1,993 824 * 47 ** 86 335 1,719 198
ReadingPercent of Tests% Approaches Grade Level Standard 72% 56% 71% 82% * 85% * 78% 31% 66% 37%
Number of Tests# Approaches Grade Level Standard 1,092 80 654 302 * 22 * 31 47 531 37Total Tests 1,507 143 927 368 * 26 * 40 150 801 99
MathematicsPercent of Tests% Approaches Grade Level Standard 77% 62% 79% 76% * 83% * 80% 49% 79% 73%
Number of Tests# Approaches Grade Level Standard 401 33 260 93 * 5 * 8 39 242 27Total Tests 521 53 328 122 * 6 * 10 80 307 37
WritingPercent of Tests% Approaches Grade Level Standard - - - - - - - - - - -
Number of Tests# Approaches Grade Level Standard - - - - - - - - - - -Total Tests - - - - - - - - - - -
SciencePercent of Tests% Approaches Grade Level Standard 92% 82% 91% 99% * 100% * 88% 59% 89% 71%
Number of Tests# Approaches Grade Level Standard 599 45 361 168 * 8 * 15 29 295 29Total Tests 648 55 396 170 * 8 * 17 49 332 41
Social StudiesPercent of Tests% Approaches Grade Level Standard 96% 92% 96% 98% - 100% * 95% 77% 94% 86%
Number of Tests# Approaches Grade Level Standard 559 46 327 160 - ** * 18 43 261 18Total Tests 583 50 342 164 - ** * 19 56 279 21
TEA | Academics | Performance Reporting Page 1 of 2 August 15, 2017
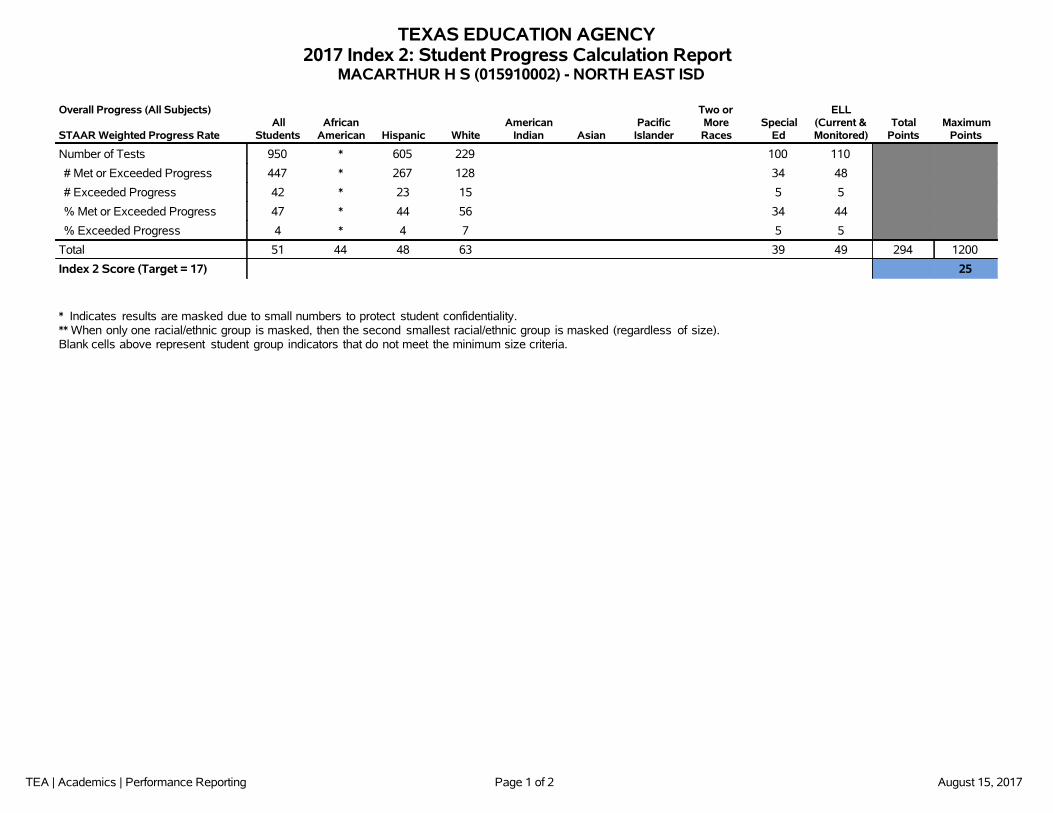
TEXAS EDUCATION AGENCY2017 Index 2: Student Progress Calculation Report
MACARTHUR H S (015910002) - NORTH EAST ISD
Overall Progress (All Subjects)
STAAR Weighted Progress RateAll
StudentsAfrican
American Hispanic WhiteAmerican
Indian AsianPacific
Islander
Two orMoreRaces
SpecialEd
ELL(Current &Monitored)
TotalPoints
MaximumPoints
Number of Tests 950 * 605 229 100 110
# Met or Exceeded Progress 447 * 267 128 34 48
# Exceeded Progress 42 * 23 15 5 5
% Met or Exceeded Progress 47 * 44 56 34 44
% Exceeded Progress 4 * 4 7 5 5
Total 51 44 48 63 39 49 294 1200
Index 2 Score (Target = 17) 25
* Indicates results are masked due to small numbers to protect student confidentiality.** When only one racial/ethnic group is masked, then the second smallest racial/ethnic group is masked (regardless of size).Blank cells above represent student group indicators that do not meet the minimum size criteria.
TEA | Academics | Performance Reporting Page 2 of 2 August 15, 2017
- Indicates there are no students in the group.** When only one racial/ethnic group is masked, then the second smallest racial/ethnic group is masked (regardless of size).
* Indicates results are masked due to small numbers to protect student confidentiality.
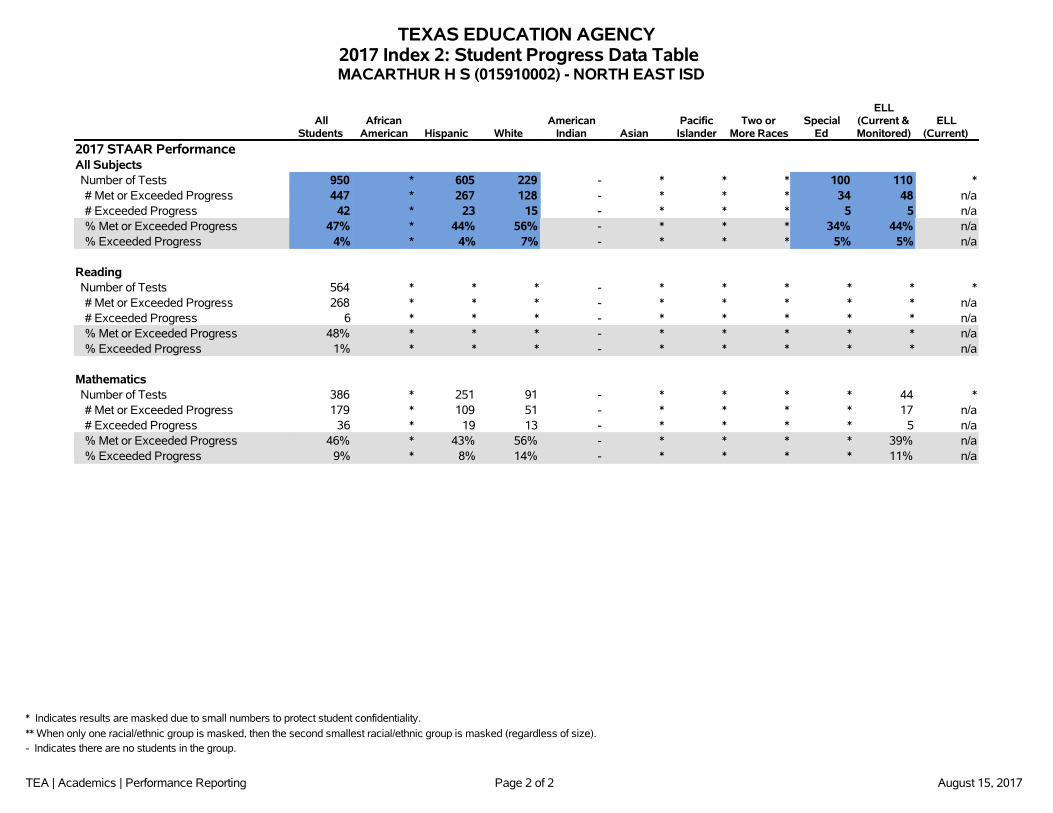
TEXAS EDUCATION AGENCY2017 Index 2: Student Progress Data TableMACARTHUR H S (015910002) - NORTH EAST ISD
AllStudents
AfricanAmerican Hispanic White
AmericanIndian Asian
PacificIslander
Two orMore Races
SpecialEd
ELL(Current &Monitored)
ELL(Current)
2017 STAAR PerformanceAll SubjectsNumber of Tests 950 * 605 229 - * * * 100 110 *# Met or Exceeded Progress 447 * 267 128 - * * * 34 48 n/a# Exceeded Progress 42 * 23 15 - * * * 5 5 n/a% Met or Exceeded Progress 47% * 44% 56% - * * * 34% 44% n/a% Exceeded Progress 4% * 4% 7% - * * * 5% 5% n/a
ReadingNumber of Tests 564 * * * - * * * * * *# Met or Exceeded Progress 268 * * * - * * * * * n/a# Exceeded Progress 6 * * * - * * * * * n/a% Met or Exceeded Progress 48% * * * - * * * * * n/a% Exceeded Progress 1% * * * - * * * * * n/a
MathematicsNumber of Tests 386 * 251 91 - * * * * 44 *# Met or Exceeded Progress 179 * 109 51 - * * * * 17 n/a# Exceeded Progress 36 * 19 13 - * * * * 5 n/a% Met or Exceeded Progress 46% * 43% 56% - * * * * 39% n/a% Exceeded Progress 9% * 8% 14% - * * * * 11% n/a
TEA | Academics | Performance Reporting Page 1 of 5 August 15, 2017
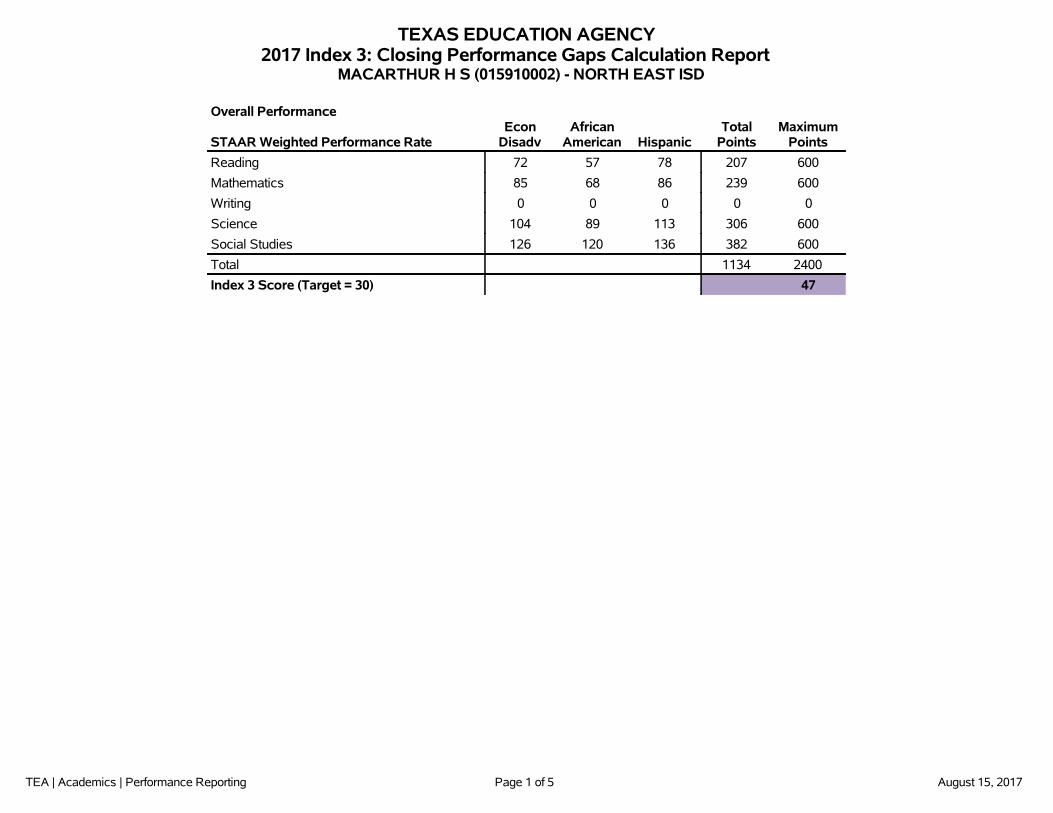
TEXAS EDUCATION AGENCY2017 Index 3: Closing Performance Gaps Calculation Report
MACARTHUR H S (015910002) - NORTH EAST ISD
Overall Performance
STAAR Weighted Performance RateEcon
DisadvAfrican
American HispanicTotal
PointsMaximum
Points
Reading 72 57 78 207 600
Mathematics 85 68 86 239 600
Writing 0 0 0 0 0
Science 104 89 113 306 600
Social Studies 126 120 136 382 600
Total 1134 2400
Index 3 Score (Target = 30) 47
TEA | Academics | Performance Reporting Page 2 of 5 August 15, 2017
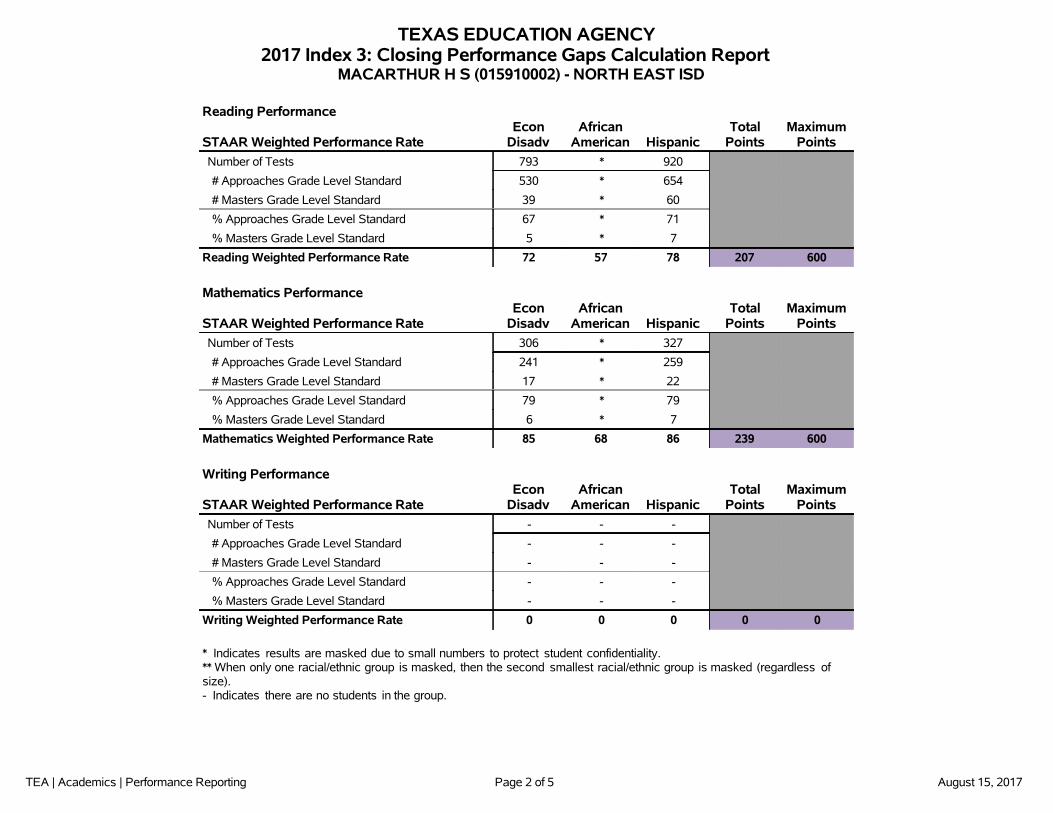
TEXAS EDUCATION AGENCY2017 Index 3: Closing Performance Gaps Calculation Report
MACARTHUR H S (015910002) - NORTH EAST ISD
Reading Performance
STAAR Weighted Performance RateEcon
DisadvAfrican
American HispanicTotal
PointsMaximum
Points
Number of Tests 793 * 920
# Approaches Grade Level Standard 530 * 654
# Masters Grade Level Standard 39 * 60
% Approaches Grade Level Standard 67 * 71
% Masters Grade Level Standard 5 * 7
Reading Weighted Performance Rate 72 57 78 207 600
Mathematics Performance
STAAR Weighted Performance RateEcon
DisadvAfrican
American HispanicTotal
PointsMaximum
Points
Number of Tests 306 * 327
# Approaches Grade Level Standard 241 * 259
# Masters Grade Level Standard 17 * 22
% Approaches Grade Level Standard 79 * 79
% Masters Grade Level Standard 6 * 7
Mathematics Weighted Performance Rate 85 68 86 239 600
Writing Performance
STAAR Weighted Performance RateEcon
DisadvAfrican
American HispanicTotal
PointsMaximum
Points
Number of Tests - - -
# Approaches Grade Level Standard - - -
# Masters Grade Level Standard - - -
% Approaches Grade Level Standard - - -
% Masters Grade Level Standard - - -
Writing Weighted Performance Rate 0 0 0 0 0
* Indicates results are masked due to small numbers to protect student confidentiality.** When only one racial/ethnic group is masked, then the second smallest racial/ethnic group is masked (regardless ofsize).- Indicates there are no students in the group.
TEA | Academics | Performance Reporting Page 3 of 5 August 15, 2017
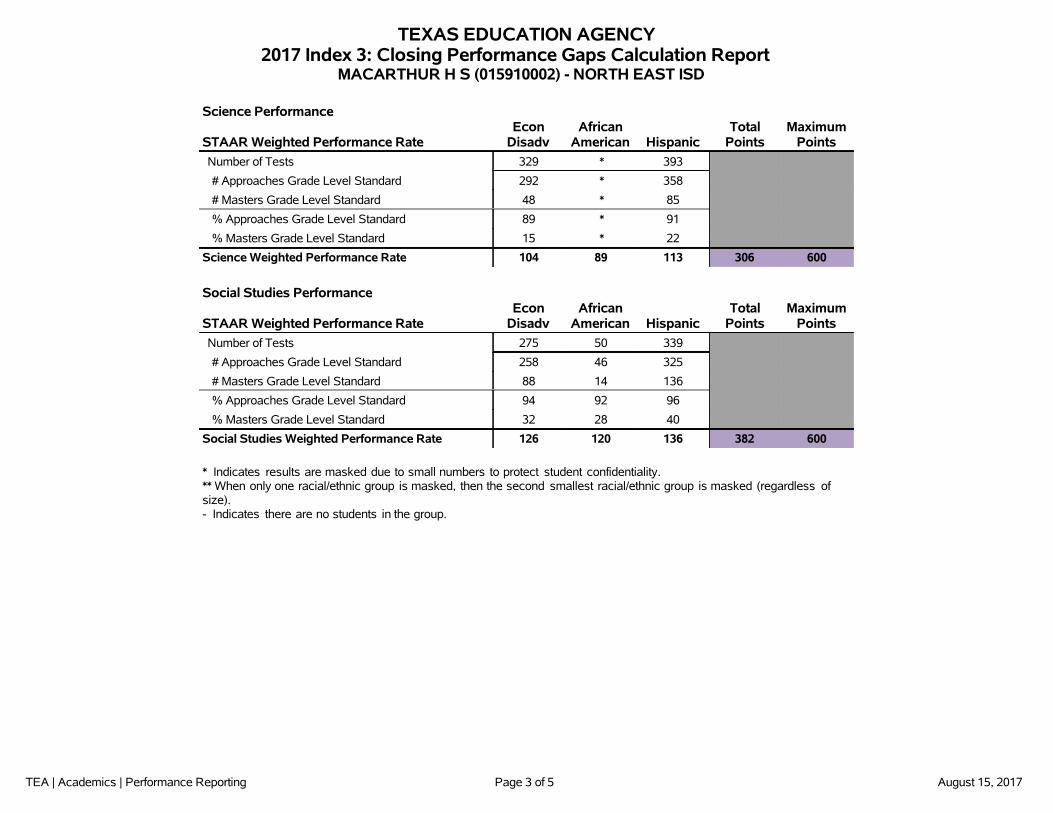
TEXAS EDUCATION AGENCY2017 Index 3: Closing Performance Gaps Calculation Report
MACARTHUR H S (015910002) - NORTH EAST ISD
Science Performance
STAAR Weighted Performance RateEcon
DisadvAfrican
American HispanicTotal
PointsMaximum
Points
Number of Tests 329 * 393
# Approaches Grade Level Standard 292 * 358
# Masters Grade Level Standard 48 * 85
% Approaches Grade Level Standard 89 * 91
% Masters Grade Level Standard 15 * 22
Science Weighted Performance Rate 104 89 113 306 600
Social Studies Performance
STAAR Weighted Performance RateEcon
DisadvAfrican
American HispanicTotal
PointsMaximum
Points
Number of Tests 275 50 339
# Approaches Grade Level Standard 258 46 325
# Masters Grade Level Standard 88 14 136
% Approaches Grade Level Standard 94 92 96
% Masters Grade Level Standard 32 28 40
Social Studies Weighted Performance Rate 126 120 136 382 600
* Indicates results are masked due to small numbers to protect student confidentiality.** When only one racial/ethnic group is masked, then the second smallest racial/ethnic group is masked (regardless ofsize).- Indicates there are no students in the group.
TEA | Academics | Performance Reporting Page 4 of 5 August 15, 2017
- Indicates there are no students in the group.** When only one racial/ethnic group is masked, then the second smallest racial/ethnic group is masked (regardless of size).
* Indicates results are masked due to small numbers to protect student confidentiality.
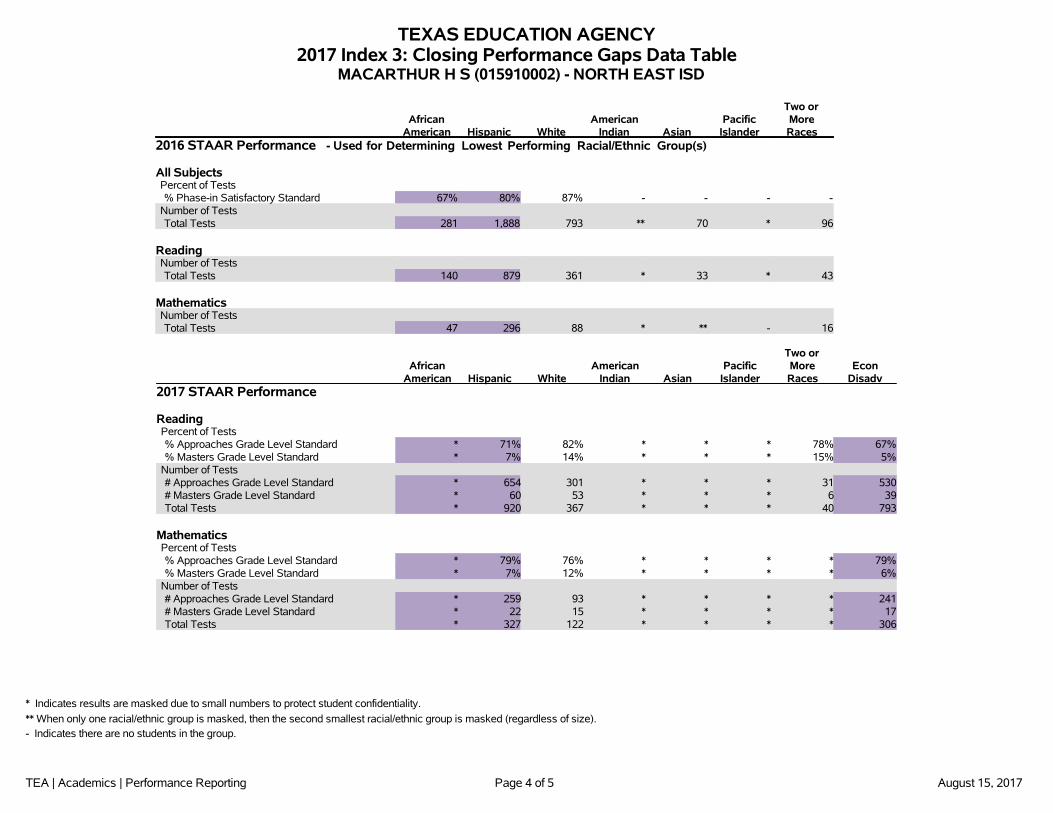
TEXAS EDUCATION AGENCY2017 Index 3: Closing Performance Gaps Data Table
MACARTHUR H S (015910002) - NORTH EAST ISD
AfricanAmerican Hispanic White
AmericanIndian Asian
PacificIslander
Two orMoreRaces
2016 STAAR Performance - Used for Determining Lowest Performing Racial/Ethnic Group(s)
All SubjectsPercent of Tests% Phase-in Satisfactory Standard 67% 80% 87% - - - -
Number of TestsTotal Tests 281 1,888 793 ** 70 * 96
ReadingNumber of TestsTotal Tests 140 879 361 * 33 * 43
MathematicsNumber of TestsTotal Tests 47 296 88 * ** - 16
AfricanAmerican Hispanic White
AmericanIndian Asian
PacificIslander
Two orMoreRaces
EconDisadv
2017 STAAR Performance
ReadingPercent of Tests% Approaches Grade Level Standard * 71% 82% * * * 78% 67%% Masters Grade Level Standard * 7% 14% * * * 15% 5%
Number of Tests# Approaches Grade Level Standard * 654 301 * * * 31 530# Masters Grade Level Standard * 60 53 * * * 6 39Total Tests * 920 367 * * * 40 793
MathematicsPercent of Tests% Approaches Grade Level Standard * 79% 76% * * * * 79%% Masters Grade Level Standard * 7% 12% * * * * 6%
Number of Tests# Approaches Grade Level Standard * 259 93 * * * * 241# Masters Grade Level Standard * 22 15 * * * * 17Total Tests * 327 122 * * * * 306
TEA | Academics | Performance Reporting Page 5 of 5 August 15, 2017
- Indicates there are no students in the group.** When only one racial/ethnic group is masked, then the second smallest racial/ethnic group is masked (regardless of size).
* Indicates results are masked due to small numbers to protect student confidentiality.
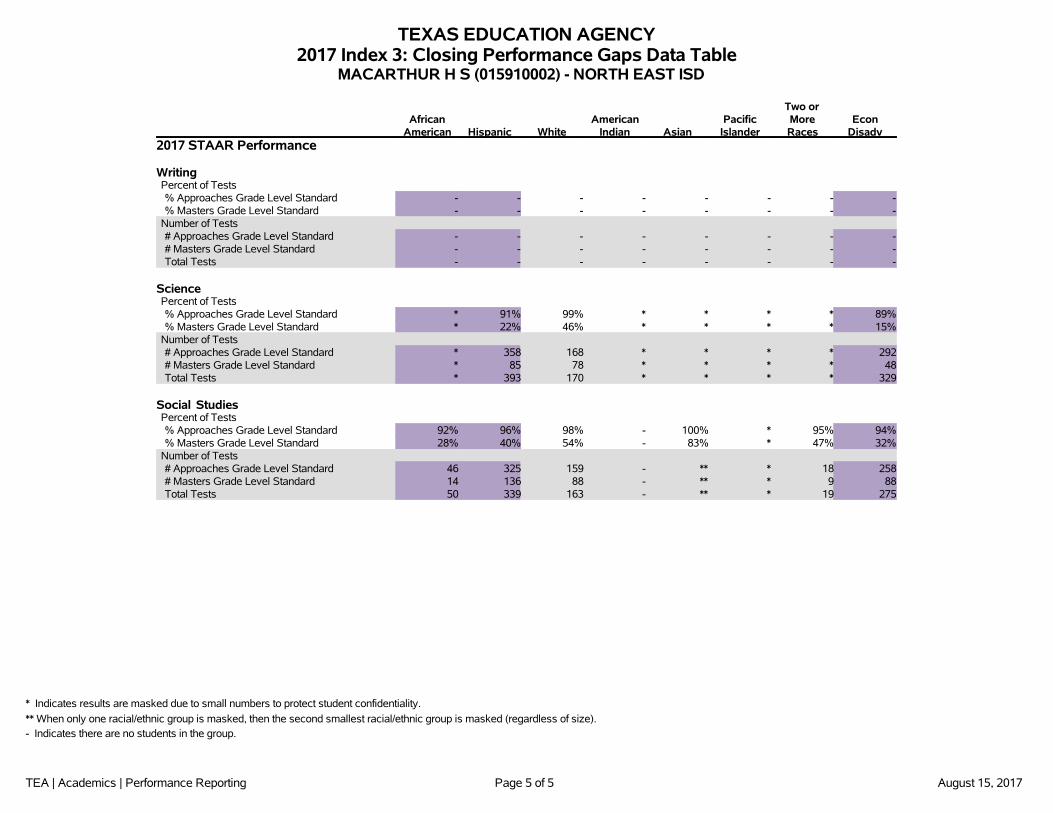
TEXAS EDUCATION AGENCY2017 Index 3: Closing Performance Gaps Data Table
MACARTHUR H S (015910002) - NORTH EAST ISD
AfricanAmerican Hispanic White
AmericanIndian Asian
PacificIslander
Two orMoreRaces
EconDisadv
2017 STAAR Performance
WritingPercent of Tests% Approaches Grade Level Standard - - - - - - - -% Masters Grade Level Standard - - - - - - - -
Number of Tests# Approaches Grade Level Standard - - - - - - - -# Masters Grade Level Standard - - - - - - - -Total Tests - - - - - - - -
SciencePercent of Tests% Approaches Grade Level Standard * 91% 99% * * * * 89%% Masters Grade Level Standard * 22% 46% * * * * 15%
Number of Tests# Approaches Grade Level Standard * 358 168 * * * * 292# Masters Grade Level Standard * 85 78 * * * * 48Total Tests * 393 170 * * * * 329
Social StudiesPercent of Tests% Approaches Grade Level Standard 92% 96% 98% - 100% * 95% 94%% Masters Grade Level Standard 28% 40% 54% - 83% * 47% 32%
Number of Tests# Approaches Grade Level Standard 46 325 159 - ** * 18 258# Masters Grade Level Standard 14 136 88 - ** * 9 88Total Tests 50 339 163 - ** * 19 275
TEA | Academics | Performance Reporting Page 1 of 3 August 15, 2017
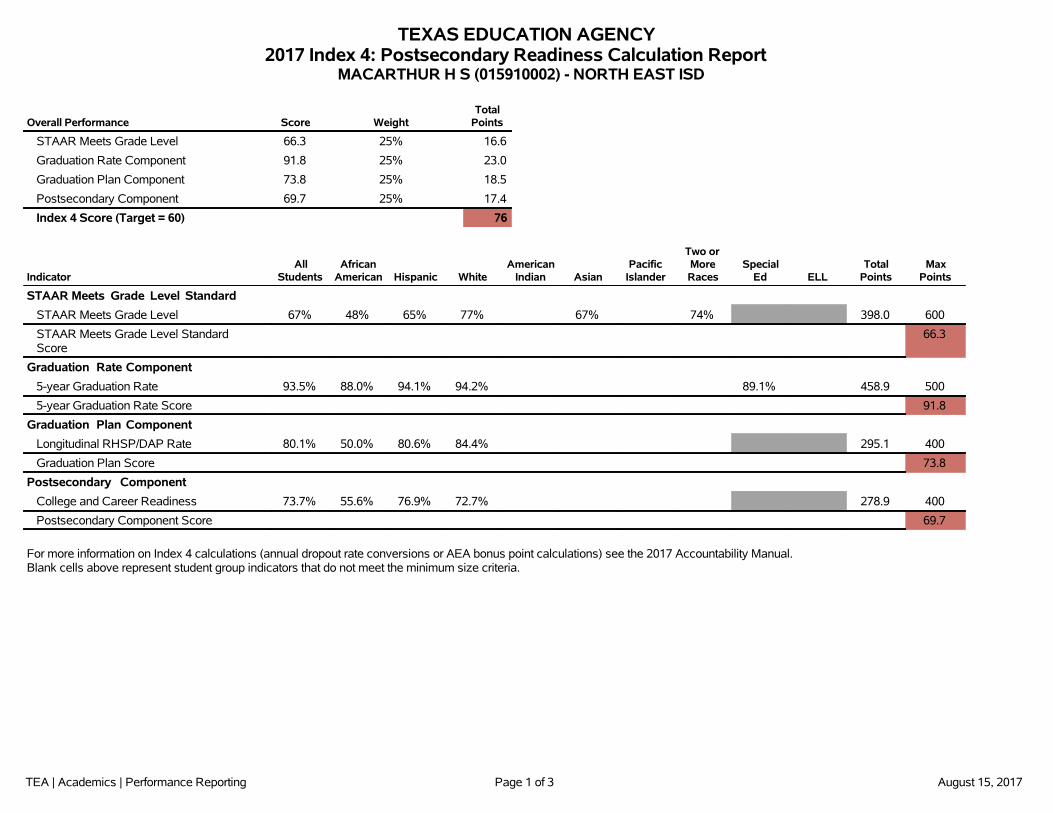
TEXAS EDUCATION AGENCY2017 Index 4: Postsecondary Readiness Calculation Report
MACARTHUR H S (015910002) - NORTH EAST ISD
Overall Performance Score WeightTotal
Points
STAAR Meets Grade Level 66.3 25% 16.6
Graduation Rate Component 91.8 25% 23.0
Graduation Plan Component 73.8 25% 18.5
Postsecondary Component 69.7 25% 17.4
Index 4 Score (Target = 60) 76
IndicatorAll
StudentsAfrican
American Hispanic WhiteAmerican
Indian AsianPacific
Islander
Two orMoreRaces
SpecialEd ELL
TotalPoints
MaxPoints
STAAR Meets Grade Level Standard
STAAR Meets Grade Level 67% 48% 65% 77% 67% 74% 398.0 600
STAAR Meets Grade Level StandardScore
66.3
Graduation Rate Component
5-year Graduation Rate 93.5% 88.0% 94.1% 94.2% 89.1% 458.9 500
5-year Graduation Rate Score 91.8
Graduation Plan Component
Longitudinal RHSP/DAP Rate 80.1% 50.0% 80.6% 84.4% 295.1 400
Graduation Plan Score 73.8
Postsecondary Component
College and Career Readiness 73.7% 55.6% 76.9% 72.7% 278.9 400
Postsecondary Component Score 69.7
For more information on Index 4 calculations (annual dropout rate conversions or AEA bonus point calculations) see the 2017 Accountability Manual.Blank cells above represent student group indicators that do not meet the minimum size criteria.
TEA | Academics | Performance Reporting Page 2 of 3 August 15, 2017
n/a Indicates the student group is not applicable to Index 4.- Indicates there are no students in the group.** When only one ethnic/race group is masked, then the second smallest ethnic/race group is masked (regardless of size).
* Indicates results are masked due to small numbers to protect student confidentiality.
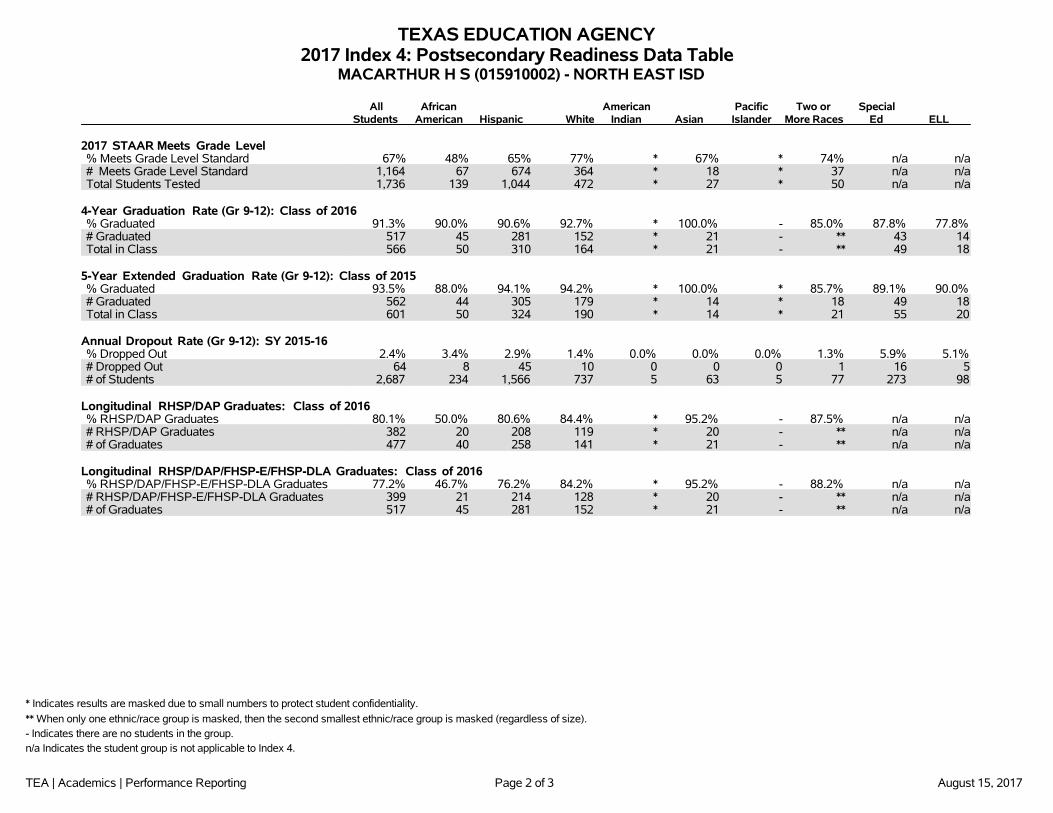
TEXAS EDUCATION AGENCY2017 Index 4: Postsecondary Readiness Data Table
MACARTHUR H S (015910002) - NORTH EAST ISD
AllStudents
AfricanAmerican Hispanic White
AmericanIndian Asian
PacificIslander
Two orMore Races
SpecialEd ELL
2017 STAAR Meets Grade Level% Meets Grade Level Standard 67% 48% 65% 77% * 67% * 74% n/a n/a# Meets Grade Level Standard 1,164 67 674 364 * 18 * 37 n/a n/aTotal Students Tested 1,736 139 1,044 472 * 27 * 50 n/a n/a
4-Year Graduation Rate (Gr 9-12): Class of 2016% Graduated 91.3% 90.0% 90.6% 92.7% * 100.0% - 85.0% 87.8% 77.8%# Graduated 517 45 281 152 * 21 - ** 43 14Total in Class 566 50 310 164 * 21 - ** 49 18
5-Year Extended Graduation Rate (Gr 9-12): Class of 2015% Graduated 93.5% 88.0% 94.1% 94.2% * 100.0% * 85.7% 89.1% 90.0%# Graduated 562 44 305 179 * 14 * 18 49 18Total in Class 601 50 324 190 * 14 * 21 55 20
Annual Dropout Rate (Gr 9-12): SY 2015-16% Dropped Out 2.4% 3.4% 2.9% 1.4% 0.0% 0.0% 0.0% 1.3% 5.9% 5.1%# Dropped Out 64 8 45 10 0 0 0 1 16 5# of Students 2,687 234 1,566 737 5 63 5 77 273 98
Longitudinal RHSP/DAP Graduates: Class of 2016% RHSP/DAP Graduates 80.1% 50.0% 80.6% 84.4% * 95.2% - 87.5% n/a n/a# RHSP/DAP Graduates 382 20 208 119 * 20 - ** n/a n/a# of Graduates 477 40 258 141 * 21 - ** n/a n/a
Longitudinal RHSP/DAP/FHSP-E/FHSP-DLA Graduates: Class of 2016% RHSP/DAP/FHSP-E/FHSP-DLA Graduates 77.2% 46.7% 76.2% 84.2% * 95.2% - 88.2% n/a n/a# RHSP/DAP/FHSP-E/FHSP-DLA Graduates 399 21 214 128 * 20 - ** n/a n/a# of Graduates 517 45 281 152 * 21 - ** n/a n/a
TEA | Academics | Performance Reporting Page 3 of 3 August 15, 2017
n/a Indicates the student group is not applicable to Index 4.- Indicates there are no students in the group.** When only one ethnic/race group is masked, then the second smallest ethnic/race group is masked (regardless of size).
* Indicates results are masked due to small numbers to protect student confidentiality.
TEXAS EDUCATION AGENCY2017 Index 4: Postsecondary Readiness Data Table
MACARTHUR H S (015910002) - NORTH EAST ISD
AllStudents
AfricanAmerican Hispanic White
AmericanIndian Asian
PacificIslander
Two orMore Races
SpecialEd ELL
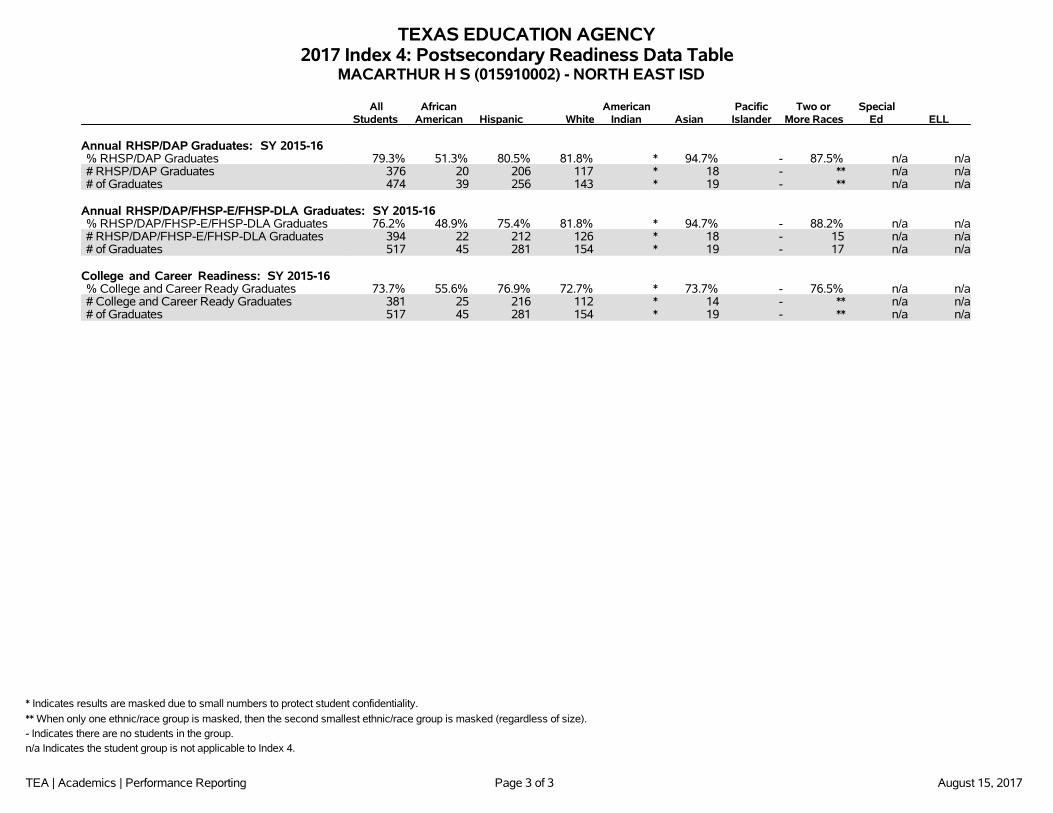
Annual RHSP/DAP Graduates: SY 2015-16% RHSP/DAP Graduates 79.3% 51.3% 80.5% 81.8% * 94.7% - 87.5% n/a n/a# RHSP/DAP Graduates 376 20 206 117 * 18 - ** n/a n/a# of Graduates 474 39 256 143 * 19 - ** n/a n/a
Annual RHSP/DAP/FHSP-E/FHSP-DLA Graduates: SY 2015-16% RHSP/DAP/FHSP-E/FHSP-DLA Graduates 76.2% 48.9% 75.4% 81.8% * 94.7% - 88.2% n/a n/a# RHSP/DAP/FHSP-E/FHSP-DLA Graduates 394 22 212 126 * 18 - 15 n/a n/a# of Graduates 517 45 281 154 * 19 - 17 n/a n/a
College and Career Readiness: SY 2015-16% College and Career Ready Graduates 73.7% 55.6% 76.9% 72.7% * 73.7% - 76.5% n/a n/a# College and Career Ready Graduates 381 25 216 112 * 14 - ** n/a n/a# of Graduates 517 45 281 154 * 19 - ** n/a n/a
TEA | Academics | Performance Reporting Page 1 of 3 August 15, 2017
TEXAS EDUCATION AGENCY2017 System Safeguards - Status Report
MACARTHUR H S (015910002) - NORTH EAST ISD
AllStudents
AfricanAmerican Hispanic White
AmericanIndian Asian
PacificIslander
Two orMore
RacesEcon
DisadvSpecial
Ed
ELL(Current &Monitored) ELL +
TotalMet
TotalEligible
Percent ofEligible
Measures Met
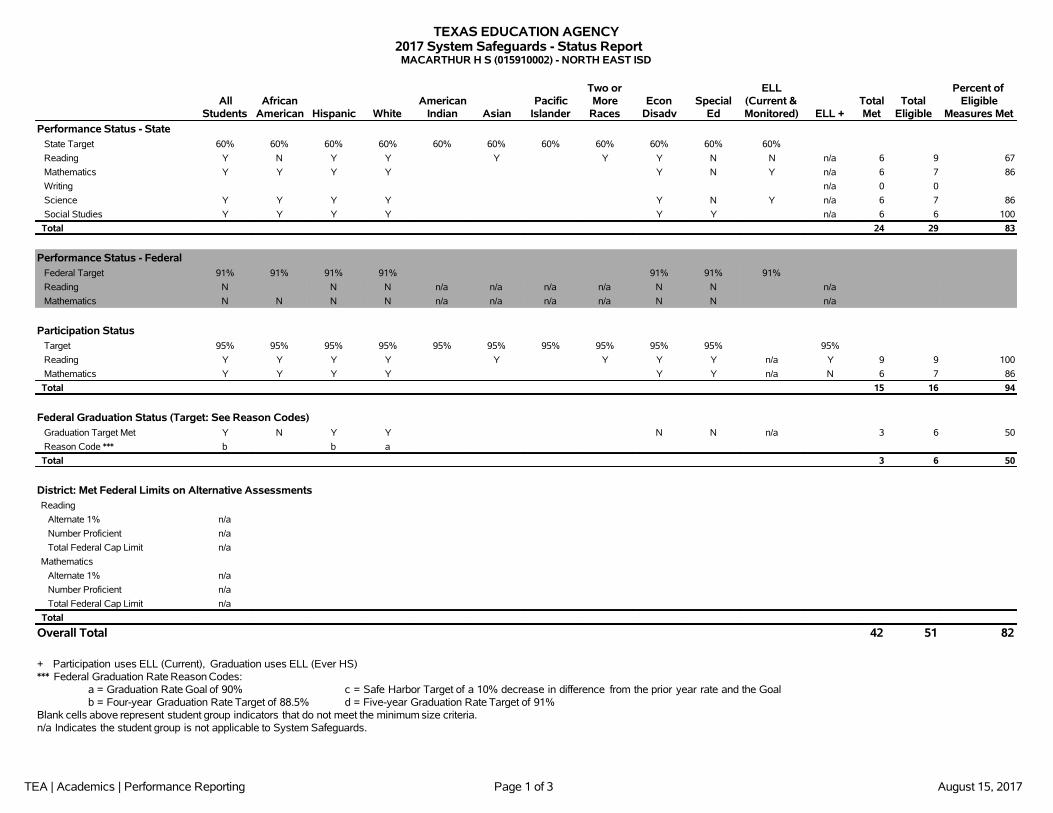
Performance Status - StateState Target 60% 60% 60% 60% 60% 60% 60% 60% 60% 60% 60%
Reading Y N Y Y Y Y Y N N n/a 6 9 67
Mathematics Y Y Y Y Y N Y n/a 6 7 86
Writing n/a 0 0
Science Y Y Y Y Y N Y n/a 6 7 86
Social Studies Y Y Y Y Y Y n/a 6 6 100
Total 24 29 83
Performance Status - FederalFederal Target 91% 91% 91% 91% 91% 91% 91%
Reading N N N n/a n/a n/a n/a N N n/a
Mathematics N N N N n/a n/a n/a n/a N N n/a
Participation StatusTarget 95% 95% 95% 95% 95% 95% 95% 95% 95% 95% 95%
Reading Y Y Y Y Y Y Y Y n/a Y 9 9 100
Mathematics Y Y Y Y Y Y n/a N 6 7 86
Total 15 16 94
Federal Graduation Status (Target: See Reason Codes)Graduation Target Met Y N Y Y N N n/a 3 6 50
Reason Code *** b b a
Total 3 6 50
District: Met Federal Limits on Alternative AssessmentsReading
Alternate 1% n/a
Number Proficient n/a
Total Federal Cap Limit n/a
Mathematics
Alternate 1% n/a
Number Proficient n/a
Total Federal Cap Limit n/a
Total
Overall Total 42 51 82
+ Participation uses ELL (Current), Graduation uses ELL (Ever HS)*** Federal Graduation Rate Reason Codes:
a = Graduation Rate Goal of 90% c = Safe Harbor Target of a 10% decrease in difference from the prior year rate and the Goalb = Four-year Graduation Rate Target of 88.5% d = Five-year Graduation Rate Target of 91%
Blank cells above represent student group indicators that do not meet the minimum size criteria.n/a Indicates the student group is not applicable to System Safeguards.
TEA | Academics | Performance Reporting Page 2 of 3 August 15, 2017
TEXAS EDUCATION AGENCY2017 System Safeguards - Performance and Participation Data Table
MACARTHUR H S (015910002) - NORTH EAST ISD
AllStudents
AfricanAmerican Hispanic White
AmericanIndian Asian
PacificIslander
Two orMore
RacesEcon
DisadvSpecial
Ed
ELL(Current &Monitored)
ELL(Current)
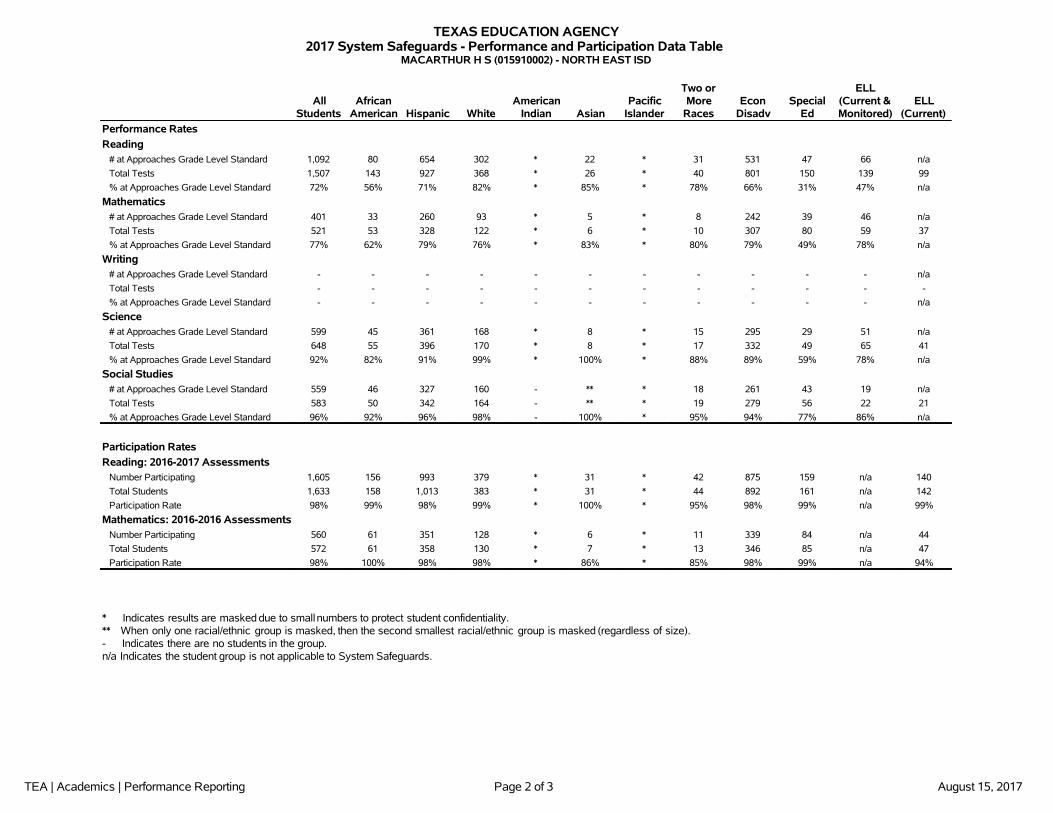
Performance Rates
Reading# at Approaches Grade Level Standard 1,092 80 654 302 * 22 * 31 531 47 66 n/a
Total Tests 1,507 143 927 368 * 26 * 40 801 150 139 99
% at Approaches Grade Level Standard 72% 56% 71% 82% * 85% * 78% 66% 31% 47% n/a
Mathematics# at Approaches Grade Level Standard 401 33 260 93 * 5 * 8 242 39 46 n/a
Total Tests 521 53 328 122 * 6 * 10 307 80 59 37
% at Approaches Grade Level Standard 77% 62% 79% 76% * 83% * 80% 79% 49% 78% n/a
Writing# at Approaches Grade Level Standard - - - - - - - - - - - n/a
Total Tests - - - - - - - - - - - -
% at Approaches Grade Level Standard - - - - - - - - - - - n/a
Science# at Approaches Grade Level Standard 599 45 361 168 * 8 * 15 295 29 51 n/a
Total Tests 648 55 396 170 * 8 * 17 332 49 65 41
% at Approaches Grade Level Standard 92% 82% 91% 99% * 100% * 88% 89% 59% 78% n/a
Social Studies# at Approaches Grade Level Standard 559 46 327 160 - ** * 18 261 43 19 n/a
Total Tests 583 50 342 164 - ** * 19 279 56 22 21
% at Approaches Grade Level Standard 96% 92% 96% 98% - 100% * 95% 94% 77% 86% n/a
Participation Rates
Reading: 2016-2017 AssessmentsNumber Participating 1,605 156 993 379 * 31 * 42 875 159 n/a 140
Total Students 1,633 158 1,013 383 * 31 * 44 892 161 n/a 142
Participation Rate 98% 99% 98% 99% * 100% * 95% 98% 99% n/a 99%
Mathematics: 2016-2016 AssessmentsNumber Participating 560 61 351 128 * 6 * 11 339 84 n/a 44
Total Students 572 61 358 130 * 7 * 13 346 85 n/a 47
Participation Rate 98% 100% 98% 98% * 86% * 85% 98% 99% n/a 94%
* Indicates results are masked due to small numbers to protect student confidentiality.** When only one racial/ethnic group is masked, then the second smallest racial/ethnic group is masked (regardless of size).- Indicates there are no students in the group.n/a Indicates the student group is not applicable to System Safeguards.
TEA | Academics | Performance Reporting Page 3 of 3 August 15, 2017
TEXAS EDUCATION AGENCY2017 System Safeguards - Graduation and Federal Limits Data Table
MACARTHUR H S (015910002) - NORTH EAST ISD
AllStudents
AfricanAmerican Hispanic White
AmericanIndian Asian
PacificIslander
Two orMore
RacesEcon
DisadvSpecial
EdELL
(Ever HS)ELL
(Current)
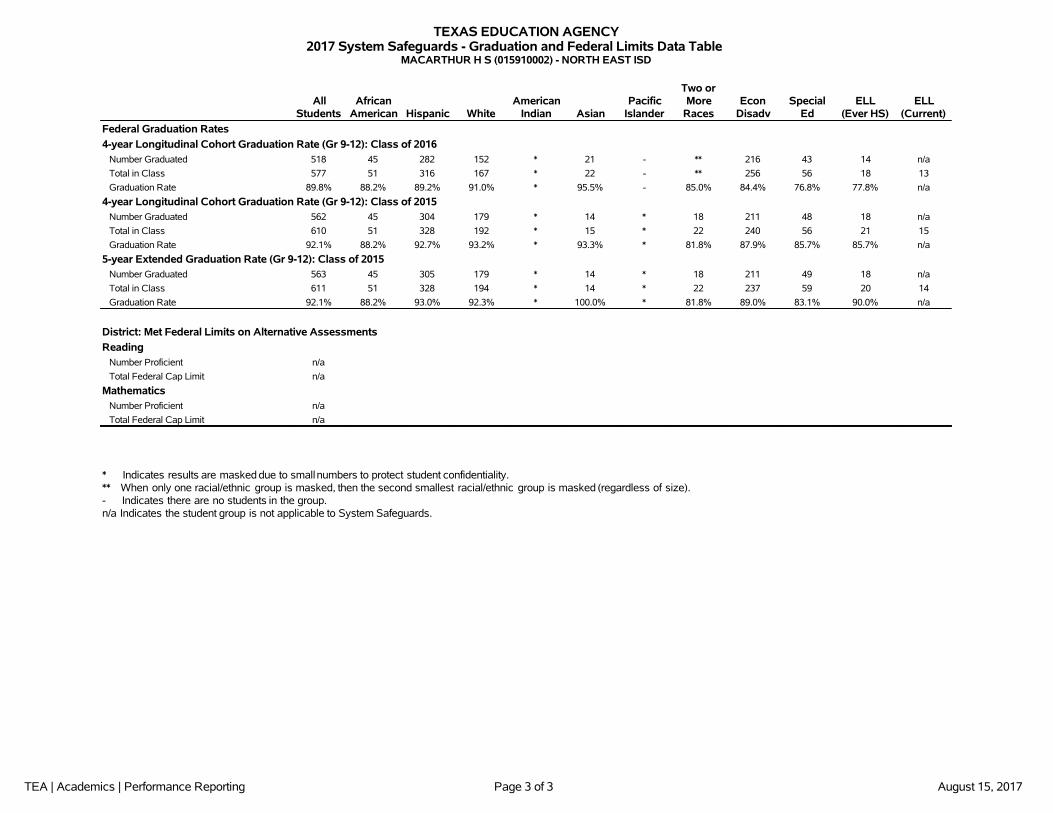
Federal Graduation Rates
4-year Longitudinal Cohort Graduation Rate (Gr 9-12): Class of 2016Number Graduated 518 45 282 152 * 21 - ** 216 43 14 n/a
Total in Class 577 51 316 167 * 22 - ** 256 56 18 13
Graduation Rate 89.8% 88.2% 89.2% 91.0% * 95.5% - 85.0% 84.4% 76.8% 77.8% n/a
4-year Longitudinal Cohort Graduation Rate (Gr 9-12): Class of 2015Number Graduated 562 45 304 179 * 14 * 18 211 48 18 n/a
Total in Class 610 51 328 192 * 15 * 22 240 56 21 15
Graduation Rate 92.1% 88.2% 92.7% 93.2% * 93.3% * 81.8% 87.9% 85.7% 85.7% n/a
5-year Extended Graduation Rate (Gr 9-12): Class of 2015Number Graduated 563 45 305 179 * 14 * 18 211 49 18 n/a
Total in Class 611 51 328 194 * 14 * 22 237 59 20 14
Graduation Rate 92.1% 88.2% 93.0% 92.3% * 100.0% * 81.8% 89.0% 83.1% 90.0% n/a
District: Met Federal Limits on Alternative Assessments
ReadingNumber Proficient n/a
Total Federal Cap Limit n/a
MathematicsNumber Proficient n/a
Total Federal Cap Limit n/a
* Indicates results are masked due to small numbers to protect student confidentiality.** When only one racial/ethnic group is masked, then the second smallest racial/ethnic group is masked (regardless of size).- Indicates there are no students in the group.n/a Indicates the student group is not applicable to System Safeguards.
TEA | Academics | Performance Reporting Page 1 of 8 August 15, 2017
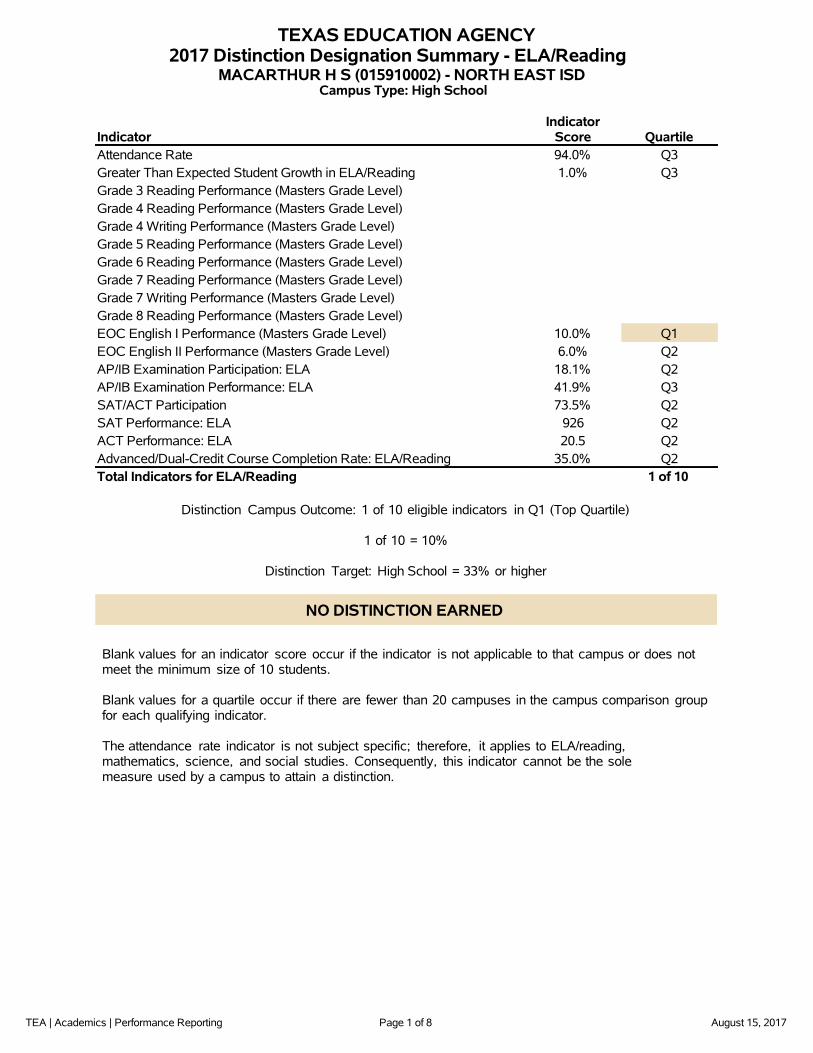
TEXAS EDUCATION AGENCY2017 Distinction Designation Summary - ELA/Reading
MACARTHUR H S (015910002) - NORTH EAST ISDCampus Type: High School
IndicatorIndicator
Score QuartileAttendance Rate 94.0% Q3Greater Than Expected Student Growth in ELA/Reading 1.0% Q3Grade 3 Reading Performance (Masters Grade Level)Grade 4 Reading Performance (Masters Grade Level)Grade 4 Writing Performance (Masters Grade Level)Grade 5 Reading Performance (Masters Grade Level)Grade 6 Reading Performance (Masters Grade Level)Grade 7 Reading Performance (Masters Grade Level)Grade 7 Writing Performance (Masters Grade Level)Grade 8 Reading Performance (Masters Grade Level)EOC English I Performance (Masters Grade Level) 10.0% Q1EOC English II Performance (Masters Grade Level) 6.0% Q2AP/IB Examination Participation: ELA 18.1% Q2AP/IB Examination Performance: ELA 41.9% Q3SAT/ACT Participation 73.5% Q2SAT Performance: ELA 926 Q2ACT Performance: ELA 20.5 Q2Advanced/Dual-Credit Course Completion Rate: ELA/Reading 35.0% Q2Total Indicators for ELA/Reading 1 of 10
Distinction Campus Outcome: 1 of 10 eligible indicators in Q1 (Top Quartile)
1 of 10 = 10%
Distinction Target: High School = 33% or higher
NO DISTINCTION EARNED
Blank values for an indicator score occur if the indicator is not applicable to that campus or does notmeet the minimum size of 10 students.
Blank values for a quartile occur if there are fewer than 20 campuses in the campus comparison groupfor each qualifying indicator.
The attendance rate indicator is not subject specific; therefore, it applies to ELA/reading,mathematics, science, and social studies. Consequently, this indicator cannot be the solemeasure used by a campus to attain a distinction.
TEA | Academics | Performance Reporting Page 2 of 8 August 15, 2017
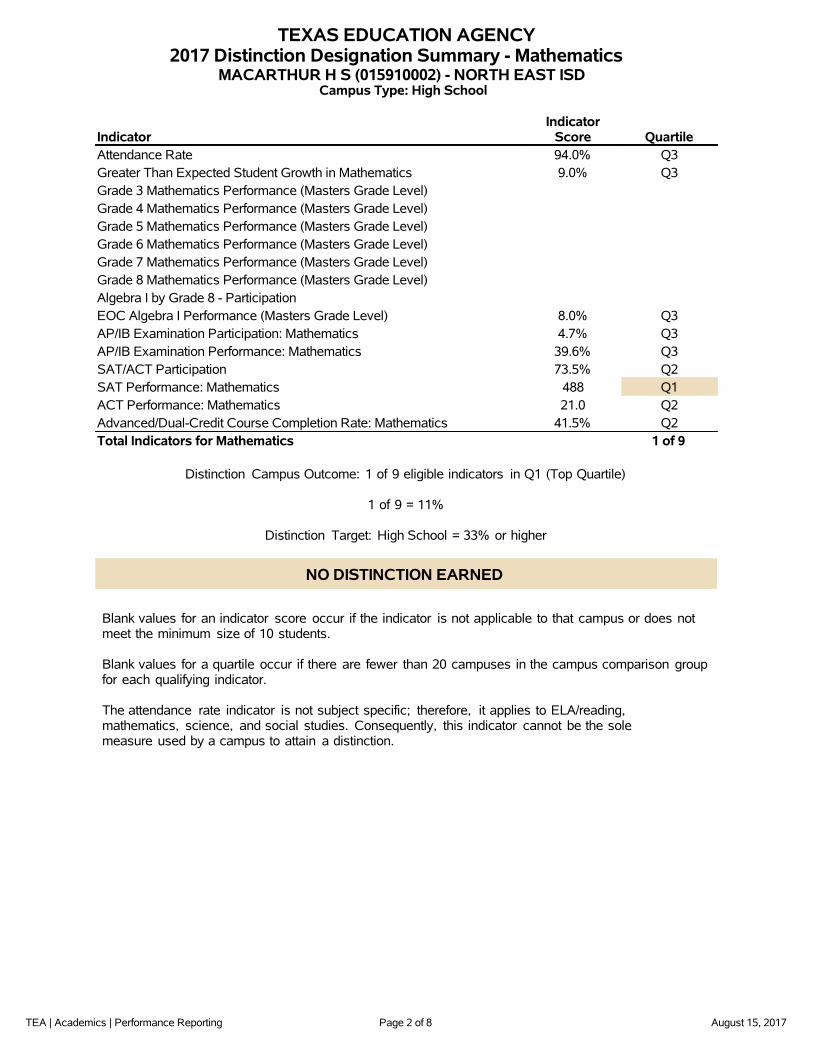
TEXAS EDUCATION AGENCY2017 Distinction Designation Summary - Mathematics
MACARTHUR H S (015910002) - NORTH EAST ISDCampus Type: High School
IndicatorIndicator
Score QuartileAttendance Rate 94.0% Q3Greater Than Expected Student Growth in Mathematics 9.0% Q3Grade 3 Mathematics Performance (Masters Grade Level)Grade 4 Mathematics Performance (Masters Grade Level)Grade 5 Mathematics Performance (Masters Grade Level)Grade 6 Mathematics Performance (Masters Grade Level)Grade 7 Mathematics Performance (Masters Grade Level)Grade 8 Mathematics Performance (Masters Grade Level)Algebra I by Grade 8 - ParticipationEOC Algebra I Performance (Masters Grade Level) 8.0% Q3AP/IB Examination Participation: Mathematics 4.7% Q3AP/IB Examination Performance: Mathematics 39.6% Q3SAT/ACT Participation 73.5% Q2SAT Performance: Mathematics 488 Q1ACT Performance: Mathematics 21.0 Q2Advanced/Dual-Credit Course Completion Rate: Mathematics 41.5% Q2Total Indicators for Mathematics 1 of 9
Distinction Campus Outcome: 1 of 9 eligible indicators in Q1 (Top Quartile)
1 of 9 = 11%
Distinction Target: High School = 33% or higher
NO DISTINCTION EARNED
Blank values for an indicator score occur if the indicator is not applicable to that campus or does notmeet the minimum size of 10 students.
Blank values for a quartile occur if there are fewer than 20 campuses in the campus comparison groupfor each qualifying indicator.
The attendance rate indicator is not subject specific; therefore, it applies to ELA/reading,mathematics, science, and social studies. Consequently, this indicator cannot be the solemeasure used by a campus to attain a distinction.
TEA | Academics | Performance Reporting Page 3 of 8 August 15, 2017
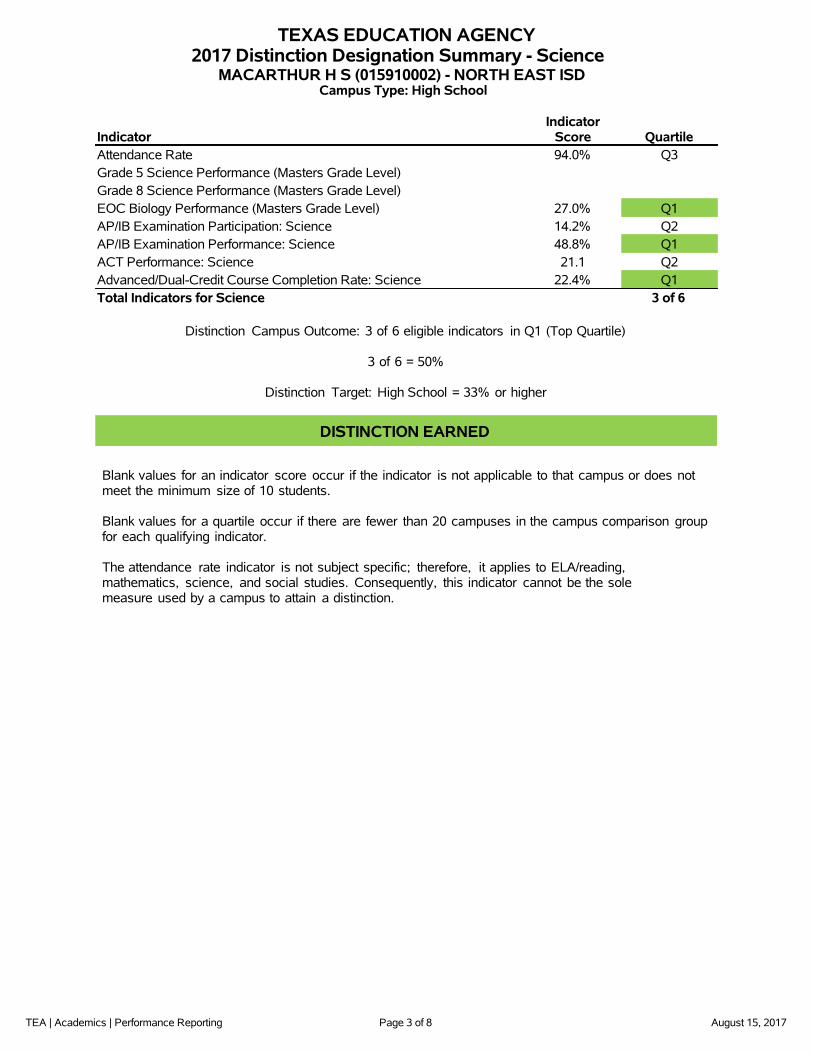
TEXAS EDUCATION AGENCY2017 Distinction Designation Summary - Science
MACARTHUR H S (015910002) - NORTH EAST ISDCampus Type: High School
IndicatorIndicator
Score QuartileAttendance Rate 94.0% Q3Grade 5 Science Performance (Masters Grade Level)Grade 8 Science Performance (Masters Grade Level)EOC Biology Performance (Masters Grade Level) 27.0% Q1AP/IB Examination Participation: Science 14.2% Q2AP/IB Examination Performance: Science 48.8% Q1ACT Performance: Science 21.1 Q2Advanced/Dual-Credit Course Completion Rate: Science 22.4% Q1Total Indicators for Science 3 of 6
Distinction Campus Outcome: 3 of 6 eligible indicators in Q1 (Top Quartile)
3 of 6 = 50%
Distinction Target: High School = 33% or higher
DISTINCTION EARNED
Blank values for an indicator score occur if the indicator is not applicable to that campus or does notmeet the minimum size of 10 students.
Blank values for a quartile occur if there are fewer than 20 campuses in the campus comparison groupfor each qualifying indicator.
The attendance rate indicator is not subject specific; therefore, it applies to ELA/reading,mathematics, science, and social studies. Consequently, this indicator cannot be the solemeasure used by a campus to attain a distinction.
TEA | Academics | Performance Reporting Page 4 of 8 August 15, 2017
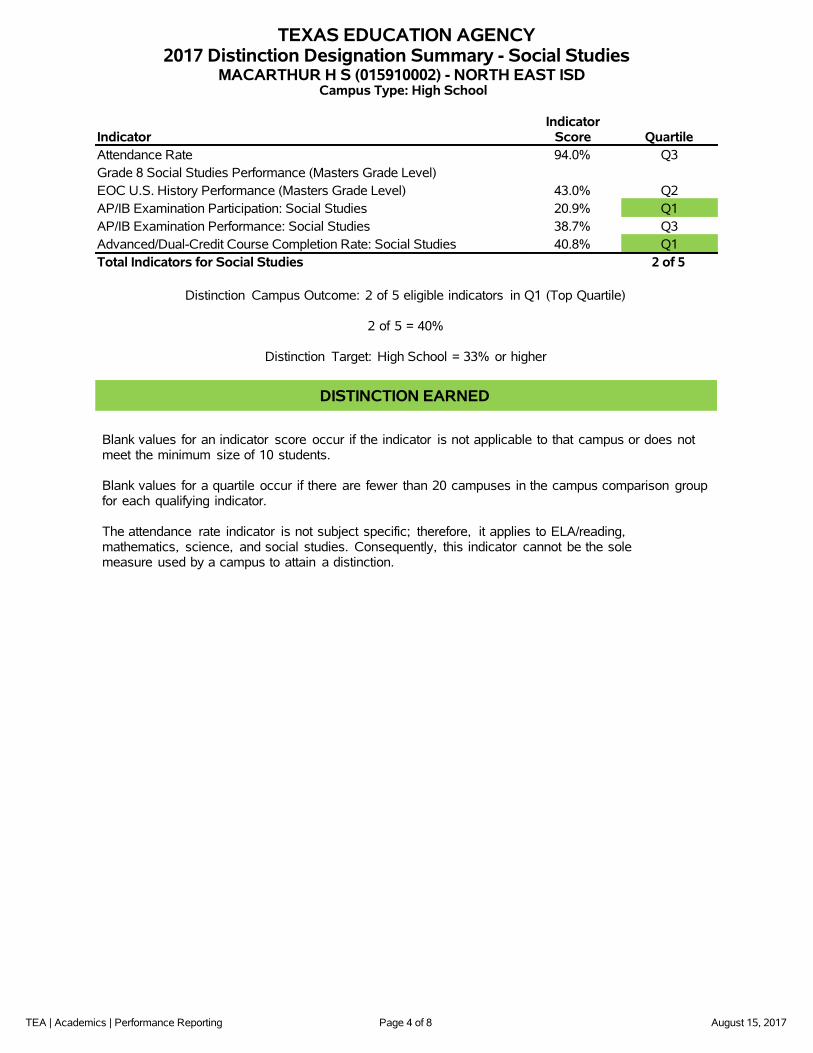
TEXAS EDUCATION AGENCY2017 Distinction Designation Summary - Social Studies
MACARTHUR H S (015910002) - NORTH EAST ISDCampus Type: High School
IndicatorIndicator
Score QuartileAttendance Rate 94.0% Q3Grade 8 Social Studies Performance (Masters Grade Level)EOC U.S. History Performance (Masters Grade Level) 43.0% Q2AP/IB Examination Participation: Social Studies 20.9% Q1AP/IB Examination Performance: Social Studies 38.7% Q3Advanced/Dual-Credit Course Completion Rate: Social Studies 40.8% Q1Total Indicators for Social Studies 2 of 5
Distinction Campus Outcome: 2 of 5 eligible indicators in Q1 (Top Quartile)
2 of 5 = 40%
Distinction Target: High School = 33% or higher
DISTINCTION EARNED
Blank values for an indicator score occur if the indicator is not applicable to that campus or does notmeet the minimum size of 10 students.
Blank values for a quartile occur if there are fewer than 20 campuses in the campus comparison groupfor each qualifying indicator.
The attendance rate indicator is not subject specific; therefore, it applies to ELA/reading,mathematics, science, and social studies. Consequently, this indicator cannot be the solemeasure used by a campus to attain a distinction.
TEA | Academics | Performance Reporting Page 5 of 8 August 15, 2017
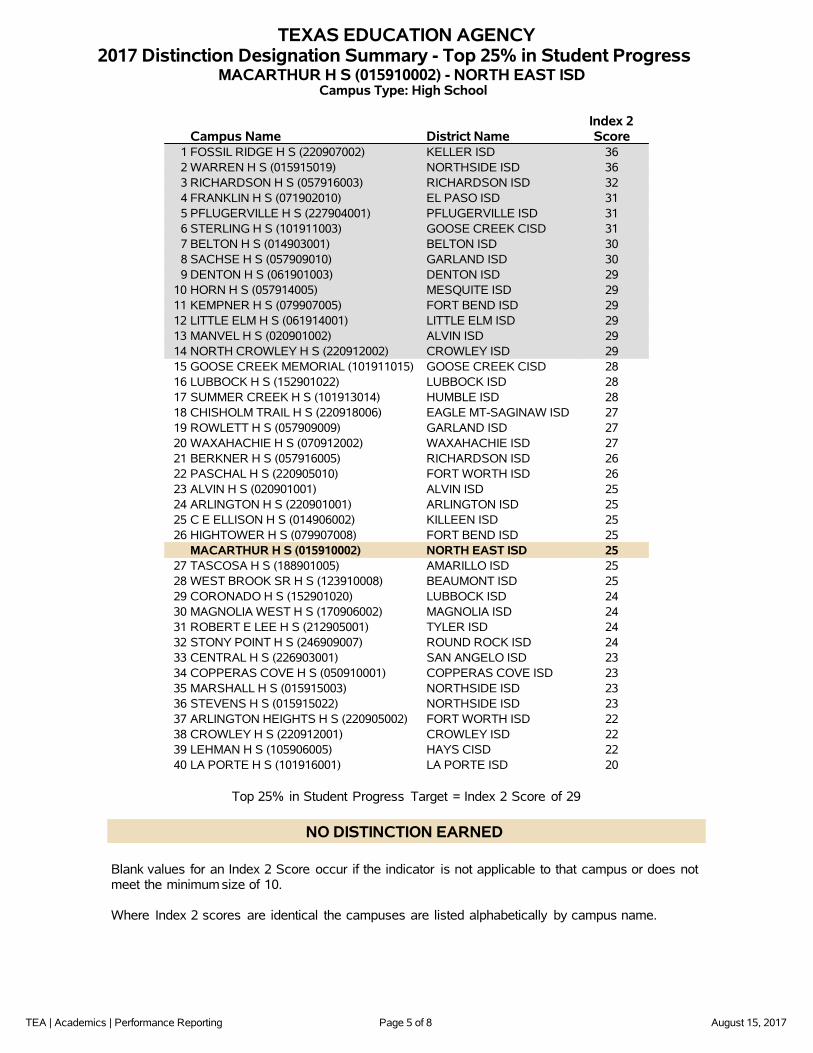
TEXAS EDUCATION AGENCY2017 Distinction Designation Summary - Top 25% in Student Progress
MACARTHUR H S (015910002) - NORTH EAST ISDCampus Type: High School
Campus Name District NameIndex 2Score
1 FOSSIL RIDGE H S (220907002) KELLER ISD 362 WARREN H S (015915019) NORTHSIDE ISD 363 RICHARDSON H S (057916003) RICHARDSON ISD 324 FRANKLIN H S (071902010) EL PASO ISD 315 PFLUGERVILLE H S (227904001) PFLUGERVILLE ISD 316 STERLING H S (101911003) GOOSE CREEK CISD 317 BELTON H S (014903001) BELTON ISD 308 SACHSE H S (057909010) GARLAND ISD 309 DENTON H S (061901003) DENTON ISD 29
10 HORN H S (057914005) MESQUITE ISD 2911 KEMPNER H S (079907005) FORT BEND ISD 2912 LITTLE ELM H S (061914001) LITTLE ELM ISD 2913 MANVEL H S (020901002) ALVIN ISD 2914 NORTH CROWLEY H S (220912002) CROWLEY ISD 2915 GOOSE CREEK MEMORIAL (101911015) GOOSE CREEK CISD 2816 LUBBOCK H S (152901022) LUBBOCK ISD 2817 SUMMER CREEK H S (101913014) HUMBLE ISD 2818 CHISHOLM TRAIL H S (220918006) EAGLE MT-SAGINAW ISD 2719 ROWLETT H S (057909009) GARLAND ISD 2720 WAXAHACHIE H S (070912002) WAXAHACHIE ISD 2721 BERKNER H S (057916005) RICHARDSON ISD 2622 PASCHAL H S (220905010) FORT WORTH ISD 2623 ALVIN H S (020901001) ALVIN ISD 2524 ARLINGTON H S (220901001) ARLINGTON ISD 2525 C E ELLISON H S (014906002) KILLEEN ISD 2526 HIGHTOWER H S (079907008) FORT BEND ISD 25
MACARTHUR H S (015910002) NORTH EAST ISD 2527 TASCOSA H S (188901005) AMARILLO ISD 2528 WEST BROOK SR H S (123910008) BEAUMONT ISD 2529 CORONADO H S (152901020) LUBBOCK ISD 2430 MAGNOLIA WEST H S (170906002) MAGNOLIA ISD 2431 ROBERT E LEE H S (212905001) TYLER ISD 2432 STONY POINT H S (246909007) ROUND ROCK ISD 2433 CENTRAL H S (226903001) SAN ANGELO ISD 2334 COPPERAS COVE H S (050910001) COPPERAS COVE ISD 2335 MARSHALL H S (015915003) NORTHSIDE ISD 2336 STEVENS H S (015915022) NORTHSIDE ISD 2337 ARLINGTON HEIGHTS H S (220905002) FORT WORTH ISD 2238 CROWLEY H S (220912001) CROWLEY ISD 2239 LEHMAN H S (105906005) HAYS CISD 2240 LA PORTE H S (101916001) LA PORTE ISD 20
Top 25% in Student Progress Target = Index 2 Score of 29
NO DISTINCTION EARNED
Blank values for an Index 2 Score occur if the indicator is not applicable to that campus or does notmeet the minimum size of 10.
Where Index 2 scores are identical the campuses are listed alphabetically by campus name.
TEA | Academics | Performance Reporting Page 6 of 8 August 15, 2017
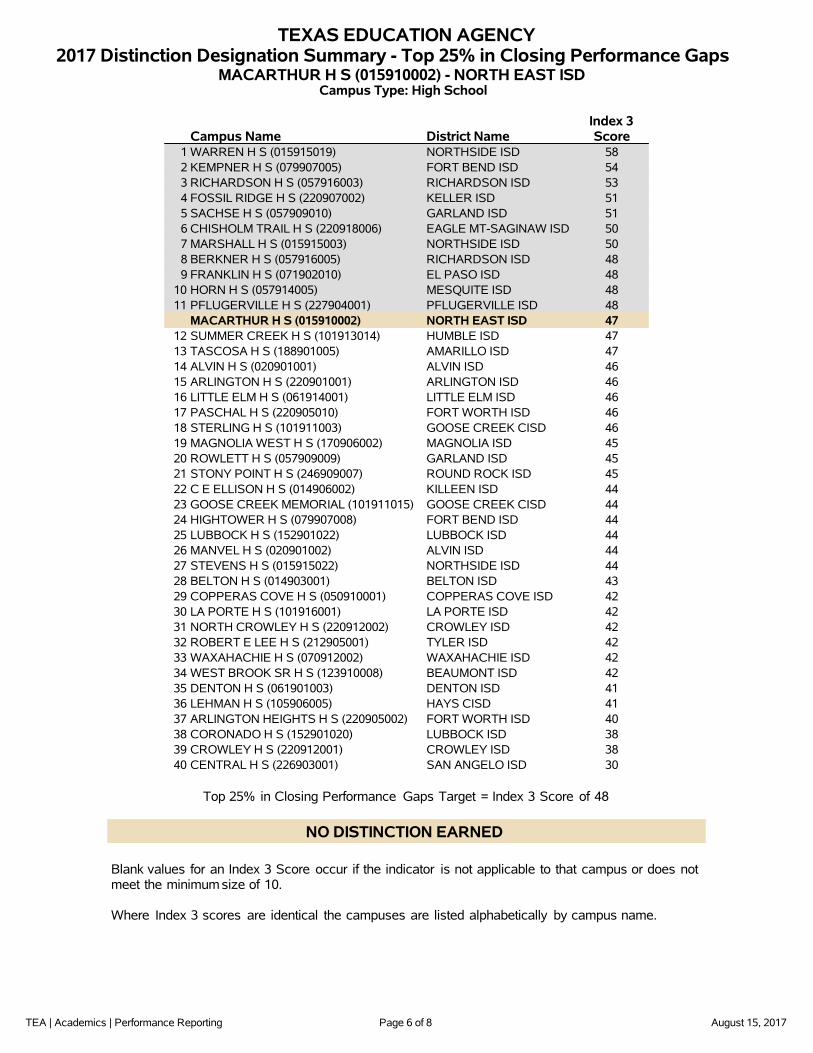
TEXAS EDUCATION AGENCY2017 Distinction Designation Summary - Top 25% in Closing Performance Gaps
MACARTHUR H S (015910002) - NORTH EAST ISDCampus Type: High School
Campus Name District NameIndex 3Score
1 WARREN H S (015915019) NORTHSIDE ISD 582 KEMPNER H S (079907005) FORT BEND ISD 543 RICHARDSON H S (057916003) RICHARDSON ISD 534 FOSSIL RIDGE H S (220907002) KELLER ISD 515 SACHSE H S (057909010) GARLAND ISD 516 CHISHOLM TRAIL H S (220918006) EAGLE MT-SAGINAW ISD 507 MARSHALL H S (015915003) NORTHSIDE ISD 508 BERKNER H S (057916005) RICHARDSON ISD 489 FRANKLIN H S (071902010) EL PASO ISD 48
10 HORN H S (057914005) MESQUITE ISD 4811 PFLUGERVILLE H S (227904001) PFLUGERVILLE ISD 48
MACARTHUR H S (015910002) NORTH EAST ISD 4712 SUMMER CREEK H S (101913014) HUMBLE ISD 4713 TASCOSA H S (188901005) AMARILLO ISD 4714 ALVIN H S (020901001) ALVIN ISD 4615 ARLINGTON H S (220901001) ARLINGTON ISD 4616 LITTLE ELM H S (061914001) LITTLE ELM ISD 4617 PASCHAL H S (220905010) FORT WORTH ISD 4618 STERLING H S (101911003) GOOSE CREEK CISD 4619 MAGNOLIA WEST H S (170906002) MAGNOLIA ISD 4520 ROWLETT H S (057909009) GARLAND ISD 4521 STONY POINT H S (246909007) ROUND ROCK ISD 4522 C E ELLISON H S (014906002) KILLEEN ISD 4423 GOOSE CREEK MEMORIAL (101911015) GOOSE CREEK CISD 4424 HIGHTOWER H S (079907008) FORT BEND ISD 4425 LUBBOCK H S (152901022) LUBBOCK ISD 4426 MANVEL H S (020901002) ALVIN ISD 4427 STEVENS H S (015915022) NORTHSIDE ISD 4428 BELTON H S (014903001) BELTON ISD 4329 COPPERAS COVE H S (050910001) COPPERAS COVE ISD 4230 LA PORTE H S (101916001) LA PORTE ISD 4231 NORTH CROWLEY H S (220912002) CROWLEY ISD 4232 ROBERT E LEE H S (212905001) TYLER ISD 4233 WAXAHACHIE H S (070912002) WAXAHACHIE ISD 4234 WEST BROOK SR H S (123910008) BEAUMONT ISD 4235 DENTON H S (061901003) DENTON ISD 4136 LEHMAN H S (105906005) HAYS CISD 4137 ARLINGTON HEIGHTS H S (220905002) FORT WORTH ISD 4038 CORONADO H S (152901020) LUBBOCK ISD 3839 CROWLEY H S (220912001) CROWLEY ISD 3840 CENTRAL H S (226903001) SAN ANGELO ISD 30
Top 25% in Closing Performance Gaps Target = Index 3 Score of 48
NO DISTINCTION EARNED
Blank values for an Index 3 Score occur if the indicator is not applicable to that campus or does notmeet the minimum size of 10.
Where Index 3 scores are identical the campuses are listed alphabetically by campus name.
TEA | Academics | Performance Reporting Page 7 of 8 August 15, 2017
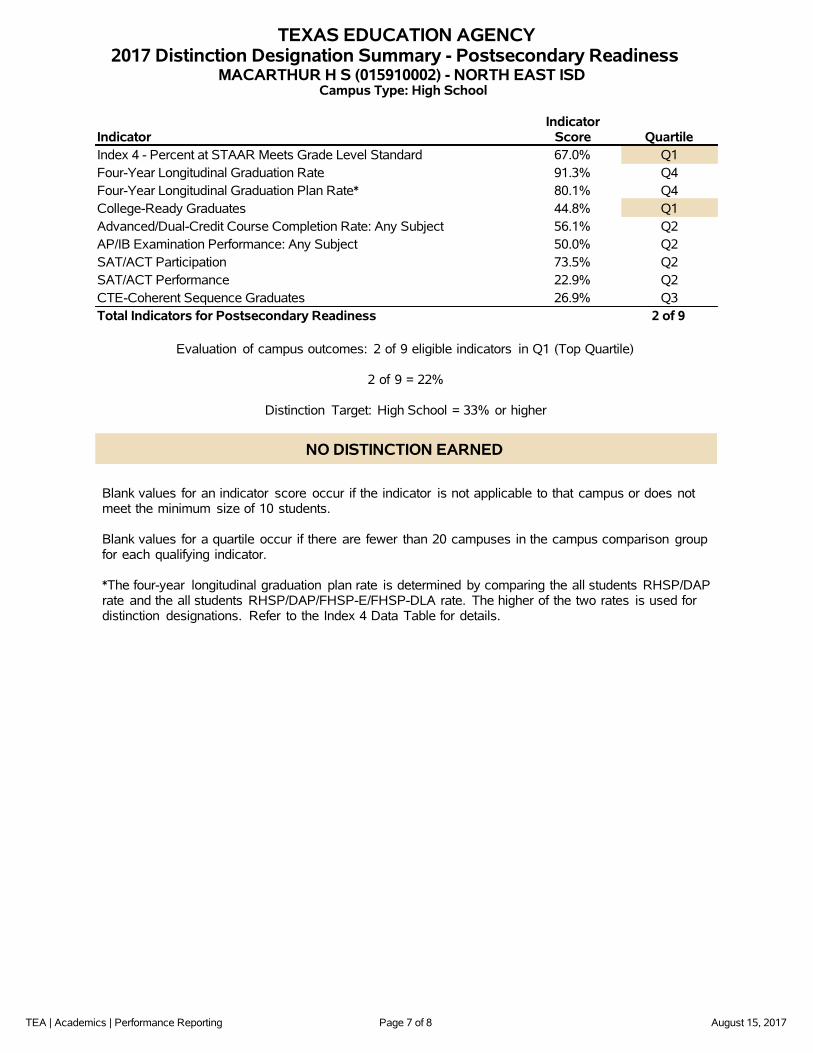
TEXAS EDUCATION AGENCY2017 Distinction Designation Summary - Postsecondary Readiness
MACARTHUR H S (015910002) - NORTH EAST ISDCampus Type: High School
IndicatorIndicator
Score QuartileIndex 4 - Percent at STAAR Meets Grade Level Standard 67.0% Q1Four-Year Longitudinal Graduation Rate 91.3% Q4Four-Year Longitudinal Graduation Plan Rate* 80.1% Q4College-Ready Graduates 44.8% Q1Advanced/Dual-Credit Course Completion Rate: Any Subject 56.1% Q2AP/IB Examination Performance: Any Subject 50.0% Q2SAT/ACT Participation 73.5% Q2SAT/ACT Performance 22.9% Q2CTE-Coherent Sequence Graduates 26.9% Q3Total Indicators for Postsecondary Readiness 2 of 9
Evaluation of campus outcomes: 2 of 9 eligible indicators in Q1 (Top Quartile)
2 of 9 = 22%
Distinction Target: High School = 33% or higher
NO DISTINCTION EARNED
Blank values for an indicator score occur if the indicator is not applicable to that campus or does notmeet the minimum size of 10 students.
Blank values for a quartile occur if there are fewer than 20 campuses in the campus comparison groupfor each qualifying indicator.
*The four-year longitudinal graduation plan rate is determined by comparing the all students RHSP/DAPrate and the all students RHSP/DAP/FHSP-E/FHSP-DLA rate. The higher of the two rates is used fordistinction designations. Refer to the Index 4 Data Table for details.
TEA | Academics | Performance Reporting Page 8 of 8 August 15, 2017
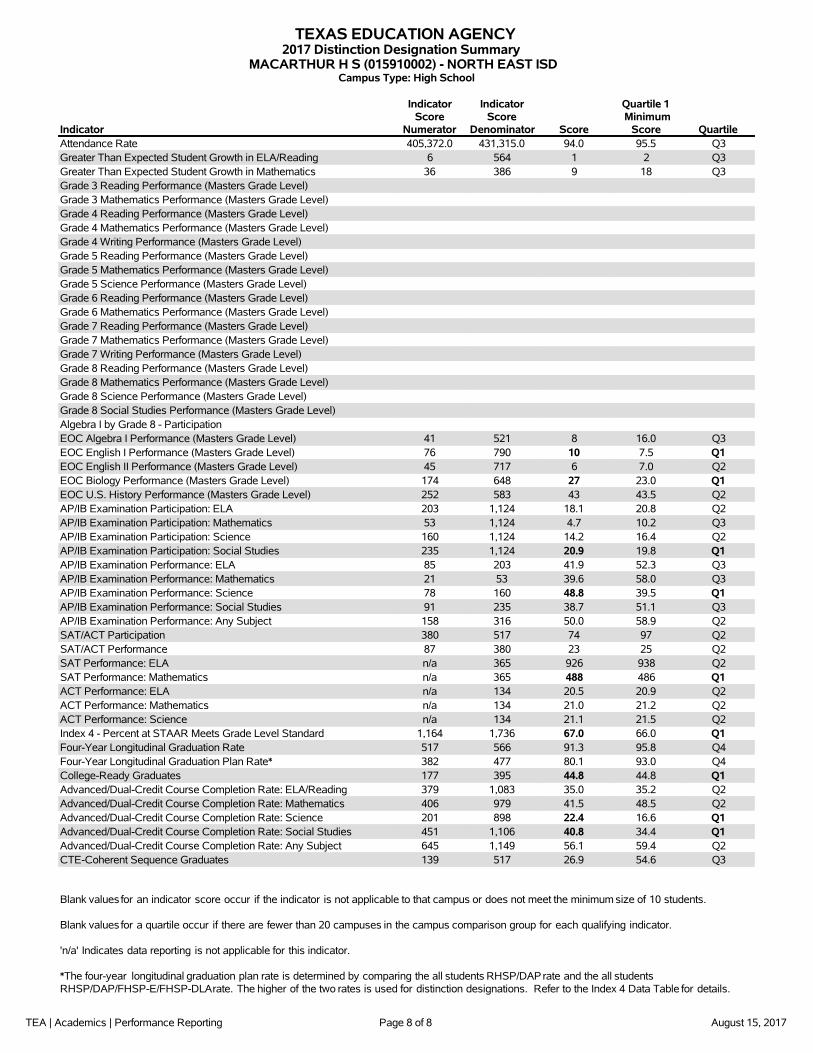
TEXAS EDUCATION AGENCY2017 Distinction Designation Summary
MACARTHUR H S (015910002) - NORTH EAST ISDCampus Type: High School
Indicator
IndicatorScore
Numerator
IndicatorScore
Denominator Score
Quartile 1Minimum
Score QuartileAttendance Rate 405,372.0 431,315.0 94.0 95.5 Q3Greater Than Expected Student Growth in ELA/Reading 6 564 1 2 Q3Greater Than Expected Student Growth in Mathematics 36 386 9 18 Q3Grade 3 Reading Performance (Masters Grade Level)Grade 3 Mathematics Performance (Masters Grade Level)Grade 4 Reading Performance (Masters Grade Level)Grade 4 Mathematics Performance (Masters Grade Level)Grade 4 Writing Performance (Masters Grade Level)Grade 5 Reading Performance (Masters Grade Level)Grade 5 Mathematics Performance (Masters Grade Level)Grade 5 Science Performance (Masters Grade Level)Grade 6 Reading Performance (Masters Grade Level)Grade 6 Mathematics Performance (Masters Grade Level)Grade 7 Reading Performance (Masters Grade Level)Grade 7 Mathematics Performance (Masters Grade Level)Grade 7 Writing Performance (Masters Grade Level)Grade 8 Reading Performance (Masters Grade Level)Grade 8 Mathematics Performance (Masters Grade Level)Grade 8 Science Performance (Masters Grade Level)Grade 8 Social Studies Performance (Masters Grade Level)Algebra I by Grade 8 - ParticipationEOC Algebra I Performance (Masters Grade Level) 41 521 8 16.0 Q3EOC English I Performance (Masters Grade Level) 76 790 10 7.5 Q1EOC English II Performance (Masters Grade Level) 45 717 6 7.0 Q2EOC Biology Performance (Masters Grade Level) 174 648 27 23.0 Q1EOC U.S. History Performance (Masters Grade Level) 252 583 43 43.5 Q2AP/IB Examination Participation: ELA 203 1,124 18.1 20.8 Q2AP/IB Examination Participation: Mathematics 53 1,124 4.7 10.2 Q3AP/IB Examination Participation: Science 160 1,124 14.2 16.4 Q2AP/IB Examination Participation: Social Studies 235 1,124 20.9 19.8 Q1AP/IB Examination Performance: ELA 85 203 41.9 52.3 Q3AP/IB Examination Performance: Mathematics 21 53 39.6 58.0 Q3AP/IB Examination Performance: Science 78 160 48.8 39.5 Q1AP/IB Examination Performance: Social Studies 91 235 38.7 51.1 Q3AP/IB Examination Performance: Any Subject 158 316 50.0 58.9 Q2SAT/ACT Participation 380 517 74 97 Q2SAT/ACT Performance 87 380 23 25 Q2SAT Performance: ELA n/a 365 926 938 Q2SAT Performance: Mathematics n/a 365 488 486 Q1ACT Performance: ELA n/a 134 20.5 20.9 Q2ACT Performance: Mathematics n/a 134 21.0 21.2 Q2ACT Performance: Science n/a 134 21.1 21.5 Q2Index 4 - Percent at STAAR Meets Grade Level Standard 1,164 1,736 67.0 66.0 Q1Four-Year Longitudinal Graduation Rate 517 566 91.3 95.8 Q4Four-Year Longitudinal Graduation Plan Rate* 382 477 80.1 93.0 Q4College-Ready Graduates 177 395 44.8 44.8 Q1Advanced/Dual-Credit Course Completion Rate: ELA/Reading 379 1,083 35.0 35.2 Q2Advanced/Dual-Credit Course Completion Rate: Mathematics 406 979 41.5 48.5 Q2Advanced/Dual-Credit Course Completion Rate: Science 201 898 22.4 16.6 Q1Advanced/Dual-Credit Course Completion Rate: Social Studies 451 1,106 40.8 34.4 Q1Advanced/Dual-Credit Course Completion Rate: Any Subject 645 1,149 56.1 59.4 Q2CTE-Coherent Sequence Graduates 139 517 26.9 54.6 Q3
Blank values for an indicator score occur if the indicator is not applicable to that campus or does not meet the minimum size of 10 students.
Blank values for a quartile occur if there are fewer than 20 campuses in the campus comparison group for each qualifying indicator.
'n/a' Indicates data reporting is not applicable for this indicator.
*The four-year longitudinal graduation plan rate is determined by comparing the all students RHSP/DAP rate and the all studentsRHSP/DAP/FHSP-E/FHSP-DLArate. The higher of the two rates is used for distinction designations. Refer to the Index 4 Data Table for details.
Recommended