Mickiewicz B., et al, page E1
Online Data Supplement
Metabolic profiling of serum samples by 1H NMR spectroscopy as a potential
diagnostic approach for septic shock
Beata Mickiewicz, PhD; Gavin E. Duggan, PhD; Brent W. Winston, MD; Christopher Doig,
MD; Paul Kubes, PhD; Hans J. Vogel, PhD for the Alberta Sepsis Network
Contents:
Description of NMR and MS techniques used in metabolomics studies
Additional inclusion and exclusion Alberta Sepsis Network (ASN) criteria for intensive
care unit control patients (ICU controls) enrolled in this study.
NMR spectral acquisition
References
Figures and Tables
Mickiewicz B., et al, page E2
Description of NMR and MS techniques used in metabolomics studies
Nowadays, NMR (Nuclear Magnetic Resonance) spectroscopy and MS (Mass
Spectrometry) instruments are the most common platforms used in metabolomics studies. The
NMR technique is based on the measurements of the magnetic properties of certain atomic
nuclei, e. g. 1H,
31P,
13C, in the metabolites [E1]. In NMR experiments, each chemical compound
can be recognized through its unique peak pattern which means that spectral intensities created
by individual metabolites can be identified and assigned to that metabolite. In MS experiments
chemical compounds are ionized to form positively or negatively charged molecules which are
separated and detected according to their mass-to-charge ratio. NMR spectroscopy benefits from
being very specific, quantitative and highly reproducible [E1]. Unfortunately, this technique is
associated with a low sensitivity compared to the other analytical methods such as GC-MS (Gas
Chromatography – Mass Spectrometry) or LC-MS (Liquid Chromatography – Mass
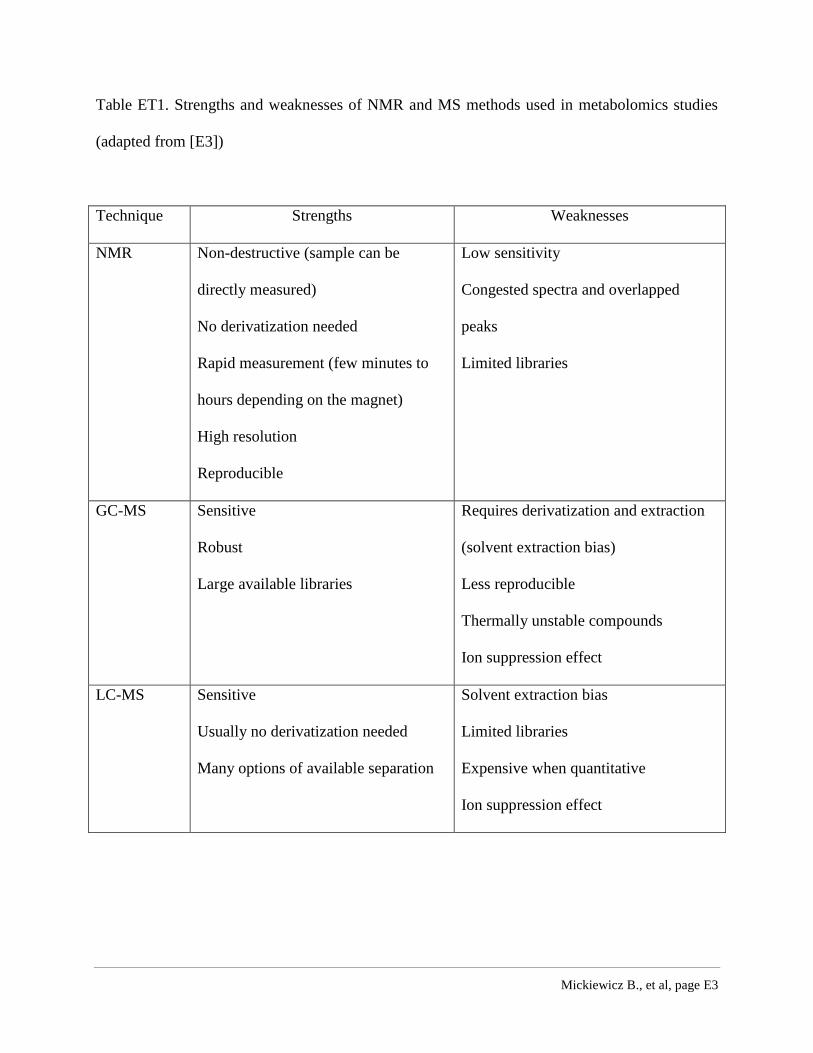
Spectrometry). Detailed information about the advantages and disadvantages of NMR and MS
techniques are described in Table ET1. In our study, however, using 1H-NMR was sufficiently
sensitive to detect significant changes in metabolic profiles between septic shock patients and
ICU controls. Moreover, the NMR technique does not require any special and sophisticated
protocol in terms of sample preparation. In the most simple case adding H2O/D2O and buffer for
pH adjustment is sufficient for sample preparation before the NMR experiment [E2]. Therefore,
NMR-based metabolomics could be appropriate as a cost effective solution for high-throughput
analysis for the diagnosis and prognosis of septic shock in the ICU. Obviously, the assignment of
metabolic profiles from NMR, GC-MS and LC-SM data together will further advance the
biological understanding of septic shock and hence these methods should also be considered in
future studies.
Mickiewicz B., et al, page E3
Table ET1. Strengths and weaknesses of NMR and MS methods used in metabolomics studies
(adapted from [E3])
Technique Strengths Weaknesses
NMR Non-destructive (sample can be
directly measured)
No derivatization needed
Rapid measurement (few minutes to
hours depending on the magnet)
High resolution
Reproducible
Low sensitivity
Congested spectra and overlapped
peaks
Limited libraries
GC-MS Sensitive
Robust
Large available libraries
Requires derivatization and extraction
(solvent extraction bias)
Less reproducible
Thermally unstable compounds
Ion suppression effect
LC-MS Sensitive
Usually no derivatization needed
Many options of available separation
Solvent extraction bias
Limited libraries
Expensive when quantitative
Ion suppression effect
Mickiewicz B., et al, page E4
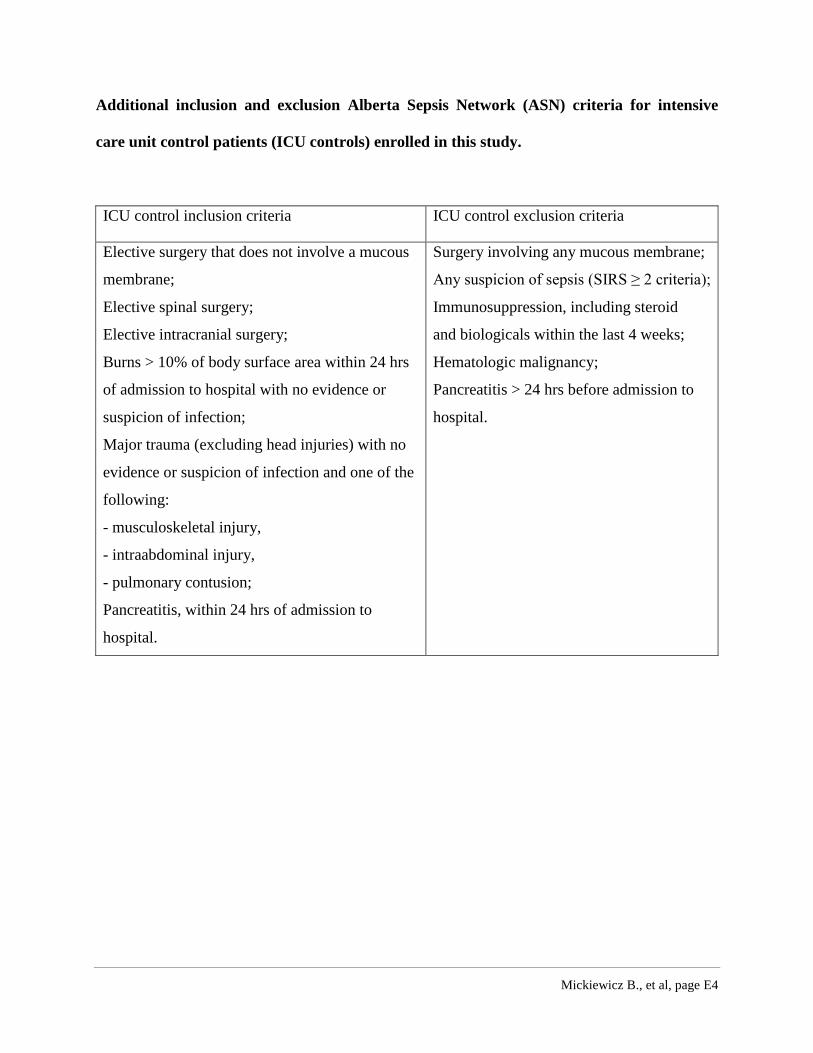
Additional inclusion and exclusion Alberta Sepsis Network (ASN) criteria for intensive
care unit control patients (ICU controls) enrolled in this study.
ICU control inclusion criteria ICU control exclusion criteria
Elective surgery that does not involve a mucous
membrane;
Elective spinal surgery;
Elective intracranial surgery;
Burns > 10% of body surface area within 24 hrs
of admission to hospital with no evidence or
suspicion of infection;
Major trauma (excluding head injuries) with no
evidence or suspicion of infection and one of the
following:
- musculoskeletal injury,
- intraabdominal injury,
- pulmonary contusion;
Pancreatitis, within 24 hrs of admission to
hospital.
Surgery involving any mucous membrane;
Any suspicion of sepsis (SIRS ≥ 2 criteria);
Immunosuppression, including steroid
and biologicals within the last 4 weeks;
Hematologic malignancy;
Pancreatitis > 24 hrs before admission to
hospital.
Mickiewicz B., et al, page E5
NMR spectral acquisition
NMR spectra were acquired in a blinded fashion using an automated NMR Case sample
changer on a 600 MHz Bruker Ultrashield Plus NMR spectrometer (Bruker BioSpin Ltd.,
Canada). The one-dimensional 1H NMR spectra were obtained using a standard Bruker 1D
spectroscopy presutaration pulse sequence (noesypr1d) with optimal water suppression and a
mixing time of 100 ms [E4, E5]. Samples were shimmed to ensure a line width at half-height of
approximately 0.7 – 0.8 Hz for the 2,2-dimethyl-2-silapentane-5-sulfonate (DSS) peak calibrated
to 0.0 ppm. Spectra were acquired with 1024 scans, zero-filled and Fourier transformed to 128k
points. For initial inspection, the spectra were manually corrected including phasing, baseline
correction and referencing to the DSS peak at 0.0 ppm using the Topspin software program
(Bruker BioSpin Ltd., Canada). In addition two-dimensional NMR spectra, including total
correlation spectroscopy (TOCSY) and 1H,
13C heteronuclear single quantum coherence
spectroscopy (1H,
13C HSQC), were obtained for randomly chosen samples in order to verify the
chemical shift assignments.
Mickiewicz B., et al, page E6
References
E1. Dunn WB, Broadhurst DI, Atherton HJ, Goodacre R, Griffin JL: Systems level studies of
mammalian metabolomes: the roles of mass spectrometry and nuclear magnetic resonance
spectroscopy. Chem Soc Rev 2011, 40(1):387-426.
E2. Lindon, JC, Nicholson JK, Holmes E, Everett JR: Metabonomics: metabolic processes
studied by NMR spectroscopy of biofluids, Concepts Magn Reson 2000, 12: 289-320.
E3. Vernocchi P, Vannini L, Gottardi D, Del Chierico F, Serrazanetti DI, Ndagijimana M,
Guerzoni ME: Integration of datasets from different analytical techniques to assess the impact of
nutrition on human metabolome. Front Cell Infect Microbiol 2012, 2:156 (1-10).
E4. Weljie AM, Newton J, Mercier P, Carlson E, Slupsky CM: Targeted profiling: quantitative
analysis of 1H NMR metabolomics data. Anal Chem 2006, 78(13):4430-4442.
E5. Nicholson JK, Foxall PJ, Spraul M, Farrant RD, Lindon JC: 750 MHz 1H and 1H-13C NMR
spectroscopy of human blood plasma. Anal Chem 1995, 67(5):793-811.
Mickiewicz B., et al, page E7
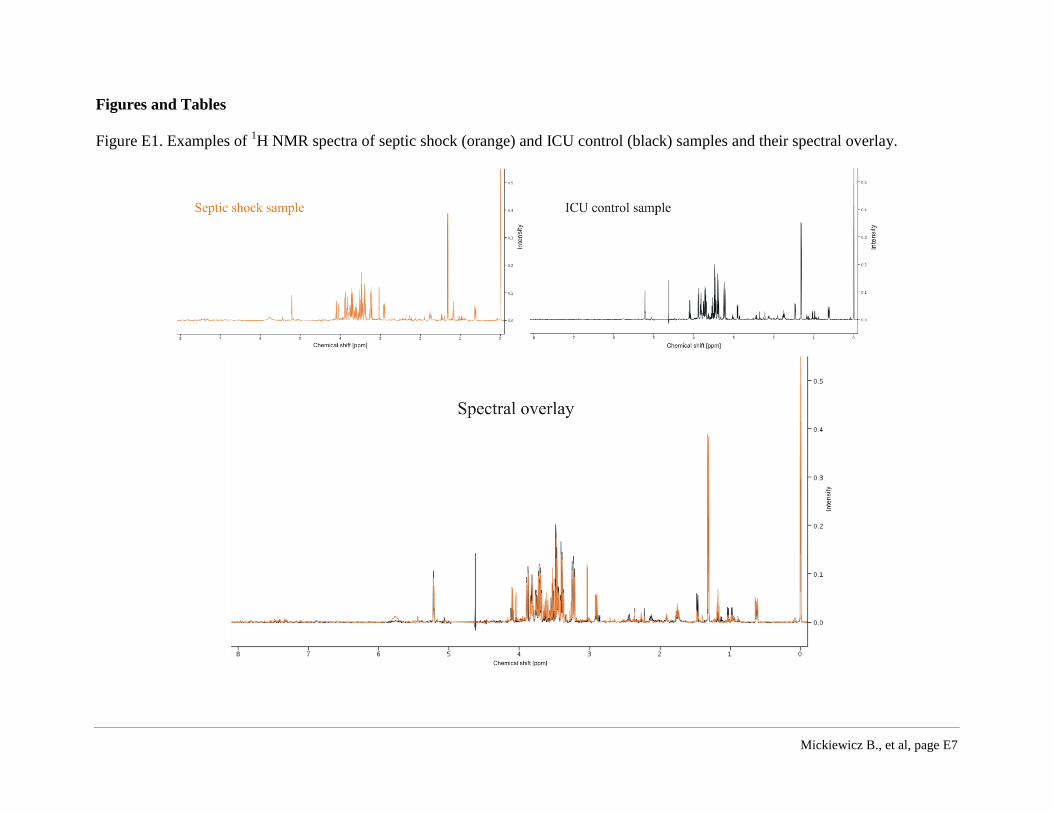
Figures and Tables
Figure E1. Examples of 1H NMR spectra of septic shock (orange) and ICU control (black) samples and their spectral overlay.
Mickiewicz B., et al, page E8
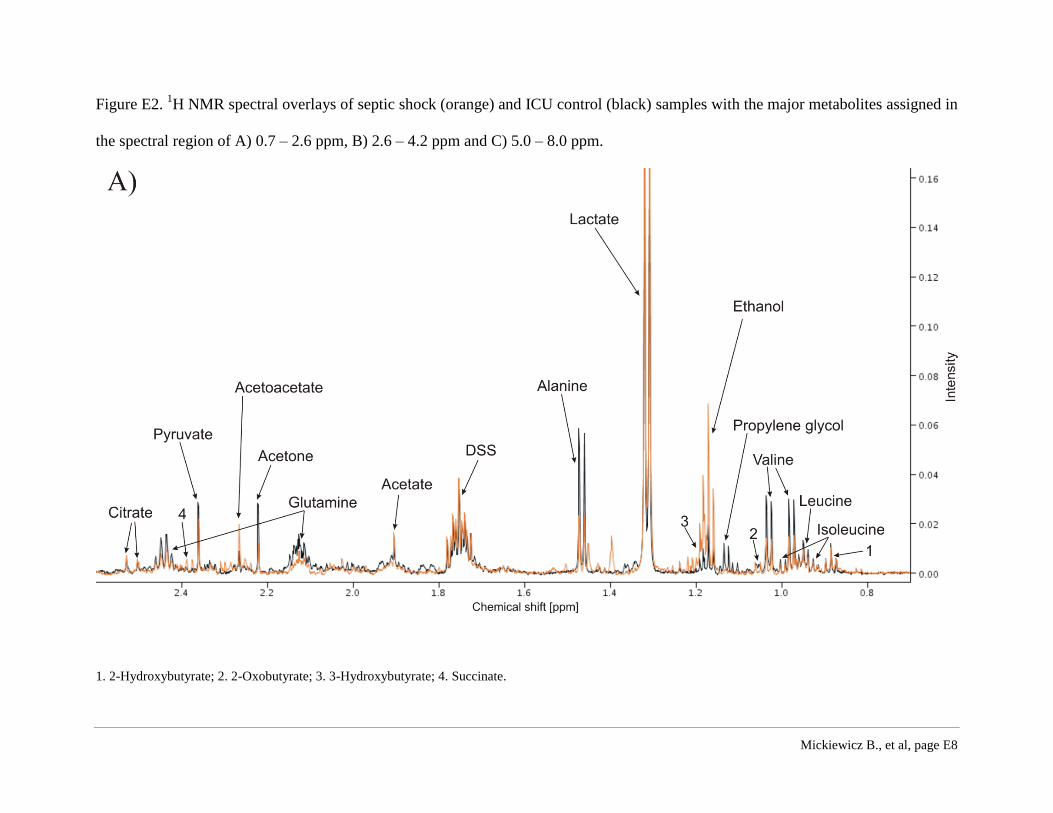
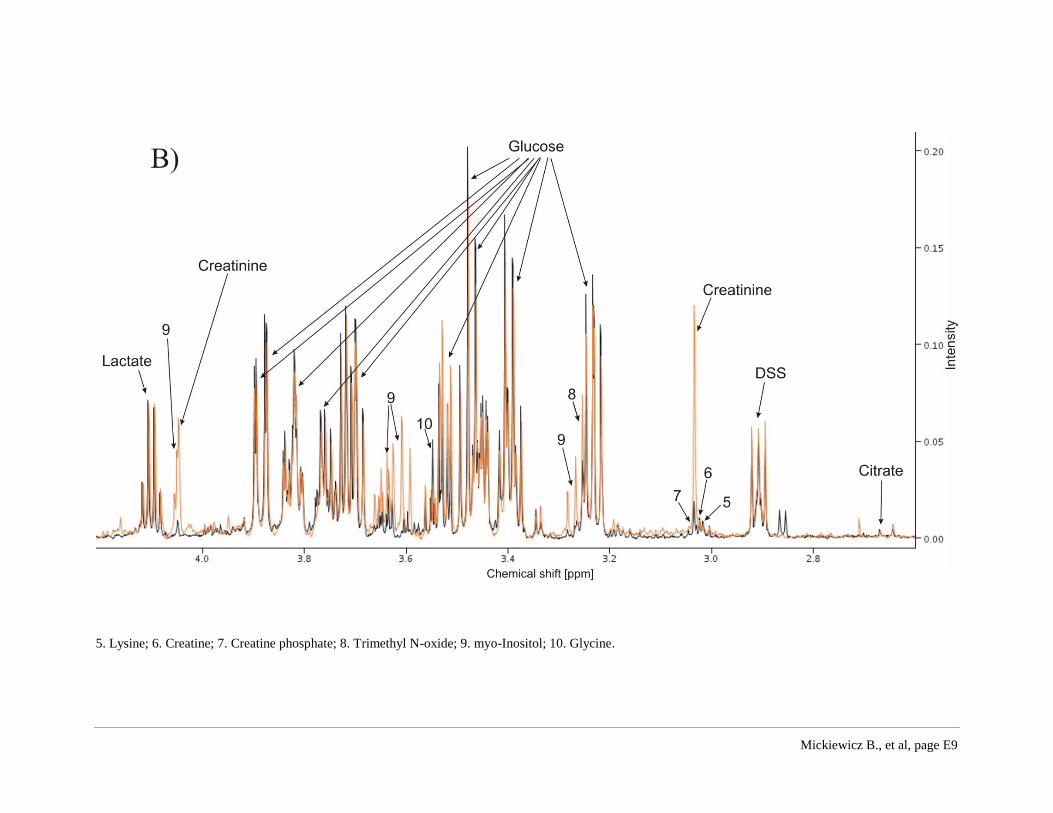
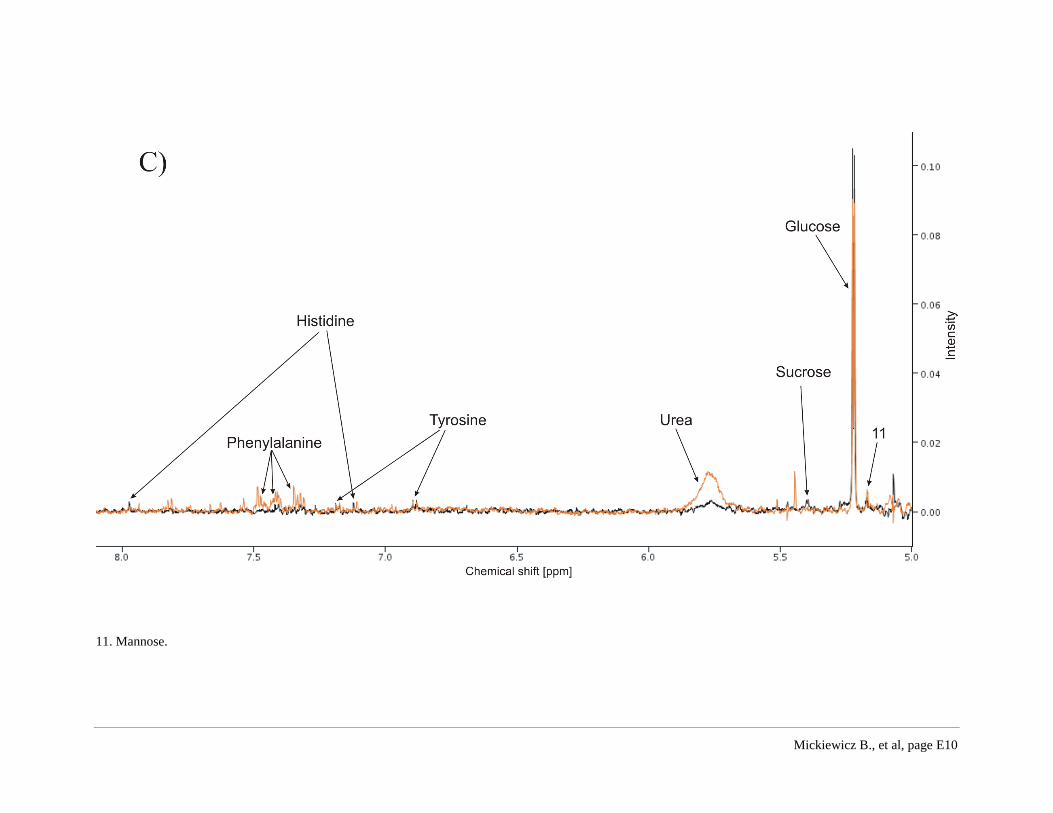
Figure E2. 1H NMR spectral overlays of septic shock (orange) and ICU control (black) samples with the major metabolites assigned in
the spectral region of A) 0.7 – 2.6 ppm, B) 2.6 – 4.2 ppm and C) 5.0 – 8.0 ppm.
1. 2-Hydroxybutyrate; 2. 2-Oxobutyrate; 3. 3-Hydroxybutyrate; 4. Succinate.
Mickiewicz B., et al, page E9
5. Lysine; 6. Creatine; 7. Creatine phosphate; 8. Trimethyl N-oxide; 9. myo-Inositol; 10. Glycine.
Mickiewicz B., et al, page E10
11. Mannose.
Mickiewicz B., et al, page E11
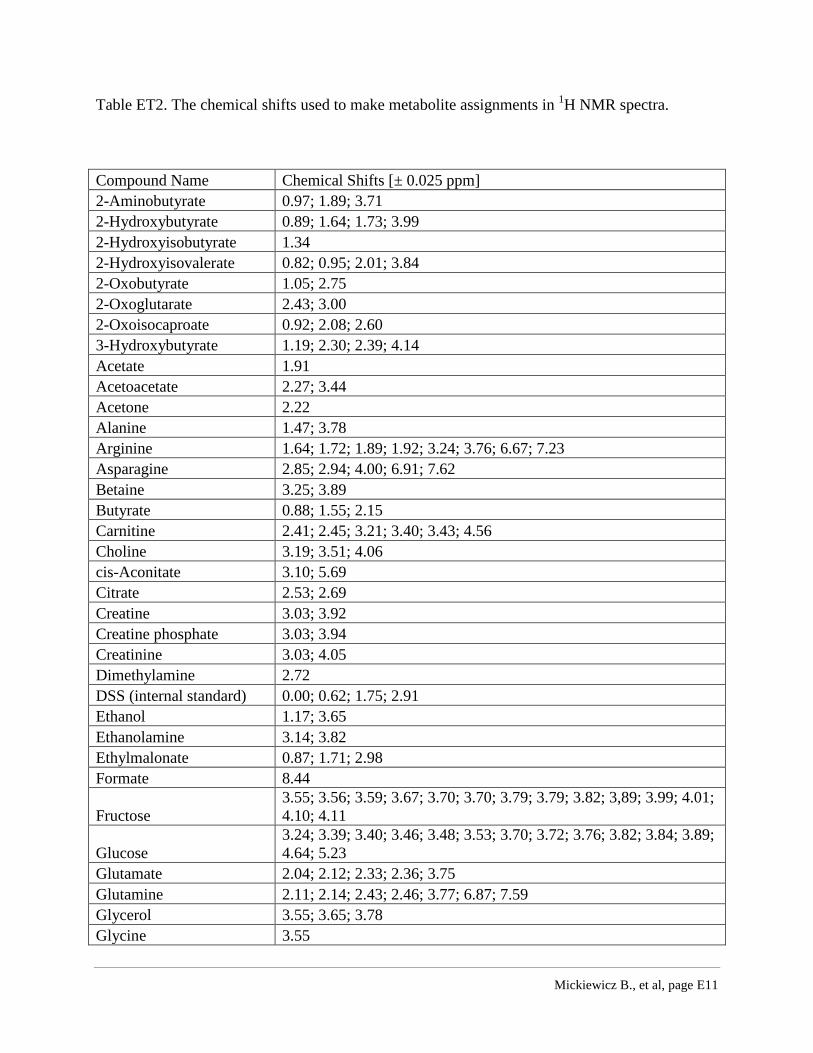
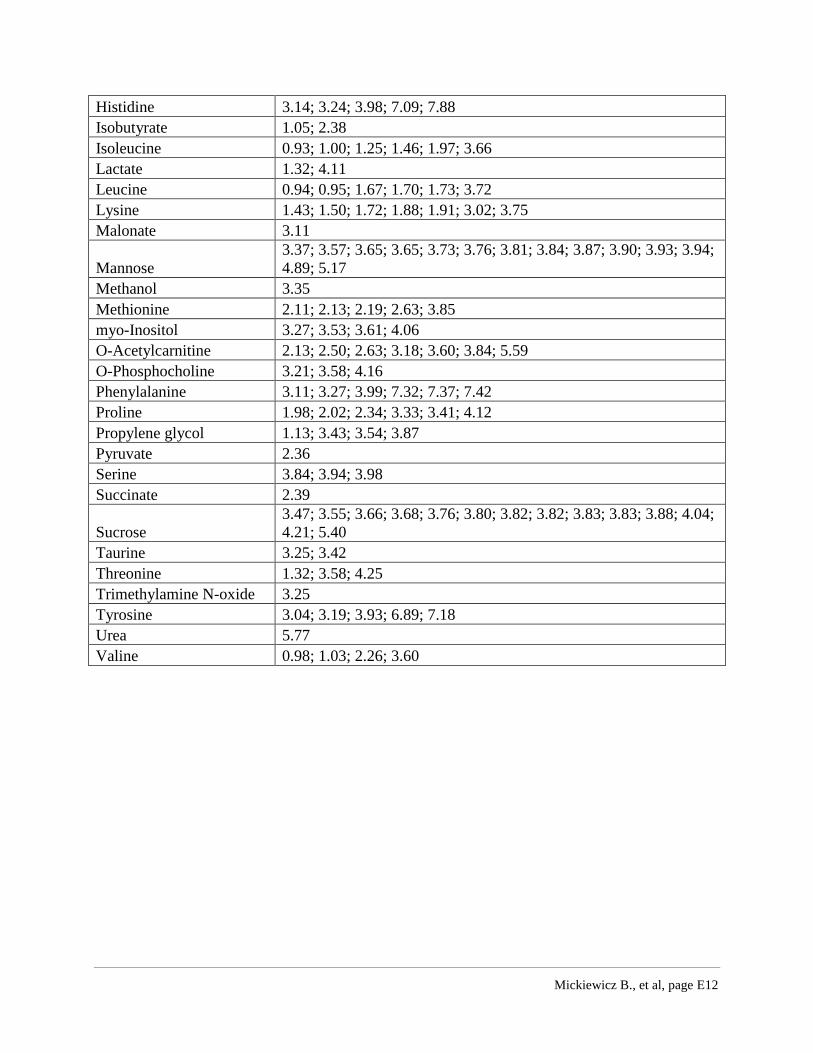
Table ET2. The chemical shifts used to make metabolite assignments in 1H NMR spectra.
Compound Name Chemical Shifts [± 0.025 ppm]
2-Aminobutyrate 0.97; 1.89; 3.71
2-Hydroxybutyrate 0.89; 1.64; 1.73; 3.99
2-Hydroxyisobutyrate 1.34
2-Hydroxyisovalerate 0.82; 0.95; 2.01; 3.84
2-Oxobutyrate 1.05; 2.75
2-Oxoglutarate 2.43; 3.00
2-Oxoisocaproate 0.92; 2.08; 2.60
3-Hydroxybutyrate 1.19; 2.30; 2.39; 4.14
Acetate 1.91
Acetoacetate 2.27; 3.44
Acetone 2.22
Alanine 1.47; 3.78
Arginine 1.64; 1.72; 1.89; 1.92; 3.24; 3.76; 6.67; 7.23
Asparagine 2.85; 2.94; 4.00; 6.91; 7.62
Betaine 3.25; 3.89
Butyrate 0.88; 1.55; 2.15
Carnitine 2.41; 2.45; 3.21; 3.40; 3.43; 4.56
Choline 3.19; 3.51; 4.06
cis-Aconitate 3.10; 5.69
Citrate 2.53; 2.69
Creatine 3.03; 3.92
Creatine phosphate 3.03; 3.94
Creatinine 3.03; 4.05
Dimethylamine 2.72
DSS (internal standard) 0.00; 0.62; 1.75; 2.91
Ethanol 1.17; 3.65
Ethanolamine 3.14; 3.82
Ethylmalonate 0.87; 1.71; 2.98
Formate 8.44
Fructose
3.55; 3.56; 3.59; 3.67; 3.70; 3.70; 3.79; 3.79; 3.82; 3,89; 3.99; 4.01;
4.10; 4.11
Glucose
3.24; 3.39; 3.40; 3.46; 3.48; 3.53; 3.70; 3.72; 3.76; 3.82; 3.84; 3.89;
4.64; 5.23
Glutamate 2.04; 2.12; 2.33; 2.36; 3.75
Glutamine 2.11; 2.14; 2.43; 2.46; 3.77; 6.87; 7.59
Glycerol 3.55; 3.65; 3.78
Glycine 3.55
Mickiewicz B., et al, page E12
Histidine 3.14; 3.24; 3.98; 7.09; 7.88
Isobutyrate 1.05; 2.38
Isoleucine 0.93; 1.00; 1.25; 1.46; 1.97; 3.66
Lactate 1.32; 4.11
Leucine 0.94; 0.95; 1.67; 1.70; 1.73; 3.72
Lysine 1.43; 1.50; 1.72; 1.88; 1.91; 3.02; 3.75
Malonate 3.11
Mannose
3.37; 3.57; 3.65; 3.65; 3.73; 3.76; 3.81; 3.84; 3.87; 3.90; 3.93; 3.94;
4.89; 5.17
Methanol 3.35
Methionine 2.11; 2.13; 2.19; 2.63; 3.85
myo-Inositol 3.27; 3.53; 3.61; 4.06
O-Acetylcarnitine 2.13; 2.50; 2.63; 3.18; 3.60; 3.84; 5.59
O-Phosphocholine 3.21; 3.58; 4.16
Phenylalanine 3.11; 3.27; 3.99; 7.32; 7.37; 7.42
Proline 1.98; 2.02; 2.34; 3.33; 3.41; 4.12
Propylene glycol 1.13; 3.43; 3.54; 3.87
Pyruvate 2.36
Serine 3.84; 3.94; 3.98
Succinate 2.39
Sucrose
3.47; 3.55; 3.66; 3.68; 3.76; 3.80; 3.82; 3.82; 3.83; 3.83; 3.88; 4.04;
4.21; 5.40
Taurine 3.25; 3.42
Threonine 1.32; 3.58; 4.25
Trimethylamine N-oxide 3.25
Tyrosine 3.04; 3.19; 3.93; 6.89; 7.18
Urea 5.77
Valine 0.98; 1.03; 2.26; 3.60
Mickiewicz B., et al, page E13
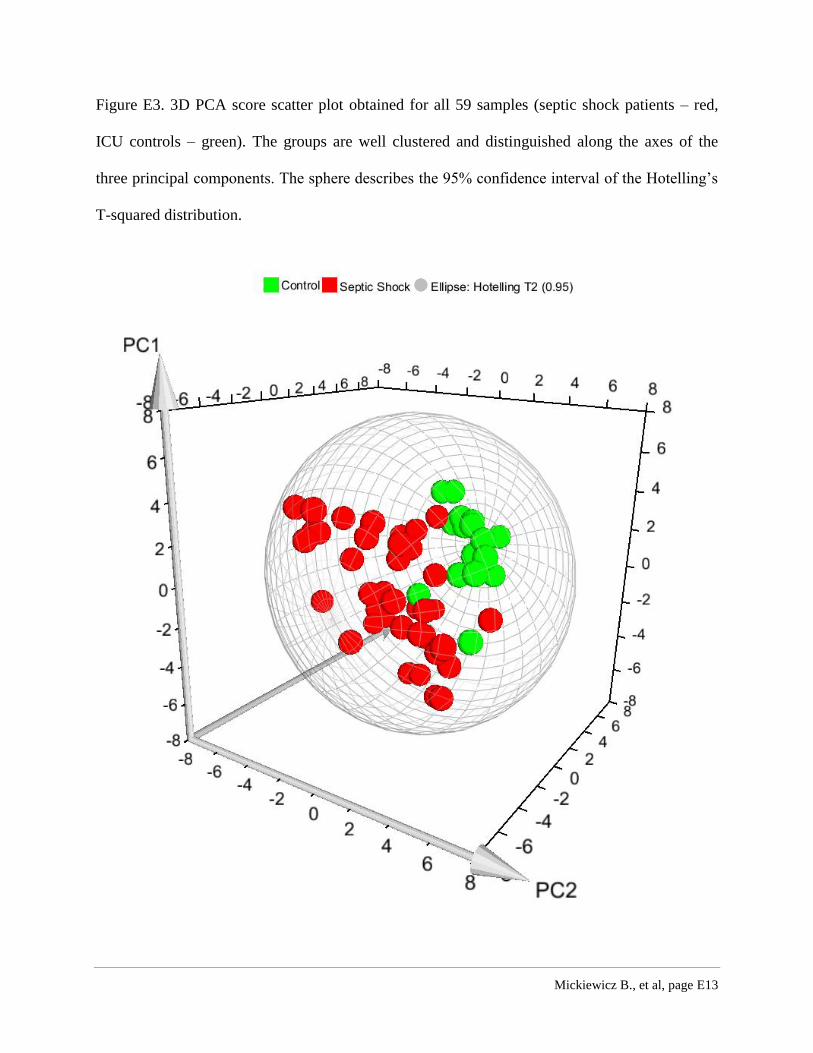
Figure E3. 3D PCA score scatter plot obtained for all 59 samples (septic shock patients – red,
ICU controls – green). The groups are well clustered and distinguished along the axes of the
three principal components. The sphere describes the 95% confidence interval of the Hotelling’s
T-squared distribution.
Recommended