Methodologies for ecological baselines and prediction of impacts on
biodiversity resources
Dr. Asha Rajvanshi
Senior Reader and Faculty In-charge, EIA Cell,
Wildlife Institute of India, INDIA
IAIA ’06 Pre-meeting training course - Stavanger, Norway
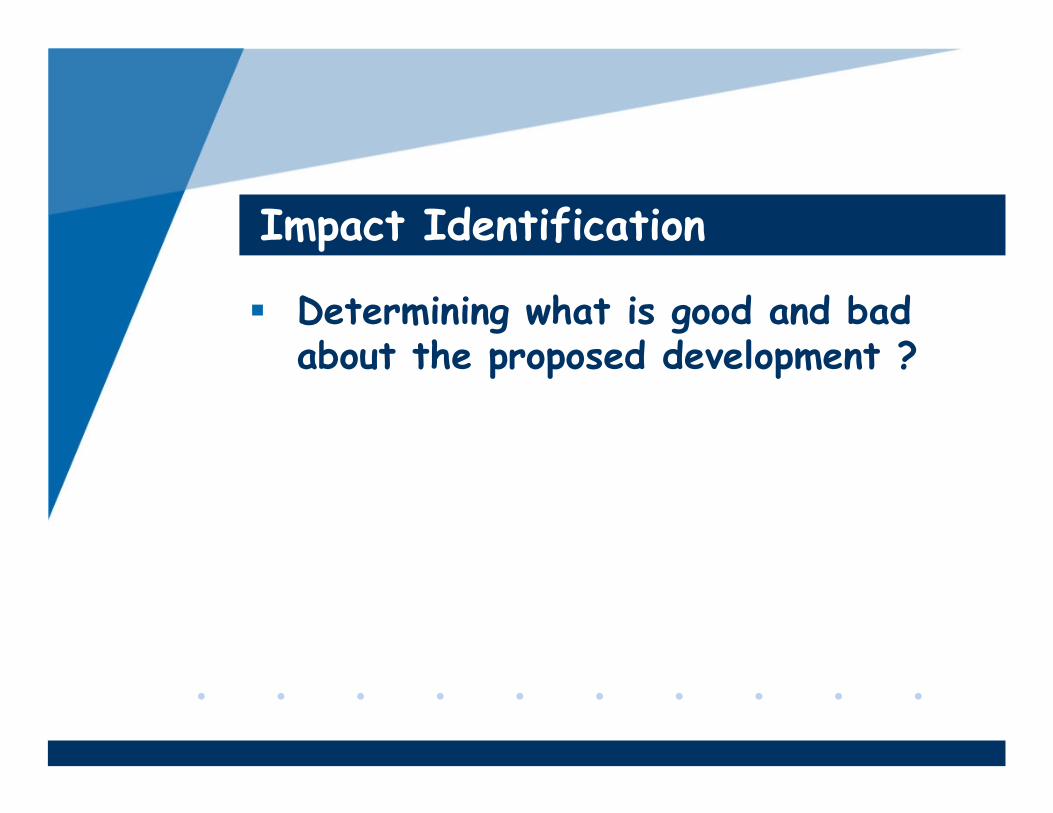
Impact Identification
� Determining what is good and bad about the proposed development ?

Impact is defined as ‘a value
judgment on the importance of a
change measured through varied
parameters and indicators’
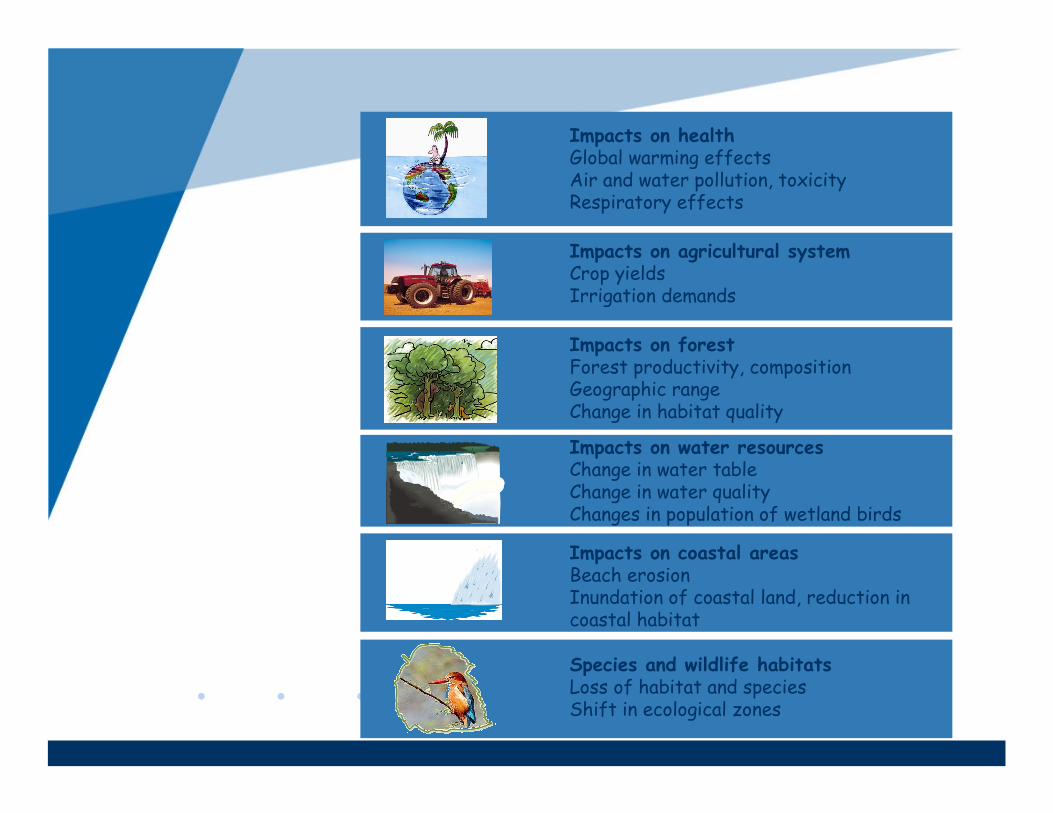
Impacts on healthGlobal warming effects Air and water pollution, toxicity Respiratory effects
Impacts on agricultural systemCrop yieldsIrrigation demands
Impacts on forestForest productivity, composition Geographic rangeChange in habitat quality
Impacts on water resourcesChange in water tableChange in water qualityChanges in population of wetland birds
Impacts on coastal areasBeach erosionInundation of coastal land, reduction in coastal habitat
Species and wildlife habitatsLoss of habitat and speciesShift in ecological zones

‘A window into the future’
Impact prediction
� Formal methods standardized as guides/tool kits
� Adhoc methods developed according to the situation
EIA methods
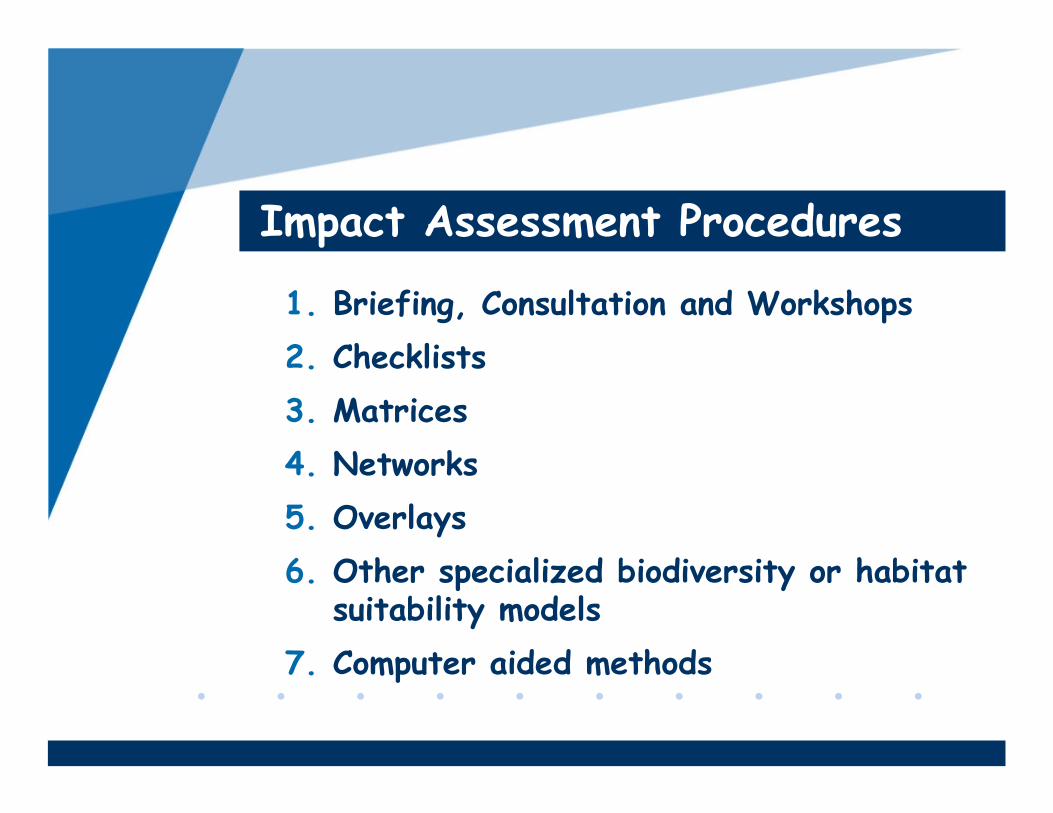
1. Briefing, Consultation and Workshops
2. Checklists
3. Matrices
4. Networks
5. Overlays
6. Other specialized biodiversity or habitat suitability models
7. Computer aided methods
Impact Assessment Procedures
� A variety of methods varying in complexity and characteristics
� All share the common basis of an index of environmental factors or development activities
� Simple checklists
� Descriptive checklists
� Questionnaire checklists
� Weighting-scaling checklists
Checklists
� Provide assessor with a list of factors to be considered, but no information provided on:
Simple checklists
� Used as ‘aide memoir’ to identify impacts
� Can provide structure to initial part of scoping stage
� specific data needs
� methods of assessing importance of impacts
� ways of measuring change to environmental factors
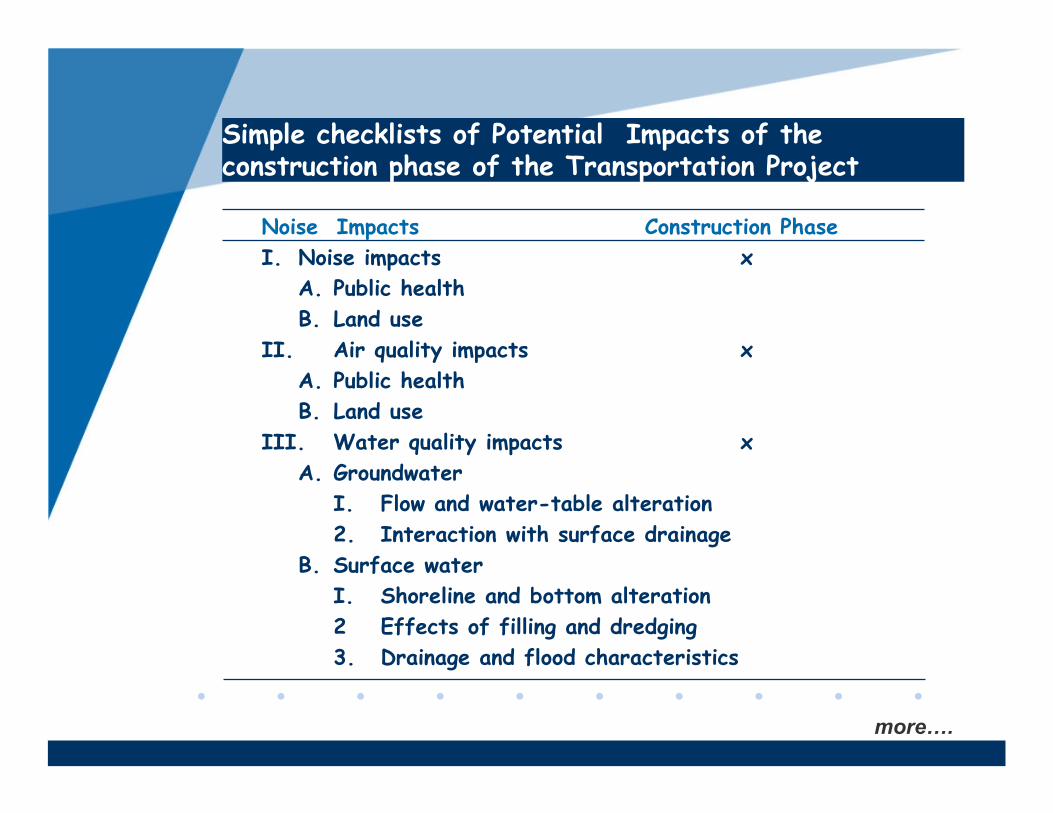
Noise Impacts Construction Phase
I. Noise impacts x
A. Public health
B. Land use
II. Air quality impacts x
A. Public health
B. Land use
III. Water quality impacts x
A. Groundwater
I. Flow and water-table alteration
2. Interaction with surface drainage
B. Surface water
I. Shoreline and bottom alteration
2 Effects of filling and dredging
3. Drainage and flood characteristics
more….
Simple checklists of Potential Impacts of the construction phase of the Transportation Project
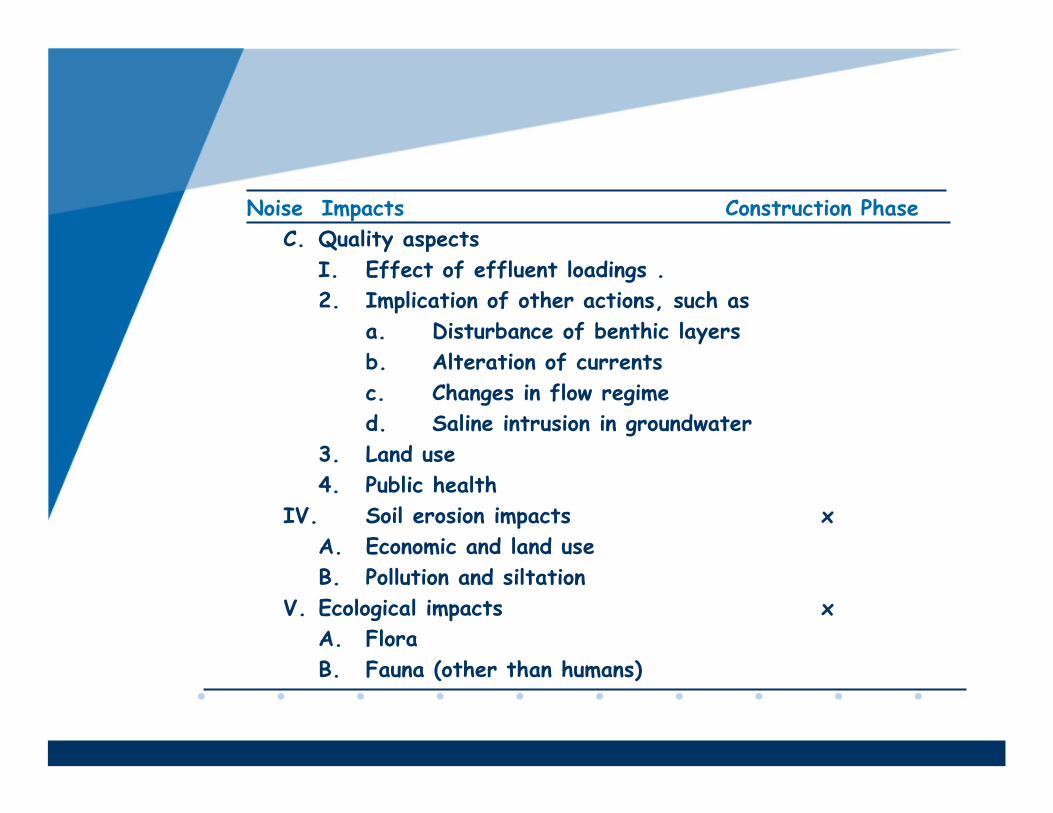
Noise Impacts Construction Phase
C. Quality aspects
I. Effect of effluent loadings .
2. Implication of other actions, such as
a. Disturbance of benthic layers
b. Alteration of currents
c. Changes in flow regime
d. Saline intrusion in groundwater
3. Land use
4. Public health
IV. Soil erosion impacts x
A. Economic and land use
B. Pollution and siltation
V. Ecological impacts x
A. Flora
B. Fauna (other than humans)
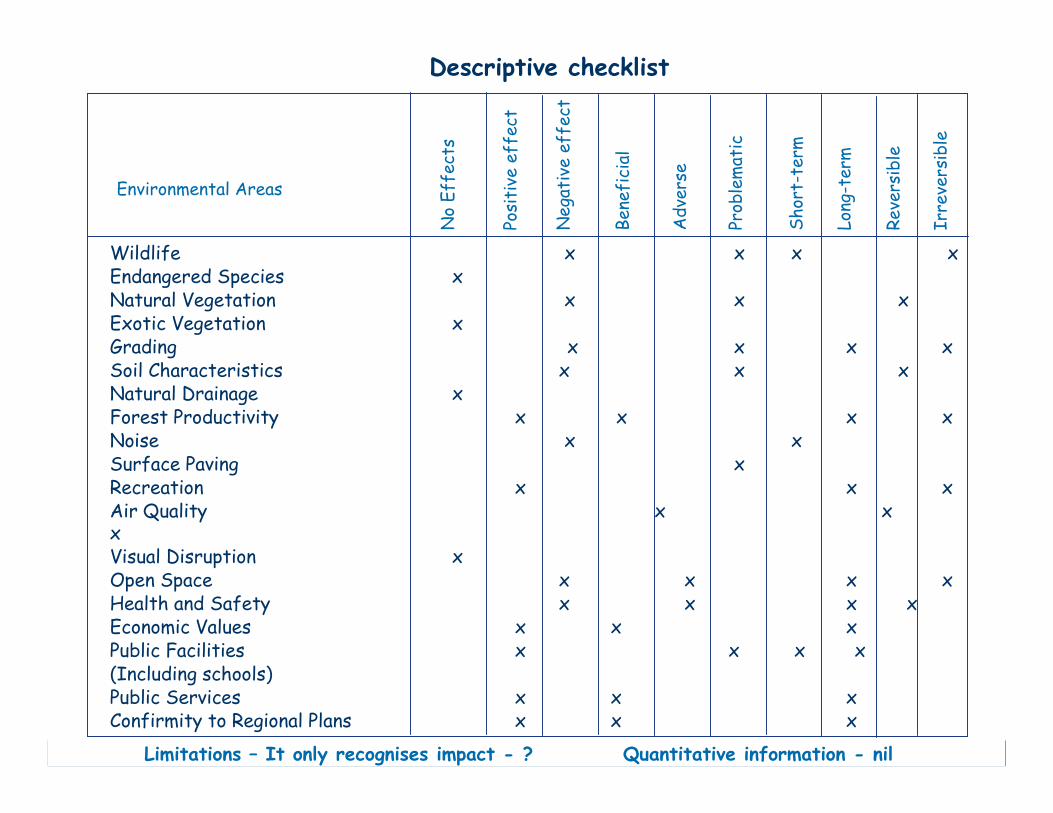
Wildlife x x x xEndangered Species xNatural Vegetation x x xExotic Vegetation xGrading x x x xSoil Characteristics x x xNatural Drainage xForest Productivity x x x xNoise x xSurface Paving xRecreation x x xAir Quality x xxVisual Disruption xOpen Space x x x xHealth and Safety x x x xEconomic Values x x xPublic Facilities x x x x(Including schools)Public Services x x xConfirmity to Regional Plans x x x
No Effects
Positive effect
Negative effect
Beneficial
Adverse
Problematic
Short-term
Long-term
Reversible
Irreversible
Environmental Areas
Descriptive checklist
Limitations – It only recognises impact - ? Quantitative information - nil
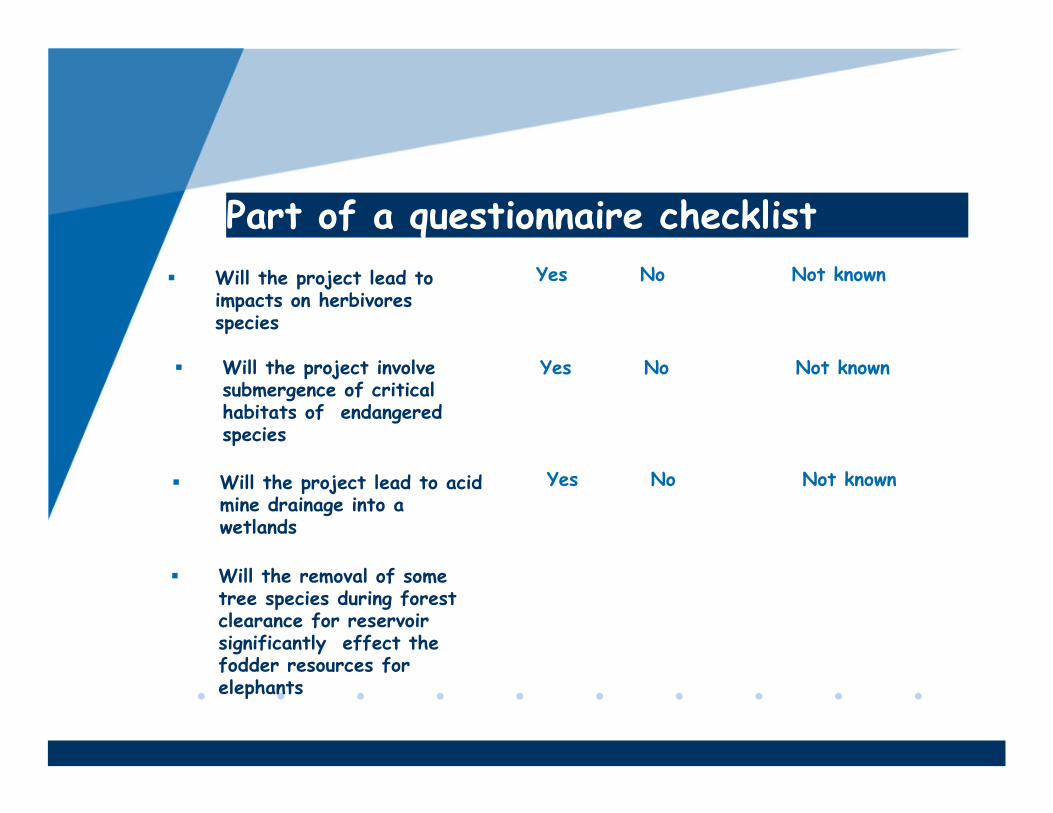
� Will the project lead to impacts on herbivores species
Yes No Not known
� Will the project involve submergence of critical habitats of endangered species
� Will the project lead to acid mine drainage into a wetlands
� Will the removal of some tree species during forest clearance for reservoir significantly effect the fodder resources for elephants
Part of a questionnaire checklist
Yes No Not known
Yes No Not known
� Comparatively simple method
� Not necessarily project specific
� Once established, can be used in many different situations
Benefits of checklists
� It only recognises impact and provides no quantitative information
� Can never be considered as definite or complete
� Do not help to identify secondary/higher order impacts
� Tend to compartmentalise
Problems with checklists
� Two dimensional version of a checklist
� Attempts to identify interactions between development actions on one axis and environmental parameters on the other
� Variety of forms available
Interaction matrices
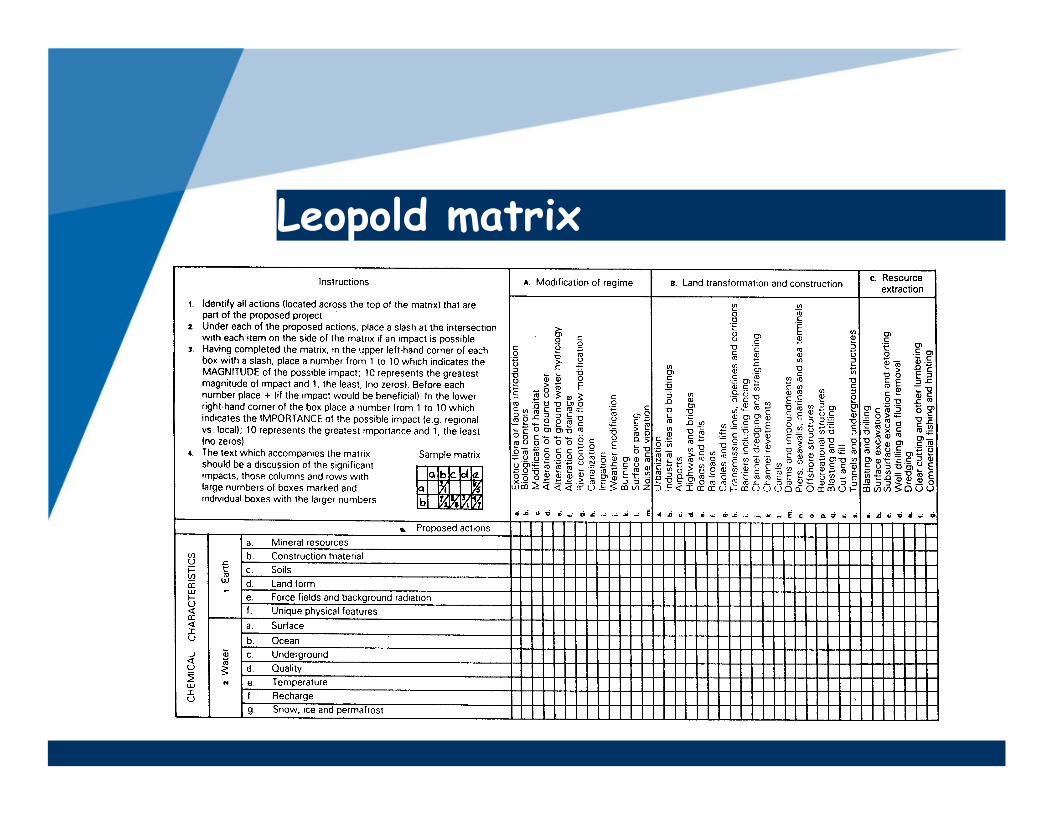
� Developed by United States Geological Survey 1971
� 100 actions x 88 environmental items
� IMPACT - identified at the interaction between the above
� Impacts can be identified:
Leopold matrix
� by signs: ���� ���� ���� ���� ����
� qualitatively: ‘good’, ‘moderate’, ‘high’
� quantitatively: absolute/relative (NOT OBJECTIVE)
� Impacts can be POSITIVE or NEGATIVE
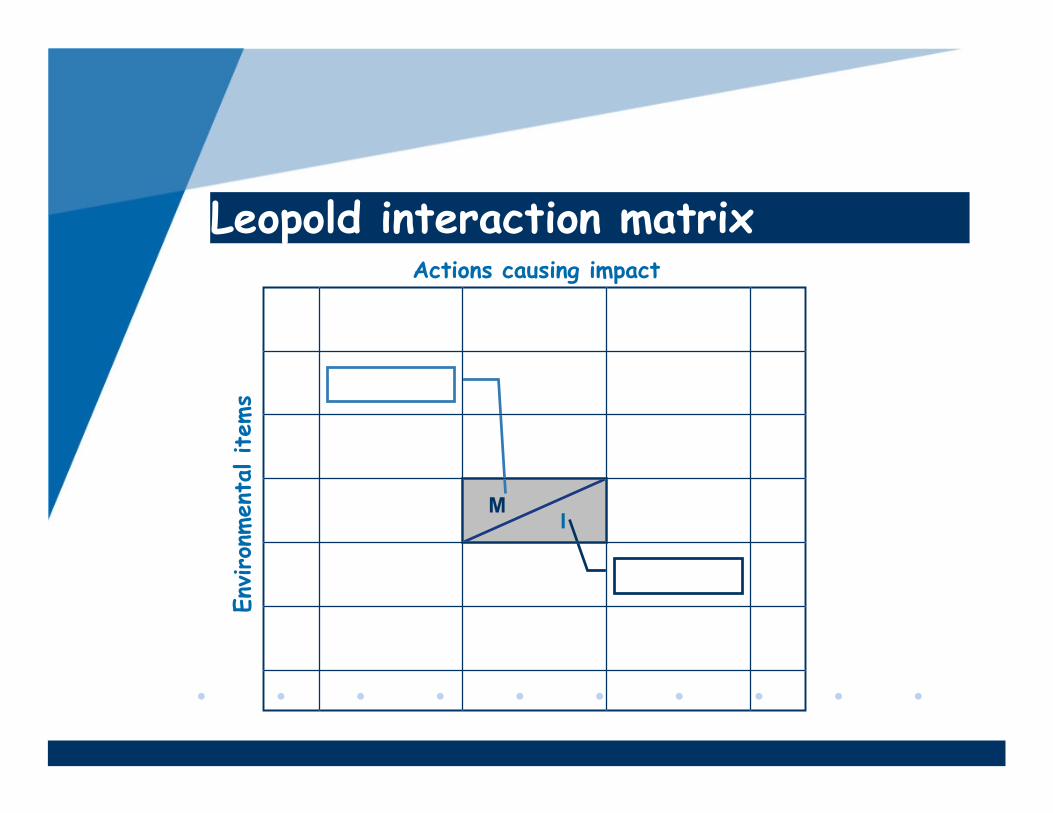
MI
Actions causing impactEnvironmental items
Magnitude
Leopold interaction matrix

meaning of x/y: x = Relative magnitudey = Relative importance
a,b,c, are activities
A,B,Care environmental parameters
Leopold matrix
etc.
2/24/67/24/52/3D
3/61/15/59/78/87/2C
3/34/94/81/10B
3/78/52/1A
etc.gfedcba
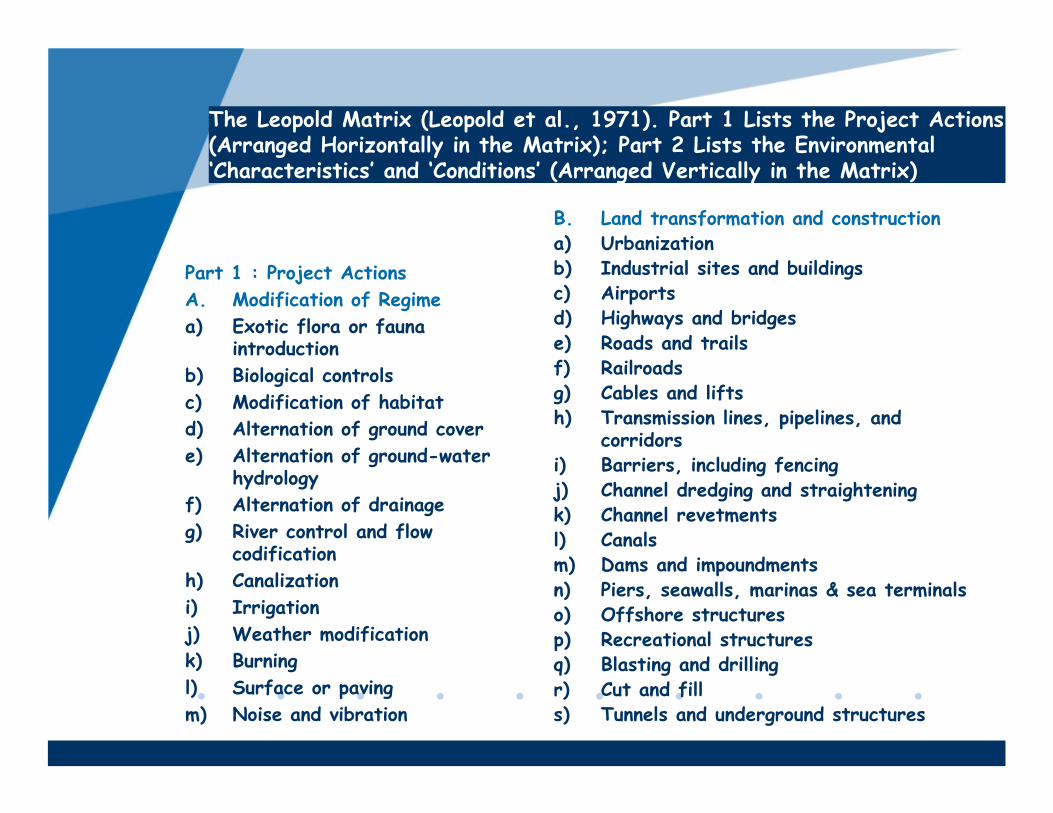
Part 1 : Project Actions
A. Modification of Regime
a) Exotic flora or fauna introduction
b) Biological controls
c) Modification of habitat
d) Alternation of ground cover
e) Alternation of ground-water hydrology
f) Alternation of drainage
g) River control and flow codification
h) Canalization
i) Irrigation
j) Weather modification
k) Burning
l) Surface or paving
m) Noise and vibration
B. Land transformation and constructiona) Urbanizationb) Industrial sites and buildingsc) Airportsd) Highways and bridgese) Roads and trailsf) Railroadsg) Cables and liftsh) Transmission lines, pipelines, and
corridorsi) Barriers, including fencingj) Channel dredging and straighteningk) Channel revetmentsl) Canalsm) Dams and impoundmentsn) Piers, seawalls, marinas & sea terminalso) Offshore structuresp) Recreational structuresq) Blasting and drillingr) Cut and fills) Tunnels and underground structures
The Leopold Matrix (Leopold et al., 1971). Part 1 Lists the Project Actions (Arranged Horizontally in the Matrix); Part 2 Lists the Environmental ‘Characteristics’ and ‘Conditions’ (Arranged Vertically in the Matrix)
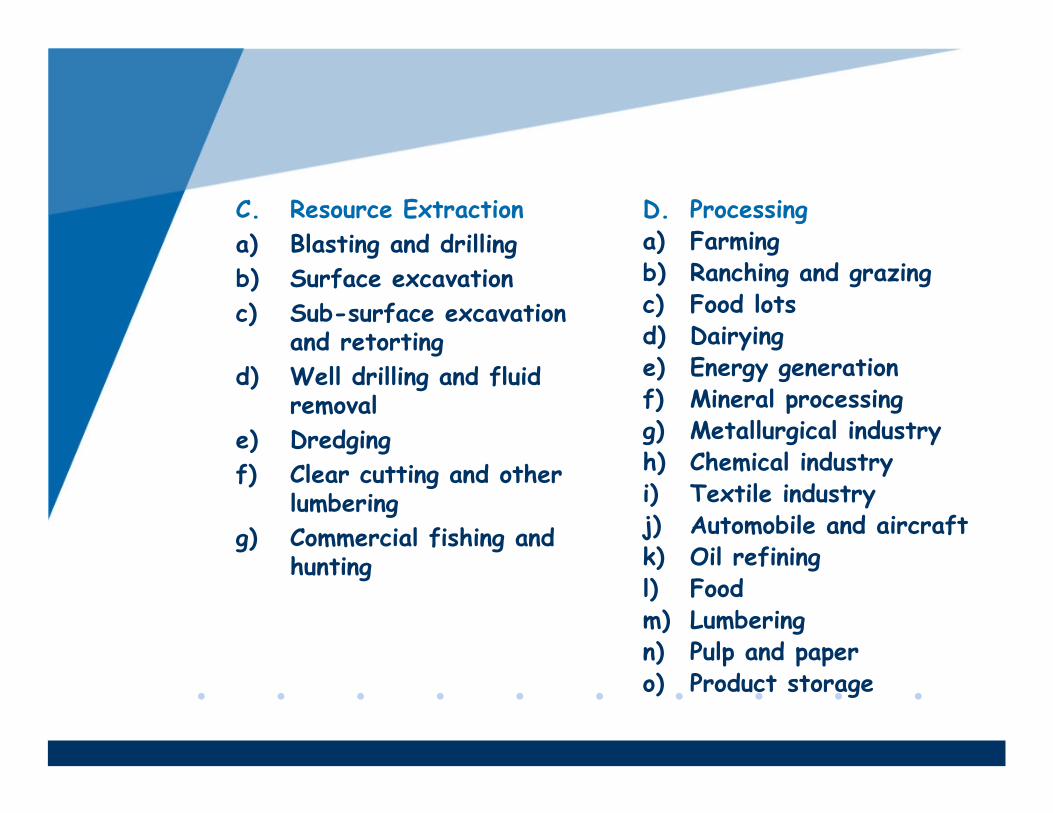
C. Resource Extraction
a) Blasting and drilling
b) Surface excavation
c) Sub-surface excavation and retorting
d) Well drilling and fluid removal
e) Dredging
f) Clear cutting and other lumbering
g) Commercial fishing and hunting
D. Processinga) Farmingb) Ranching and grazingc) Food lotsd) Dairyinge) Energy generationf) Mineral processingg) Metallurgical industryh) Chemical industryi) Textile industryj) Automobile and aircraftk) Oil refiningl) Foodm) Lumberingn) Pulp and papero) Product storage
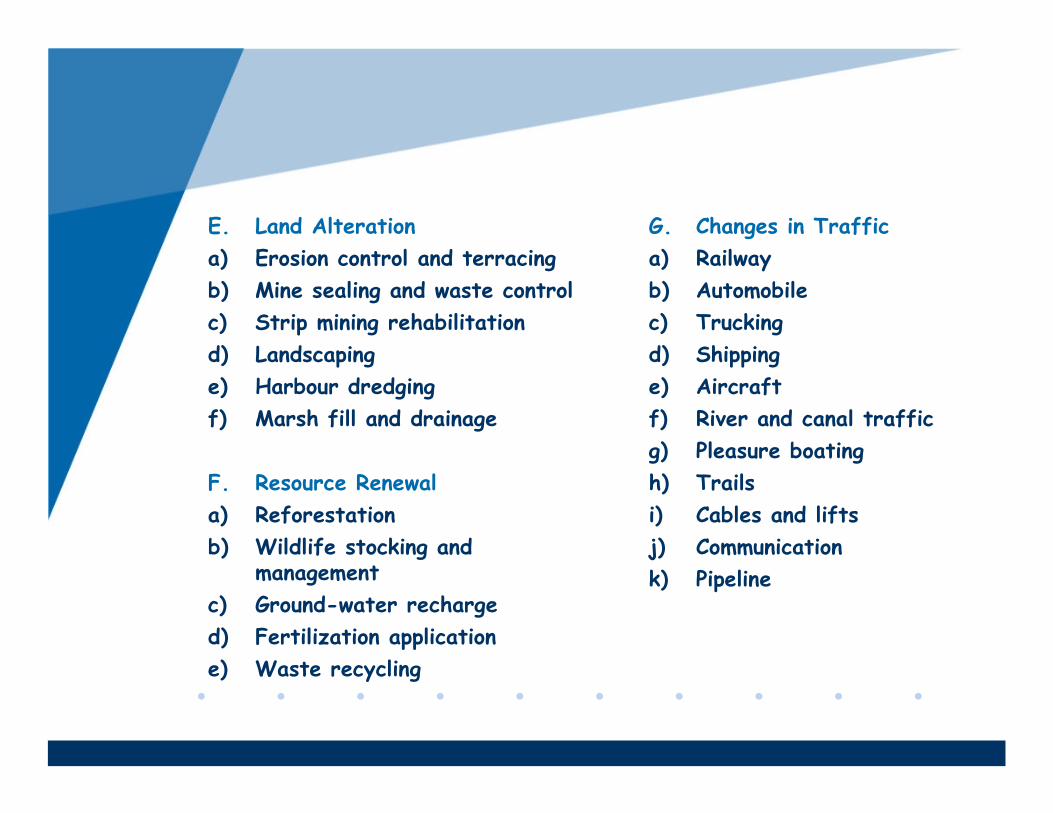
E. Land Alteration
a) Erosion control and terracing
b) Mine sealing and waste control
c) Strip mining rehabilitation
d) Landscaping
e) Harbour dredging
f) Marsh fill and drainage
F. Resource Renewal
a) Reforestation
b) Wildlife stocking and management
c) Ground-water recharge
d) Fertilization application
e) Waste recycling
G. Changes in Traffic
a) Railway
b) Automobile
c) Trucking
d) Shipping
e) Aircraft
f) River and canal traffic
g) Pleasure boating
h) Trails
i) Cables and lifts
j) Communication
k) Pipeline
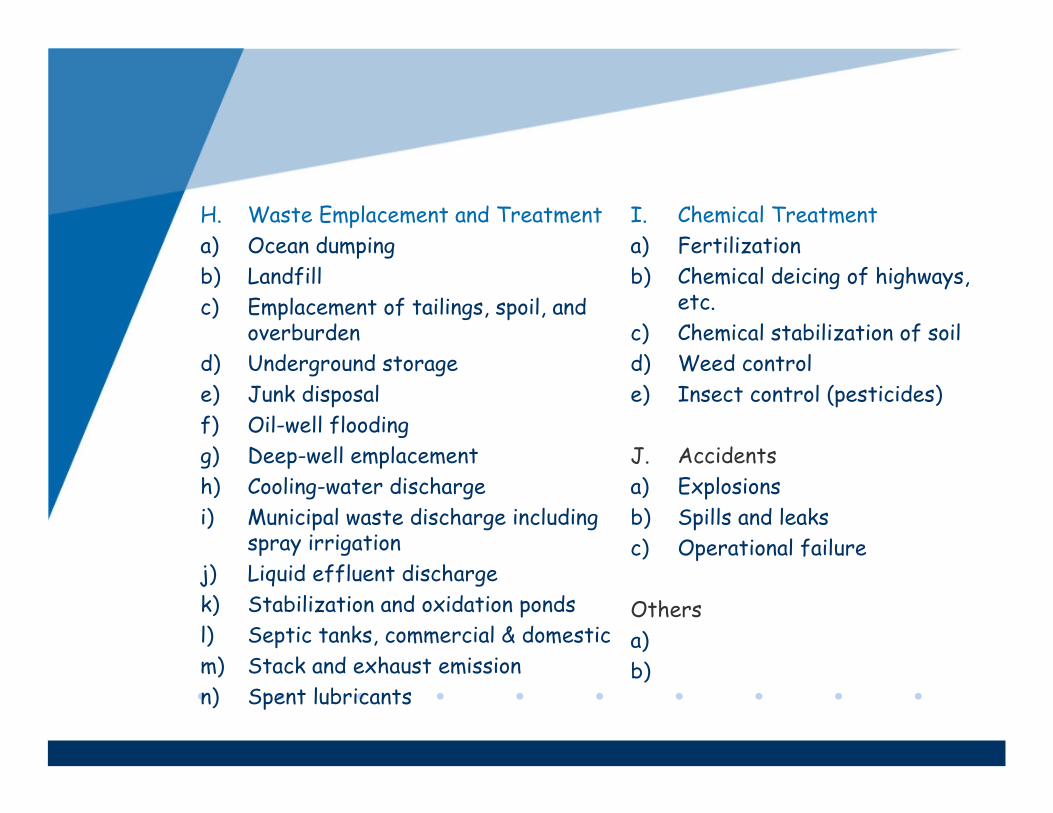
H. Waste Emplacement and Treatment
a) Ocean dumping
b) Landfill
c) Emplacement of tailings, spoil, and overburden
d) Underground storage
e) Junk disposal
f) Oil-well flooding
g) Deep-well emplacement
h) Cooling-water discharge
i) Municipal waste discharge including spray irrigation
j) Liquid effluent discharge
k) Stabilization and oxidation ponds
l) Septic tanks, commercial & domestic
m) Stack and exhaust emission
n) Spent lubricants
I. Chemical Treatment
a) Fertilization
b) Chemical deicing of highways, etc.
c) Chemical stabilization of soil
d) Weed control
e) Insect control (pesticides)
J. Accidents
a) Explosions
b) Spills and leaks
c) Operational failure
Others
a)
b)
Leopold matrix

Matrices
� Magnitude matrix
� Time dependent matrix
� Weighted matrix

Advantages of matrices
� Easily modified, so many varieties have been developed and used
� Relationships between development and environment made explicit
� Can present a summary of anticipated impacts in an easily understood format
� Can also be useful in scoping
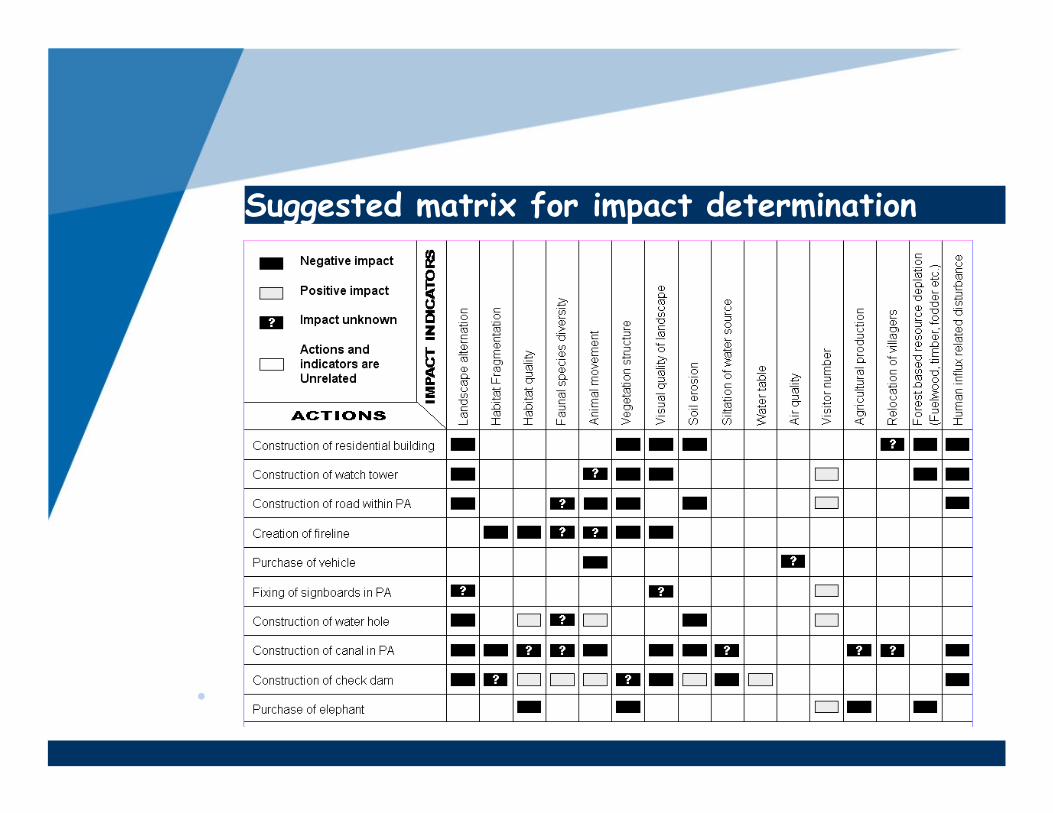
Suggested matrix for impact determination

Disadvantages of matrices
� Fail to identify potential secondary or tertiary impacts
� May not provide an objective method for comparing impact magnitudes or importance
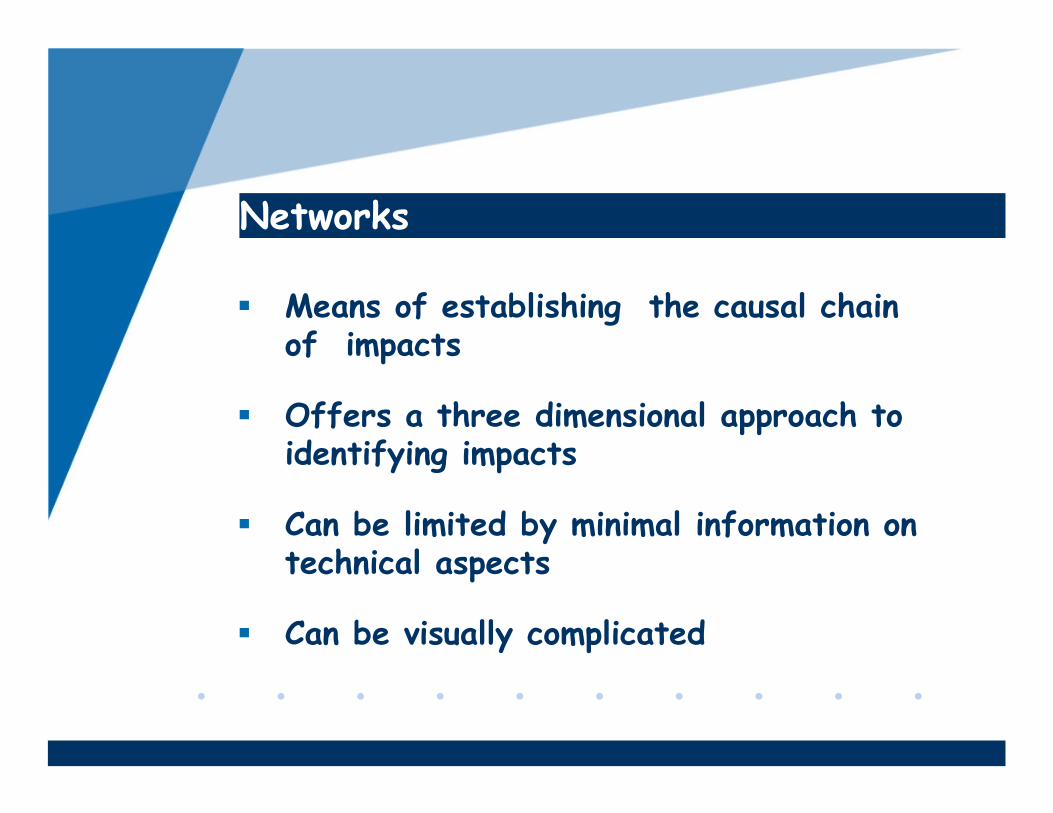
Networks
� Means of establishing the causal chain of impacts
� Offers a three dimensional approach to identifying impacts
� Can be limited by minimal information on technical aspects
� Can be visually complicated

Project ActivitiesPrimary Secondary Tertiary
Components of Activities
Impacts
Conceptual model of impact
networks.
Networks – High order linkages between causes and effects
Causal fa
cto
rs
Sew
age s
yste
m
Macadam
ized s
urf
aces
Excavation
Tre
e r
em
oval
Uses High-
density
apartments
Play areas
Parking areas
Removal of
topsoil
Pollution of
ground-water
Increased
surface runoff
Initial
conditions
Decreased
fertility
Degradation of
water-supply
Flooding
Death
of flora
Health
hazard
Gullying
+ erosion
Possible adverse impacts
Consequent
conditions
Third
order
effects
Landscape
gardening
Planting of
shrubs
Building
code
Corrective
actionsControl
mechanisms
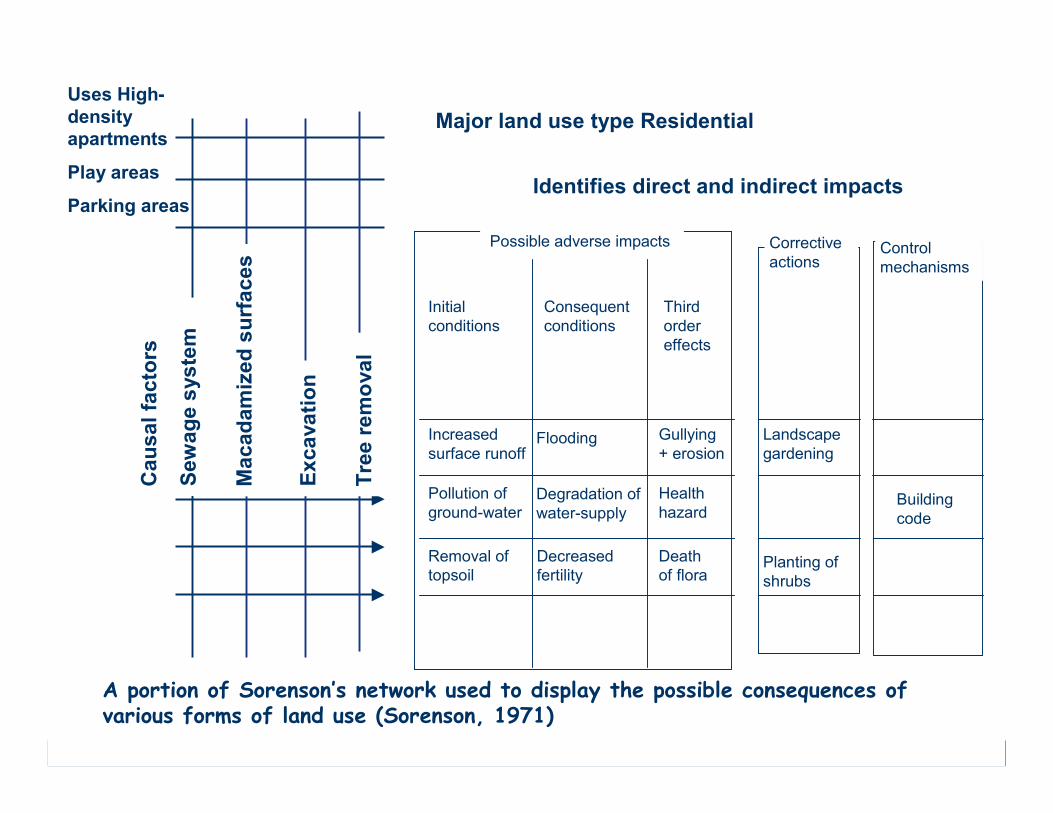
A portion of Sorenson’s network used to display the possible consequences of various forms of land use (Sorenson, 1971)
Major land use type Residential
Identifies direct and indirect impacts
Deforestation & Loss of Biodiversity
Selective Cutting of trees for
Curio Wood
Demand for
Curios Increased
Erosion of Gorge
Access Paths
More Rafting
Licenses
River Bank Erosion
Water
Pollution
Wave
Effects
Riparian Vegetation
Reduced
River Bank & Island
Development
More Jetties &
Boat Licenses
Overgrazing Around
Water Holes
Loss of Habitat
CHANGING QUALITY OF LIFE FOR WILDLIFE
Oily discharges
from boats etc.
Increased Incidents
between Wildlife & People
Changes in
Animal Behaviour
Too small an area for animal numbers
Constriction of wildlife
movements
More Fences/
Enclosures
Expansion of Hotels/Camps
& Tourist Facilities
Increased Visitor Numbers
Visual
Impacts
Loss of Natural
Wilderness Value
Harassment
of wildlife
Disturbance of wildlife
Increasing noise levels
More Aircraft Flying Over
Falls & Town
More
Motor Vehicles
New Road & Bridge
CHANGING QUALITY OF TOURISM
Demand for Low-spending
Tourism Increases
More Direct
International Flights
Airport Upgrading
Improved Border
Facilities
Increased customs co-operation
Improved Road Links
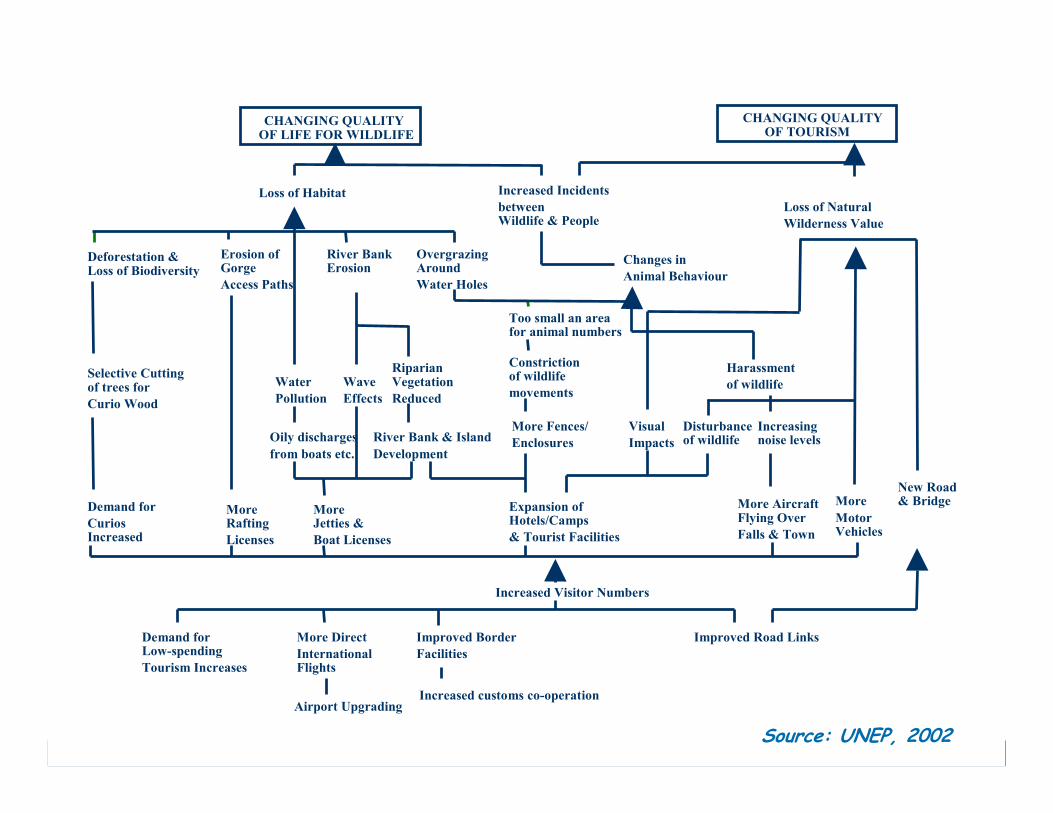
Source: UNEP, 2002
Fisheries Water quality
Fish
Aquatic
macrophyte
Dissolved
oxygenAlgae
Nitrogen and phosphorus
concentration in water
Vegetation
buffer
Soil
Reduction in
fertilizer application
Application of
inorganic fertilizer
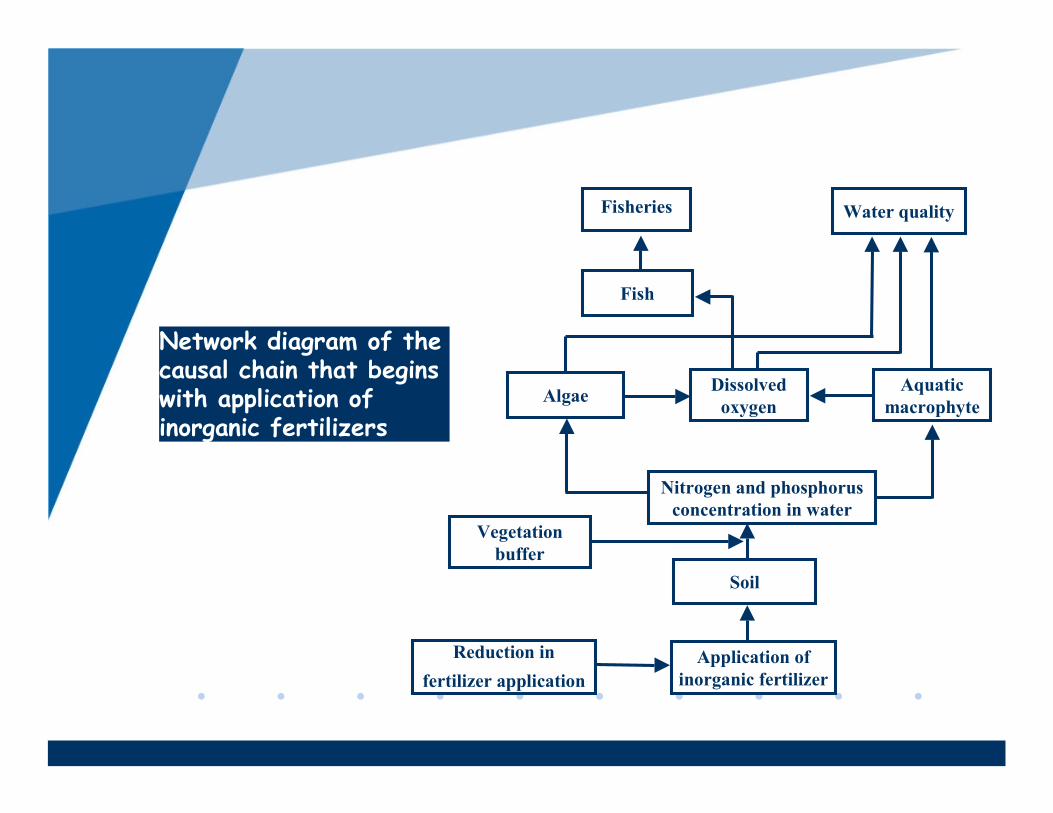
Network diagram of the causal chain that begins with application of inorganic fertilizers
Composite
Ecological sites
Historic sites
Visual
Health
Settlements
Noise
Severance
Water
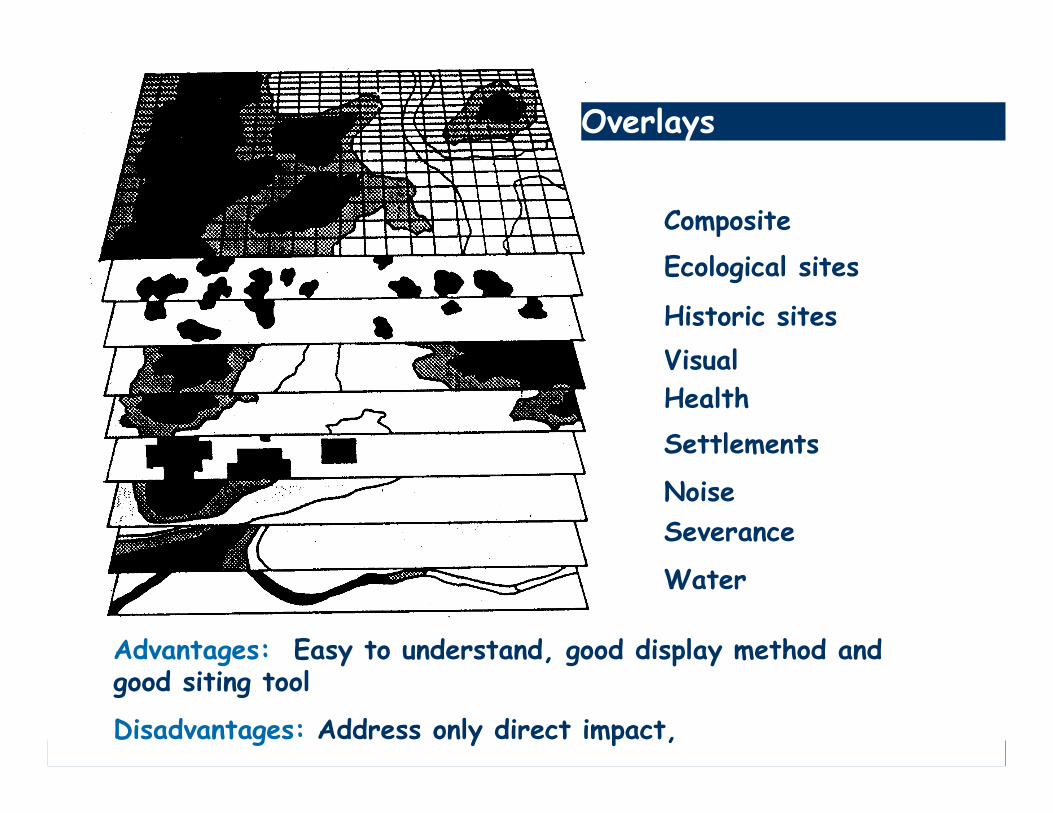
Overlays
Advantages: Easy to understand, good display method and good siting tool
Disadvantages: Address only direct impact,

Schematic representation of Map Overlay procedures that enable delineation of most preferred road alignment (Route A) option to avoid sensitive habitats (core area of Tiger Reserve shown in grey scale) and sites of animal distribution (represented by dots)

Benefits of overlays
� Conceptually simple
� Provide clear presentation
� Highly versatile
� Appropriate for assessing impacts occurring on large areas (impacts of hydropower project on regional hydrology, landscape level impacts)
� Can predict geographical location of impacts
� Very useful in developing site for alternatives
Limitations
� Setting boundaries of certain parameters is difficult leading to distorted information

0 102 4 6 8
NET IMPACT
Predicted Condition
Without Project
Predicted Condition With
Project10
20
30
40
50
60
70
80
90
100
Target Years
Habitat U
nits
Habitat Suitability Index Models
Methods of analysis of impacts
� Professional judgement
� Quantitative mathematical models
� Experiments, indices and models
� Case studies

Soundness of predictions based on professional judgement
� Emission of gases from stacks were expected to have deleterious
effects on plant life
� The impact on the aquatic system was expected to be small
� The water fluctuation resulting from the project may seriously
affect nesting and feeding grounds of water birds
� Amphibians and reptiles inhabiting wetland areas would be
adversely affected by Narmada Project
� Terrestrial fauna were expected to be negatively affected
through direct loss of habitat to submergence
� Pipeline along the Great Indian Bustard habitat will have serious
impact on GIB breeding

Determine impact significance
� Evolve criteria for assessing impact characteristics
Criteria for identifying impact significance
� Duration of project related actions
� Location of project site
� Urgency and quickness with which the natural systems might deteriorate
� Degree of irreversible damage to natural resource base and resource quality

Ecological significance criteria
� Reduction in species
� Habitat depletion or fragmentation
� Threatened, rare and endangered species
� Impairment of ecological function� Disruption of food chain
� Decline in species population
� Alteration in predator-prey relationship
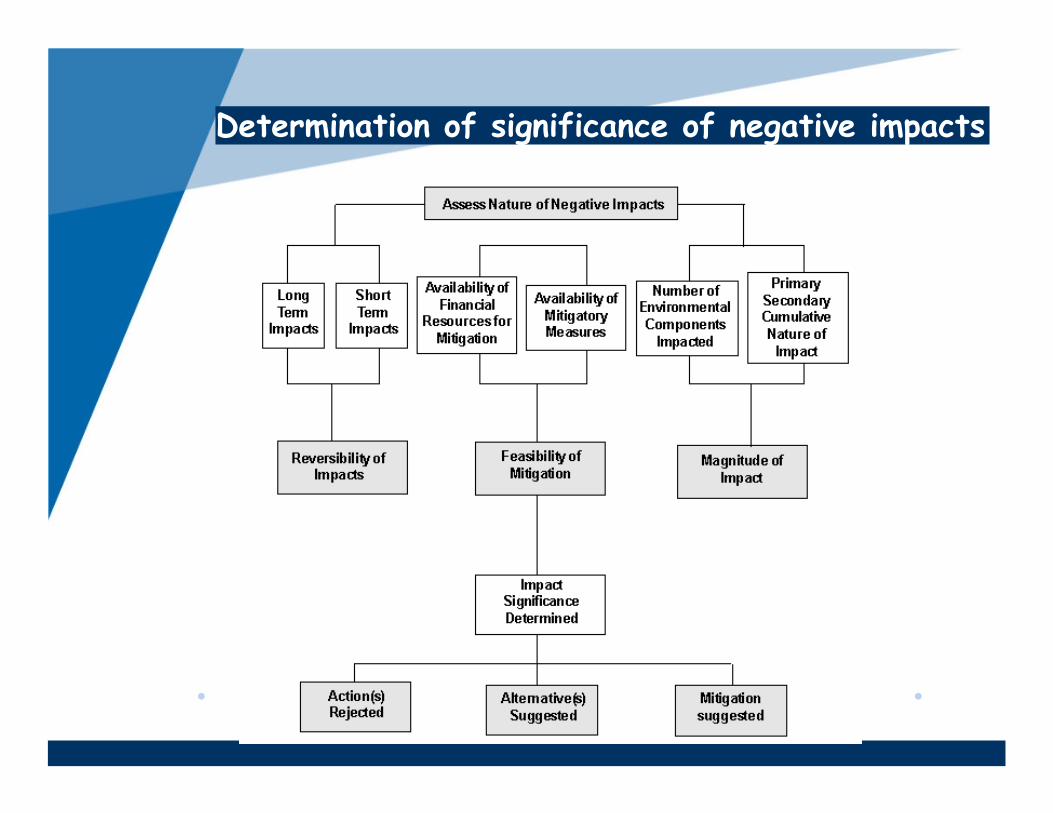
Determination of significance of negative impacts
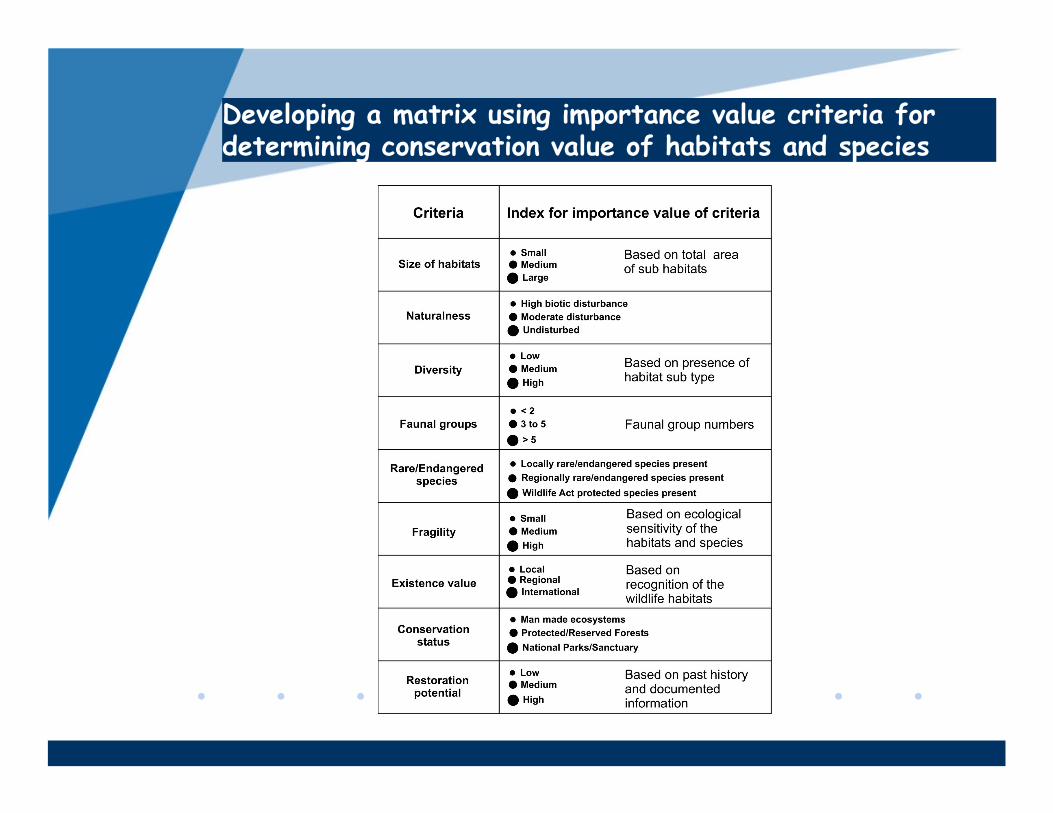
Developing a matrix using importance value criteria for determining conservation value of habitats and species

Scaling impact assessment
Adding dimensions to impacts
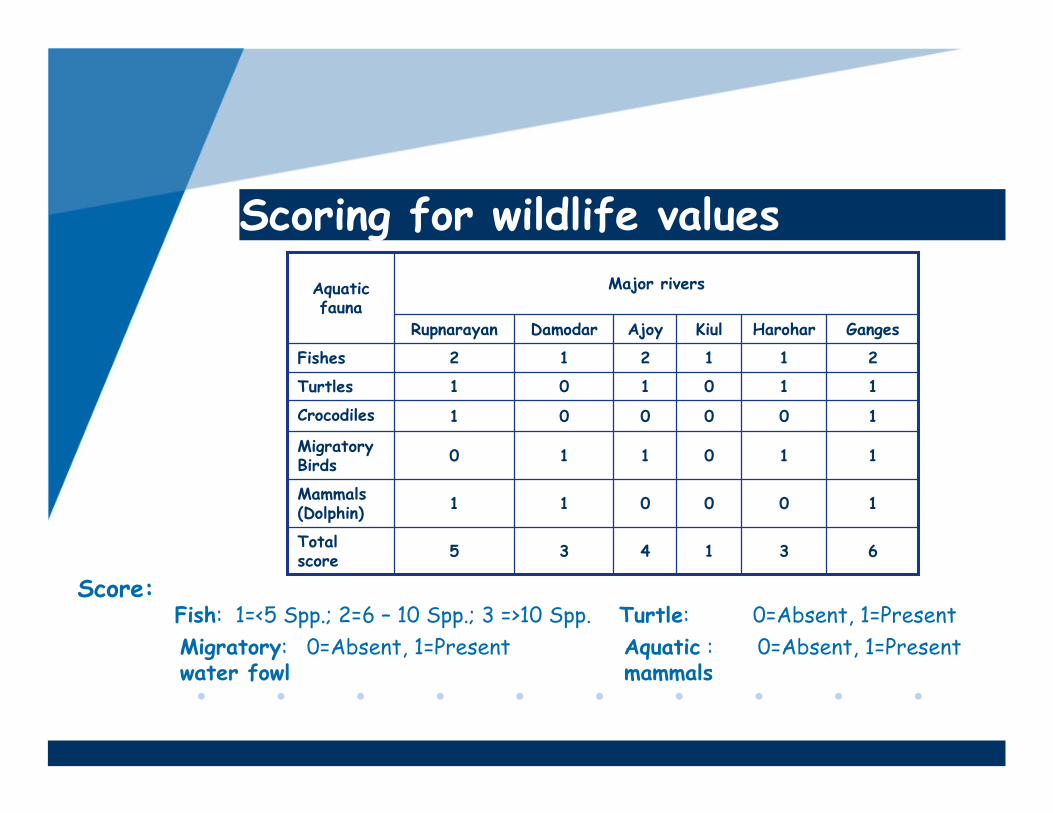
631435Total score
100011Mammals (Dolphin)
110110Migratory Birds
100001Crocodiles
110101Turtles
211212Fishes
GangesHaroharKiulAjoyDamodarRupnarayan
Major riversAquatic fauna
Score:Fish: 1=<5 Spp.; 2=6 – 10 Spp.; 3 =>10 Spp. Turtle: 0=Absent, 1=Present
Migratory: 0=Absent, 1=Presentwater fowl
Aquatic : 0=Absent, 1=Presentmammals
Scoring for wildlife values

27611311124163225Total
2
5
5
5
10
2
1
1
1
1
1
5
0
5*
0
1
1
0
1
0
1
0
0
0
0
1
0
0
0
0
2
5
0
5
0
2
1
0
1
0
1
0
0
5
10
1
0
0
1
1
2
5
5
0
10
2
1
1
0
1
0
5
5
5
10
Fishes
Turtles
Crocodiles
Migratory waterfowl
Aquatic mammal (Dolphin)
Wild-life value with CSF
Wild-life value score
Wild-life value with CSF
Wild-life value score
Wild-life value with CSF
Wild-life value score
Wild-life value with CSF
Wild-life value score
Wild-life value with CSF
Wild-life value score
Wild-life value with CSF
Wild-life value score
GangesHaroharKiulAjoyDamodarRupnarayanCSF values
Faunal groups
* Baer's pochard sighting
Scale for conservation significance

Dimensions of disturbances

Dimensions of impact
Impact prediction is ultimately dependent on
� Probability of risk
� Predictability of an event or a trend

Predicting impacts on biodiversity is difficult but not impossible!
Recommended