BIOCHEMICAL MEDlCINE 6, 504-507 ( 1972)
Microestimation of Tryptophan in Plasma
by a Fluorometric Procedure
C. H. WILLIAMS, D. J. KING, AND J. CAIRNS
Department of Mental Health, Queen’s University, Belfast, N. Ireland
Received January 11, 1972
Many indoles can be assayed fluorimetrically either by measurement of their native fluorescence or by conversion to a suitable derivative, e.g., a norharman in the case of tryptamine and tryptophan ( 1, 2). For tryptophan the latter method has two main advantages over measure- ment of native fluorescence; first, separation between excitation and emission maxima is great enough for simple filter instruments to be used, and second, it possesses a much greater sensitivity. Furthemrore, the excitation wavelength is in the visible region, whereas native fluorescence is measured in the ultraviolet region.
It was the high sensitivity which prompted us to adapt the norhaman method for use on a small-scale to measure tryptophan in blood plasma in a clinical study which necessitated withdrawal of several blood samples in an 8-hour period. The method described, which can be applied to as little as 10 ~1 plasma, minimizes the inconvenience of repeated venu- punctures.
MATERIALS AND METHODS
All reagents were of “Analar” quality or the highest grade available. Water was triple-distilled, the final distillation being from an all glass apparatus. Glassware was routinely washed in chromic acid followed by washing with water, with final rinsings in triple-distilled water.
The method was basically that described by Hess and Udenfriend for tryptamine (2). Blood was sampled from the thumb by puncture with a blood lancet followed by collection by capillarity into an 80-~1 heparinized capillary tube ( Radiometer, Copenhagen). The blood was mixed using a magnet to pass a small “flea” several times along the tube. The ‘flea” was removed prior to sealing one end of the tube with Plasticine and centrifuging for 15 minutes at 1OOOg. Plasma was collected
504 Copyright @ 1972 by Academic Press, Inc. All rights of reproduction in any form reserved.
hlICROESTIMATION OF TRYPTOPHAN 505
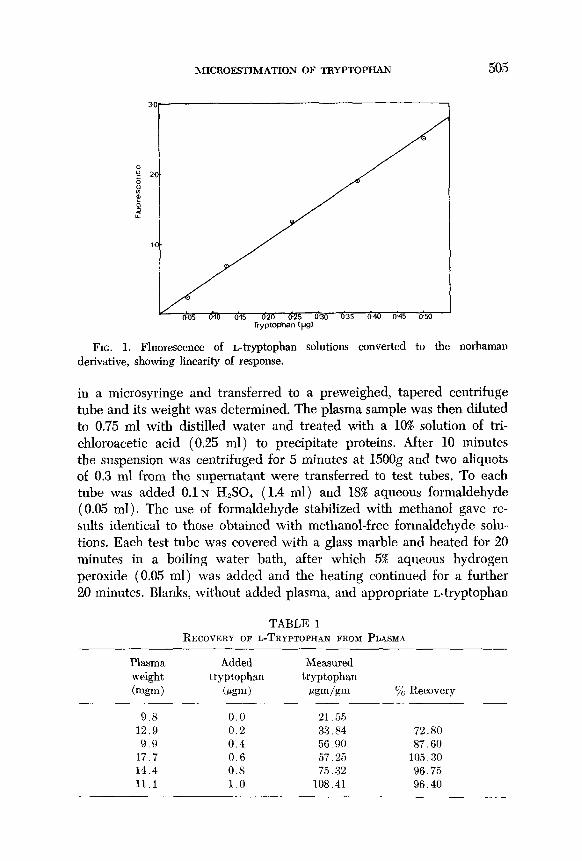
FIG. 1. Fluorescence of L-tryptophan solutions converted to the norhaman derivative, showing linearity of response.
in a microsyringe and transferred to a preweighed, tapered centrifuge tube and its weight was determined. The plasma sample was then diluted to 0.75 ml with distilled water and treated with a 10% solution of tri- chloroacetic acid (0.25 ml) to precipitate proteins. After 10 minutes the suspension was centrifuged for 5 minutes at 15OOg and two aliquots of 0.3 ml from the supernatant were transferred to test tubes. To each tube was added 0.1 N H&SO, (1.4 ml) and 18% aqueous formaldehyde (0.05 ml). The use of formaldehyde stabilized with methanol gave re- sults identical to those obtained with methanol-free formaldehyde solu- tions. Each test tube was covered with a glass marble and heated for 20 minutes in a boiling water bath, after which 5% aqueous hydrogen peroxide (0.05 ml) was added and the heating continued for a further 20 minutes. Blanks, without added plasma, and appropriate L-tryptophan
TABLE 1 RECOVERY OF L-TRYPTOPHAN FROM PLASMA
Plasma weight
!mgm)
Added tryptophan
km)
Measured tryptophan
iwdgm 70 Recovery
9.8 0.0 21.55 12.9 0.2 33.84 72.80
9.9 0.4 56.90 87.60 17.7 0.6 57.25 105.30 14.4 0.S 75.32 96.75 11.1 1.0 108.41 96.40
506 WILLIAMS, KING, AND CAIRNS
standards, which were made up freshly each day, were carried through the whole procedure. After cooling to room temperature the fluorescence of the solutions was measured in a Farrand photoelectric fluorometer (Model A3) using the following filters: Excitation: Coming CS 7/37,
( hnax = 360 nm), and Emission: Coming CS 5/74, (x,, = 435 nm). Standard tryptophan solutions were used to set full-scale deflection and all readings were corrected for the blank value. The fluorophore gave a linear response over the range of values encountered (Fig. 1).
:bI
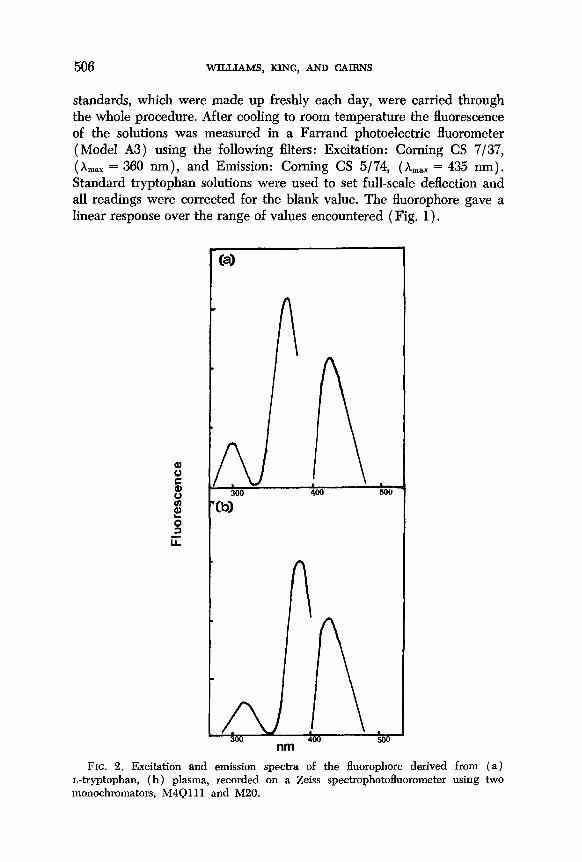
FIG. 2. Excitation and emission spectra of the fluorophore derived from (a) L-tryptophan, (b ) plasma, recorded on a Zeiss spectrophotofluorometer using two monochromators, M4Qlll and M20.
MICROESTIMATION OF TRYPTOPHAN 507
RESULTS AND DISCUSSION
Serial determinations, in duplicate, of 10-15 ~1 samples from a single plasma gave a mean value of 16.75 pgm/gm (SD + 0.78, DF = 6, coefficient of variation 4.6%). The seven values obtained from this sample were 17.48, 17.47, 15.60, 17.26, 16.47, 17.12, and 15.87 pgm/gm. Blank values were never more than 10% of the full-scale deflection given by a standard solution containing 0.5 pgrn of L-tryptophan. Recoveries were assessed by the addition of varying amounts of L-tryptophan to known weights of plasma and on the average were just over 90% ( see Table 1) .
Certain simple precautions are necessary in order to ensure reliability. For example, it was found essential to carry out the assay in a room separate from the main laboratory as nonspecific contamination was occasionally troublesome, although this was not apparent in measure- ments on a larger scale. The washing of glassware as described is also advisable. Improved reproducibility was obtained if the operator wore disposable plastic gloves, though we have not ascertained whether this was due to reduced contamination from amino acids on the skin. Separa- tion of red cells from plasma, and subsequent precipitation of protein are best carried out as soon as possible after collection of blood; storage of plasma leads to loss of tryptophan (3).
It is useful to make duplicate determinations, and it was found that 60-70 ~1 blood gave sufficient plasma for two aliquots to be taken. The weighing of plasma, although slightly more time-consuming than measuring the volume, gave greater consistency between samples of the same blood. Conversion of the values obtained to a weight/volume figure is simply made by multiplication by 1.026, the mean specific gravity of plasma (4).
Excitation and emission spectra of the fluorophore from both plasma and L-tryptophan were almost identical (Fig. 2). The separation of excitation and emission maxima is such that the filters used, which have a fairly narrow transmission spectrum, gave no overlap.
ACKNOWLEDGMENTS
This work was carried out during the tenure by one of us (D.J.K.) of the Mental Health Research Fund Andy Darlington Memorial Fellowship. We also thank Professor A. G. Lloyd for the provision of the laboratory facilities and equip- ment in the Department of Biochemistry, Queen’s University, Belfast.
REFERENCES
1. UDENFREND, S., in “Fluorescence Assay in Biology and Medicine” p. 160. Academic Press, London, 1Q62.
2. HESS, S. M., AND UDENFRIEND, S., J. Phamnacol. Ezxp. Ther. 127, 175 (1959). 3. CARSON, N., personal communication. 4. HAWK, P. B., OSER, B. L., AND SUMMERSON, W. H., in “Practical Physiological
Chemistry” J. and A. Churchill, London, 1951.
Recommended