MicroRNAs reinforce repression of PRC2 transcriptional targets
independently and through a feed-forward regulatory network with PRC2
Haridha Shivram, Steven V. Le and Vishwanath R. Iyer
Center for Systems and Synthetic Biology, Institute for Cellular and Molecular
Biology, Department of Molecular Biosciences, University of Texas at Austin,
Austin, Texas 78712, United States of America
Correspondence should be addressed to: V. R. I. ([email protected])
Keywords: EZH2; Polycomb repressive complex (PRC2); microRNA; AGO2;
Sleeping Beauty transposon system; Vaccinia virus; VP55; RNA-binding; feed-
forward; regulatory network; iCLIP; epigenetics
Running title: Coordinated regulation by miRNAs and PRC2
Abbreviations
PRC2, Polycomb repressive complex 2; TF, transcription factor; iCLIP, individual
crosslinking and immunoprecipitation; UTR, untranslated region; RISC, RNA-
induced silencing complex; Dox, doxycycline mESCs, mouse embryonic stem
cells; GBM, Glioblastoma multiforme; TSS, Transcription start site(s).
(which was not peer-reviewed) is the author/funder. All rights reserved. No reuse allowed without permission. The copyright holder for this preprint. http://dx.doi.org/10.1101/298919doi: bioRxiv preprint first posted online Apr. 11, 2018;

2
Abstract
Gene expression can be regulated at multiple levels, but it is not known if and how
there is broad coordination between regulation at the transcriptional and post-
transcriptional levels. Transcription factors and chromatin regulate gene
expression transcriptionally, while microRNAs (miRNAs) are small regulatory
RNAs that function post-transcriptionally. Systematically identifying the post-
transcriptional targets of miRNAs and the mechanism of transcriptional regulation
of the same targets can shed light on regulatory networks connecting
transcriptional and post-transcriptional control. We used iCLIP (individual
crosslinking and immunoprecipitation) for the RISC (RNA-induced silencing
complex) component AGO2 and global miRNA depletion to identify genes directly
targeted by miRNAs. We found that PRC2 (Polycomb repressive complex 2) and
its associated histone mark, H3K27me3, is enriched at hundreds of miRNA-
repressed genes. We show that these genes are directly repressed by PRC2 and
constitute a significant proportion of direct PRC2 targets. For just over half of the
genes co-repressed by PRC2 and miRNAs, PRC2 promotes their miRNA-
mediated repression by increasing expression of the miRNAs that are likely to
target them. miRNAs also repress the remainder of the PRC2 target genes, but
independently of PRC2. Thus, miRNAs post-transcriptionally reinforce silencing of
PRC2-repressed genes that are inefficiently repressed at the level of chromatin,
by either forming a feed-forward regulatory network with PRC2 or repressing them
independently of PRC2.
(which was not peer-reviewed) is the author/funder. All rights reserved. No reuse allowed without permission. The copyright holder for this preprint. http://dx.doi.org/10.1101/298919doi: bioRxiv preprint first posted online Apr. 11, 2018;

3
Introduction
Transcription factors (TFs) and miRNAs together form the largest components of
gene regulatory networks and can regulate gene expression through both distinct
and coordinated regulatory mechanisms. One of the ways in which TFs can
coordinate their regulatory impact with miRNAs is by forming a feed-forward
regulatory network. In such a network, a TF regulates a miRNA and both co-
regulate a common target. In a coherent feed-forward regulatory network, the
outcomes of both direct and indirect regulation by a TF are consistent. Many such
TF-miRNA feed-forward regulatory networks have been shown to functionally
impact several processes in development and disease (O'Donnell et al. 2005;
Hobert 2008; Tsang et al. 2007; Lin et al. 2015; Gerloff et al. 2014; Polioudakis et
al. 2013).
One potential function of coherent TF-miRNA feed-forward regulatory networks is
to reinforce transcriptional regulation at the post-transcriptional level. In particular,
this can help suppress residual transcripts produced from leaky transcription of
transcriptionally silenced genes. This is most crucial during switches in
transcriptional states in response to stress, developmental transitions, cell cycle
stages or other external stimuli (Farh et al. 2005; WU et al. 2015; del Rosario et al.
2016).
PRC2 is an epigenetic regulator complex that transcriptionally silences genes
through modification of histone H3 with tri-methylation at lysine 27 (H3K27me3).
PRC2 plays a critical role in maintaining the silenced state of genes involved in
(which was not peer-reviewed) is the author/funder. All rights reserved. No reuse allowed without permission. The copyright holder for this preprint. http://dx.doi.org/10.1101/298919doi: bioRxiv preprint first posted online Apr. 11, 2018;

4
development and several cancers (Aranda et al. 2015; Di Croce and Helin 2013).
In this study, our goal was to determine if the transcriptional regulation by PRC2
and post-transcriptional regulation by miRNAs occur through distinct or
coordinated mechanisms (Mote et al. 2017). To test this, we first identified
transcriptome-wide targets of miRNAs using AGO2 iCLIP and global knockdown
of miRNAs. We then identified genes under direct transcriptional repression of
PRC2 and asked if the same targets were post-transcriptionally repressed by
miRNAs. We show that miRNAs post-transcriptionally repress a significant number
of genes that are transcriptionally repressed by PRC2, both through mechanisms
independent of PRC2 and coordinately, by forming a feed-forward network with
PRC2. Overall, these findings point to a broad role of miRNAs where they
independently strengthen and also reinforce the silencing of PRC2-repressed
genes post-transcriptionally.
Results
Transcriptome-wide identification of miRNA targets
miRNAs primarily target mRNAs through interactions between their 5’ seed region
and the 3’ untranslated region (3’ UTR) of the mRNA, mediated by the RNA-
induced silencing complex (RISC). To identify the transcriptome-wide targets of
miRNAs, we first performed RNA individual crosslinking and immunoprecipitation
(iCLIP) for the RISC component AGO2 in glioblastoma multiforme (GBM) cells
(König et al. 2010). Several observations indicate that the AGO2-RNA interactions
we identified using iCLIP were direct and specific. First, AGO2-RNA complexes
were crosslinking- and RNase-treatment-specific (Fig. 1A). Second, reads from
(which was not peer-reviewed) is the author/funder. All rights reserved. No reuse allowed without permission. The copyright holder for this preprint. http://dx.doi.org/10.1101/298919doi: bioRxiv preprint first posted online Apr. 11, 2018;
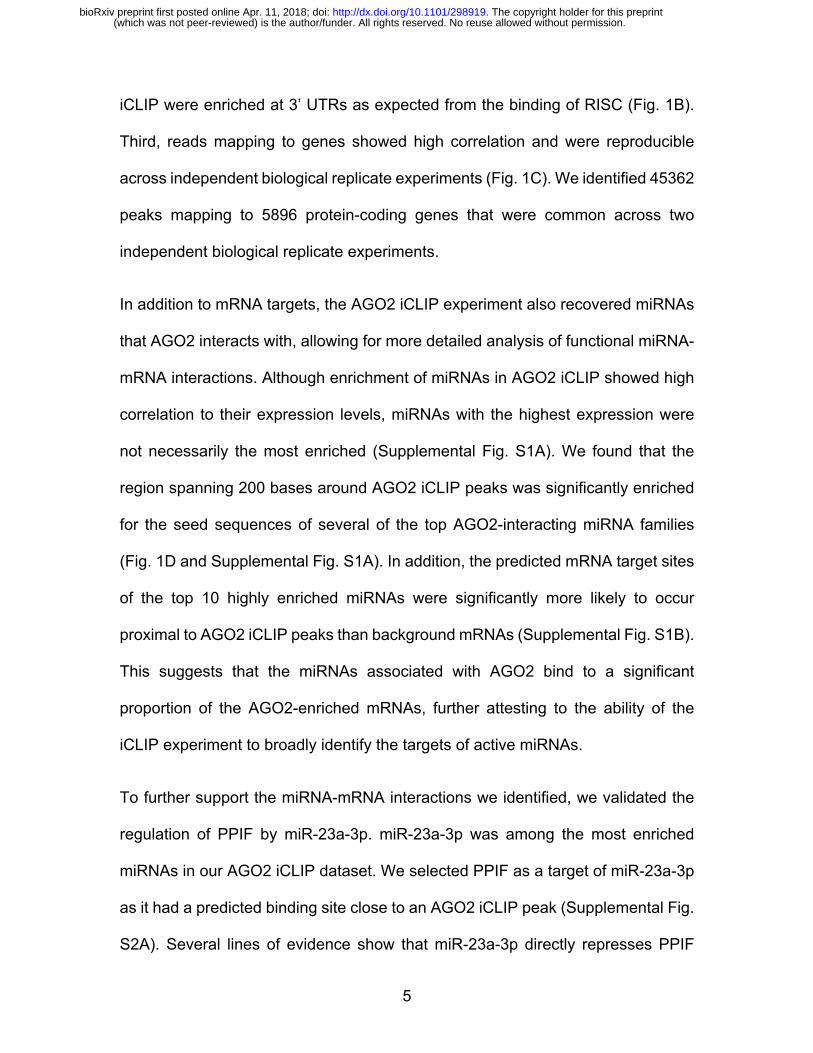
5
iCLIP were enriched at 3’ UTRs as expected from the binding of RISC (Fig. 1B).
Third, reads mapping to genes showed high correlation and were reproducible
across independent biological replicate experiments (Fig. 1C). We identified 45362
peaks mapping to 5896 protein-coding genes that were common across two
independent biological replicate experiments.
In addition to mRNA targets, the AGO2 iCLIP experiment also recovered miRNAs
that AGO2 interacts with, allowing for more detailed analysis of functional miRNA-
mRNA interactions. Although enrichment of miRNAs in AGO2 iCLIP showed high
correlation to their expression levels, miRNAs with the highest expression were
not necessarily the most enriched (Supplemental Fig. S1A). We found that the
region spanning 200 bases around AGO2 iCLIP peaks was significantly enriched
for the seed sequences of several of the top AGO2-interacting miRNA families
(Fig. 1D and Supplemental Fig. S1A). In addition, the predicted mRNA target sites
of the top 10 highly enriched miRNAs were significantly more likely to occur
proximal to AGO2 iCLIP peaks than background mRNAs (Supplemental Fig. S1B).
This suggests that the miRNAs associated with AGO2 bind to a significant
proportion of the AGO2-enriched mRNAs, further attesting to the ability of the
iCLIP experiment to broadly identify the targets of active miRNAs.
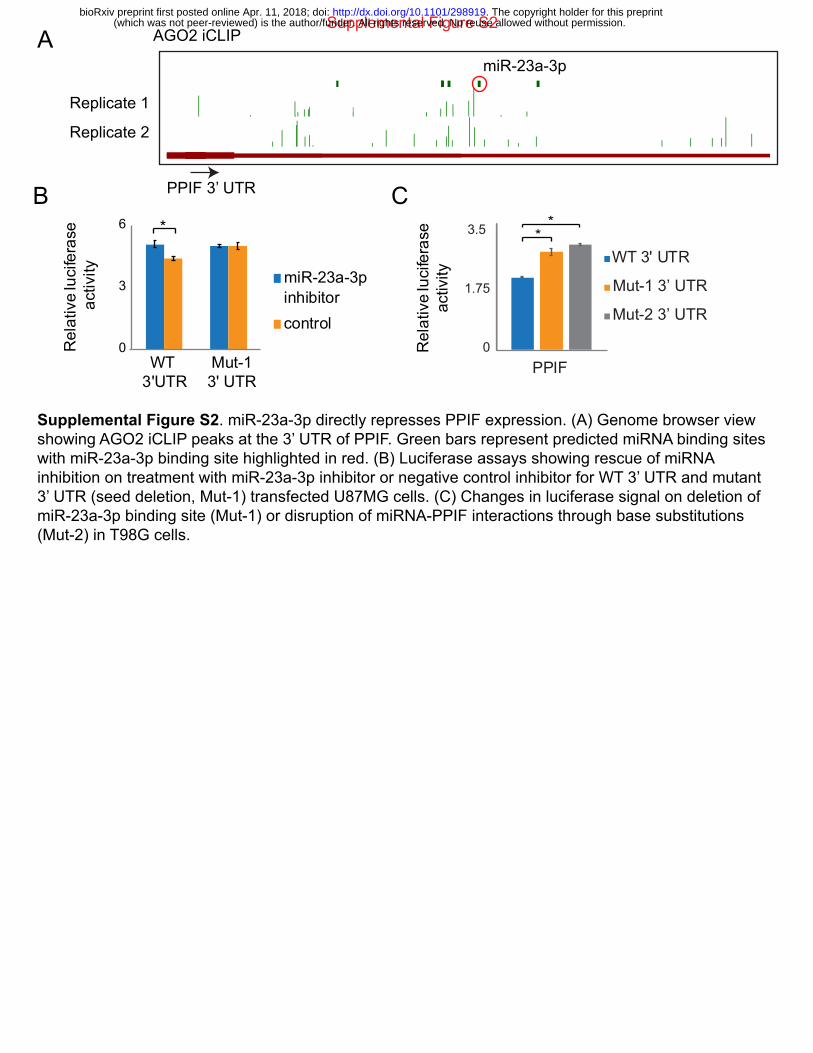
To further support the miRNA-mRNA interactions we identified, we validated the
regulation of PPIF by miR-23a-3p. miR-23a-3p was among the most enriched
miRNAs in our AGO2 iCLIP dataset. We selected PPIF as a target of miR-23a-3p
as it had a predicted binding site close to an AGO2 iCLIP peak (Supplemental Fig.
S2A). Several lines of evidence show that miR-23a-3p directly represses PPIF
(which was not peer-reviewed) is the author/funder. All rights reserved. No reuse allowed without permission. The copyright holder for this preprint. http://dx.doi.org/10.1101/298919doi: bioRxiv preprint first posted online Apr. 11, 2018;

6
expression. First, treatment of cells with an inhibitor of miR-23a-3p led to an
induction of both PPIF transcript and protein levels (Fig. 1E,F). Second, we
checked if the repression of PPIF was through a direct interaction between the 3’
UTR of PPIF and the miR-23a-3p seed region. We performed luciferase reporter
assays where we cloned the 3’ UTR of PPIF and compared luciferase expression
to constructs that were mutated at the sites of interaction. We found that the effect
of inhibitor treatment on regulation of the PPIF 3’ UTR was abolished upon deletion
of the miR-23a-3p binding sites (Supplemental Fig. S2B). Third, both deletion of
the miRNA binding sites and disruption of miRNA-mRNA interactions through base
substitutions led to a similar rescue in luciferase activity (Supplemental Fig. S2C).
miRNA-repressed genes are enriched for PRC2 binding and
H3K27me3
Although AGO2 iCLIP identified all the interaction targets of RISC, the AGO2-RISC
complex can regulate gene expression in both a miRNA-dependent and
independent manner (Leung et al. 2011). To specifically identify miRNA-
dependent genes, we adopted a strategy to globally deplete miRNAs, followed by
expression profiling. Ectopic overexpression of the Vaccinia Virus protein VP55
has been previously shown to polyadenylate and degrade miRNAs, causing a
global loss of miRNAs (Backes et al. 2012; Aguado et al. 2015). We cloned VP55
into a Sleeping Beauty transposon system under a doxycycline-inducible promoter
and stably integrated this construct into T98G cells to generate a GBM cell line
capable of doxycycline-responsive loss of miRNAs (Kowarz et al. 2015). miR-21,
the most abundant miRNA in these cells, was almost completely depleted within
(which was not peer-reviewed) is the author/funder. All rights reserved. No reuse allowed without permission. The copyright holder for this preprint. http://dx.doi.org/10.1101/298919doi: bioRxiv preprint first posted online Apr. 11, 2018;

7
24 hours of doxycycline treatment (Fig. 2A). PCR-amplified cDNA libraries prior to
size-selection for miRNA-seq showed a significant depletion of miRNAs
(Supplemental Fig. S3A). miRNA-seq showed a global depletion of approximately
90% of all cellular miRNAs (Fig. 2B). To identify the genes regulated by miRNAs
genome-wide, we performed mRNA-seq from doxycycline treated (+ Dox) and
untreated cells (- Dox). 3844 protein-coding transcripts were up-regulated and thus
repressed by miRNAs, and 3668 transcripts were down-regulated upon loss of
miRNAs (Supplemental Fig. S3B). Some of the most strongly miRNA-repressed
genes included several genes from the histone gene family. This is consistent with
VP55-responsive genes identified previously in HEK293T cells (Aguado et al.
2015).
37% of the miRNA-repressed transcripts interacted directly with AGO2 based on
iCLIP, suggesting that these were direct functional targets of miRNAs. Thus,
miRNA-repressed genes include direct as well as indirect targets which could be
regulated at the level of transcription (Gosline et al. 2016). To check if the miRNA-
repressed genes were also regulated by specific transcription factors, we checked
for the enrichment of TF binding sites proximal to their promoters. We used Enrichr
to detect TF regulatory signatures in the ranked list of miRNA-repressed genes
(Chen et al. 2013). Surprisingly, we found an enrichment for H3K27me3 (Fig. 2C)
and a corresponding enrichment for SUZ12, a member of the PRC2 complex which
adds H3K27me3 (Fig. 2D), at miRNA-repressed genes. This suggested the
possibility that many miRNA-repressed genes could additionally be regulated at
the level of chromatin by PRC2 and H3K27 methylation. To ascertain whether
(which was not peer-reviewed) is the author/funder. All rights reserved. No reuse allowed without permission. The copyright holder for this preprint. http://dx.doi.org/10.1101/298919doi: bioRxiv preprint first posted online Apr. 11, 2018;
8
PRC2 does in fact bind to miRNA-repressed genes and deposit H3K27me3 at
miRNA-repressed genes, we performed ChIP-seq for EZH2, the catalytic
component of PRC2, as well as for H3K27me3. The level of H3K27me3 positively
correlated with that of EZH2 binding at genes containing an EZH2 peak
(Supplemental Fig. S4). Consistent with the Enrichr analysis, we found EZH2
binding at more than a thousand miRNA-repressed genes (27% of all miRNA-
repressed genes, Fig. 2E). To determine if this could be a general mode of dual
regulatory control in other cell types, we analyzed data from mouse embryonic
stem cells (mESCs) with a knockout of the miRNA-processing factor DICER, which
also results in loss of miRNAs (Zheng et al. 2014). Similar to GBM cells, we found
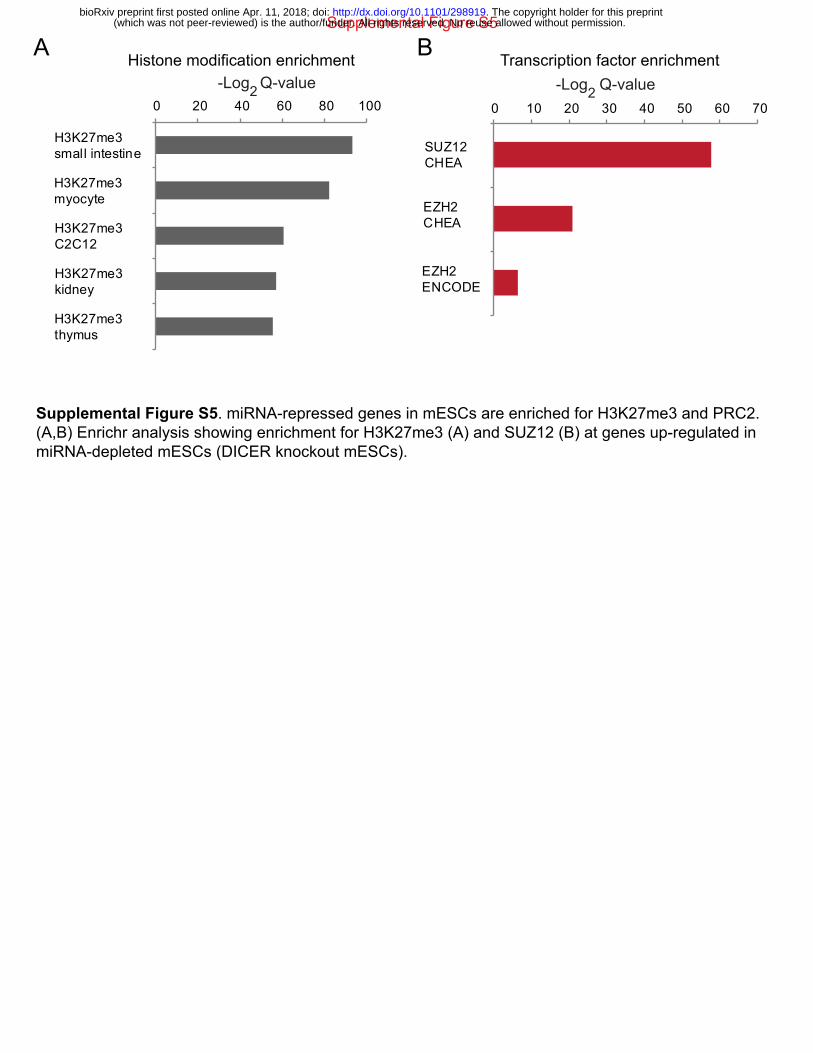
that genes repressed by miRNAs in mESCs also showed enrichment for
H3K27me3 and PRC2 (Supplemental Fig. S5A,B).
miRNAs repress hundreds of genes directly repressed by PRC2
Based on the above results, we hypothesized that many genes that are post-
transcriptionally repressed by miRNAs are also transcriptionally repressed by
PRC2. To test this hypothesis, we generated a CRISPR-Cas9 knockout of EZH2
in GBM cells. H3K27me3 levels, as well as levels of SUZ12, were reduced in EZH2
-/- cells, signifying loss of the PRC2 complex (Supplemental Fig. S6A) (Pasini et
al. 2004). 1519 protein-coding genes were down-regulated and 1834 protein-
coding genes were up-regulated (derepressed) upon loss of EZH2 (Fig. 3A).
Genes derepressed upon loss of EZH2 (EZH2-repressed genes) showed EZH2
binding and H3K27me3 (Fig. 3B and Supplemental Fig. S6B). Consistent with
previous studies, EZH2-repressed genes also showed occupancy by H3K4me3
(which was not peer-reviewed) is the author/funder. All rights reserved. No reuse allowed without permission. The copyright holder for this preprint. http://dx.doi.org/10.1101/298919doi: bioRxiv preprint first posted online Apr. 11, 2018;

9
(Fig. 3B and Supplemental Fig. S6B), although the enrichment for EZH2 and
H3K27me3 was anti-correlated with H3K4me3 (Fig. 3C) (Jadhav et al. 2016; Abou
El Hassan et al. 2015). 959 of the 1834 EZH2-repressed genes had an EZH2
chromatin peak close to their transcription start site (TSS) and were thus likely
directly repressed by EZH2.
We then checked if the miRNA-repressed genes bound by EZH2 (shown in Fig.
2E) were regulated by EZH2. Of these 1035 genes, 299 genes were significantly
regulated by EZH2, with 71% of them (213/299) being directly repressed (Fig. 3D).
These 213 genes that were jointly and directly repressed by EZH2 and by miRNAs
constituted 22% of all direct EZH2 targets. We verified derepression upon loss of
miRNAs or upon loss of EZH2 of multiple genes using qRT-PCR (Fig. 3E). A
significant proportion (34.7%) of genes co-repressed by EZH2 and miRNAs also
showed direct interaction with AGO2 by iCLIP (P = 2.9e-24, Fig. 3F and
Supplemental Fig. S6C). miRNAs thus post-transcriptionally reinforce
transcriptional repression by PRC2 of at least one-fifth of all PRC2 targets.
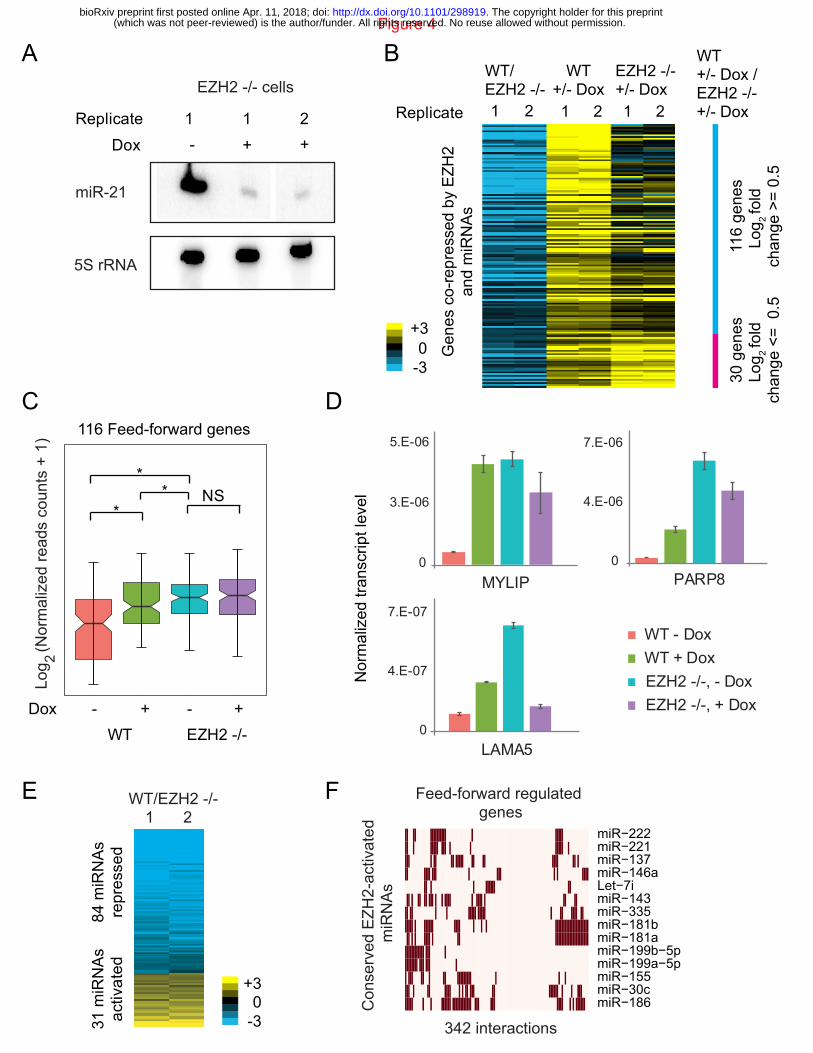
miRNAs repress PRC2 target genes through a feed-forward
regulatory network with PRC2
PRC2 and miRNAs were recently shown to independently co-repress endocytosis
genes in mESCs (Mote et al. 2017). To test if miRNAs and PRC2 repressed a
common set of genes independently in GBM cells, we depleted miRNAs globally
by overexpressing VP55 in EZH2 -/- T98G cells and performed miRNA-seq and
mRNA-seq. Most miRNAs were depleted within 24 hours of doxycycline treatment
(which was not peer-reviewed) is the author/funder. All rights reserved. No reuse allowed without permission. The copyright holder for this preprint. http://dx.doi.org/10.1101/298919doi: bioRxiv preprint first posted online Apr. 11, 2018;

10
(Fig. 4A and Supplemental Fig. S7A). Both WT and EZH2 -/- cells showed similar
responses to doxycycline treatment in terms of the number of miRNAs depleted
and the extent of depletion (Supplemental Fig. S7B), indicating that VP55
overexpression was equally effective in WT and EZH2 -/- cells. If miRNAs and
EZH2 repressed a common set of genes independently of one another, we would
expect that these co-repressed genes would be repressed by miRNAs even in the
absence of EZH2, and therefore show derepression upon miRNA depletion even
in EZH2 -/- cells. Of the 213 genes co-repressed by EZH2 and miRNAs, 54%
(116/213) showed significantly reduced derepression in response to miRNA
depletion in EZH2 -/- cells compared to WT cells (Fig. 4B), suggesting that PRC2
and miRNAs work coordinately, rather than independently, to repress these genes.
This coordination between PRC2 and miRNAs can be accounted for by a feed-
forward regulatory network where EZH2 promotes the miRNA-mediated
repression of a subset (54%) of its direct targets, by activating miRNAs that repress
those targets. Consistent with the heatmap (Fig. 4B), these feed-forward regulated
genes showed derepression in response to miRNA depletion in WT but not in
EZH2 -/- cells (Fig. 4C). We confirmed this finding by qRT-PCR for several genes
(Fig. 4D). Further analysis of this data helped rule out alternative explanations for
this behavior. One alternative explanation for the coordinated feed-forward
regulation we observed is that miRNAs somehow promote PRC2 function, perhaps
by promoting the binding of PRC2 to its repression targets (Graham et al. 2016).
However, closer analysis of our data does not support this possibility. First, if
miRNAs promoted PRC2 repressive function, derepression of miRNA targets
(which was not peer-reviewed) is the author/funder. All rights reserved. No reuse allowed without permission. The copyright holder for this preprint. http://dx.doi.org/10.1101/298919doi: bioRxiv preprint first posted online Apr. 11, 2018;

11
would be abolished in EZH2 -/- cells. Instead, 23% (27/116) of these genes
showed derepression even in EZH2 -/- cells, although significantly lower than in
WT cells (Supplemental Fig. S8). Second, if miRNAs promoted PRC2 repressive
function in addition to directly repressing feed-forward regulated genes,
derepression of those genes would be greater upon loss of miRNAs than upon
loss of PRC2 function. However, the expression levels of these genes were
significantly higher in EZH2 -/- cells than in WT cells depleted of miRNAs (Fig. 4
C,D). For these reasons, it is unlikely that the coordinate feed-forward regulation
entails miRNAs promoting PRC2 binding or repression activity at those genes.
Moreover, the impaired derepression upon miRNA depletion in the absence of
EZH2 is also not due to genes attaining maximally derepressed expression levels
in EZH2 -/- cells. The remaining 47% of the genes co-repressed by EZH2 and
miRNAs that were not part of the feed-forward network showed significant
derepression in response to miRNA loss both in WT and EZH2 -/- cells, indicating
that multiple levels of repression are detectable for genes that are not part of the
coordinated feed-forward regulatory network (Supplemental Fig. S9).
Our data thus suggests a model where PRC2 transcriptionally represses hundreds
of genes in GBM cells and for a significant fraction of these genes, it further
promotes additional repression by activating miRNAs that post-transcriptionally
repress those genes. To identify miRNAs regulated by PRC2, we performed
miRNA-seq in WT and EZH2 -/- cells and identified 31 miRNAs that were activated
and 84 miRNAs that were repressed by EZH2 (Fig. 4E). We found no EZH2 binding
(which was not peer-reviewed) is the author/funder. All rights reserved. No reuse allowed without permission. The copyright holder for this preprint. http://dx.doi.org/10.1101/298919doi: bioRxiv preprint first posted online Apr. 11, 2018;

12
to chromatin around the EZH2-activated miRNAs, suggesting that EZH2 activated
them indirectly.
To determine whether the feed-forward regulated genes as a group were likely to
be targeted by EZH2-activated miRNAs, we tested whether the number of
predicted interactions between them were higher than expected by random
chance. There were 342 unique interactions predicted between 14 EZH2-activated
miRNAs (conserved miRNAs with mRNA target predictions) and 85 of the 116
feed-forward regulated genes (Fig. 4F), which was significantly higher than the 255
interactions seen between a randomly selected set of 14 miRNAs and a random
set of 116 genes (P < 0.01, binomial test). This implies that EZH2 indirectly
promotes expression of the miRNAs that are likely to regulate its direct targets.
PRC2 regulates FRMD4B expression through a feed-forward
regulatory network with let-7i
To verify the feed-forward regulatory network for a selected example in detail, we
analyzed the repression of FRMD4B by PRC2. Consistent with direct
transcriptional regulation by PRC2, both H3K27me3 and EZH2 were enriched near
the promoter of FRMD4B (Fig. 5A). To verify that PRC2 promoted miRNA-
mediated repression of FRMD4B, we measured its transcript levels in WT and
EZH2 -/- cells, with and without miRNA depletion. Loss of EZH2 caused
derepression of FRMD4B, whereas depletion of miRNAs caused derepression of
FRMD4B expression in WT but not in EZH2 -/- cells (Fig. 5B), verifying that PRC2
promotes miRNA-mediated regulation of FRMD4B. To test if PRC2 promotes
(which was not peer-reviewed) is the author/funder. All rights reserved. No reuse allowed without permission. The copyright holder for this preprint. http://dx.doi.org/10.1101/298919doi: bioRxiv preprint first posted online Apr. 11, 2018;
13
expression of a specific miRNA that targets FRMD4B, we first identified let-7i as
an EZH2-activated miRNA with a predicted interaction site near an AGO2 iCLIP
site on the FRMD4B transcript (Fig. 5C and Supplemental Fig. S10A). We then
analyzed the regulation of FRMD4B by let-7i using luciferase assays with a WT or
mutant FRMD4B 3’ UTR in WT and EZH2 -/- cells. Deletion of the let-7i binding
site led to a marked increase in luciferase signal in WT but a much smaller increase
in EZH2 -/- cells (P = 0.0098, paired t-test, Fig. 5D). Thus, FRMD4B is more
strongly repressed by let-7i in the presence of its activator EZH2.
To address how EZH2 indirectly activates let-7i, we searched for likely repressors
of let-7i among the genes directly repressed by EZH2. We found that LIN28B, a
known repressor of the let-7 family of miRNAs, showed chromatin marks
characteristic of EZH2 activity (Supplemental Fig. S10B). Our RNA-seq data
showed that LIN28B was significantly derepressed upon loss of EZH2 (FDR
corrected P < 0.05), suggesting that it was directly repressed by EZH2. LIN28B is
an RNA-binding protein that inhibits the biogenesis of let-7 miRNAs (Balzeau et al.
2017). Since LIN28B is known to be a common post-transcriptional repressor of
the let-7 family, EZH2 repression of LIN28B might be expected to activate multiple
members of the let-7 family. Indeed, several other let-7 miRNAs also showed
derepression in EZH2 -/- cells, though only let-7i and let-7f-3p met the stringent
threshold for statistical significance we used earlier to identify derepressed
miRNAs (Supplemental Fig. S10C). This data strongly suggests that EZH2
activates let-7i and other let-7 miRNAs by directly repressing LIN28B (Fig. 5E).
(which was not peer-reviewed) is the author/funder. All rights reserved. No reuse allowed without permission. The copyright holder for this preprint. http://dx.doi.org/10.1101/298919doi: bioRxiv preprint first posted online Apr. 11, 2018;

14
Taken together, these results confirm that PRC2 represses FRMD4B expression
through a feed-forward regulatory network with let-7i.
Discussion
Transcription factors and miRNAs work in a highly coordinated manner, forming
feed-back and feed-forward networks to regulate diverse processes. Using a
combination of crosslinking based immunoprecipitation (iCLIP) and global miRNA
depletion followed by RNA-seq, we identified miRNA-regulated genes genome-
wide in GBM cells. This approach however only identified genes whose transcript
levels are lowered due to miRNA function and thus likely underestimates the
number of miRNA-repressed genes. Surprisingly, hundreds of miRNA-repressed
genes nonetheless showed enrichment for PRC2 binding and H3K27me3 marks.
We found that miRNAs post-transcriptionally reinforce the transcriptional
repression of a significant fraction of PRC2 target genes, either independently of
PRC2, or coordinately, by forming a feed-forward regulatory network with PRC2.
Overall, genes repressed by miRNAs and by PRC2 constituted 22% of all direct
PRC2-repressed genes. 54% of these genes showed much less derepression in
response to miRNA depletion in the absence of EZH2, indicating that PRC2
contributed to the repression function of some of these miRNAs. The difference in
derepression in EZH2 -/- cells was not due to reduced miRNA depletion by VP55
in EZH2 -/- cells since the extent and the number of miRNAs depleted in WT and
EZH2 -/- cells were almost identical (Supplemental Fig. S7B). We propose that
many genes that are transcriptionally repressed by PRC2 continue to produce
(which was not peer-reviewed) is the author/funder. All rights reserved. No reuse allowed without permission. The copyright holder for this preprint. http://dx.doi.org/10.1101/298919doi: bioRxiv preprint first posted online Apr. 11, 2018;
15
transcripts at low levels due to inefficient repression by PRC2 at the chromatin and
transcriptional level. These transcripts are then further repressed or destabilized
by miRNAs which thus reinforce the repressive function of PRC2 in one of two
modes. In the coordinate mode, miRNAs that repress PRC2 targets are
themselves indirectly activated by EZH2, forming feed-forward regulatory
networks. In the independent mode, miRNAs and PRC2 co-repress a common set
of target genes independently (Fig. 6). This model would be in agreement with the
notion that miRNAs are broadly involved in reinforcing transcriptional programs
(Ebert and Sharp 2012). We found that PRC2 binds and tri-methylates H3K27 to
repress genes that also harbor active H3K4me3 marks. These genes could
produce residual transcripts as a result of leaky transcription, and indeed we found
this to be the case. Genes co-repressed by PRC2 and miRNAs showed
significantly higher expression upon depletion of miRNAs than genes silenced by
PRC2 alone, even though PRC2 showed equal occupancy at both sets of genes
(Supplemental Fig. S11). In an alternate model, miRNAs promote PRC2 function
or binding, and global loss of miRNAs therefore leads to changes in PRC2 binding
and consequent changes in expression of miRNA-repressed genes.
Four lines of evidence support the first model. First, genes co-repressed by PRC2
and miRNAs showed significant derepression in response to loss of miRNAs in
EZH2 -/- cells, although lower than in WT cells (Supplemental Fig. S8). Second,
mRNA targets of EZH2-activated miRNAs were significantly over-represented
among feed-forward regulated genes. Third, we could verify direct repression of
FRMD4B by PRC2 as well as by the EZH2-activated miRNA let-7i, which fits the
(which was not peer-reviewed) is the author/funder. All rights reserved. No reuse allowed without permission. The copyright holder for this preprint. http://dx.doi.org/10.1101/298919doi: bioRxiv preprint first posted online Apr. 11, 2018;
16
first model. PRC2 directly represses LIN28B, a let-7 miRNA repressor, causing an
indirect activation of let-7i expression (Supplemental Fig. S10B). Finally, if miRNAs
promote repression by PRC2 in addition to repressing genes directly, we would
expect derepression in response to miRNA loss to be greater than derepression
due to loss of EZH2. However derepression due to loss of miRNAs was
significantly lower than derepression due to loss of EZH2 (Fig. 4 C,D and Fig. 5B).
Our results thus favor the first model but do not completely rule out the second
model and therefore it is possible that a feed-back network might also exist
between PRC2 and miRNA mediated repression.
It is likely that this coordination between PRC2 and miRNA repression occurs in
other cellular contexts, given the significant overlap in the genes regulated by
PRC2 and miRNAs in mESCs (Supplemental Fig. S5). Our findings not only
uncover a novel type of coordination between an epigenetic and post-
transcriptional regulator of gene expression but could also have a broad impact on
PRC2’s regulatory function in a wide range of disease and developmental
pathways.
Methods
Cell lines and reagents
GBM cell lines T98G and U87MG (ATCC-CRL-1690 and ATCC-HTB14) were
grown in EMEM with 10% FBS (Gibco). All cell lines were maintained at 37oC and
5% CO2. Antibodies used were – EZH2 (Abcam 186006), AGO2 (Abcam, ab
57113), SUZ12 (Active motif 39877), H3K27me3 (Millipore 07-449) and PPIF
(which was not peer-reviewed) is the author/funder. All rights reserved. No reuse allowed without permission. The copyright holder for this preprint. http://dx.doi.org/10.1101/298919doi: bioRxiv preprint first posted online Apr. 11, 2018;

17
(Abcam, ab 110324). pCMV(CAT)T7-SB100 was a gift from Zsuzsanna Izsvak
(Addgene plasmid # 34879). pSBtet-GP was a gift from Eric Kowarz (Addgene
plasmid # 60495).
RNA-seq and iCLIP
RNA-seq experiments were performed on poly-A selected mRNA (Bioo 512980)
as previously described (Hall et al. 2018). AGO2 iCLIP experiments were
performed as previously described (König et al. 2010). Small RNA-seq libraries
were prepared using NEBNext small RNA library preparation kit (NEB E7330).
Following library preparation, the miRNA size fraction was extracted from 6% TBE
gel as per manufacturer’s instructions.
Quantitative Reverse Transcription PCR (qRT-PCR)
Total RNA was extracted using Trizol and reverse transcribed by Superscript III
reverse transcriptase (Thermo Fisher Scientific 18080085) using random hexamer
primers. PCR was then performed on cDNA using Power SYBR Green master mix
(Thermo Fisher Scientific 4367659). Transcript levels were normalized to 18S RNA
levels and fold changes were quantified using the ΔΔCt method (Livak and
Schmittgen 2001).
Chromatin immunoprecipitations
Cells were crosslinked with 1% formaldehyde for 20 min and quenched with 2.5 M
glycine. The rest of the protocol was performed as previously described (Hall et al.
2018).
mRNA-seq and miRNA-seq analysis
(which was not peer-reviewed) is the author/funder. All rights reserved. No reuse allowed without permission. The copyright holder for this preprint. http://dx.doi.org/10.1101/298919doi: bioRxiv preprint first posted online Apr. 11, 2018;
18
Reads were aligned to the human genome (UCSC version hg38) using Hisat (Kim
et al. 2015). FeatureCounts was then used to count reads mapping to genes and
differential gene expression analysis was performed using DESeq2 with default
parameters (Liao et al. 2014). Significantly differentially expressed genes were
identified at a threshold of FDR corrected P < 0.05 and log2 fold-change >= 0.5 or
<= -0.5. For miRNA-seq, reads mapping to mature miRNAs (miRBase hg38) were
counted using bedtools (Quinlan and Hall 2010). Differentially expressed miRNAs
were then identified using DESeq2 as described above, using the same thresholds
(Love et al. 2014).
ChIP-seq analysis
ChIP-seq reads were aligned to the human genome (UCSC version hg38) using
bwa (Li and Durbin 2009). MACS2 was then used to call peaks at the cut-off of Q-
value < 0.01 (Zhang et al. 2008). For the heat maps plotted in Fig. 2E, Fig. 3B and
Supplemental Fig. S4, signal represents enrichment scores (-log10 Q-value) output
by MACS2. ChIP-seq data for H3K4me3 in GBM cells was obtained from our
recently published study (Hall et al. 2018).
iCLIP analysis
iCLIP reads were first processed to remove duplicate reads using FASTX Toolkit
(http://hannonlab.cshl.edu/fastx_toolkit/) and then aligned to the human genome
(UCSC version 19) using bowtie2. Reads mapping to repeat regions were filtered
out using Repeat Masker. Peaks were then called using CLIPper using default
parameters and filtered based on reproducibility across replicates (Lovci et al.
2013). MiRNA seed enrichments in sequences spanning 200 bases around peaks
(which was not peer-reviewed) is the author/funder. All rights reserved. No reuse allowed without permission. The copyright holder for this preprint. http://dx.doi.org/10.1101/298919doi: bioRxiv preprint first posted online Apr. 11, 2018;

19
were determined using HOMER software (Heinz et al. 2010). Prior to intersections
with other datasets from RNA-seq, peak coordinates were converted to hg38 from
hg19 using LiftOver.
CRISPR-Cas9 knockout of EZH2
EZH2 sgRNA was designed using http://crispr.mit.edu, and EZH2 -/- T98G cells
were generated using the GeneArt CRISPR-Cas kit (Thermo Fisher Scientific
A21175) following manufacturer's instructions. Knockout clones were verified by
immunoblots.
Generation of VP55 expressing stable cell line
The VP55 coding sequence was PCR-amplified from a vector containing the
codon-optimized VP55 sequence (a gift from Christopher Sullivan and Benjamin
tenOever) and cloned into pSBtet-GP, a Tetracycline/Doxycycline-inducible
expression vector containing the Sleeping Beauty transposase-specific inverted
terminal repeats flanking the cloning site. Introduction of pSBtet-GP-VP55 and the
Sleeping Beauty transposase expressing vector (SB100X) into cells allows the
transposase-mediated genomic integration of the DNA sequence from pSBtet-GP-
VP55 that is flanked by the inverted terminal repeats. SB100X and pSBtet-GP-
VP55 constructs were transfected into T98G cells using Lipofectamine 2000 as
per manufacturer’s instructions (Thermo Fisher Scientific 11668030). Clonal cells
were then selected through puromycin selection at 2.5 µg/ml (Gibco A1113803).
Expression of VP55 was induced with Doxycycline (D3072) at 5 µg/ml.
Luciferase reporter assays
(which was not peer-reviewed) is the author/funder. All rights reserved. No reuse allowed without permission. The copyright holder for this preprint. http://dx.doi.org/10.1101/298919doi: bioRxiv preprint first posted online Apr. 11, 2018;

20
The 3’ UTR of target mRNAs spanning at least 500 bp around the predicted binding
site of selected miRNAs were cloned into the psi-CHECK2 vector downstream of
the Renilla luciferase gene. Mutagenesis was performed using the QuikChange II
site directed Mutagenesis Kit (Agilent, 200523). Cells were transfected with WT or
mutant 3’ UTR with or without miRNA inhibitors and harvested after 48 hours.
Luciferase activity was then measured using the Promega dual luciferase kit and
calculated as the ratio of luminescence from Renilla to Firefly.
Acknowledgments
We thank Anna Battenhouse for assistance with aligning sequencing data and
ChIP-seq analysis, Alan Lambowitz for the use of their UV254 crosslinker,
Benjamin tenOever for the VP55 construct, Chris Sullivan for suggesting the use
of VP55, providing constructs and for discussions, and the Genomic Sequencing
and Analysis Facility at UT Austin and the MD Anderson Cancer Center-Science
Park NGS Facility for Illumina sequencing. The Science Park NGS Facility was
supported by CPRIT Core Facility Support Grant RP120348. We also thank the
Texas Advanced Computing Center (TACC) at UT Austin for the use of
computational facilities. This work was funded in part by grants from the Cancer
Prevention and Research Institute of Texas (RP120194) and the National Institutes
of Health (NIH) (CA198648) to V.R.I.
Data Access
Primary sequencing data generated in this study is available at NCBI's GEO
database (https://www.ncbi.nlm.nih.gov/geo/query/acc.cgi?acc=GSE112242).
(which was not peer-reviewed) is the author/funder. All rights reserved. No reuse allowed without permission. The copyright holder for this preprint. http://dx.doi.org/10.1101/298919doi: bioRxiv preprint first posted online Apr. 11, 2018;
21
Scripts used in this manuscript are available on github
(https://github.com/haridh/PRC2-miRNA-manuscript).
Disclosures
The authors declare that they have no competing interests.
References
Abou El Hassan M, Huang K, Eswara MBK, Zhao M, Song L, Yu T, Liu Y, Liu JC, McCurdy S, Ma A, et al. 2015. Cancer Cells Hijack PRC2 to Modify Multiple Cytokine Pathways ed. S.P. Chellappan. PLoS ONE 10: e0126466.
Aguado LC, Schmid S, Sachs D, Shim JV, Lim JK, tenOever BR. 2015. microRNA Function Is Limited to Cytokine Control in the Acute Response to Virus Infection. Cell Host & Microbe 18: 714–722.
Aranda S, Mas G, Di Croce L. 2015. Regulation of gene transcription by Polycomb proteins. Science Advances 1: e1500737–e1500737.
Backes S, Shapiro JS, Sabin LR, Pham AM, Reyes I, Moss B, Cherry S, tenOever BR. 2012. Degradation of Host MicroRNAs by Poxvirus Poly(A) Polymerase Reveals Terminal RNA Methylation as a Protective Antiviral Mechanism. Cell Host & Microbe 12: 200–210.
Balzeau J, Menezes MR, Cao S, Hagan JP. 2017. The LIN28/let-7 Pathway in Cancer. Frontiers in Genetics 8: 1641.
Chen EY, Tan CM, Kou Y, Duan Q, Wang Z, Meirelles G, Clark NR, Ma’ayan A. 2013. Enrichr: interactive and collaborative HTML5 gene list enrichment analysis tool. BMC Bioinformatics 14: 128.
del Rosario RCH, Damasco JRCG, Aguda BD. 2016. MicroRNA inhibition fine-tunes and provides robustness to the restriction point switch of the cell cycle. Sci Rep 6: 603.
Di Croce L, Helin K. 2013. Transcriptional regulation by Polycomb group proteins. Nat Struct Mol Biol 20: 1147–1155.
Ebert MS, Sharp PA. 2012. Roles for MicroRNAs in Conferring Robustness to Biological Processes. Cell 149: 515–524.
(which was not peer-reviewed) is the author/funder. All rights reserved. No reuse allowed without permission. The copyright holder for this preprint. http://dx.doi.org/10.1101/298919doi: bioRxiv preprint first posted online Apr. 11, 2018;

22
Farh KK-H, Grimson A, Jan C, Lewis BP, Johnston WK, Lim LP, Burge CB, Bartel DP. 2005. The Widespread Impact of Mammalian MicroRNAs on mRNA Repression and Evolution. Science 310: 1817–1821.
Gerloff D, Grundler R, Wurm AA, Bräuer-Hartmann D, Katzerke C, Hartmann J-U, Madan V, Müller-Tidow C, Duyster J, Tenen DG, et al. 2014. NF-κB/STAT5/miR-155 network targets PU.1 in FLT3-ITD-driven acute myeloid leukemia. Leukemia 29: 535–547.
Gosline SJC, Gurtan AM, JnBaptiste CK, Bosson A, Milani P, Dalin S, Matthews BJ, Yap YS, Sharp PA, Fraenkel E. 2016. Elucidating MicroRNA Regulatory Networks Using Transcriptional, Post-transcriptional, and Histone Modification Measurements. Cell Rep 14: 310–319.
Graham B, Marcais A, Dharmalingam G, Carroll T, Kanellopoulou C, Graumann J, Nesterova TB, Bermange A, Brazauskas P, Xella B, et al. 2016. MicroRNAs of the miR-290-295 Family Maintain Bivalency in Mouse Embryonic Stem Cells. Stem Cell Reports 6: 635–642.
Hall AW, Battenhouse AM, shivram H, Morris AR, Cowperthwaite MC, Shpak M, Iyer VR. 2018. Bivalent chromatin domains in glioblastoma reveal a subtype-specific signature of glioma stem cells. Cancer Research canres.1724.2017.
Heinz S, Benner C, Spann N, Bertolino E, Lin YC, Laslo P, Cheng JX, Murre C, Singh H, Glass CK. 2010. Simple Combinations of Lineage-Determining Transcription Factors Prime cis-Regulatory Elements Required for Macrophage and B Cell Identities. Mol Cell 38: 576–589.
Hobert O. 2008. Gene Regulation by Transcription Factors and MicroRNAs. Science 319: 1785–1786.
Jadhav U, Nalapareddy K, Saxena M, O’Neill NK, Pinello L, Yuan G-C, Orkin SH, Shivdasani RA. 2016. Acquired Tissue-Specific Promoter Bivalency Is a Basis for PRC2 Necessity in Adult Cells. Cell 165: 1389–1400.
Kim D, Langmead B, Salzberg SL. 2015. HISAT: a fast spliced aligner with low memory requirements. Nat Methods 12: 357–360.
Kowarz E, Löscher D, Marschalek R. 2015. Optimized Sleeping Beauty transposons rapidly generate stable transgenic cell lines. Biotechnology Journal 10: 647–653.
König J, Zarnack K, Rot G, Curk T, Kayikci M, Zupan B, Turner DJ, Luscombe NM, Ule J. 2010. iCLIP reveals the function of hnRNP particles in splicing at individual nucleotide resolution. Nat Struct Mol Biol 17: 909–915.
Leung AKL, Young AG, Bhutkar A, Zheng GX, Bosson AD, Nielsen CB, Sharp PA. 2011. Genome-wide identification of Ago2 binding sites from mouse
(which was not peer-reviewed) is the author/funder. All rights reserved. No reuse allowed without permission. The copyright holder for this preprint. http://dx.doi.org/10.1101/298919doi: bioRxiv preprint first posted online Apr. 11, 2018;

23
embryonic stem cells with and without mature microRNAs. Nat Struct Mol Biol 18: 237–244.
Li H, Durbin R. 2009. Fast and accurate short read alignment with Burrows-Wheeler transform. Bioinformatics 25: 1754–1760.
Liao Y, Smyth GK, Shi W. 2014. featureCounts: an efficient general purpose program for assigning sequence reads to genomic features. Bioinformatics 30: 923–930.
Lin Y, Zhang Q, Zhang H-M, Liu W, Liu C-J, Li Q, Guo A-Y. 2015. Transcription factor and miRNA co-regulatory network reveals shared and specific regulators in the development of B cell and T cell. Sci Rep 5: 15215.
Livak KJ, Schmittgen TD. 2001. Analysis of relative gene expression data using real-time quantitative PCR and the 2(-Delta Delta C(T)) Method. Methods 25: 402–408.
Lovci MT, Ghanem D, Marr H, Arnold J, Gee S, Parra M, Liang TY, Stark TJ, Gehman LT, Hoon S, et al. 2013. Rbfox proteins regulate alternative mRNA splicing through evolutionarily conserved RNA bridges. Nat Struct Mol Biol 20: 1434–1442.
Love MI, Huber W, Anders S. 2014. Moderated estimation of fold change and dispersion for RNA-seq data with DESeq2. Genome Biol 15: 550.
Mote RD, Mahajan G, Padmanabhan A, Ambati R, Subramanyam D. 2017. Dual repression of endocytic players by ESCC microRNAs and the Polycomb complex regulates mouse embryonic stem cell pluripotency. Sci Rep 7: 53.
O'Donnell KA, Wentzel EA, Zeller KI, Dang CV, Mendell JT. 2005. c-Myc-regulated microRNAs modulate E2F1 expression. Nature 435: 839–843.
Paraskevopoulou MD, Georgakilas G, Kostoulas N, Vlachos IS, Vergoulis T, Reczko M, Filippidis C, Dalamagas T, Hatzigeorgiou AG. 2013. DIANA-microT web server v5.0: service integration into miRNA functional analysis workflows. Nucleic Acids Res 41: W169–73.
Pasini D, Bracken AP, Jensen MR, Denchi EL, Helin K. 2004. Suz12 is essential for mouse development and for EZH2 histone methyltransferase activity. The EMBO Journal 23: 4061–4071.
Polioudakis D, Bhinge AA, Killion PJ, Lee B-K, Abell NS, Iyer VR. 2013. A Myc–microRNA network promotes exit from quiescence by suppressing the interferon response and cell-cycle arrest genes. Nucleic Acids Res 41: 2239–2254.
(which was not peer-reviewed) is the author/funder. All rights reserved. No reuse allowed without permission. The copyright holder for this preprint. http://dx.doi.org/10.1101/298919doi: bioRxiv preprint first posted online Apr. 11, 2018;

24
Quinlan AR, Hall IM. 2010. BEDTools: a flexible suite of utilities for comparing genomic features. Bioinformatics 26: 841–842.
Tsang J, Zhu J, van Oudenaarden A. 2007. MicroRNA-Mediated Feedback and Feedforward Loops Are Recurrent Network Motifs in Mammals. Mol Cell 26: 753–767.
WU Q, QIN H, ZHAO Q, HE X-X. 2015. Emerging role of transcription factor-microRNA-target gene feed-forward loops in cancer. Biomedical Reports 3: 611–616.
Zhang Y, Liu T, Meyer CA, Eeckhoute J, Johnson DS, Bernstein BE, Nusbaum C, Myers RM, Brown M, Li W, et al. 2008. Model-based analysis of ChIP-Seq (MACS). Genome Biol 9: R137.
Zheng GXY, Do BT, Webster DE, Khavari PA, Chang HY. 2014. Dicer-microRNA-Myc circuit promotes transcription of hundreds of long noncoding RNAs. Nat Struct Mol Biol 21: 585–590.
Figure Legends
Figure 1. Identification of miRNA targets by AGO2 iCLIP. (A) Autoradiograph
showing AGO2-crosslinked ribonucleoprotein complexes from 2 replicates. The
red box represents the region that was processed to make cDNA libraries. (B)
Genomic enrichment of AGO2-crosslinked reads mapping to mRNAs. The plot
shows total reads mapped to a genomic feature, normalized to the total length of
the feature in the genome. (C) Correlation of the total reads mapping to genes
between the two independent replicates of AGO2 iCLIP (left panel). Genome
browser images showing AGO2 iCLIP peaks at 3’ UTRs for two protein-coding
genes (right panel). (D) AGO2-interacting miRNAs plotted in descending order of
read coverage (left panel). Sequences enriched proximal to AGO2 iCLIP peaks on
mRNAs that significantly match the binding sequence for AGO2-interacting
miRNAs. Corresponding miRNA seed sequences are also shown (right panel). (E)
(which was not peer-reviewed) is the author/funder. All rights reserved. No reuse allowed without permission. The copyright holder for this preprint. http://dx.doi.org/10.1101/298919doi: bioRxiv preprint first posted online Apr. 11, 2018;

25
PPIF transcript levels in U87MG cells treated with negative control inhibitor or miR-
23a-3p inhibitor. Error bars represent standard error across 2 independent
replicates. * indicates P < 0.05 (paired t-test). (F) PPIF protein levels in U87MG
cells treated with negative control inhibitor or miR-23a-3p inhibitor. The
immunoblot showing two independent replicates (left panel) was quantified using
ImageJ (right panel). The Y-axis represents average PPIF signal normalized to
Actin. Error bars represent standard error across 2 independent replicates. *
indicates P < 0.05 (paired t-test).
Figure 2. miRNA-repressed genes are enriched for PRC2 binding and H3K27me3.
(A) miR-21 expression levels in response to VP55 induction. Dox = Doxycycline.
(B) Volcano plot of differentially expressed miRNAs in response to VP55 induction.
X-axis represents log2 fold difference between expression of protein-coding genes
in VP55 induced and non-induced cells. Y-axis represents -log2 P-value of the
expression difference calculated using DESeq2. (C,D) Enrichment for H3K27me3
(C) and SUZ12 (D) at genes derepressed in miRNA depleted cells (miRNA-
repressed genes). Enrichments were calculated using Enrichr (Chen et al. 2013).
(E) ChIP-seq enrichment scores (-log10 Q-value calculated using MACS2) for
EZH2 and H3K27me3 at miRNA-repressed genes that also show EZH2 binding.
Each row represents a miRNA-repressed gene with a significant peak for EZH2
and the columns represent 50 bp bins spanning 10 kb around the gene TSS.
Figure 3. miRNAs repress hundreds of genes directly repressed by PRC2. (A)
Heat map showing differential expression of protein-coding genes in response to
EZH2 knockout. Genes are ranked in increasing order of log2 fold change (≤ -0.5
(which was not peer-reviewed) is the author/funder. All rights reserved. No reuse allowed without permission. The copyright holder for this preprint. http://dx.doi.org/10.1101/298919doi: bioRxiv preprint first posted online Apr. 11, 2018;

26
and ≥ 0.5 log2 fold change) in WT/EZH2 -/-. (B) Heat map showing enrichment
scores (-log10 Q-value calculated using MACS2) for EZH2, H3K27me3 and
H3K4me3 for genes plotted in and ordered as in A. (C) Average EZH2, H3K27me3
and H3K4me3 ChIP-seq signal for genes plotted in A. (D). Heat map showing log2
fold values (WT/EZH2 -/-) of miRNA-repressed genes that are also significantly
regulated by EZH2, ordered in increasing order of log2 fold change(≤ -0.5 and ≥
0.5 log2 fold change in WT/EZH2 -/-). (E) qRT-PCR validation of genes repressed
by both EZH2 and miRNAs, plotted as in Fig. 1E. * indicates P < 0.05 (paired t-
test). (F) Correlation of transcript levels (X-axis) and AGO2 iCLIP enrichment (Y-
axis)for four sets of protein-coding genes as indicated in the key (left panel).
Overlap of AGO2-interacting genes repressed by miRNAs and genes co-
repressed by EZH2 and miRNAs (right panel). Significance of overlap was
calculated using the hypergeometric test.
Figure 4. miRNAs repress PRC2 target genes through a feed-forward regulatory
network with PRC2. (A) Depletion of miR-21 in response to VP55 induction in
EZH2 -/- cells. (B) Heat map showing derepression of gene expression in response
to miRNA loss (+/- Dox) in WT (WT, +/- Dox) and EZH2 -/- cells (EZH2 -/-, +/- Dox)
for genes co-repressed by EZH2 and miRNAs. Only 146 of the 213 co-repressed
genes that had a significant difference in derepression between WT and EZH2 -/-
cells are shown. Genes are ordered in decreasing order of WT, +/- Dox/EZH2 -/-,
+/- Dox values. (C) Box plot comparing expression of feed-forward regulated
genes in miRNA depleted (+ Dox) and non-depleted (- Dox) WT and EZH2 -/- cells.
* indicates P < 0.05 and NS indicates not significant. (D) qRT-PCR showing
(which was not peer-reviewed) is the author/funder. All rights reserved. No reuse allowed without permission. The copyright holder for this preprint. http://dx.doi.org/10.1101/298919doi: bioRxiv preprint first posted online Apr. 11, 2018;

27
transcript levels in miRNA-depleted WT and EZH2 -/- cells, plotted as in Fig. 1E.
(E) Heat map showing differential expression of miRNAs in response to EZH2
knockout. Rows are ordered from low to high log2 fold change between WT and
EZH2 -/- miRNA counts. (F) Heat map showing interactions predicted by DIANA
between EZH2-activated miRNAs and feed-forward regulated genes
(Paraskevopoulou et al. 2013). Predicted interactions are indicated by filled cells.
Figure 5. PRC2 regulates FRMD4B expression through a feed-forward regulatory
network with let-7i. (A) Genome browser view of FRMD4B showing tracks for EZH2
and H3K27me3 ChIP-seq. (B) qRT-PCR showing expression changes of FRMD4B
in miRNA-depleted (+ Dox) and non-depleted (- Dox) WT and EZH2 -/- cells,
plotted as in Fig. 1E. * indicates P < 0.05. (C) Genome browser view of let-7i in
two replicates of WT and EZH2 -/- cells. (D) Luciferase assay comparing miRNA
inhibition between WT and mutant FRMD4B 3’ UTR (seed deletion) transfected
WT and EZH2 -/- cells. (E) Feed-forward regulatory network formed by PRC2,
LIN28B, let-7i and FRMD4B.
Figure 6. Model for reinforcement of PRC2 repression by miRNAs. Co-repression
of target genes occurs transcriptionally by PRC2 and post-transcriptionally by
miRNAs, either in a coordinated or independent manner.
Supplemental Figure Legends
Supplemental Figure S1. AGO2 binding sites identified by iCLIP are enriched for
binding sites of highly expressed miRNAs. (A) Correlation of miRNA enrichment in
AGO2 iCLIP data (X-axis) with their expression (Y-axis). AGO2 iCLIP enriched
(which was not peer-reviewed) is the author/funder. All rights reserved. No reuse allowed without permission. The copyright holder for this preprint. http://dx.doi.org/10.1101/298919doi: bioRxiv preprint first posted online Apr. 11, 2018;

28
miRNAs shown in Fig 1D (right) are indicated. (B) Enrichment for predicted mRNA
targets of AGO2-interacting miRNAs among protein-coding genes interacting with
AGO2.
Supplemental Figure S2. miR-23a-3p directly represses PPIF expression. (A)
Genome browser view showing AGO2 iCLIP peaks at the 3’ UTR of PPIF. Green
bars represent predicted miRNA binding sites with miR-23a-3p binding site
highlighted in red. (B) Luciferase assays showing rescue of miRNA inhibition on
treatment with miR-23a-3p inhibitor or negative control inhibitor for WT 3’ UTR and
mutant 3’ UTR (seed deletion, Mut-1) transfected U87MG cells. (C) Changes in
luciferase signal on deletion of miR-23a-3p binding site (Mut-1) or disruption of
miRNA-PPIF interactions through base substitutions (Mut-2) in T98G cells.
Supplemental Figure S3. Identification of miRNA-repressed genes by global
depletion of miRNAs. (A) cDNA libraries prepared from miRNA depleted (+ Dox)
and non-depleted (- Dox) T98G cells. (B) Volcano plot of differentially expressed
protein-coding genes in response to VP55 induction.
Supplemental Figure S4. EZH2 and H3K27me3 ChIP-seq enrichment scores for
protein-coding genes containing at least one significant EZH2 ChIP peak. Each
row represents a gene containing at least one EZH2 ChIP-seq peak and the
columns are binned into 50 bp windows spanning 10 kb around the TSS.
Supplemental Figure S5. miRNA-repressed genes in mESCs are enriched for
H3K27me3 and PRC2. (A,B) Enrichr analysis showing enrichment for H3K27me3
(which was not peer-reviewed) is the author/funder. All rights reserved. No reuse allowed without permission. The copyright holder for this preprint. http://dx.doi.org/10.1101/298919doi: bioRxiv preprint first posted online Apr. 11, 2018;

29
(A) and SUZ12 (B) at genes up-regulated in miRNA-depleted mESCs (DICER
knockout mESCs).
Supplemental Figure S6. Genes derepressed on loss of EZH2 are enriched for
PRC2. (A) Immunoblots for EZH2, SUZ12 and H3K27me3 in WT and EZH2 -/-
cells. (B) Normalized density of EZH2, H3K27me3 and H3K4me3 ChIP enrichment
scores in the 10 kb region spanning the TSS of EZH2-regulated genes plotted in
Fig. 3A. (C) Genome browser view of LAMA5, a gene enriched with EZH2 and
H3K27me3 on chromatin, and whose transcript is also bound by AGO2.
Supplemental Figure S7. Global miRNA depletion in EZH2 -/- cells is comparable
to WT cells. (A) cDNA libraries prepared from EZH2 -/- cells with (+ Dox) and
without depletion of miRNAs (- Dox). (B) Total miRNA counts (Log10 total reads
mapping to miRNAs) in WT and EZH2 -/- cells with and without depletion of
miRNAs.
Supplemental Figure S8. Some feed-forward regulated genes show
derepression in response to miRNA depletion in EZH2 -/- cells. Box plot comparing
expression of a subset of feed-forward regulated genes (27 genes) in miRNA
depleted and non-depleted EZH2 -/- cells.
Supplemental Figure S9. Non feed-forward regulated genes show derepression
in response to miRNA loss in EZH2 -/- cells and WT cells. Box plot comparing
expression of non-feed-forward regulated genes in miRNA depleted and non-
depleted WT and EZH2 -/- cells.
(which was not peer-reviewed) is the author/funder. All rights reserved. No reuse allowed without permission. The copyright holder for this preprint. http://dx.doi.org/10.1101/298919doi: bioRxiv preprint first posted online Apr. 11, 2018;

30
Supplemental Figure S10. EZH2 activates let-7 miRNAs by directly repressing
LIN28B. (A) Genome browser view of FRMD4B showing tracks for H3K27me3
ChIP-seq, EZH2 ChIP-seq and AGO2 iCLIP, highlighting the binding site for let-7i.
(B) Genome browser view of LIN28B showing tracks for EZH2 and H3K27me3
ChIP-seq. (C) Heatmap showing expression change of all let-7 miRNAs in WT and
EZH2 -/- cells. Rows are ranked by low to high log2 fold change (WT/EZH2 -/-).
Supplemental Figure S11. Genes co-repressed by EZH2 and miRNAs are less
tightly repressed by EZH2 than genes silenced by EZH2 alone. (A) Box plot
showing average expression in Dox treated (miRNA depleted) and untreated WT
cells for two sets of genes - PRC2-repressed genes that are not co-repressed by
miRNAs (non-miRNA-repressed) and genes that are co-repressed by PRC2 and
miRNAs (miRNA-repressed). (B) Normalized density of EZH2 ChIP enrichment
scores in a 10 kb region spanning the TSS of PRC2 target genes that are either
non-miRNA-repressed or miRNA-repressed.
(which was not peer-reviewed) is the author/funder. All rights reserved. No reuse allowed without permission. The copyright holder for this preprint. http://dx.doi.org/10.1101/298919doi: bioRxiv preprint first posted online Apr. 11, 2018;

A
UV254 - + + + +
AGO2
RNase +
AGO2
- ++ +
Replicate 1 Replicate 2
0
1.70E-04
3.40E-04
AGO2 iCLIP
3' UTR
CDS
Intron
5' UTR
Enr
ichm
ent
BR
eplic
ate
1
Replicate 2
r = 0.82
C
PPIF 3’ UTR
Replicate 2
Replicate 1
MYLIP 3’ UTR
0 0.05 0.1 0.15 0.2miR-27a-3pmiR-21-5pmiR-29a-3pmiR-125b-5pmiR-23a-3pmiR-27b-3pmiR-29b-3pmiR-21-3pmiR-193b-3pmiR-222-3pmiR-23b-3pLet-7a-5pmiR-29c-3pLet-7b-5pmiR-16-5pmiR-193a-3pmiR-484miR-224-5pmiR-22-3pmiR-125a-5p
AG
O2
iCLI
P e
nric
hed
miR
NA
s
AGO2 iCLIP read countsD
Enrichment for binding sites of highly expressed miRNAs
miR-29 a,b,cP = 1e-56
UGGUGCU
UACCUC
ACUGUGA
AUGUAGC
GUGACUU
Let-7P = 1e-43
miR-27 a,bP = 1e-34
miR-222P = 1e-19
miR-224P = 1e-19
miRNA seed
*
0
6.E-02
1.E-01
PPIF
Negativecontrol
miR-23a-3p inhibitor
E F
1 21 2
PPIF
Actin
- - + +Replicate
miR-23a-3pinhibitor
0
2.5
5
PPIF
Negativecontrol
miR-23a-3p inhibitor
*
UV254RNase
Figure 1N
orm
aliz
edtra
nscr
ipt l
evel
Nor
mal
ized
pro
tein
leve
l
AGO2 iCLIP
AGO2 iCLIP
Replicate 2
Replicate 1
(which was not peer-reviewed) is the author/funder. All rights reserved. No reuse allowed without permission. The copyright holder for this preprint. http://dx.doi.org/10.1101/298919doi: bioRxiv preprint first posted online Apr. 11, 2018;

A
●
●
● ●
●
●
●
●
●
● ●
●
●
●
●
●
●
● ●●
●
●
●
●
●
●
●
●
●
●
●
●
● ●●●
●
● ●●●
●
●●
● ●
●●
●
●●
●
●
●
●
●●
●
●
●
●
●●
●
●
●
●
●
●
●
●
●
●
●
●
●
●
●
● ●●
●
●
●
●
●
●
●
●
●●
●
●
●
●
●
●●
●
●
●
●
●
●
●
●
●●
●
●●
●
●●
●
●
●
●
●
●●
●●
●
●
●
●●
●
●
●
●
●
●●
●
●
●
●
●
●
●
●
●
●
●
●
●
●
●
●
●
●
●●
●
●●
●●● ●
●
●●
●●
●●
●
●
●
● ●●
●● ●●
●
●
●
●
●● ●
●
●●
●
●●
●
●
●
●
●
●
●
●●
●
● ●
●
●
●
●
●
●
●
●
●
● ●
●
●
●
●
●●
●
● ●●
●
●
●●●
●
●
●●
● ●
●
●
●
●●
●
●●●
●
●
●
●
●
●
●●
●
●
●
●
●
●
●
●
●●
●
●
●
●
●
●
●
●
●
●
● ● ●
●
●
●
●
●
●
●
●
●
●
●●● ●
● ●●
● ●●●
●
●
●●
●●
●
●●
●
●
●●
●●●● ●
●●
●
●
●●●●
●
●
●
● ● ●
●
●
●
●
●
●
●
●●●●
●
●
●
●●
●● ●
●
●●
●
●
●
●
●
●
●
●
●
●●
●●● ●● ●●
●
●●
●
●●
●
●● ●
●
● ●●
●
●
●●
●●
●
●
●●
●
●●● ●
●
●
●
●
●
●
●
●
●
●
●
●
●
●
●
●
●
●●
●
●●
●
●
●
●
●
●● ●●
●
● ● ●●● ●
●
●
●
●
●
●●
● ●
●
●
●
●
●● ●●●
●●
●●
●●● ● ●● ●● ●● ● ●●
●
●●
●
●
●
●
●
●
● ●
●●
●
●
●
●
●
●
●
●
●
●
●
●
●
●●●
●
●
●●
●
●
●
●
●
●
●
●●
●
●
0
50
100
150
−4 0 4
●●●
Down−regulatedNo changeUp−regulated
B
0 2 4 6 8 10 12
SUZ12
STAT5A
RELA
SMAD4
NELFE
0 5 10 15 20 25H3K27me3 SK-N-SH
H3K27me3 BJ
H3K27me3 lung fibroblast
H3K27me3 Caco-2
H3K27me3 cardiac mesoderm
-Log2 Q-value
-Log2 Q-value
Histone modification enrichment
Transcription factor enrichment
EZH2 H3K27me30 +5 kb-5 kb 0 +5 kb-5 kb
ChIP-seq signal
miR
NA
-rep
ress
ed g
enes
(103
5)
C
D
E
1Dox - + +
Replicate
miR-21
5S rRNA
1 2
-Log
2 P
-val
ue
Log2 fold change
Differential miRNA expression
Figure 2(which was not peer-reviewed) is the author/funder. All rights reserved. No reuse allowed without permission. The copyright holder for this preprint. http://dx.doi.org/10.1101/298919doi: bioRxiv preprint first posted online Apr. 11, 2018;

WT/EZH2 -/-1 2
ChIP-seq signalEZH2 H3K27me3 H3K4me3
0 +5 kb-5 kb 0 +5 kb-5 kb 0 +5 kb-5 kb
1519
EZH
2-ac
tivat
ed18
34E
ZH2-
repr
esse
d
86E
ZH2-
activ
ated
213
EZH
2-re
pres
sed
Low High
EZH2H3K27me3H3K4me3
WT/EZH2 -/-1 2
miR
NA
-rep
ress
ed g
enes
en
riche
d fo
r PR
C2
bind
ing
0
3.E-06
5.E-06
MYLIP0
4.E-07
7.E-07
LAMA5
WT, - DoxEZH2 -/-WT, + Dox
0
4.E-06
7.E-06
PARP80
6.E-07
1.E-06
FRMD4B
**
**
**
**
A B C
D E
Nor
mal
ized
tran
scrip
t lev
el
1367 13974
P = 2.9e - 24
1441 213
miRNA-repressedAGO2 target genes
Genes co-repressed by EZH2 and miRNAs
AGO2-enrichedEZH2-repressed
++
-+
+-
--
Log2 (Input counts + 1)
Log 2
(AG
O2
iCLI
P c
ount
s +
1)
F
Key
+3
-30
+3
-30
Log2 average signal
0
5
10
0 5 10 15
miRNA-repressed genes
Figure 3(which was not peer-reviewed) is the author/funder. All rights reserved. No reuse allowed without permission. The copyright holder for this preprint. http://dx.doi.org/10.1101/298919doi: bioRxiv preprint first posted online Apr. 11, 2018;
1
Dox - + +
Replicate
miR-21
5S rRNA
1 2
EZH2 -/- cells
Gen
es c
o-re
pres
sed
by E
ZH2
and
miR
NA
s
*NS
- + - +
WT EZH2 -/-
Log 2
(Nor
mal
ized
read
s co
unts
+ 1
)
0
3.E-06
5.E-06
MYLIP0
4.E-06
7.E-06
PARP8
0
4.E-07
7.E-07
LAMA5
WT - DoxWT + DoxEZH2 -/-, - DoxEZH2 -/-, + Dox
WT/EZH2 -/-1 2
31 m
iRN
As
activ
ated
84 m
iRN
As
repr
esse
d
342 interactions
Con
serv
ed E
ZH2-
activ
ated
miR
NA
s
Feed-forward regulated genes
A B
C D
miR−186miR−30cmiR−155miR−199a−5pmiR−199b−5pmiR−181amiR−181bmiR−335miR−143Let−7imiR−146amiR−137miR−221miR−222
E
WT/EZH2 -/-
WT+/- Dox
EZH2 -/-+/- Dox
WT +/- Dox /EZH2 -/- +/- Dox
116
gene
sLo
g 2 fo
ld
chan
ge >
= 0.
5
30 g
enes
Log 2
fold
ch
ange
<=
0.5
F
116 Feed-forward genes
Dox
Nor
mal
ized
tran
scrip
t lev
el
+3
-30
+3
-30
Replicate 1 2 1 2 1 2
Figure 4
**
(which was not peer-reviewed) is the author/funder. All rights reserved. No reuse allowed without permission. The copyright holder for this preprint. http://dx.doi.org/10.1101/298919doi: bioRxiv preprint first posted online Apr. 11, 2018;

EZH2 ChIP-seq
H3K27me3 ChIP-seq
FRMD4B
0
6.E-07
1.E-06
FRMD4B
WT - DoxWT + DoxEZH2 -/-, - DoxEZH2 -/-, + Dox
Nor
mal
ized
tran
scrip
tle
vel
PRC2 FRMD4B
Let-7iLIN28B
A
B C
D
0
7
14
WT EZH2 -/-
WT 3’ UTR
Mut 3’ UTR
Nor
mal
ized
luci
fera
seac
tivity
(FR
MD
4B)
**
WT Replicate 1
WT Replicate 2
EZH2 -/- Replicate 1
EZH2 -/- Replicate 2
Let-7i
E
Figure 5(which was not peer-reviewed) is the author/funder. All rights reserved. No reuse allowed without permission. The copyright holder for this preprint. http://dx.doi.org/10.1101/298919doi: bioRxiv preprint first posted online Apr. 11, 2018;

PRC2
miRNAs
Residualtranscripts
LowerPRC2 direct target
Residualtranscripts
LowerPRC2 direct target
miRNA-repressor
Independent
Coordinated
PRC2
miRNAs
Figure 6
Reinforcement of PRC2 repression by miRNAs
(which was not peer-reviewed) is the author/funder. All rights reserved. No reuse allowed without permission. The copyright holder for this preprint. http://dx.doi.org/10.1101/298919doi: bioRxiv preprint first posted online Apr. 11, 2018;

0 0.5 1 1.5 2 2.5 3 3.5miR-27a
miR-21
miR-29a
miR-125b
miR-23a
miR-27b
miR-29b
miR-193b
miR-222
miR-23b
miR-450a
*
*
*
*
*
*
*
**
*NS
Negativecontrol
Hig
hly
expr
esse
d m
iRN
As
Log2 enrichmentSupplemental Figure S1
●
●
●
●
●
●●
●
●
●
●●
●
●
●
●
●
●
●
●
●
●
●
●
●●
●
●
●
●
●
●
●●●
●●
●
●
●
●
●
●
● ●
●●
●
●
●
●●
●
●
●
●
●
●●
●
●●
●
●●
●
●
●
●
●
●
●
●
●
●
●
●
●
●
●
●
●
●
●
●●
●
●
●●
●
●
●
●
●
●
●●
●
●
●
●
●
●
●
●●
●
●
● ●
●
●●●
●
●
●
●
●
●
●
●
●
●
●
●
●
●●
●
●
●
●
●
●
●
●
●
●
●
●
●
●
●
●●
●
●
●
●
●●
●
●
●
●
●
●●
●
●
●
●
●
●
●
● ●
●
●
●
●
●
● ●
●
●
●●
●
●● ●●
●
●
●
●
●
●
●
●
●
●
●
●
●
●
●
●
●
●
●
●●
●
●●●
●●
●
●●
●●●
●
●
●●●●
●
●●
●
●
●
●●
●
●●
●
● ●
●
●
●
●
●
●
●
●
●
●
●
●
●
●
●
● ●●●
●
●
●
●
●
● ●
●
●●
● ●
●
●
● ●
●
●●
●
●
●
●●●
●
●
●●
●
●
●
●
●
●
●
●
●●
●
●
●●
●
●●
●
●
●
●
●
●
●
●
●
●
●●
●
●
●
●
●●
●
●
●
●
●
●
●●
●
●
●
●
●
●●
●
● ●
●
●
●
●
●
●
●
●
●
●●
●
let−7a−5pmiR−222−3p
miR−224−5pmiR−27a−3p
miR−29a−3p
0
5
10
15
20
0 5 10 15
BLo
g 2 read
cou
nts
miR
NA
-seq
Log2 read countsAGO2 iCLIP
A
Supplemental Figure S1. AGO2 binding sites identified by iCLIP are enriched for binding sites of highly expressed miRNAs. (A) Correlation of miRNA enrichment in AGO2 iCLIP data (X-axis) with their expression (Y-axis). AGO2 iCLIP enriched miRNAs shown in Fig 1D (right) are indicated. (B) Enrichment for predicted mRNA targets of AGO2-interacting miRNAs among protein-coding genes interacting with AGO2.
r = 0.71
(which was not peer-reviewed) is the author/funder. All rights reserved. No reuse allowed without permission. The copyright holder for this preprint. http://dx.doi.org/10.1101/298919doi: bioRxiv preprint first posted online Apr. 11, 2018;
Rel
ativ
e lu
cife
rase
ac
tivity
B
Rel
ativ
e lu
cife
rase
act
ivity
0
3
6
WT 3'UTR
Mut-13' UTR
miR-23a-3pinhibitor
control
*
C
0
1.75
3.5
PPIF
WT 3' UTR
Mut-1 3’ UTR
Mut-2 3’ UTR
**
A AGO2 iCLIP
Replicate 2
Replicate 1
PPIF 3’ UTR
miR-23a-3p
Supplemental Figure S2. miR-23a-3p directly represses PPIF expression. (A) Genome browser view showing AGO2 iCLIP peaks at the 3’ UTR of PPIF. Green bars represent predicted miRNA binding sites with miR-23a-3p binding site highlighted in red. (B) Luciferase assays showing rescue of miRNA inhibition on treatment with miR-23a-3p inhibitor or negative control inhibitor for WT 3’ UTR and mutant 3’ UTR (seed deletion, Mut-1) transfected U87MG cells. (C) Changes in luciferase signal on deletion of miR-23a-3p binding site (Mut-1) or disruption of miRNA-PPIF interactions through base substitutions (Mut-2) in T98G cells.
Supplemental Figure S2(which was not peer-reviewed) is the author/funder. All rights reserved. No reuse allowed without permission. The copyright holder for this preprint. http://dx.doi.org/10.1101/298919doi: bioRxiv preprint first posted online Apr. 11, 2018;

miRNA
1 21 2Dox + +- -Replicate
Log2 fold change
Differential mRNA expression
-Log
10 Q
-val
ue
A B
Supplemental Figure S3. Identification of miRNA-repressed genes by global depletion of miRNAs. (A) cDNA libraries prepared from miRNA depleted (+ Dox) and non-depleted (- Dox) T98G cells. (B) Volcano plot of differentially expressed protein-coding genes in response to VP55 induction.
0
100
200
300
Supplemental Figure S3(which was not peer-reviewed) is the author/funder. All rights reserved. No reuse allowed without permission. The copyright holder for this preprint. http://dx.doi.org/10.1101/298919doi: bioRxiv preprint first posted online Apr. 11, 2018;

EZH2 H3K27me30 +5 kb-5 kb 0 +5 kb-5 kb
ChIP-seq signal
EZH
2 en
riche
d ge
nes
6132
Supplemental Figure S4. EZH2 and H3K27me3 ChIP-seq enrichment scores for protein-coding genes containing at least one significant EZH2 ChIP peak. Each row represents a gene containing at least one EZH2 ChIP-seq peak and the columns are binned into 50 bp windows spanning 10 kb around the TSS.
Supplemental Figure S4(which was not peer-reviewed) is the author/funder. All rights reserved. No reuse allowed without permission. The copyright holder for this preprint. http://dx.doi.org/10.1101/298919doi: bioRxiv preprint first posted online Apr. 11, 2018;
0 10 20 30 40 50 60 70
SUZ12
CHEA
EZH2
CHEA
EZH2
ENCODE
0 20 40 60 80 100
H3K27me3
small intestine
H3K27me3
myocyte
H3K27me3
C2C12
H3K27me3
kidney
H3K27me3
thymus
A B
-Log2
Q-value -Log2
Q-value
Histone modification enrichment Transcription factor enrichment
Supplemental Figure S5. miRNA-repressed genes in mESCs are enriched for H3K27me3 and PRC2.
(A,B) Enrichr analysis showing enrichment for H3K27me3 (A) and SUZ12 (B) at genes up-regulated in
miRNA-depleted mESCs (DICER knockout mESCs).
Supplemental Figure S5(which was not peer-reviewed) is the author/funder. All rights reserved. No reuse allowed without permission. The copyright holder for this preprint. http://dx.doi.org/10.1101/298919doi: bioRxiv preprint first posted online Apr. 11, 2018;

SUZ12
H3K27me3
Actin
EZH2
EZH2 -/-WT
EZH2 ChIP-seq
H3K27me3 ChIP-seq
AGO2 iCLIP
LAMA5
A B
C
-5 kb 0 +5 kb0
100
200
300
400
500
0
300
600
900
1200
0
100
200
300
EZH2 H3K27me3 H3K4me3
EZH2-activated
EZH2-repressed
-5 kb 0 +5 kb -5 kb 0 +5 kb
Ave
rage
enr
ichm
ent
TSS TSS TSS
Supplemental Figure S6. Genes derepressed on loss of EZH2 are enriched for PRC2. (A) Immunoblots for EZH2, SUZ12 and H3K27me3 in WT and EZH2 -/- cells. (B) Normalized density of EZH2, H3K27me3 and H3K4me3 ChIP enrichment scores in the 10 kb region spanning the TSS of EZH2-regulated genes plotted in Fig. 3A. (C) Genome browser view of LAMA5, a gene enriched with EZH2 and H3K27me3 on chromatin, and whose transcript is also bound by AGO2.
Supplemental Figure S6(which was not peer-reviewed) is the author/funder. All rights reserved. No reuse allowed without permission. The copyright holder for this preprint. http://dx.doi.org/10.1101/298919doi: bioRxiv preprint first posted online Apr. 11, 2018;

miRNA
1212Dox + +- -Replicate
1
1.E+04
1.E+08
1 21 2Dox + +- -Replicate 1 21 2
+ +- -EZH2 -/- WT
A B
Tota
l rea
ds m
appi
ng
to m
iRN
As
(Log
10)
Supplemental Figure S7. Global miRNA depletion in EZH2 -/- cells is comparable to WT cells. (A) cDNA libraries prepared from EZH2 -/- cells with (+ Dox) and without depletion of miRNAs (- Dox). (B) Total miRNA counts (Log10 total reads mapping to miRNAs) in WT and EZH2 -/- cells with and without depletion of miRNAs.
Supplemental Figure S7(which was not peer-reviewed) is the author/funder. All rights reserved. No reuse allowed without permission. The copyright holder for this preprint. http://dx.doi.org/10.1101/298919doi: bioRxiv preprint first posted online Apr. 11, 2018;
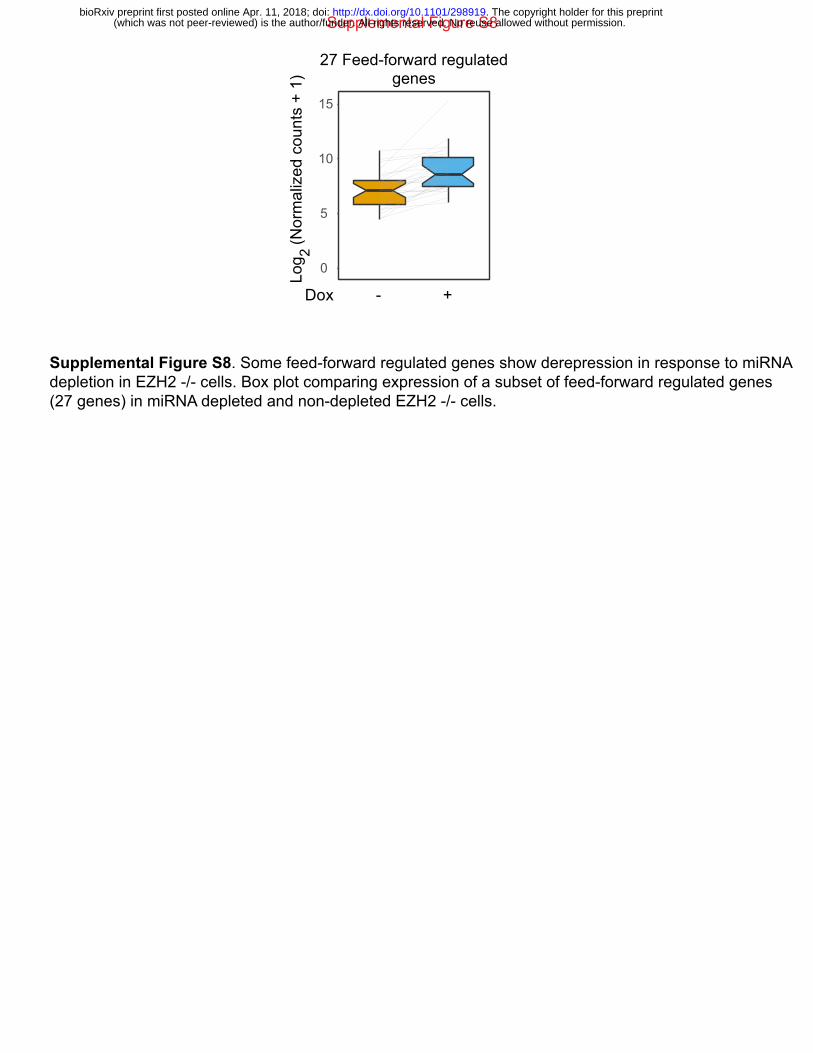
�
0
5
10
15
Dox - +
27 Feed-forward regulatedgenes
Log 2
(Nor
mal
ized
cou
nts
+ 1)
Supplemental Figure S8. Some feed-forward regulated genes show derepression in response to miRNA depletion in EZH2 -/- cells. Box plot comparing expression of a subset of feed-forward regulated genes (27 genes) in miRNA depleted and non-depleted EZH2 -/- cells.
Supplemental Figure S8(which was not peer-reviewed) is the author/funder. All rights reserved. No reuse allowed without permission. The copyright holder for this preprint. http://dx.doi.org/10.1101/298919doi: bioRxiv preprint first posted online Apr. 11, 2018;

Supplemental Figure S9. Non feed-forward regulated genes show derepression in response to miRNA loss in EZH2 -/- cells and WT cells. Box plot comparing expression of non feed-forward regulated genes in miRNA depleted and non-depleted WT and EZH2 -/- cells.
��
�
�
�
�
�
0
5
10
15
20
Dox - +EZH2 -/-
- +WT
Non feed-forward regulatedgenes
Log 2
(Nor
mal
ized
cou
nts
+ 1)
* **
Supplemental Figure S9(which was not peer-reviewed) is the author/funder. All rights reserved. No reuse allowed without permission. The copyright holder for this preprint. http://dx.doi.org/10.1101/298919doi: bioRxiv preprint first posted online Apr. 11, 2018;
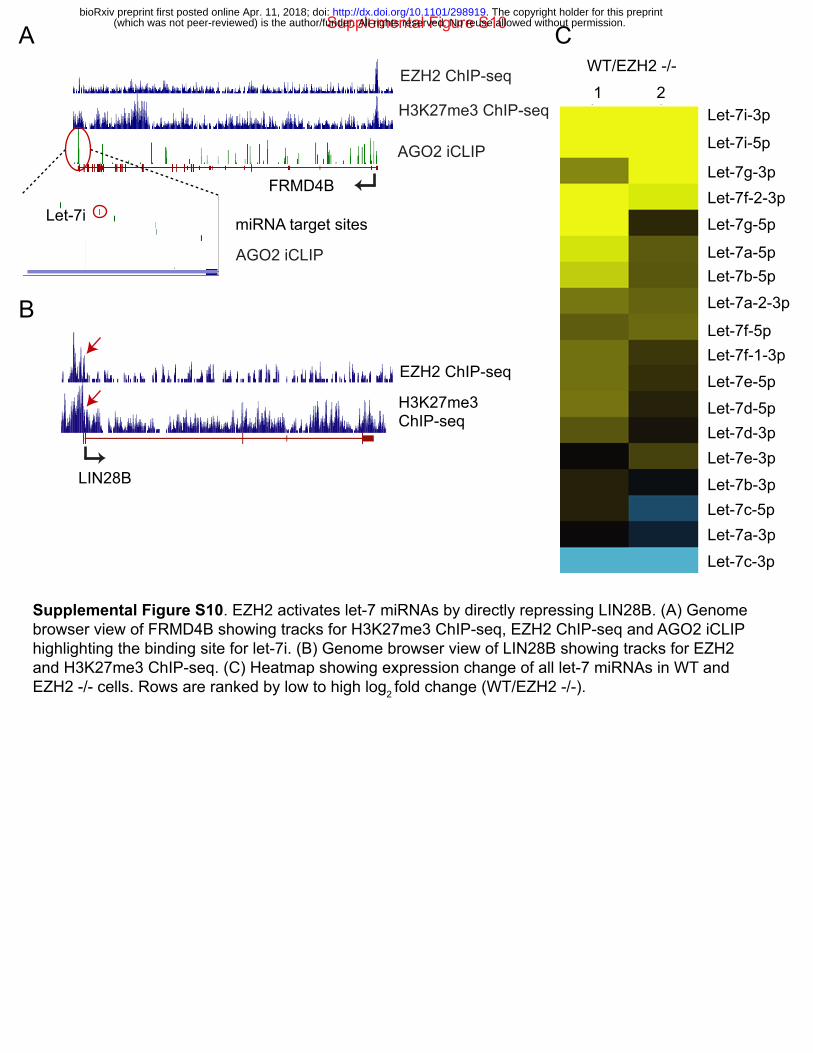
WT/EZH2 -/-
1 2Let-7i-3p
Let-7i-5p
Let-7g-3pLet-7f-2-3pLet-7g-5p
Let-7a-5pLet-7b-5pLet-7a-2-3p
Let-7f-5pLet-7f-1-3pLet-7e-5p
Let-7d-5pLet-7d-3pLet-7e-3p
Let-7b-3pLet-7c-5pLet-7a-3p
Let-7c-3p
EZH2 ChIP-seq
H3K27me3 ChIP-seq
A
B
C
LIN28B
EZH2 ChIP-seq
H3K27me3 ChIP-seq
AGO2 iCLIP
FRMD4B
AGO2 iCLIP
miRNA target sitesLet-7i
Supplemental Figure S10. EZH2 activates let-7 miRNAs by directly repressing LIN28B. (A) Genome browser view of FRMD4B showing tracks for H3K27me3 ChIP-seq, EZH2 ChIP-seq and AGO2 iCLIP highlighting the binding site for let-7i. (B) Genome browser view of LIN28B showing tracks for EZH2 and H3K27me3 ChIP-seq. (C) Heatmap showing expression change of all let-7 miRNAs in WT and EZH2 -/- cells. Rows are ranked by low to high log2 fold change (WT/EZH2 -/-).
Supplemental Figure S10(which was not peer-reviewed) is the author/funder. All rights reserved. No reuse allowed without permission. The copyright holder for this preprint. http://dx.doi.org/10.1101/298919doi: bioRxiv preprint first posted online Apr. 11, 2018;

DoxNon-miRNArepressed
0
200
400
600
- 5 kb 0 + 5 kb
●
●●●●●●●●●● ●●●
−20
−10
0
- + - +miRNA
repressed
miRNA-repressed
Non-miRNA-repressed
Ave
rage
pea
k en
richm
ent
Direct EZH2 targets Direct EZH2 targets
A B
TSS
Log 2 R
PK
M
Supplemental Figure S11. Genes co-repressed by EZH2 and miRNAs are less tightly repressed by EZH2 than genes silenced by EZH2 alone. (A) Box plot showing average expression in Dox treated (miRNA depleted) and untreated WT cells for two sets of genes - PRC2-repressed genes that are not co-repressed by miRNAs (non-miRNA-repressed) and genes that are co-repressed by PRC2 and miRNAs (miRNA-repressed). (B) Normalized density of EZH2 ChIP enrichment scores in a 10 kb region spanning the TSS of PRC2 target genes that are either non-miRNA-repressed or miRNA-repressed.
**
Supplemental Figure S11(which was not peer-reviewed) is the author/funder. All rights reserved. No reuse allowed without permission. The copyright holder for this preprint. http://dx.doi.org/10.1101/298919doi: bioRxiv preprint first posted online Apr. 11, 2018;
Recommended