
“Improving the Quality of Motorcycle Travel Data Collection”
Dan Middleton, Ph.D., P.E. Texas A&M Transportation Institute
Research Objectives
§ Develop methodology for determining MC count locations
§ Determine the accuracy of selected detection systems

Major Research Activities
§ Literature review § Agency engagement § Field data collection § Data analysis § Documentation
Background
§ Motorcycle Crashes ú In 1997 MCs were 5% of total traffic fatalities ú In 2009 MCs were 14% of fatalities ú MC crashes 37 times more likely to result in fatalities than auto crashes
ú Rate of increase in fatalities exceeded MC registrations and estimated VMT
§ Motorcycle Counts
Technology Selection Criteria
§ Accurate in all weather and light conditions § Reasonable cost § Simple to install and operate § Adequate technical support § Non-‐intrusive desired § Covers full lane width

Field Data Collection and Analysis § Inductive loops/piezoelectric sensors § Magnetometers by Sensys Networks § Multi-‐technology system by Migma § Tracking video by TrafficVision § Transportable Infrared Traffic Logger (TIRTL)

Test Locations
Daytona Beach, FL
New Ulm, TX
College Station, TX

S.H. 6 Test Facility
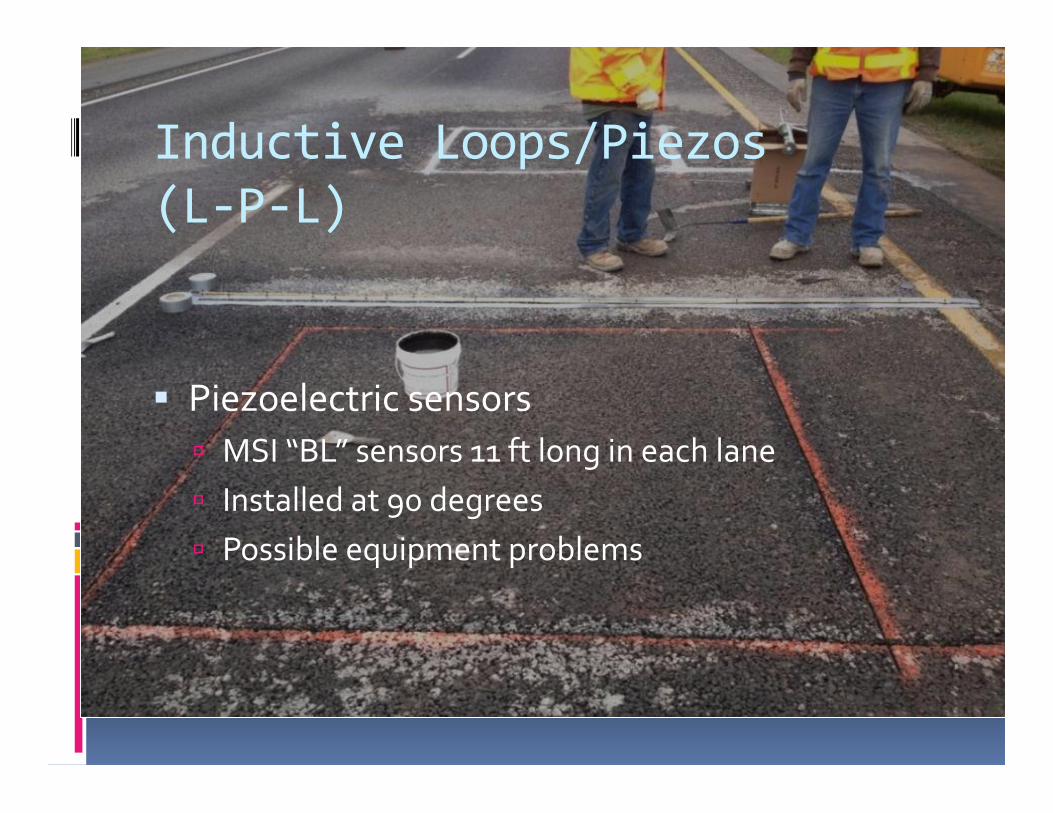
Inductive Loops/Piezos (L-‐P-‐L)
§ Piezoelectric sensors ú MSI “BL” sensors 11 ft long in each lane ú Installed at 90 degrees ú Possible equipment problems
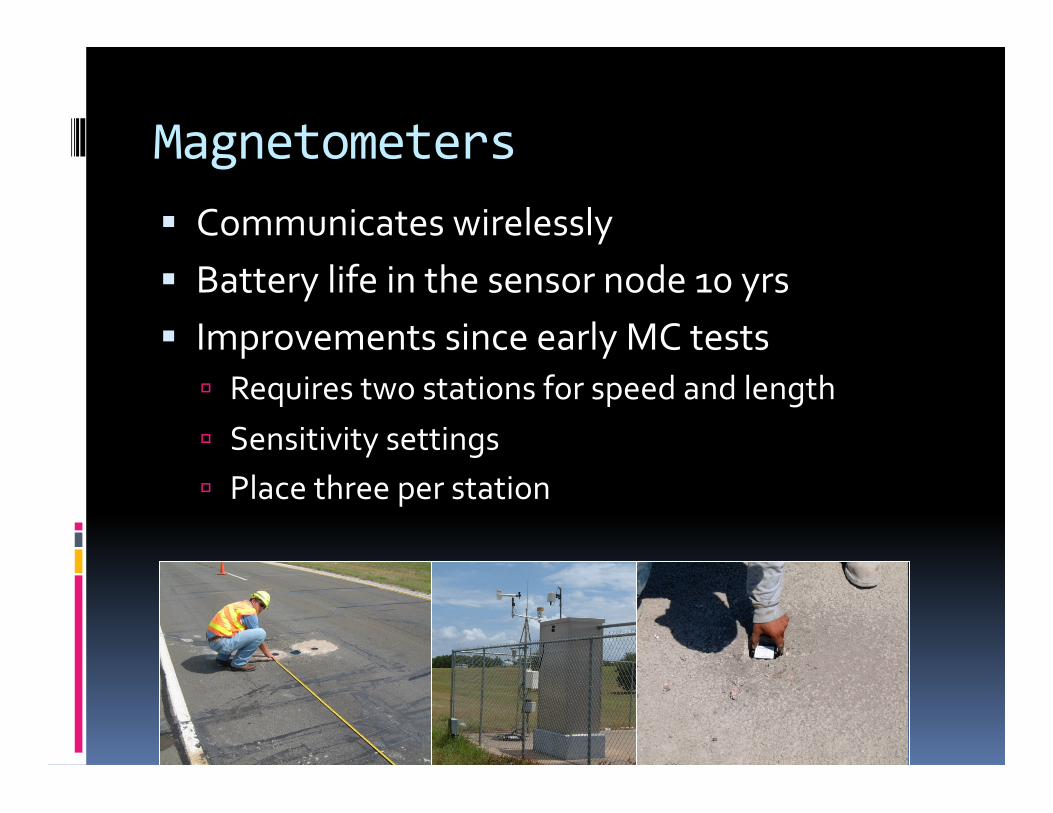
Magnetometers § Communicates wirelessly § Battery life in the sensor node 10 yrs § Improvements since early MC tests
ú Requires two stations for speed and length ú Sensitivity settings ú Place three per station
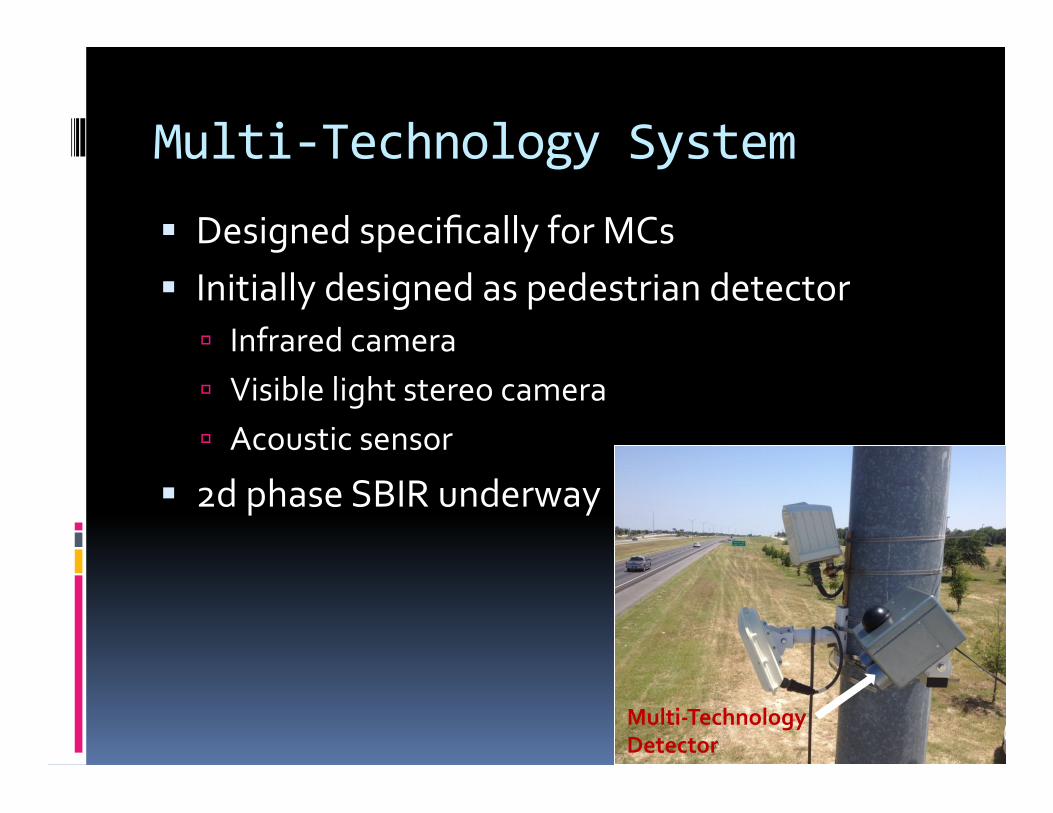
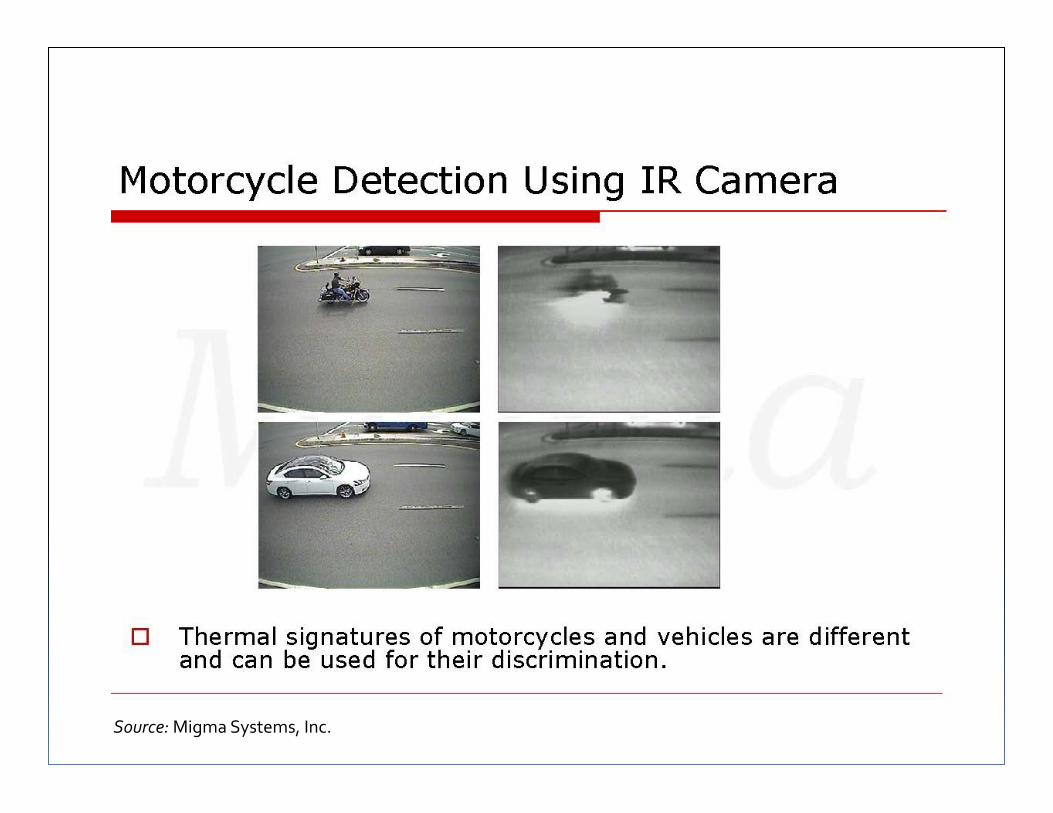
Multi-‐Technology System § Designed specifically for MCs § Initially designed as pedestrian detector
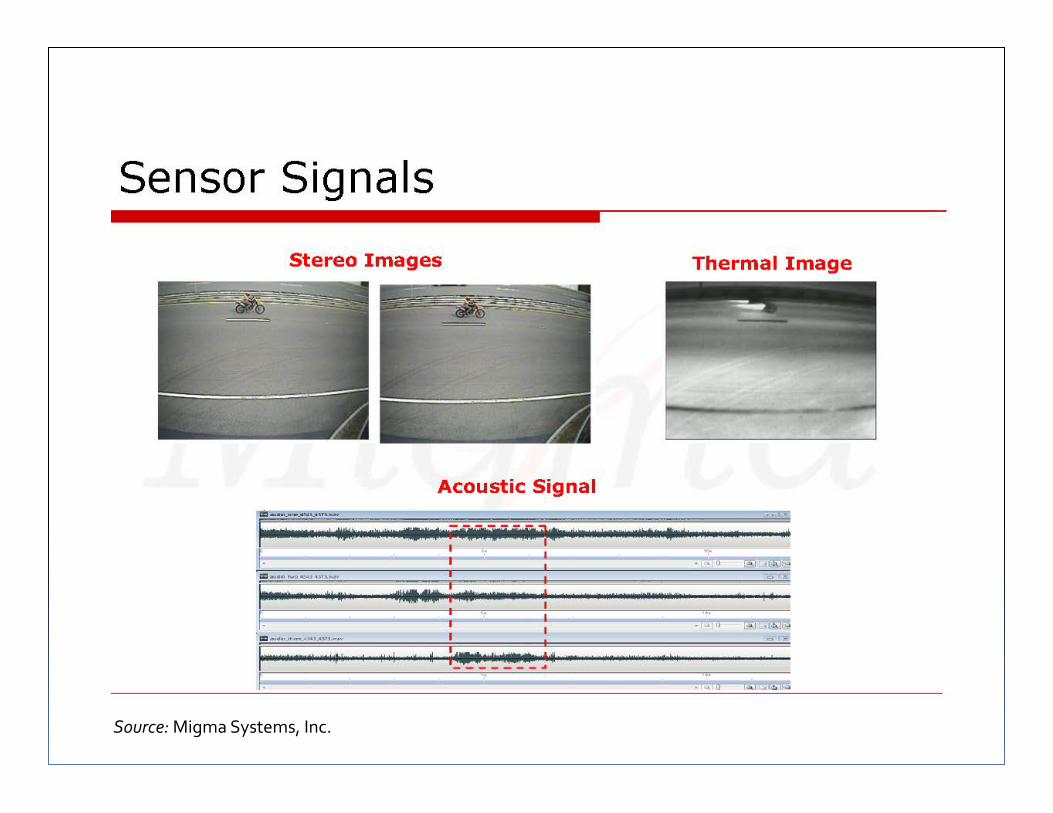
ú Infrared camera ú Visible light stereo camera ú Acoustic sensor
§ 2d phase SBIR underway
Multi-‐Technology Detector

Source: Migma Systems, Inc.
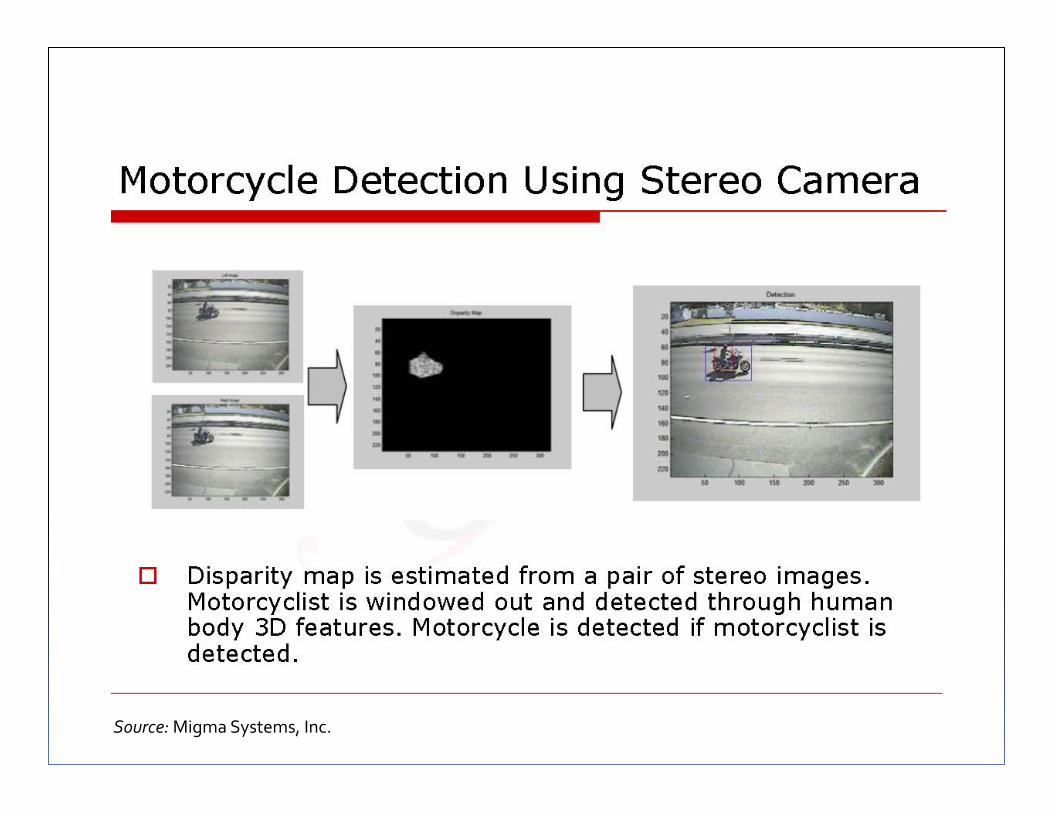
Source: Migma Systems, Inc.
Source: Migma Systems, Inc.
Source: Migma Systems, Inc.
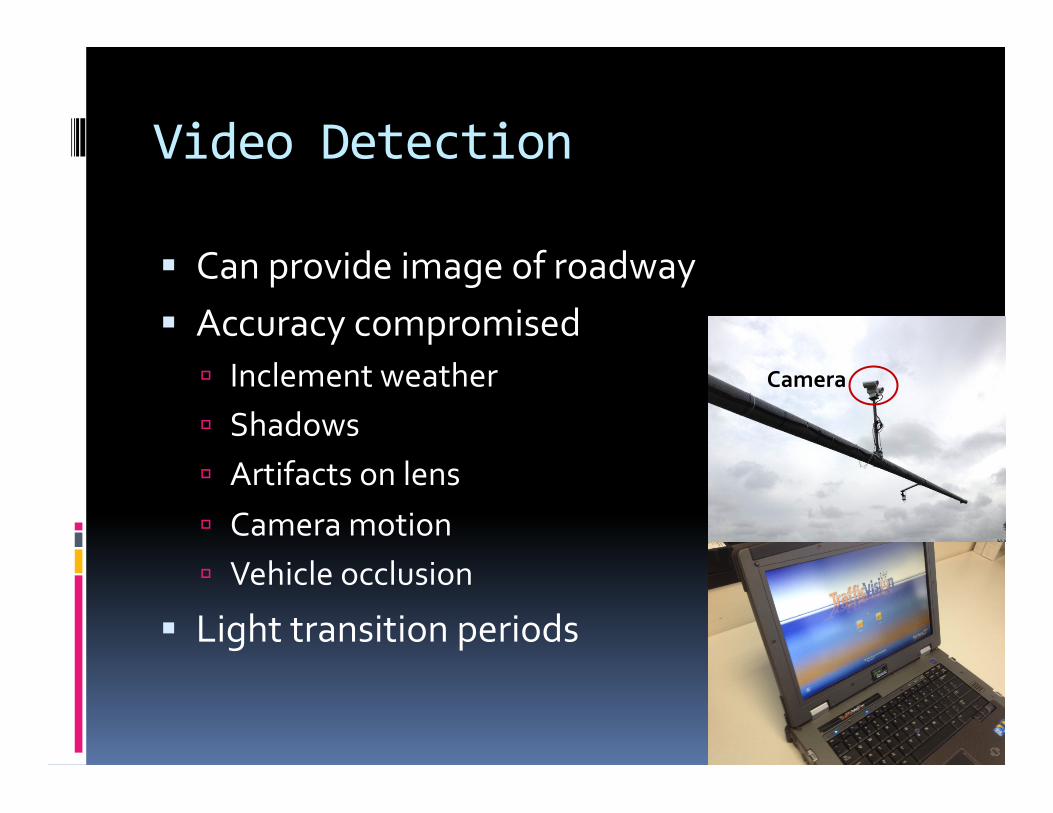
Video Detection
§ Can provide image of roadway § Accuracy compromised
ú Inclement weather ú Shadows ú Artifacts on lens ú Camera motion ú Vehicle occlusion
§ Light transition periods
Camera

TIRTL
§ Accurate for MC (& non-‐MC) detection § Classifies all 13 FHWA classes § Non-‐intrusive § Low power consumption § Portable or fixed § Cost competitive
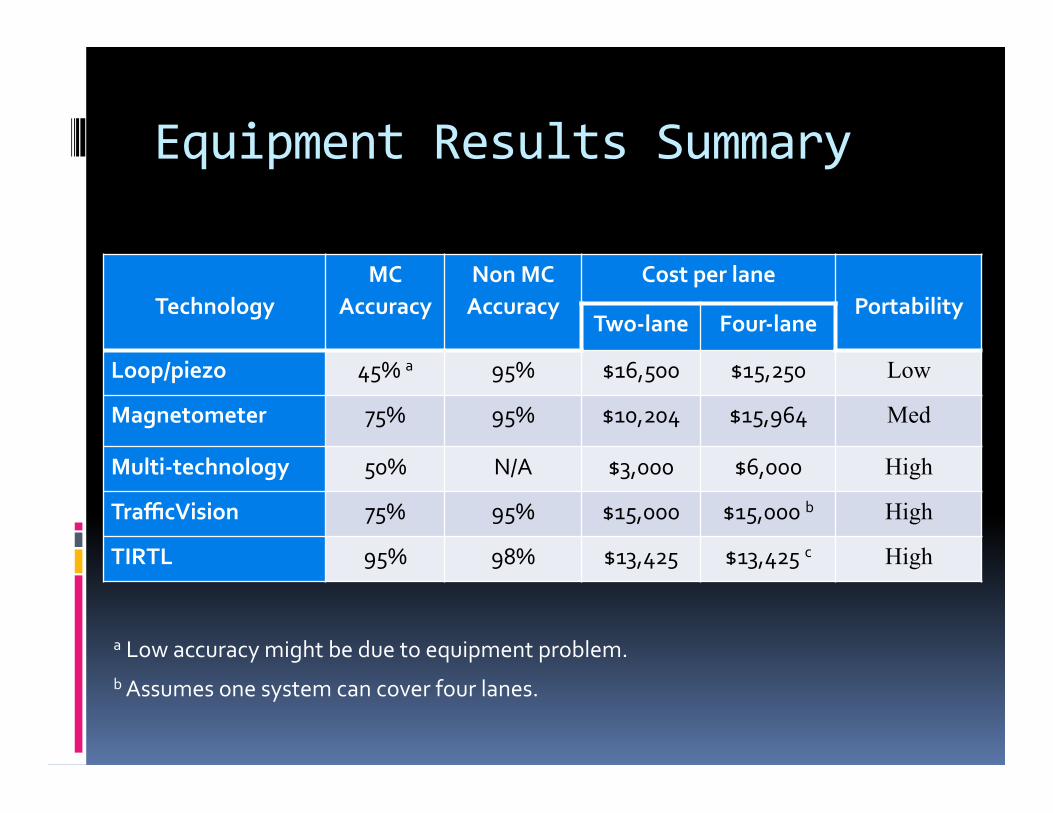
Equipment Results Summary
Technology
MC Accuracy
Non MC Accuracy
Cost per lane Portability
Two-‐lane Four-‐lane
Loop/piezo 45% a 95% $16,500 $15,250 Low
Magnetometer 75% 95% $10,204 $15,964 Med
Multi-‐technology 50% N/A $3,000 $6,000 High
TrafficVision 75% 95% $15,000 $15,000 b High
TIRTL 95% 98% $13,425 $13,425 c High
b Assumes one system can cover four lanes.
a Low accuracy might be due to equipment problem.
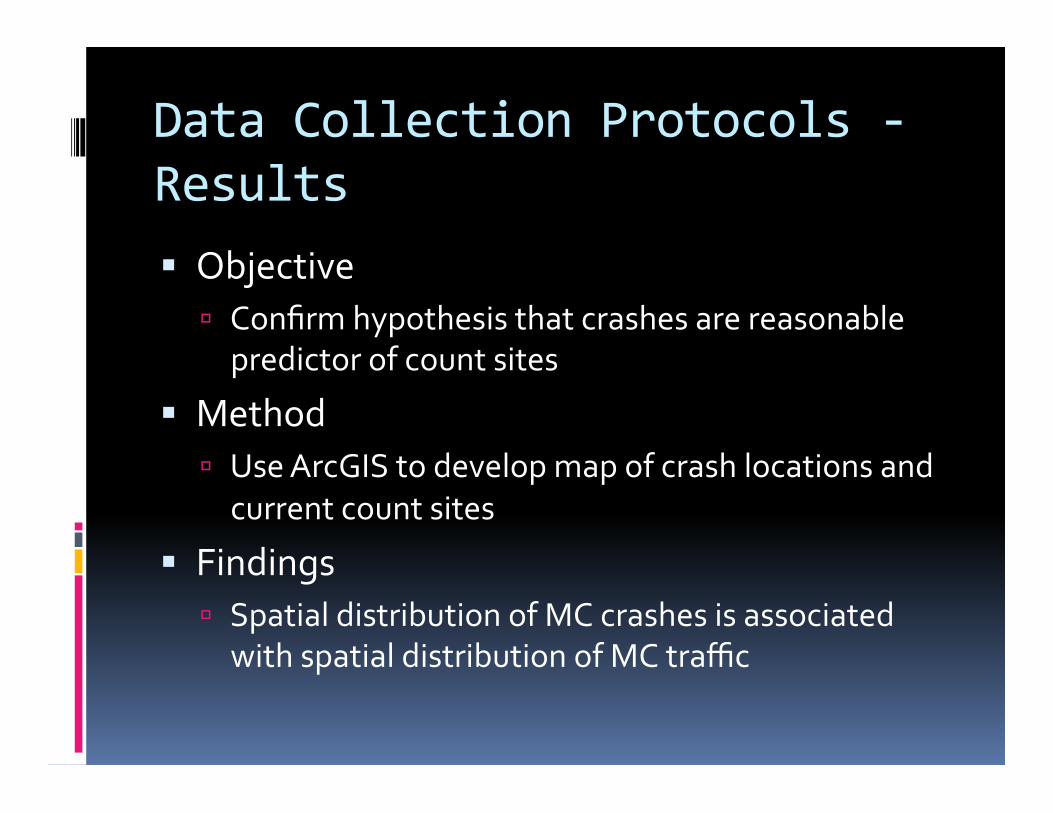
Data Collection Protocols -‐ Results § Objective
ú Confirm hypothesis that crashes are reasonable predictor of count sites
§ Method ú Use ArcGIS to develop map of crash locations and current count sites
§ Findings ú Spatial distribution of MC crashes is associated with spatial distribution of MC traffic
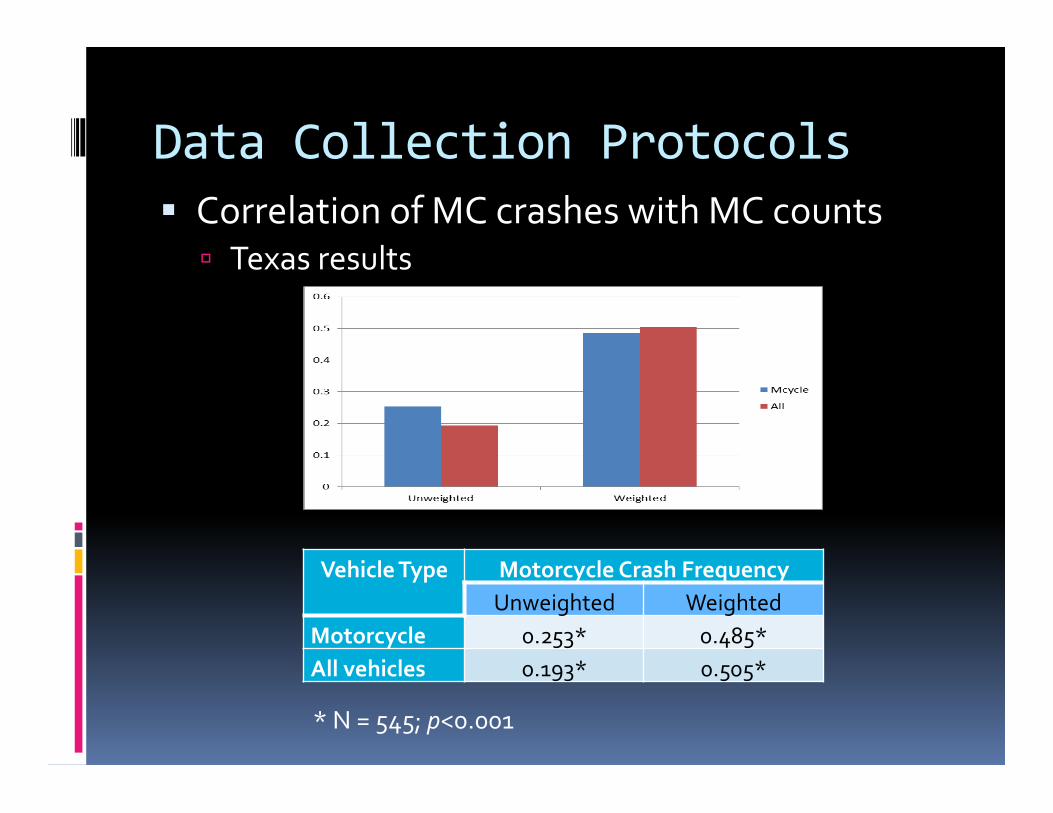
Data Collection Protocols § Correlation of MC crashes with MC counts
ú Texas results
Vehicle Type Motorcycle Crash Frequency Unweighted Weighted
Motorcycle 0.253* 0.485* All vehicles 0.193* 0.505*
* N = 545; p<0.001
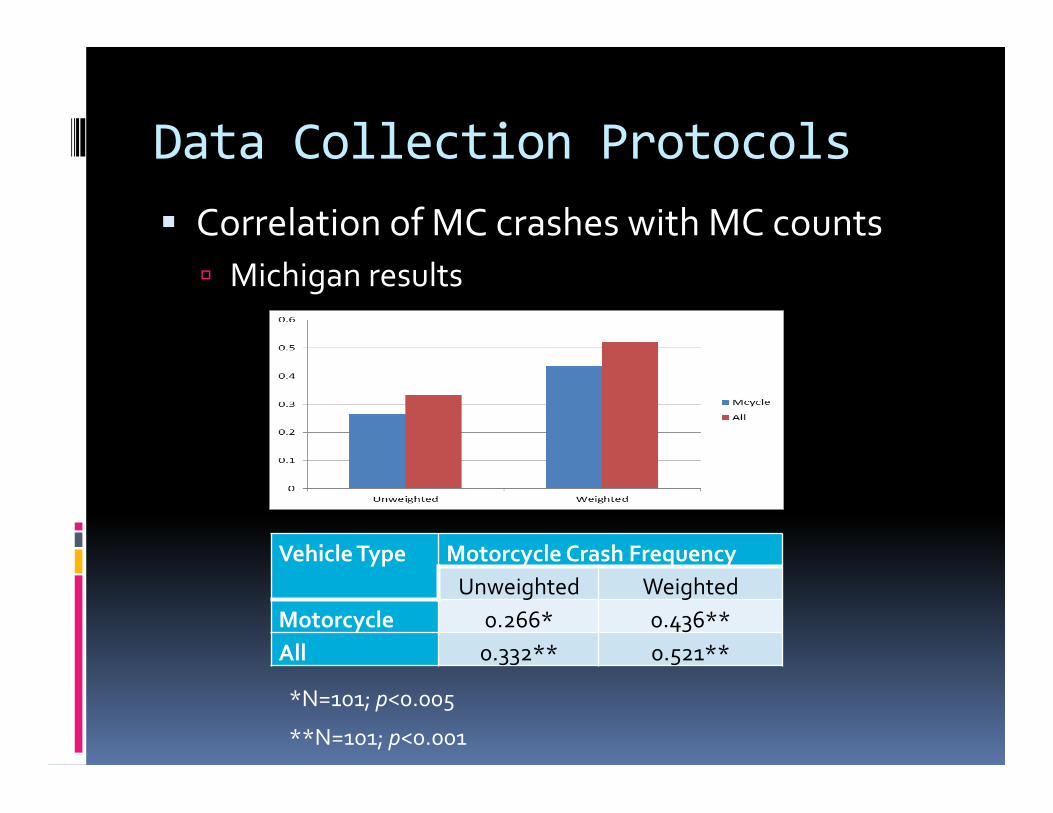
Data Collection Protocols § Correlation of MC crashes with MC counts
ú Michigan results
Vehicle Type Motorcycle Crash Frequency Unweighted Weighted
Motorcycle 0.266* 0.436** All 0.332** 0.521**
*N=101; p<0.005
**N=101; p<0.001
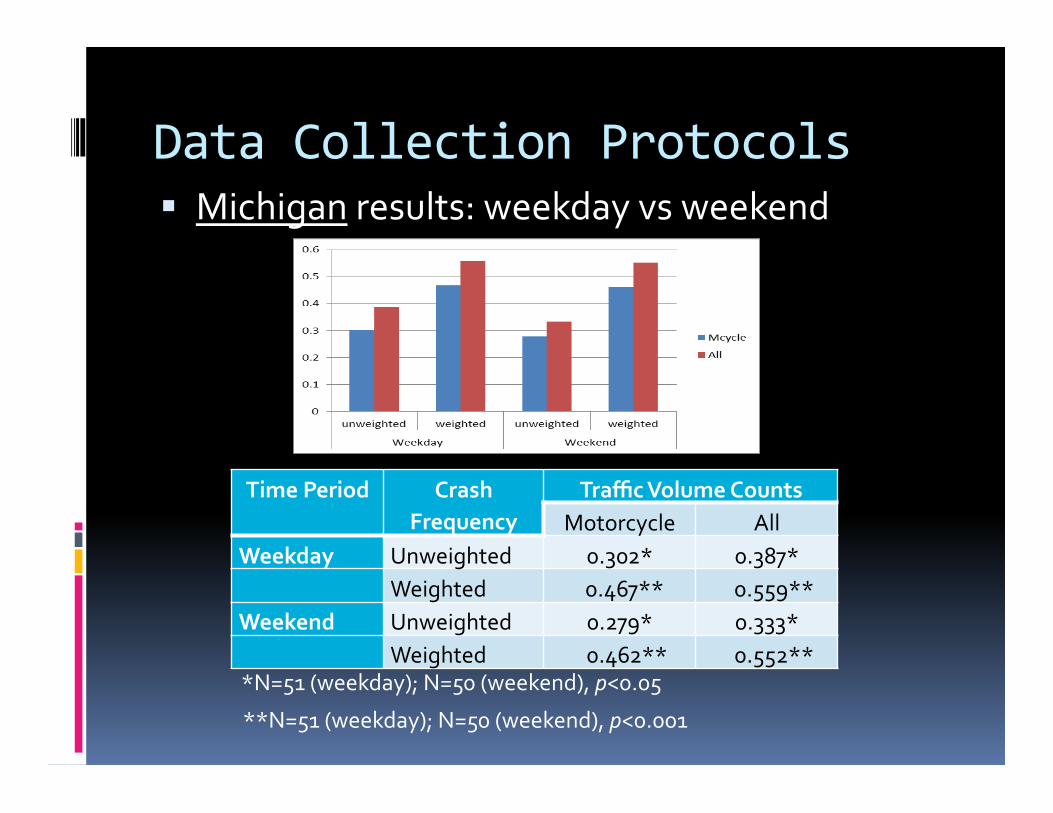
Data Collection Protocols § Michigan results: weekday vs weekend
Time Period Crash Frequency
Traffic Volume Counts Motorcycle All
Weekday Unweighted 0.302* 0.387* Weighted 0.467** 0.559**
Weekend Unweighted 0.279* 0.333* Weighted 0.462** 0.552**
*N=51 (weekday); N=50 (weekend), p<0.05
**N=51 (weekday); N=50 (weekend), p<0.001
Conclusions
§ Conclusions ú Improving motorcycle VMT accuracy
Selecting appropriate locations Choosing the best technology
Recommendations
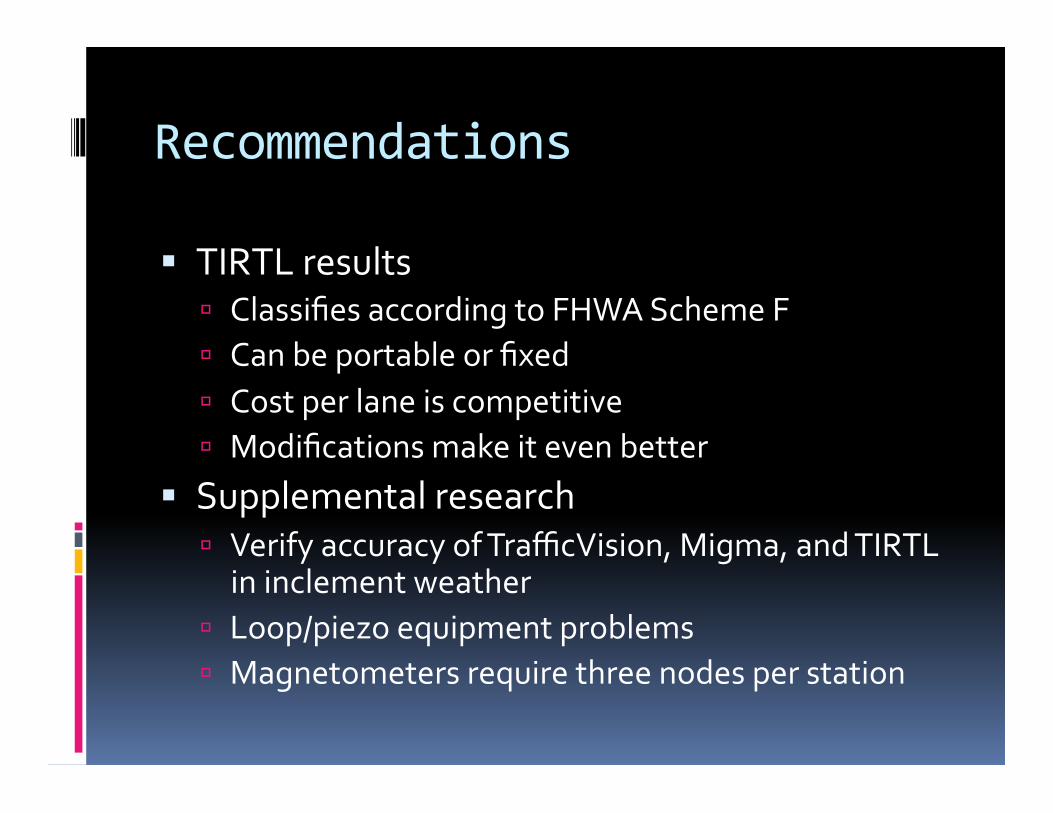
§ TIRTL results ú Classifies according to FHWA Scheme F ú Can be portable or fixed ú Cost per lane is competitive ú Modifications make it even better
§ Supplemental research ú Verify accuracy of TrafficVision, Migma, and TIRTL in inclement weather
ú Loop/piezo equipment problems ú Magnetometers require three nodes per station
Recommendations
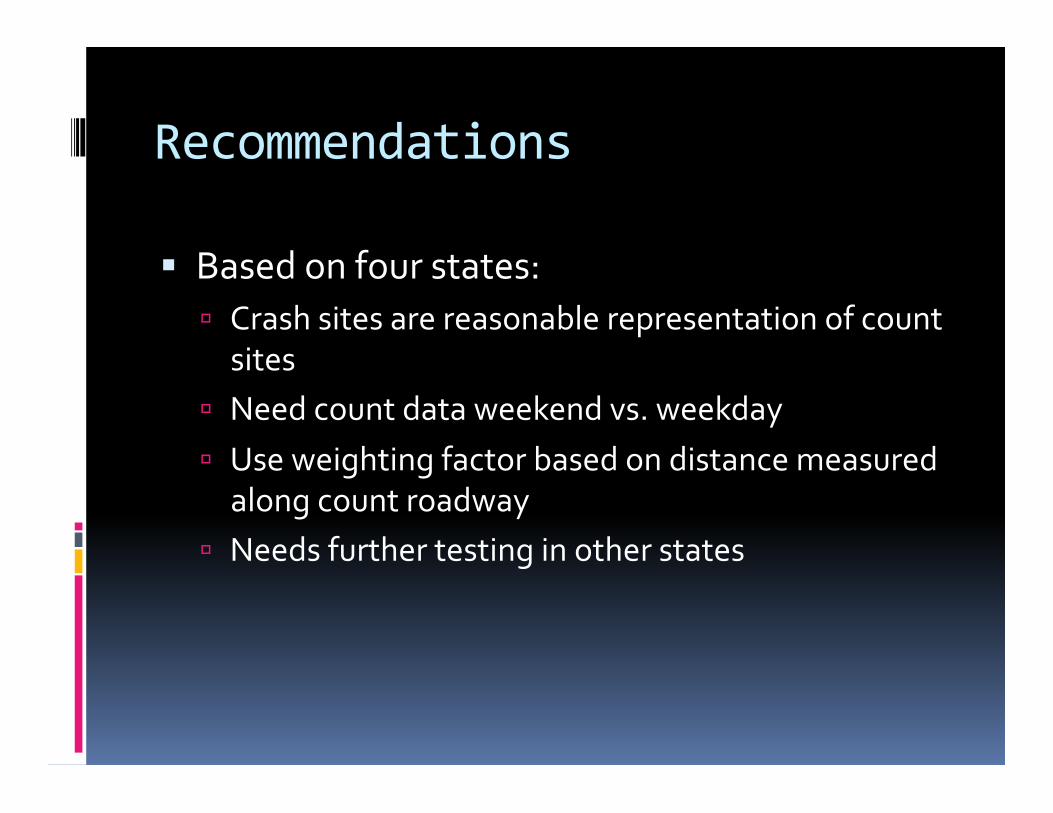
§ Based on four states: ú Crash sites are reasonable representation of count sites
ú Need count data weekend vs. weekday ú Use weighting factor based on distance measured along count roadway
ú Needs further testing in other states

Contact Information
Dan Middleton, Ph.D., P.E. Texas A&M Transportation Institute 2929 Research Parkway 3135 TAMU College Station , TX 77843-‐3135 Phone: (979) 845-‐7196 Email: d-‐[email protected]

Issues Involved in MC Detection
§ Motorcycle definition § Spatial and temporal factors § Lane discipline § Vehicle size § Vehicle occlusion

Motorcycle Definition
§ FHWA uses two categories ú Large motorcycles with 2 or 3 wheels ú Mopeds and scooters (requiring registration)
§ Some states define in other ways ú 2 or 3 wheels in contact with the ground ú A seat or saddle with sidecar/trailer ú A handlebar ú No enclosure for operator ú By size: engine HP or wheel diameter

Spatial & Temporal Factors
§ State methods might not be valid § Investigate spatial/temporal differences
ú Weekdays ú Weekends

Lane Discipline
§ Detector must cover the entire lane width § Shoulder detection § Between rows of cars (lanes)
Vehicle Size
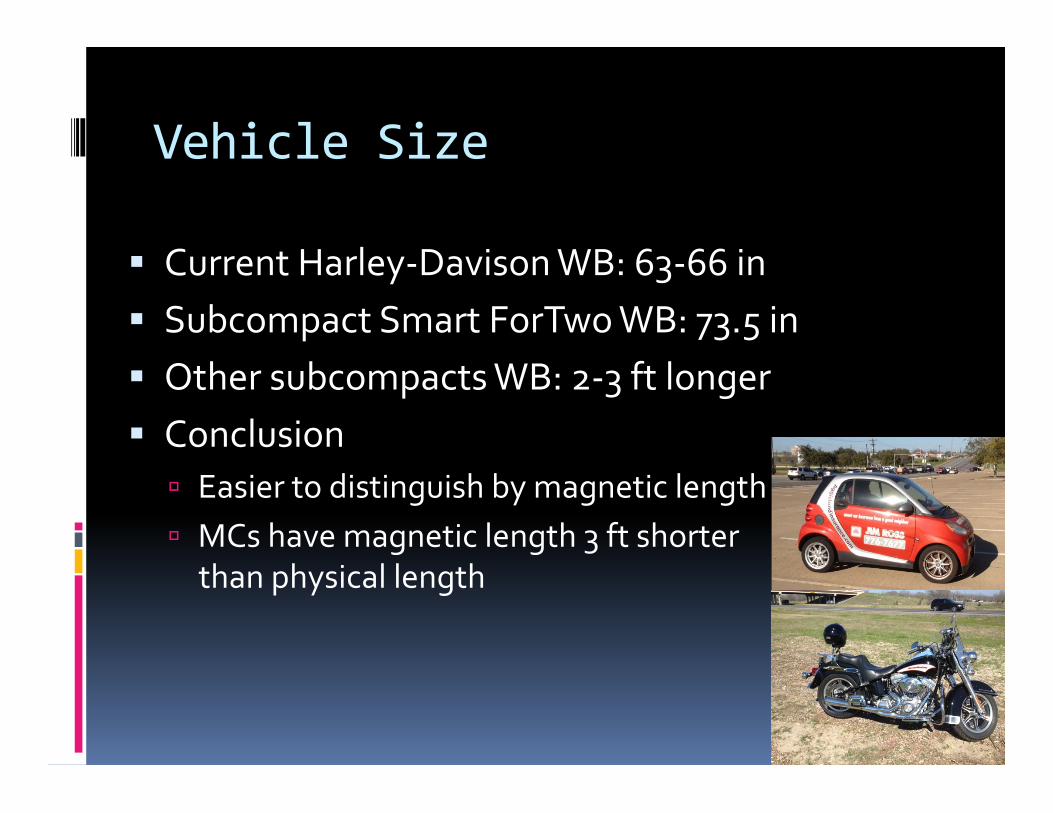
§ Current Harley-‐Davison WB: 63-‐66 in § Subcompact Smart ForTwo WB: 73.5 in § Other subcompacts WB: 2-‐3 ft longer § Conclusion
ú Easier to distinguish by magnetic length ú MCs have magnetic length 3 ft shorter than physical length

Vehicle Occlusion
§ MCs are often occluded by tall vehicles

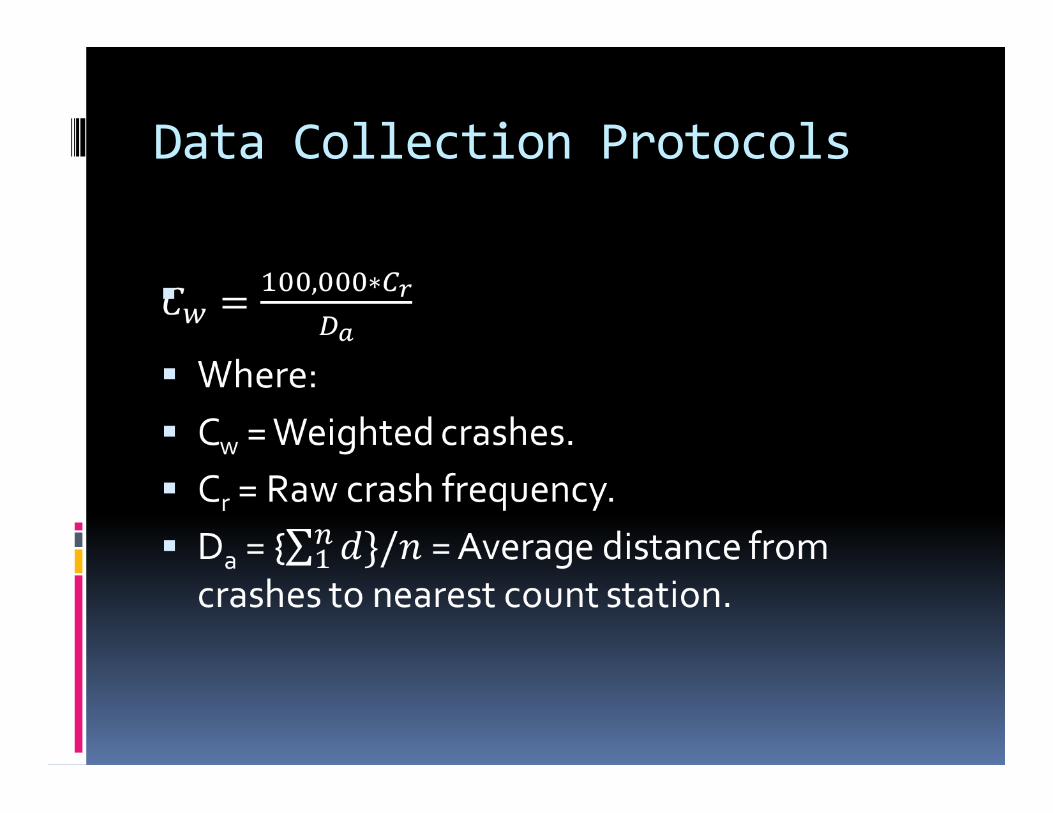
Data Collection Protocols
§
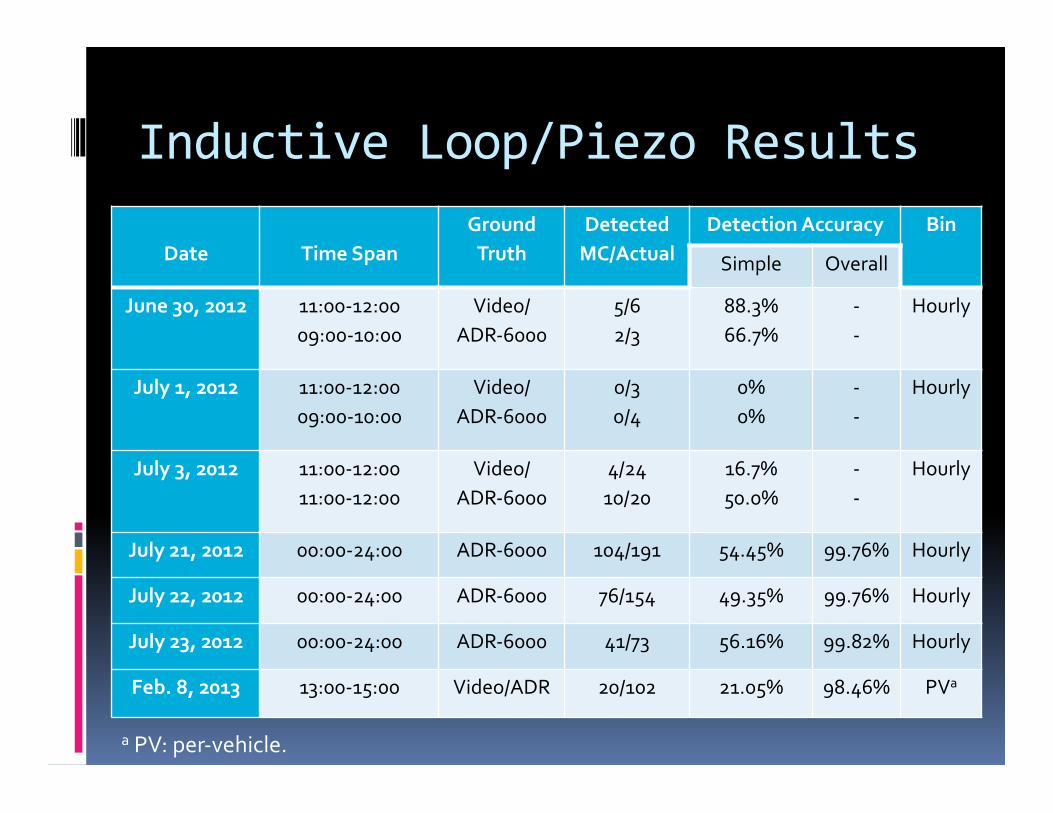
Inductive Loop/Piezo Results
Date
Time Span Ground Truth
Detected MC/Actual
Detection Accuracy Bin
Simple Overall
June 30, 2012 11:00-‐12:00 09:00-‐10:00
Video/ ADR-‐6000
5/6 2/3
88.3% 66.7%
-‐ -‐
Hourly
July 1, 2012 11:00-‐12:00 09:00-‐10:00
Video/ ADR-‐6000
0/3 0/4
0% 0%
-‐ -‐
Hourly
July 3, 2012 11:00-‐12:00 11:00-‐12:00
Video/ ADR-‐6000
4/24 10/20
16.7% 50.0%
-‐ -‐
Hourly
July 21, 2012 00:00-‐24:00 ADR-‐6000 104/191 54.45% 99.76% Hourly
July 22, 2012 00:00-‐24:00 ADR-‐6000 76/154 49.35% 99.76% Hourly
July 23, 2012 00:00-‐24:00 ADR-‐6000 41/73 56.16% 99.82% Hourly
Feb. 8, 2013 13:00-‐15:00 Video/ADR 20/102 21.05% 98.46% PVa
a PV: per-‐vehicle.

Magnetometer Results
Date
Time Span Ground Truth
Detected MC/Actual
Detect. Acc. Bin
Simple Overall June 30, 2012
-‐-‐ ADR-‐6000 TBD/TBD TBD TBD
TBD
July 1, 2012
-‐-‐ ADR-‐6000 TBD/TBD TBD TBD
TBD
Feb 22, 2013
15:00-‐16:00 Rec. Video 11/18 61.0% -- PVa
a Per vehicle.

Migma Results
Date
Time Span
Ground Truth
Detected MC/Actual
Detection Accuracy Bin
Simple Overall May 19, 2012 09:00-‐12:00 Video 143/206 69.42% 77.94% PV
Sept. 5, 2012 09:20-‐10:30 ADR-‐6000 26/45 57.80% -‐-‐ PV
Sept. 21, 2012 17:00-‐22:00 ADR-‐6000 21/46 45.65% -‐-‐ PV
Sept. 22, 2012 17:00-‐20:00 Video 13/22 59.09% -‐-‐ PV
Sept 23, 2012 17:00-‐20:00 Video 6/21 28.57% -‐-‐ PV
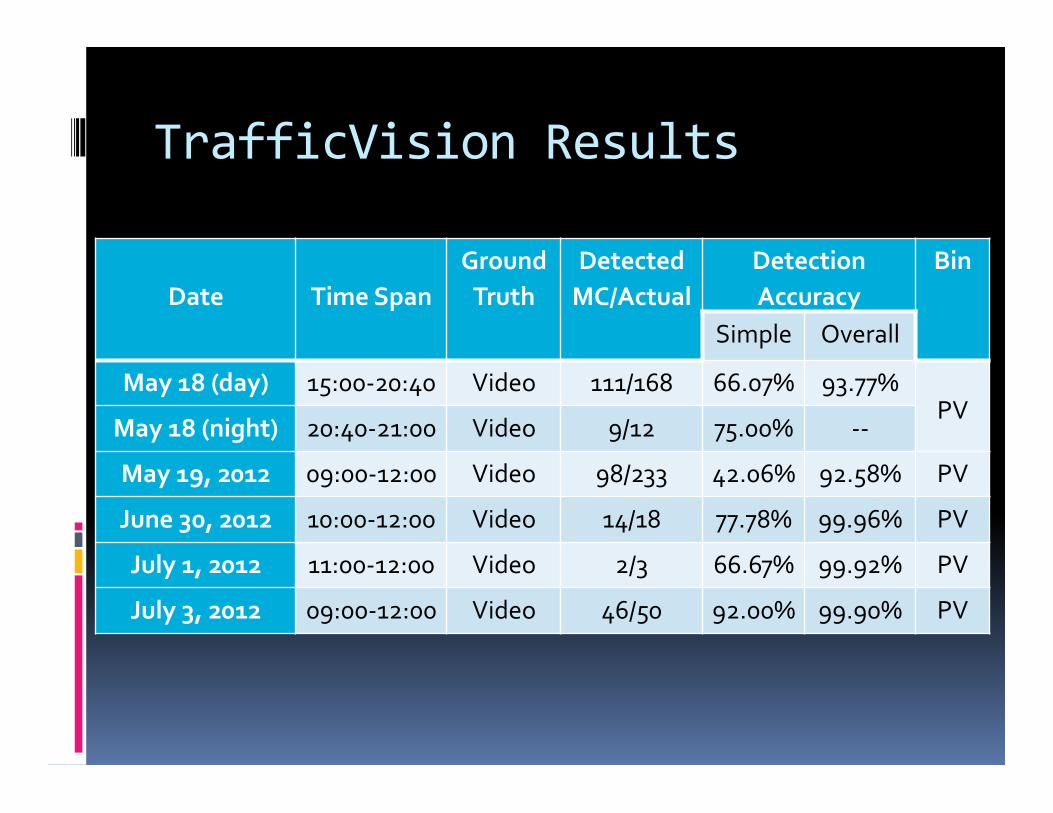
TrafficVision Results
Date
Time Span
Ground Truth
Detected MC/Actual
Detection Accuracy
Bin
Simple Overall
May 18 (day) 15:00-‐20:40 Video 111/168 66.07% 93.77% PV
May 18 (night) 20:40-‐21:00 Video 9/12 75.00% -‐-‐
May 19, 2012 09:00-‐12:00 Video 98/233 42.06% 92.58% PV
June 30, 2012 10:00-‐12:00 Video 14/18 77.78% 99.96% PV
July 1, 2012 11:00-‐12:00 Video 2/3 66.67% 99.92% PV
July 3, 2012 09:00-‐12:00 Video 46/50 92.00% 99.90% PV
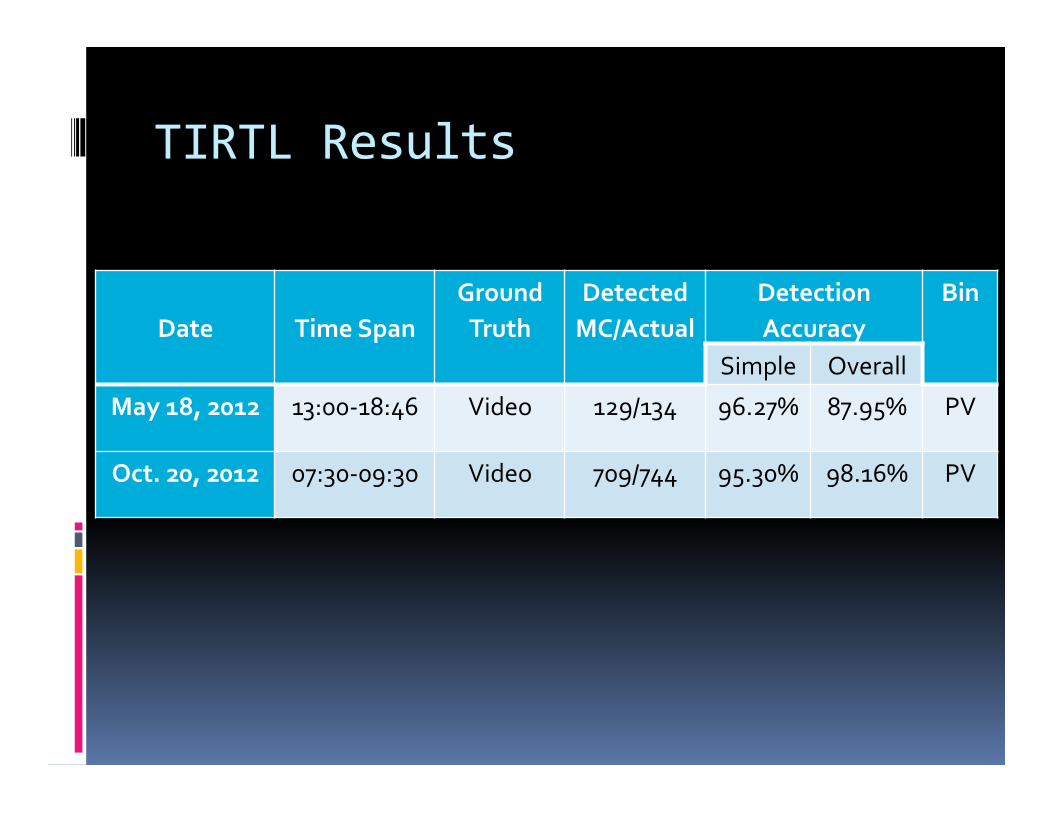
TIRTL Results
Date
Time Span
Ground Truth
Detected MC/Actual
Detection Accuracy
Bin
Simple Overall May 18, 2012 13:00-‐18:46 Video 129/134 96.27% 87.95% PV
Oct. 20, 2012 07:30-‐09:30 Video 709/744 95.30% 98.16% PV

Recommended