Missiles & Weapons Market in Perspective
Jeff RyderBAE Systems, Inc.January 23, 2008
1
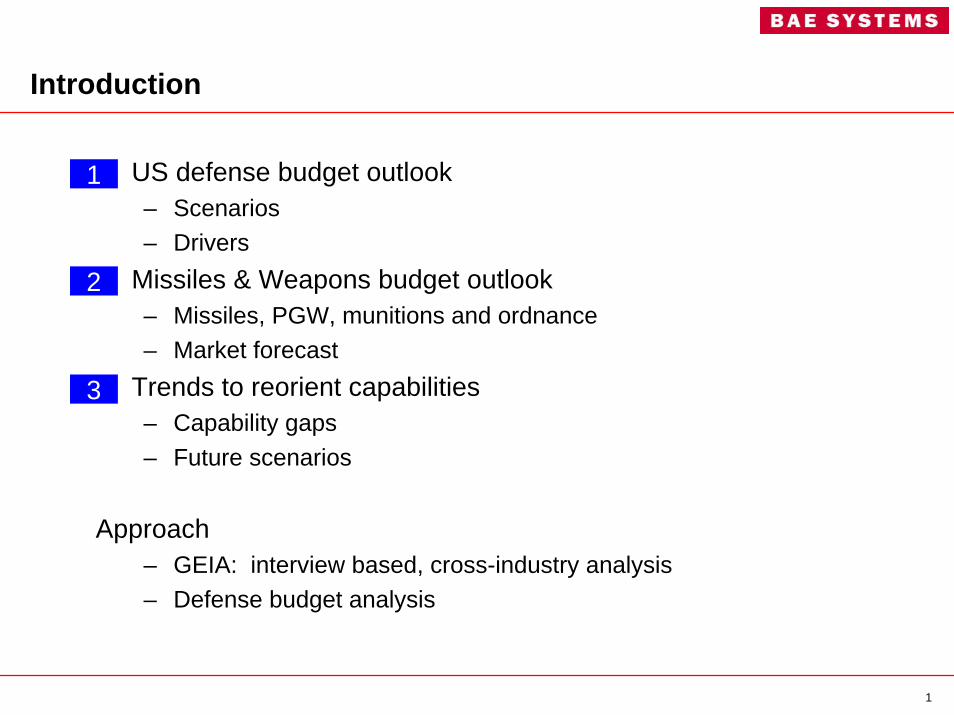
Introduction
US defense budget outlook– Scenarios– Drivers
• Missiles & Weapons budget outlook– Missiles, PGW, munitions and ordnance– Market forecast
• Trends to reorient capabilities– Capability gaps– Future scenarios
Approach– GEIA: interview based, cross-industry analysis– Defense budget analysis
1
2
3
2
0
100
200
300
400
500
600
700
1945 1948 1951 1954 1957 1960 1963 1966 1969 1972 1975 1978 1981 1984 1987 1990 1993 1996 1999 2002 2005 2008
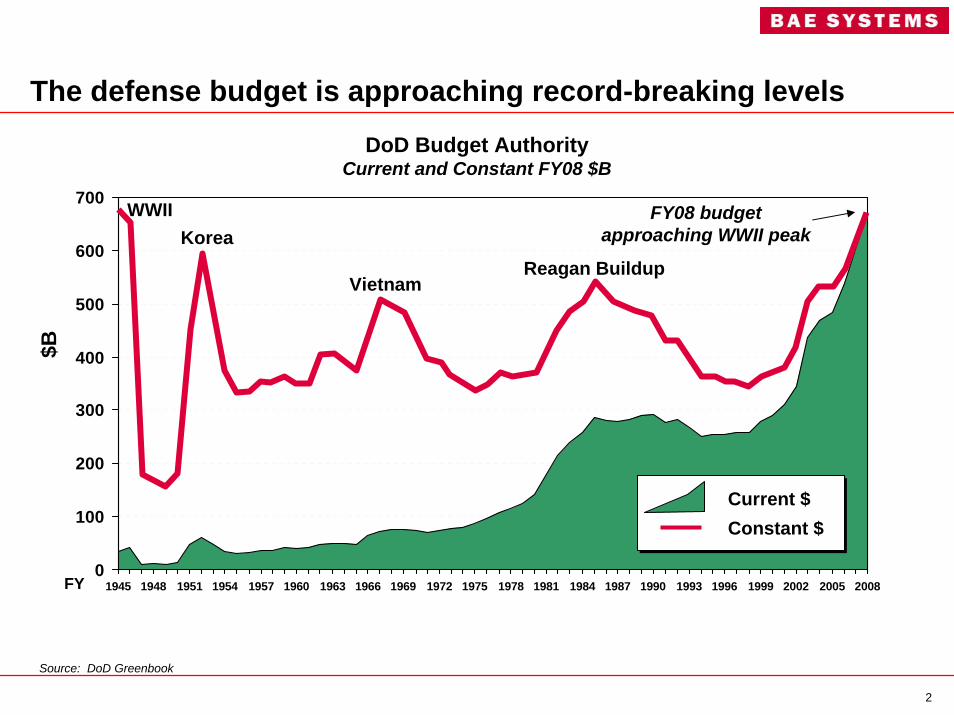
DoD Budget AuthorityCurrent and Constant FY08 $B
$B
The defense budget is approaching record-breaking levels
Constant $
FY
FY08 budget approaching WWII peakKorea
VietnamReagan Buildup
WWII
Source: DoD Greenbook
Current $
3
0
100
200
300
400
500
600
700
1948 1953 1958 1963 1968 1973 1978 1983 1988 1993 1998 2003 2008 2013 2018
Con
stan
t FY0
8 $B
FY08
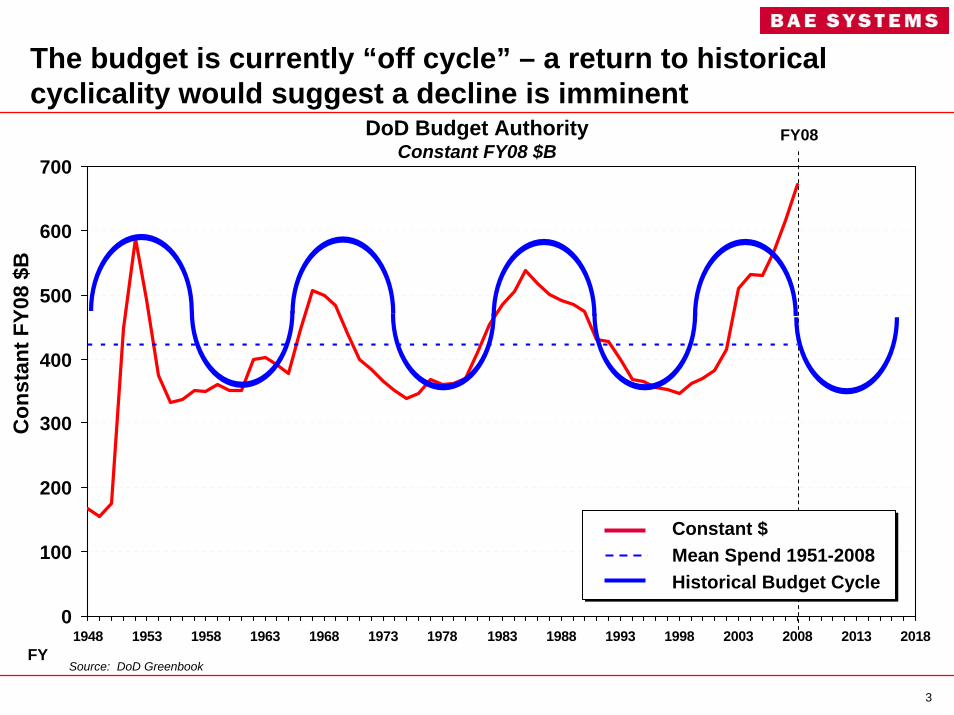
The budget is currently “off cycle” – a return to historical cyclicality would suggest a decline is imminent
Constant $Mean Spend 1951-2008Historical Budget Cycle
Source: DoD GreenbookFY
DoD Budget AuthorityConstant FY08 $B
4
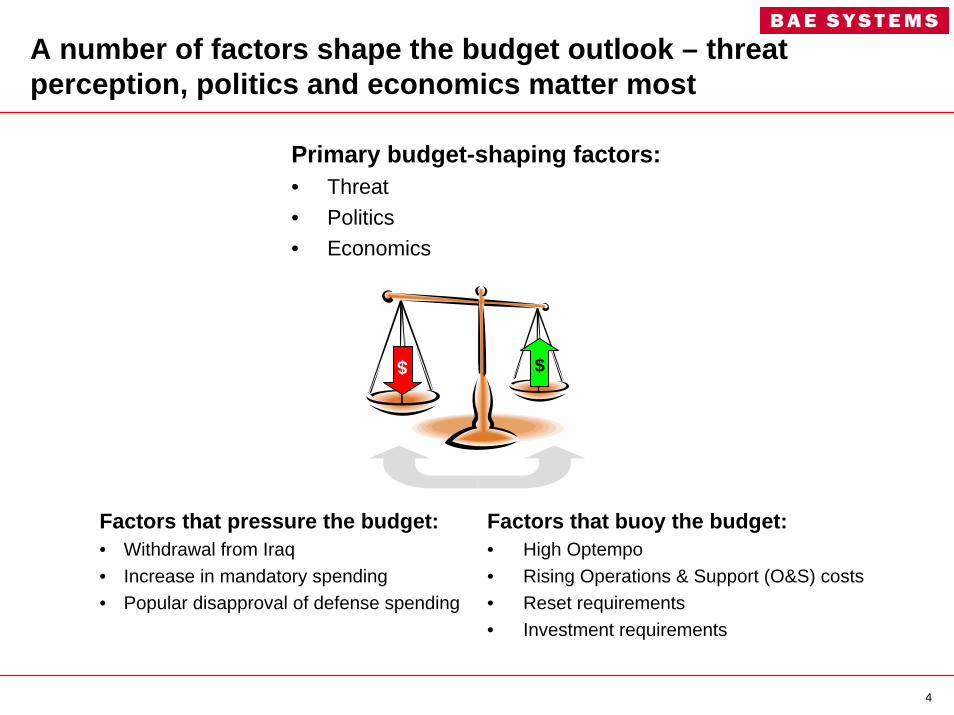
A number of factors shape the budget outlook – threat perception, politics and economics matter most
Factors that pressure the budget:• Withdrawal from Iraq• Increase in mandatory spending• Popular disapproval of defense spending
Factors that buoy the budget:• High Optempo• Rising Operations & Support (O&S) costs• Reset requirements• Investment requirements
Primary budget-shaping factors:• Threat• Politics• Economics
$$
5
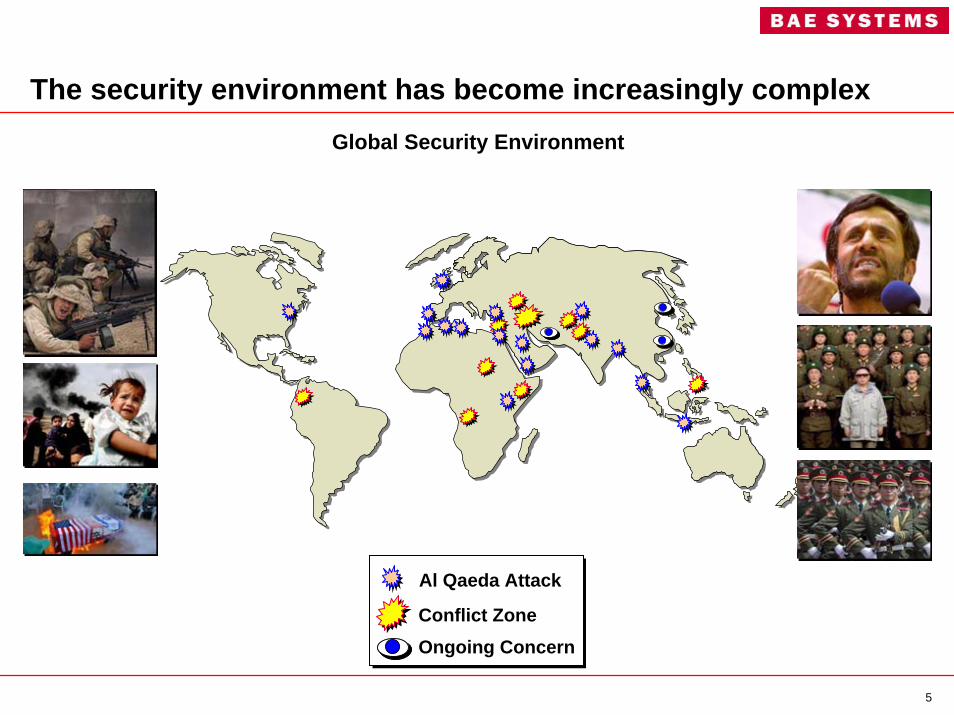
The security environment has become increasingly complexGlobal Security Environment
Conflict ZoneOngoing Concern
Al Qaeda Attack
6
0
500
1,000
1,500
2,000
2,500
3,000
3,500
4,000
4,500
2006 2007 2008 2009 2010 2011 2012 2013 2014 2015 2016 2017
Mandatory Interest Discretionary
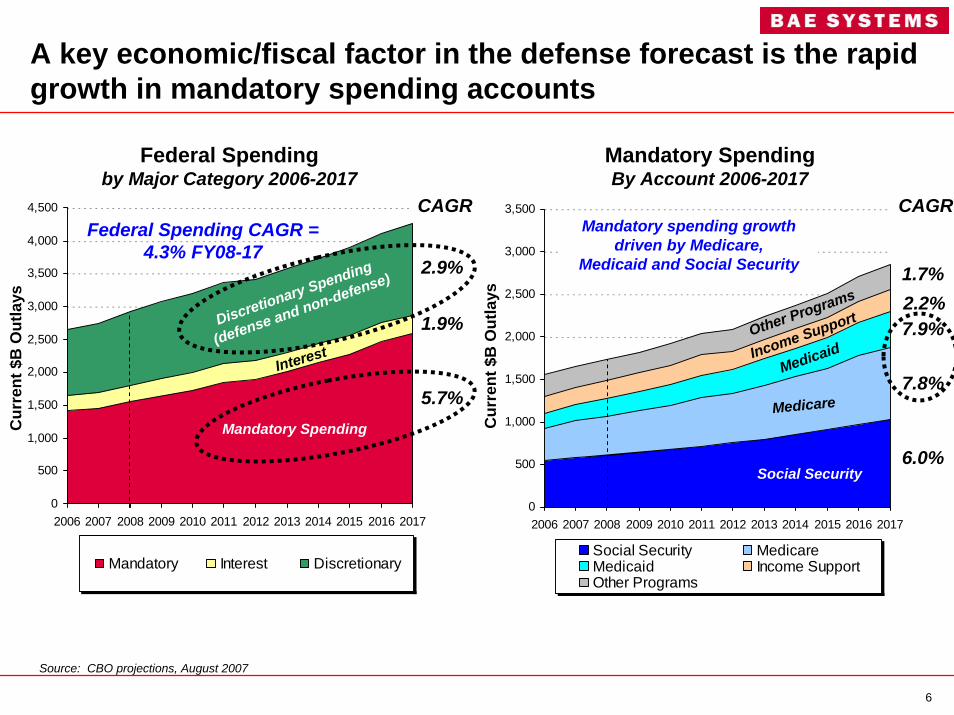
Federal Spendingby Major Category 2006-2017
Cur
rent
$B
Out
lays
A key economic/fiscal factor in the defense forecast is the rapid growth in mandatory spending accounts
0
500
1,000
1,500
2,000
2,500
3,000
3,500
2006 2007 2008 2009 2010 2011 2012 2013 2014 2015 2016 2017
Social Security MedicareMedicaid Income SupportOther Programs
Cur
rent
$B
Out
lays
5.7%
1.9%
2.9%
CAGR
6.0%
7.9%
1.7%
CAGR
7.8%
2.2%
Social Security
Medicare
MedicaidIncome SupportOther Programs
Mandatory Spending
Interest
Discretionary Spending
(defense and non-defense)
Mandatory SpendingBy Account 2006-2017
Mandatory spending growth driven by Medicare,
Medicaid and Social Security
Federal Spending CAGR = 4.3% FY08-17
Source: CBO projections, August 2007
7
250
300
350
400
450
500
550
600
650
700
750
2001 2002 2003 2004 2005 2006 2007 2008 2009 2010 2011 2012 2013 2014 2015 2016 2017 2018
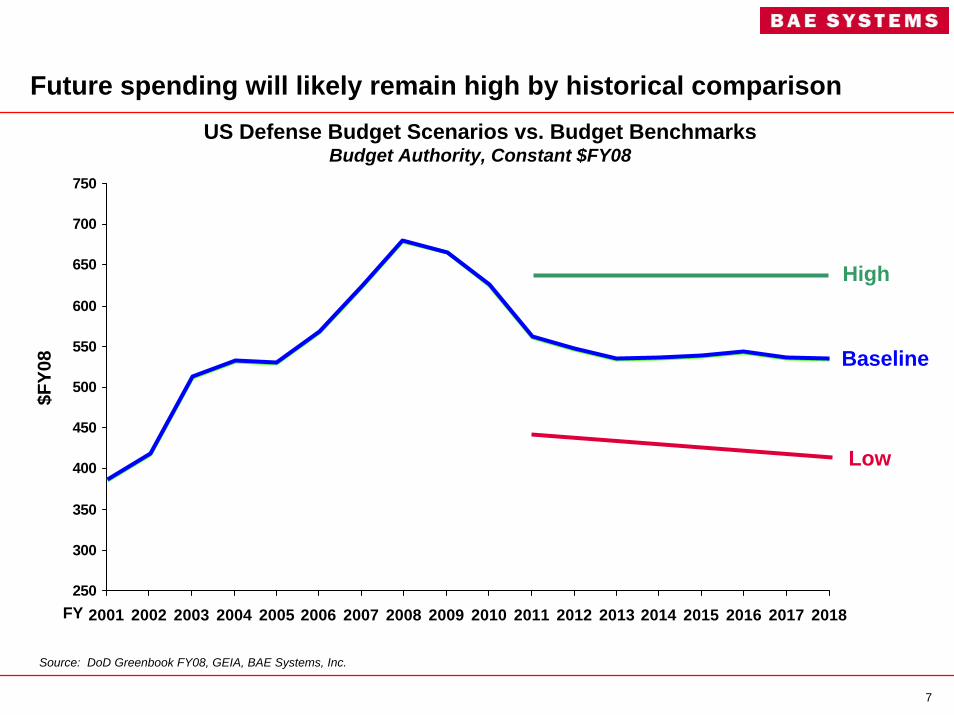
US Defense Budget Scenarios vs. Budget BenchmarksBudget Authority, Constant $FY08
FY
Future spending will likely remain high by historical comparison$F
Y08
Source: DoD Greenbook FY08, GEIA, BAE Systems, Inc.
High
Low
Baseline
8
0
50
100
150
200
250
1960
1964
1968
1972
1976
1980
1984
1988
1992
1996
2000
2004
2008
0
50
100
150
200
250
1960
1964
1968
1972
1976
1980
1984
1988
1992
1996
2000
2004
2008
MilPers $ per Soldier
O&M $ per Soldier
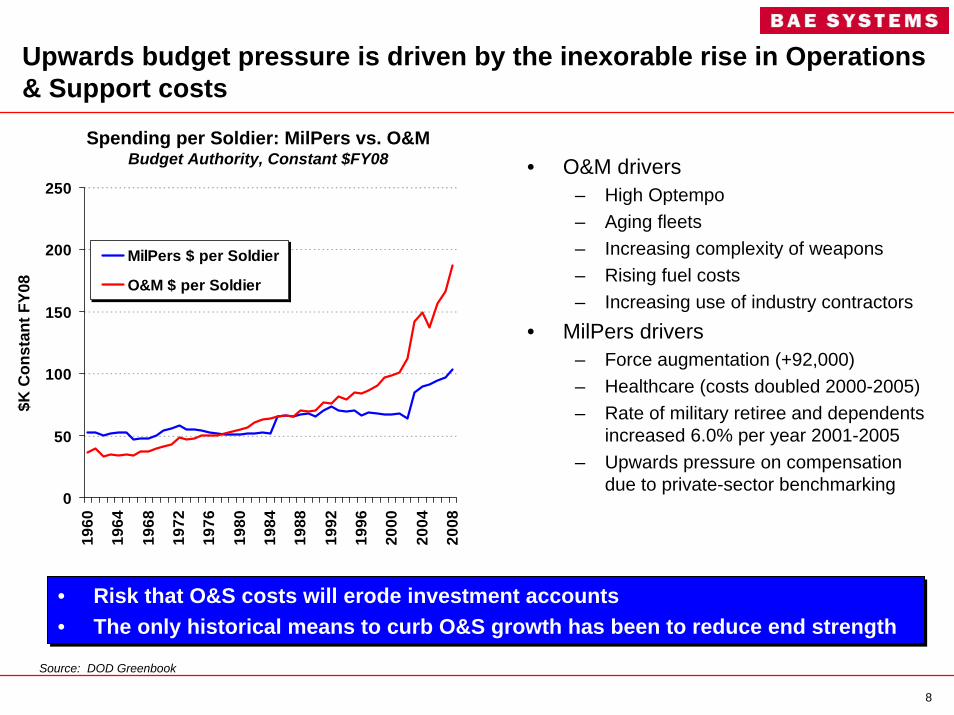
Spending per Soldier: MilPers vs. O&MBudget Authority, Constant $FY08
$K C
onst
ant F
Y08
Spending per Soldier: O&SBudget Authority, Constant $FY08
Bud
get A
utho
rity
per S
oldi
er
(Con
stan
t $K
)
1960s0.1%
1970s1.0%
1980s1.0%
1990s1.9%
2000-20082.3%
CAGR
Without supplemental spending
Upwards budget pressure is driven by the inexorable rise in Operations & Support costs
Source: DOD Greenbook
Without supplemental spending
• O&M drivers– High Optempo– Aging fleets– Increasing complexity of weapons– Rising fuel costs– Increasing use of industry contractors
• MilPers drivers– Force augmentation (+92,000)– Healthcare (costs doubled 2000-2005)– Rate of military retiree and dependents
increased 6.0% per year 2001-2005– Upwards pressure on compensation
due to private-sector benchmarking
• Risk that O&S costs will erode investment accounts• The only historical means to curb O&S growth has been to reduce end strength• Risk that O&S costs will erode investment accounts• The only historical means to curb O&S growth has been to reduce end strength
9
$0
$50
$100
$150
$200
$250
2002
2003
2004
2005
2006
2007
2008
2009
2010
2011
2012
2013
2014
2015
2016
2017
2018
Fiscal Year
Con
stan
t $B
Source: DoD Greenbook FY08, GEIA
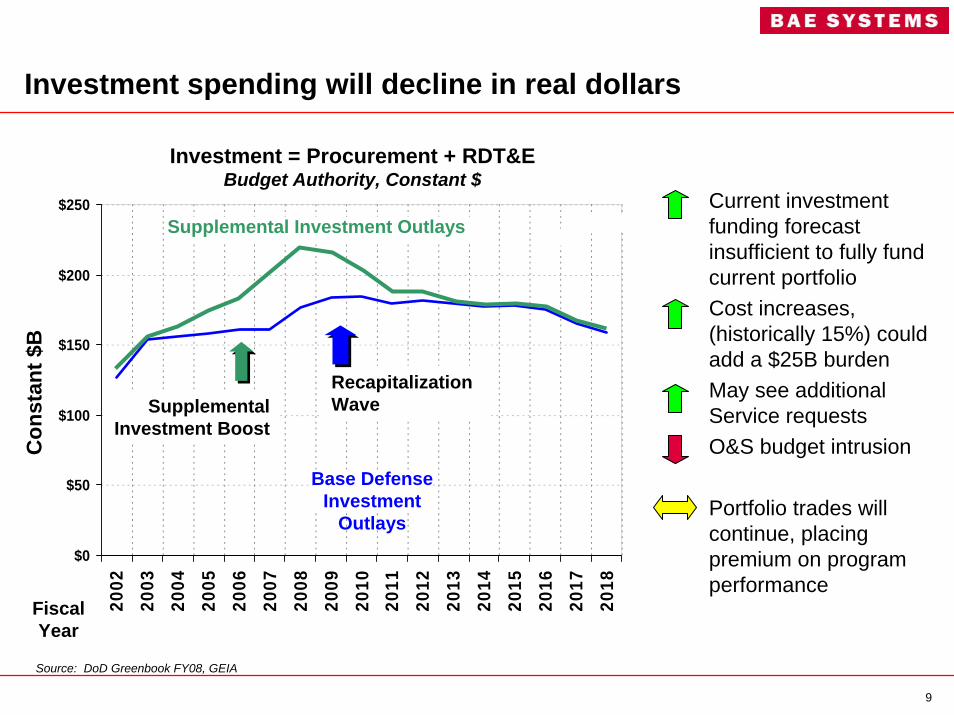
Investment = Procurement + RDT&EBudget Authority, Constant $
Investment spending will decline in real dollars
Recapitalization Wave
Base Defense Investment
Outlays
Supplemental Investment Boost
Supplemental Investment Outlays• Current investment
funding forecast insufficient to fully fund current portfolio
• Cost increases, (historically 15%) could add a $25B burden
• May see additional Service requests
• O&S budget intrusion
• Portfolio trades will continue, placing premium on program performance
10
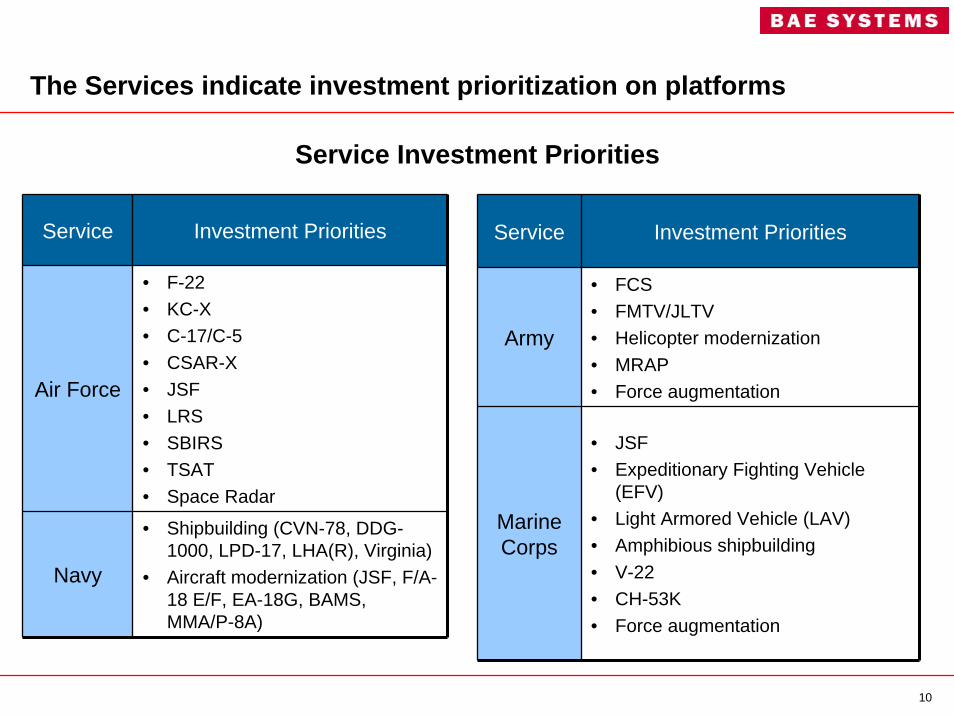
The Services indicate investment prioritization on platforms
Service Investment Priorities
Air Force
• F-22• KC-X• C-17/C-5• CSAR-X• JSF• LRS • SBIRS• TSAT• Space Radar
Navy
• Shipbuilding (CVN-78, DDG-1000, LPD-17, LHA(R), Virginia)
• Aircraft modernization (JSF, F/A-18 E/F, EA-18G, BAMS, MMA/P-8A)
Service Investment Priorities
Army
• FCS• FMTV/JLTV• Helicopter modernization• MRAP• Force augmentation
Marine Corps
• JSF• Expeditionary Fighting Vehicle
(EFV)• Light Armored Vehicle (LAV)• Amphibious shipbuilding• V-22• CH-53K• Force augmentation
Service Investment Priorities
11
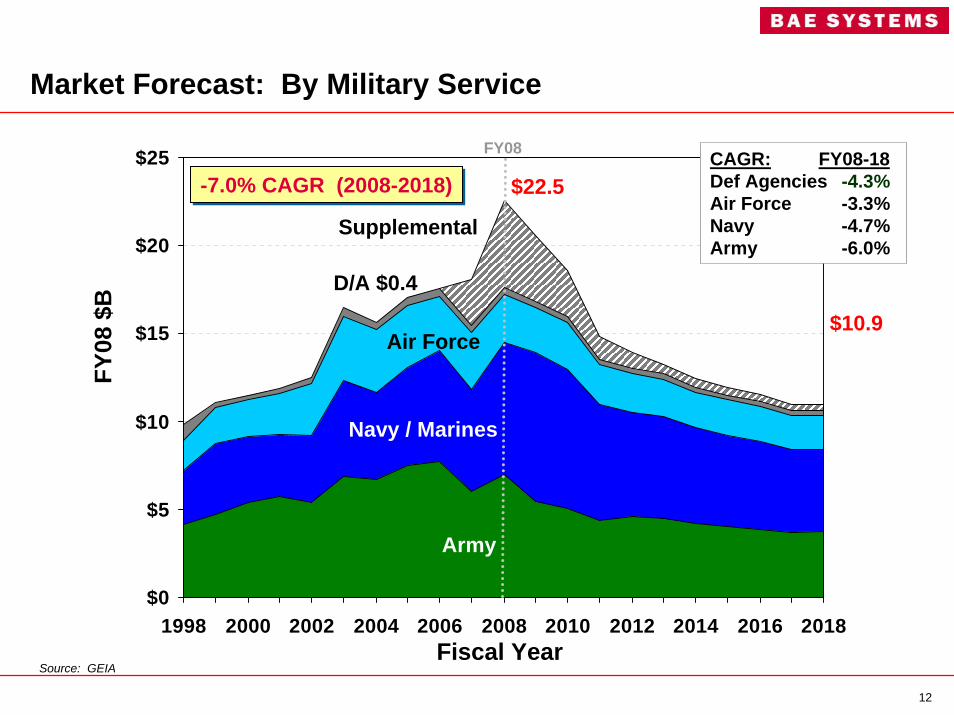
• Spending profile shows few new program starts– Emphasis on improving and upgrading legacy systems – Iraq/GWOT driving primary requirements and capability gaps– Replenishment for expended ordnance and fatigue– Force Augmentation (Army, USMC) in near term
• Missiles & weapons budget will decline over the forecast period– Pressure on topline and between Services– Supplemental war funding expected to drop off in near term– Several major programs have/will be winding down– Concern weapons will become bill payer for platforms
Missiles & Weapons budgets will decline over the next decade, with emphasis on upgrades as opposed to new starts
Source: GEIA
12
$0
$5
$10
$15
$20
$25
1998 2000 2002 2004 2006 2008 2010 2012 2014 2016 2018
Navy / Marines
Army
Air Force
CAGR: FY08-18Def Agencies -4.3%Air Force -3.3%Navy -4.7%Army -6.0%
$22.5$22.5
D/A $0.4
$10.9$10.9
FY08
-7.0% CAGR (2008-2018)-7.0% CAGR (2008-2018)
FY08
$B
Fiscal Year
Supplemental
Source: GEIA
Market Forecast: By Military Service
13
$0
$5
$10
$15
$20
$25
1998 2000 2002 2004 2006 2008 2010 2012 2014 2016 2018
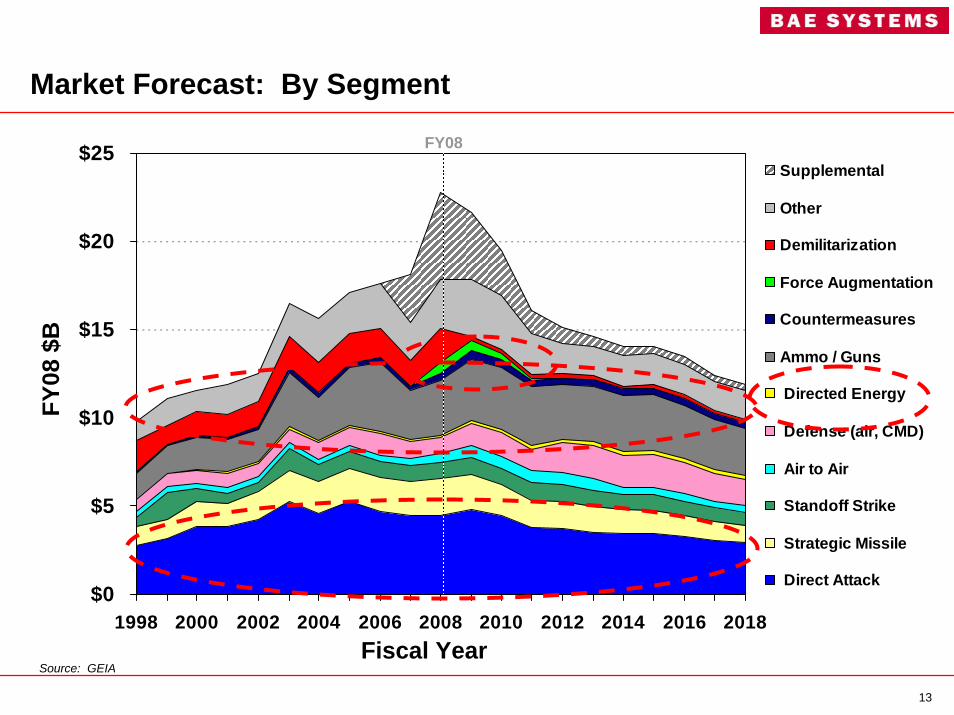
Supplemental
Other
Demilitarization
Force Augmentation
Countermeasures
Ammo / Guns
Directed Energy
Defense (air, CMD)
Air to Air
Standoff Strike
Strategic Missile
Direct Attack
FY08
FY08
$B
Fiscal Year
Market Forecast: By Segment
Source: GEIA
14
$0
$5
$10
$15
$20
$25
1998 2000 2002 2004 2006 2008 2010 2012 2014 2016 2018
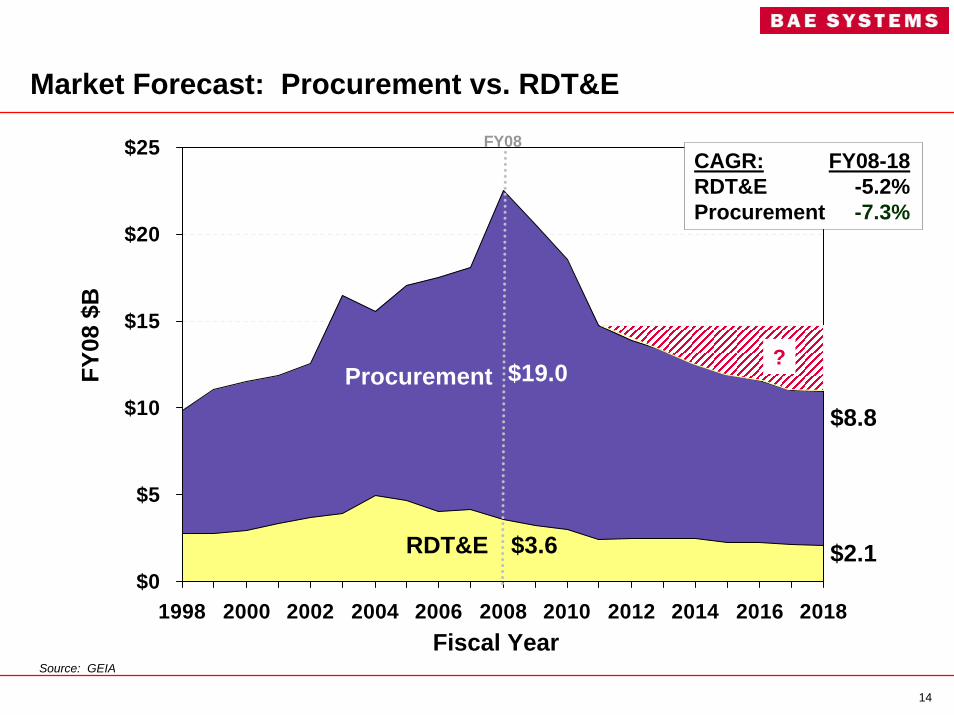
$19.0
$3.6 $2.1$2.1RDT&E
ProcurementFY08
$B
Fiscal Year
$8.8$8.8
FY08CAGR: FY08-18RDT&E -5.2%Procurement -7.3%
Market Forecast: Procurement vs. RDT&E
Source: GEIA
?
15
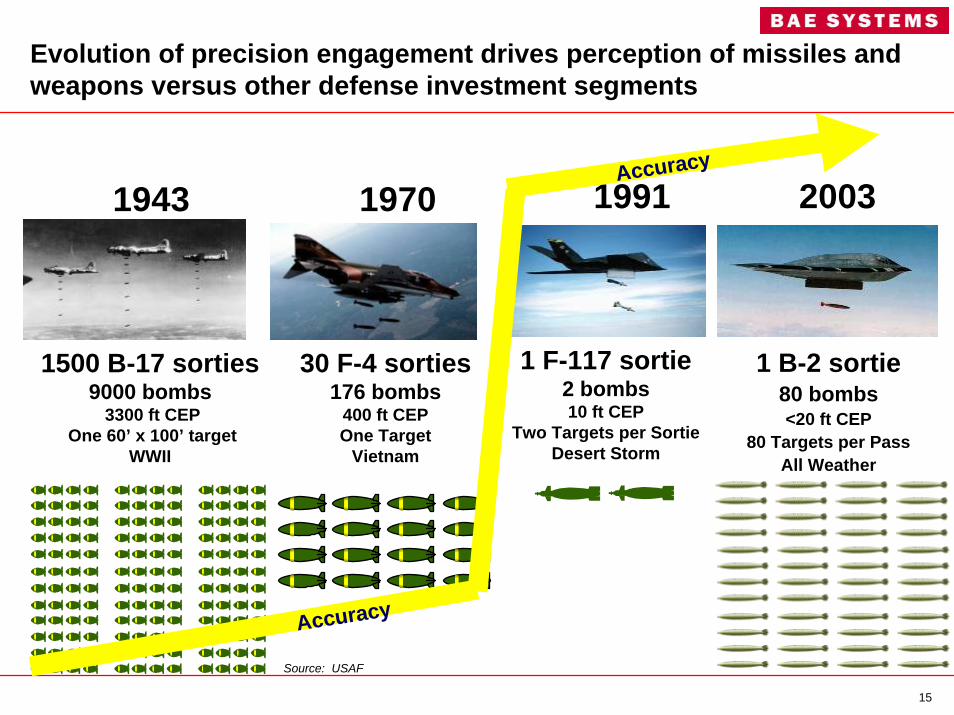
1943
1500 B-17 sorties9000 bombs
3300 ft CEPOne 60’ x 100’ target
WWII
1970
30 F-4 sorties 176 bombs
400 ft CEPOne Target
Vietnam
2003
1 B-2 sortie80 bombs<20 ft CEP
80 Targets per PassAll Weather
1991
1 F-117 sortie2 bombs10 ft CEP
Two Targets per SortieDesert Storm
Accuracy
Accuracy
Evolution of precision engagement drives perception of missiles and weapons versus other defense investment segments
Source: USAF
16
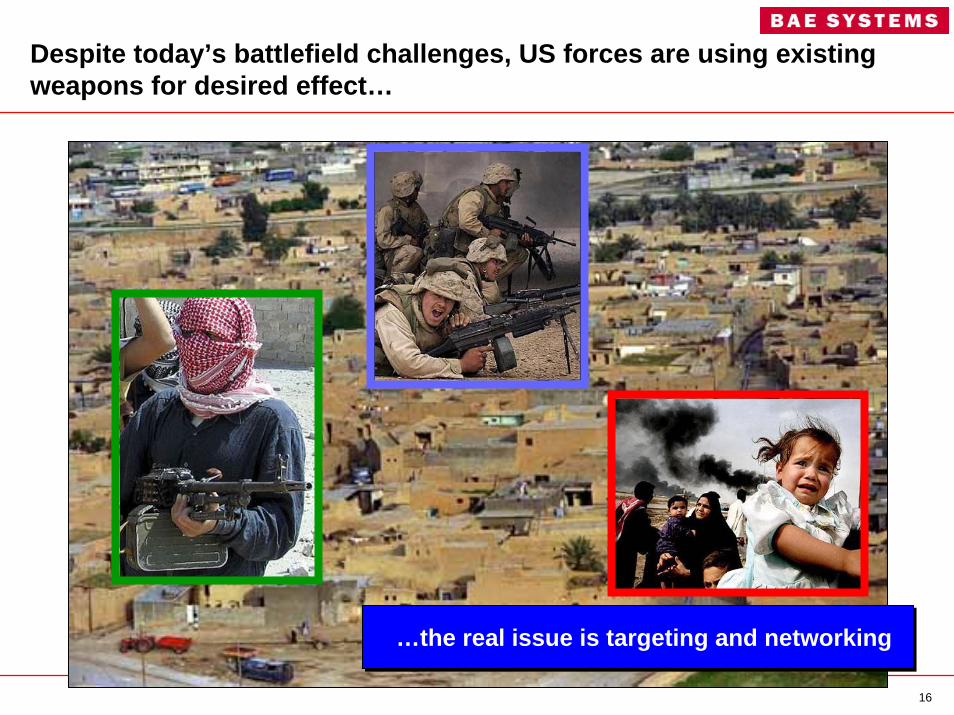
…the real issue is targeting and networking…the real issue is targeting and networking
Despite today’s battlefield challenges, US forces are using existing weapons for desired effect…
17
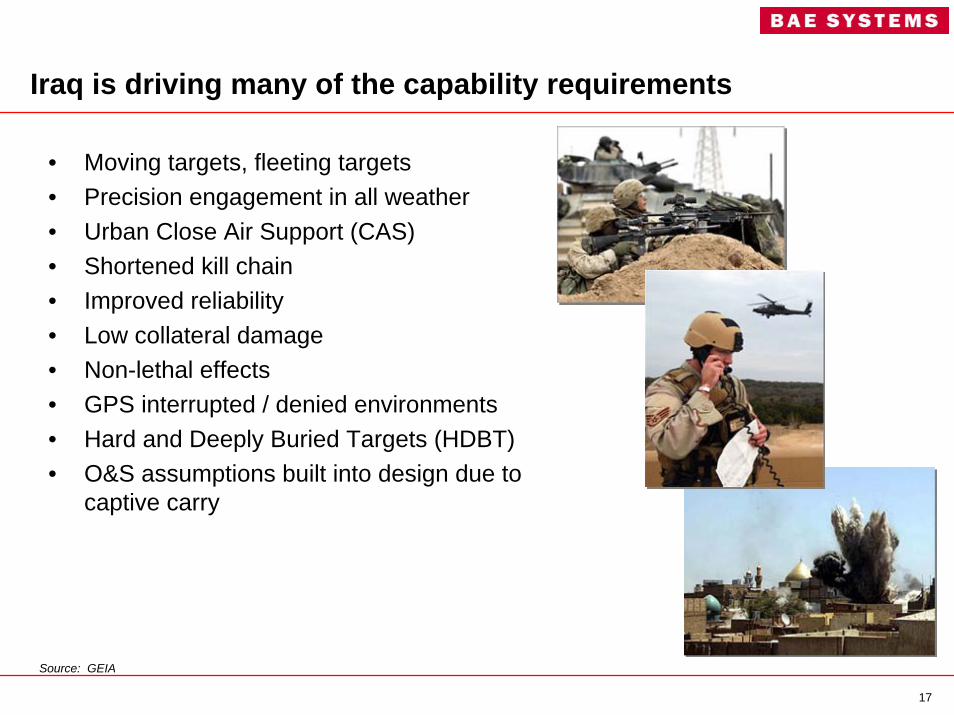
Iraq is driving many of the capability requirements
• Moving targets, fleeting targets• Precision engagement in all weather• Urban Close Air Support (CAS)• Shortened kill chain• Improved reliability• Low collateral damage• Non-lethal effects• GPS interrupted / denied environments• Hard and Deeply Buried Targets (HDBT)• O&S assumptions built into design due to
captive carry
Source: GEIA
18
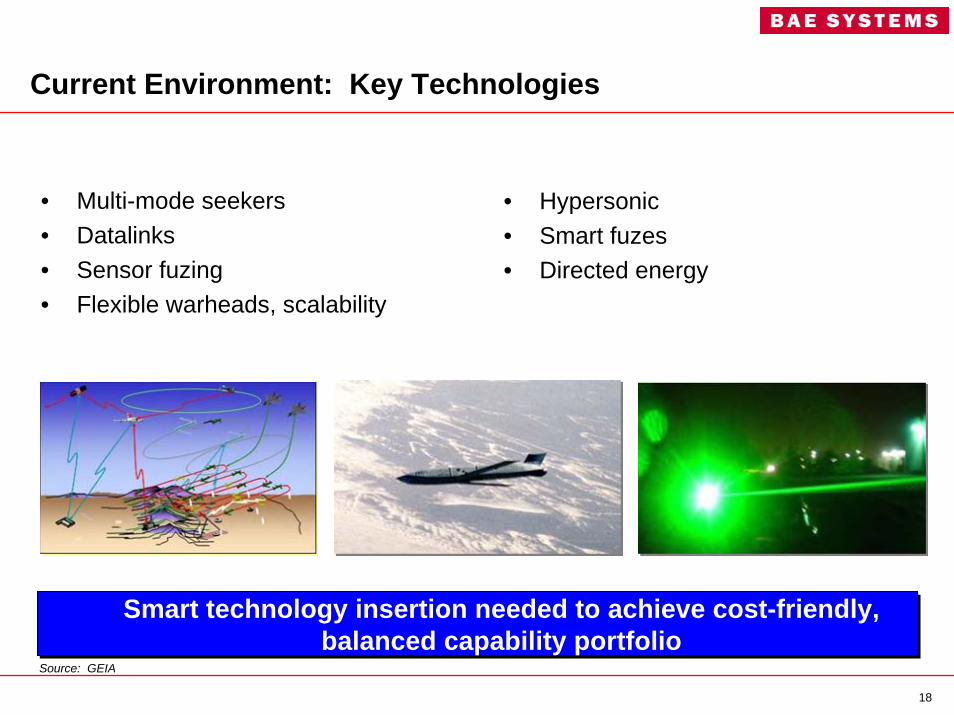
• Multi-mode seekers• Datalinks• Sensor fuzing• Flexible warheads, scalability
• Hypersonic• Smart fuzes• Directed energy
Smart technology insertion needed to achieve cost-friendly, balanced capability portfolio
Current Environment: Key Technologies
Smart technology insertion needed to achieve cost-friendly, balanced capability portfolio
Source: GEIA
19
Mid-Term 2010-2015– FCS Precision Munitions– Weapons for UAVs– Hard and Deeply Buried
Targets– Tactical Laser– High Power Microwave– Over-the Horizon Anti-Surface
Warfare Weapons– Swarm Ship Defense– Joint Dual Role Air Dominance
Missile (AA, AG)– Long-range strike weapon– Next-gen Torpedoes– Non-Lethal Effects
Far-Term 2015+– Directed Energy– Future Cruise Missile– Electro Magnetic Rail Gun – Autonomous Target ID
Numerous potential opportunities…
Near term <2010– JAGM– Smart artillery,
mortars, rockets, tank rounds
– Direct attack moving target capability (DAMTC)
…but no clear roadmap…but no clear roadmapSource: GEIA
20
Impact of a “Global Terrorism” vector
• Emphasis on CAS in any environment with small, high-speed, precision weapons
• Requirements may expand for:– Fleeting target capability– Sensing and discriminating low-profile targets– Networking of all ISR platforms to rapid strike– Emphasis on speed over range– Low collateral damage– Scalability– Precision in all environments– Directed energy for non-lethal effects– Loitering weapons– Weaponizing UAVs
??
????
No appreciable difference versus baseline budget, though requirements may shift
No appreciable difference versus baseline budget, though requirements may shift
Source: GEIA
21
Impact of a “Multipolar Alignment” vector
• Technology development to prepare for near-peer challenge:– Increased emphasis on baseline requirements (i.e. moving targets, all weather,
networked weapons, etc.)– Emphasis on range as well as speed – fast, standoff weapons– Over-the horizon surface warfare– Advanced torpedoes– Cruise missiles– Hypersonic propulsion technology– Directed energy for force application / protection– UCAV weapons
??
????
Budget increases, though missiles & weapons will continue to compete with platforms
Budget increases, though missiles & weapons will continue to compete with platforms
Source: GEIA
22
• Directed Energy– DE expected to be complementary to kinetic weapons– Technology development may come in advance of CONOPS / policy evolution– User pull required– ABL shootdown (FY 09) and ATL, HEL tech demonstration programs may indicate
how quickly DE evolves operationally
• Cyberspace
• Convergence with or divergence towards other domains and sciences– Nano– Robotics– Bio
Potential disruptions
Source: GEIA
23
Messages to Industry
• Contractors are doing a good job developing technology and addressing capability gaps
• Make the dumb weapons smart and the smart weapons cheap
• Don’t try to add capability when it’s not needed
• Emphasize realistic cost estimates
Source: GEIA
Thank YouThank You
Recommended