
Mission
To increase business, investment and employment in
the Greater Omaha area.
Partnership
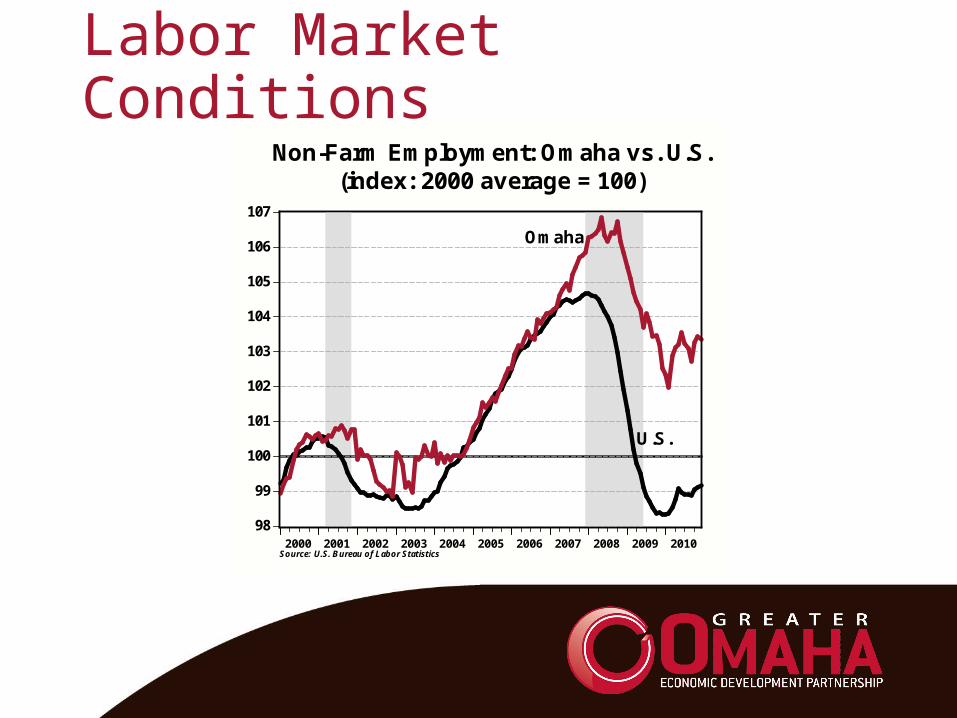
Labor Market Conditions
98
99
100
101
102
103
104
105
106
107
2000 2001 2002 2003 2004 2005 2006 2007 2008 2009 2010
Omaha
U.S.
Non-Farm Employment: Omaha vs. U.S.(index: 2000 average = 100)
Source: U.S. Bureau of Labor Statistics
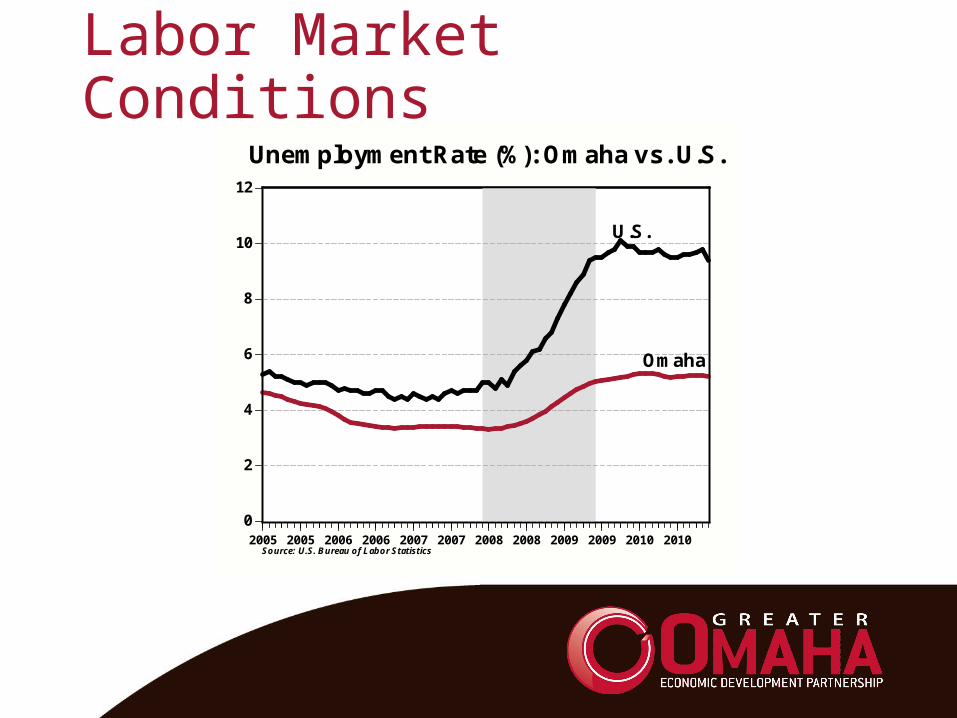
Labor Market Conditions
0
2
4
6
8
10
12
2005 2005 2006 2006 2007 2007 2008 2008 2009 2009 2010 2010
Omaha
U.S.
Unemployment Rate (%): Omaha vs. U.S.
Source: U.S. Bureau of Labor Statistics
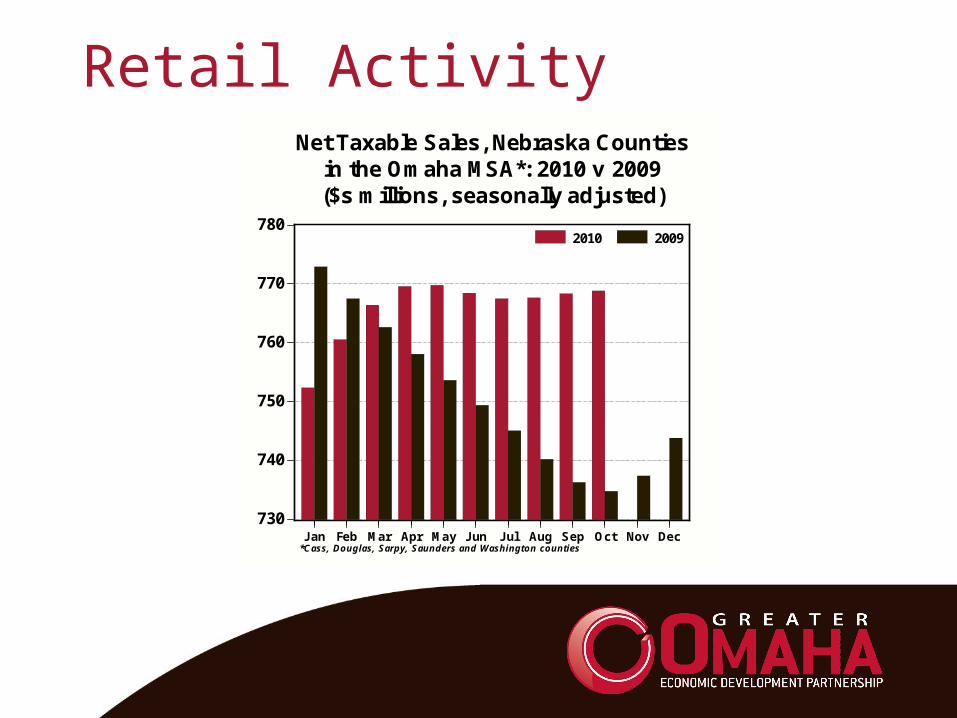
Retail Activity
730
740
750
760
770
780
Jan Feb Mar Apr May Jun Jul Aug Sep Oct Nov Dec
2010 2009
*Cass, Douglas, Sarpy, Saunders and Washington counties
Net Taxable Sales, Nebraska Countiesin the Omaha MSA*: 2010 v 2009($s millions, seasonally adjusted)
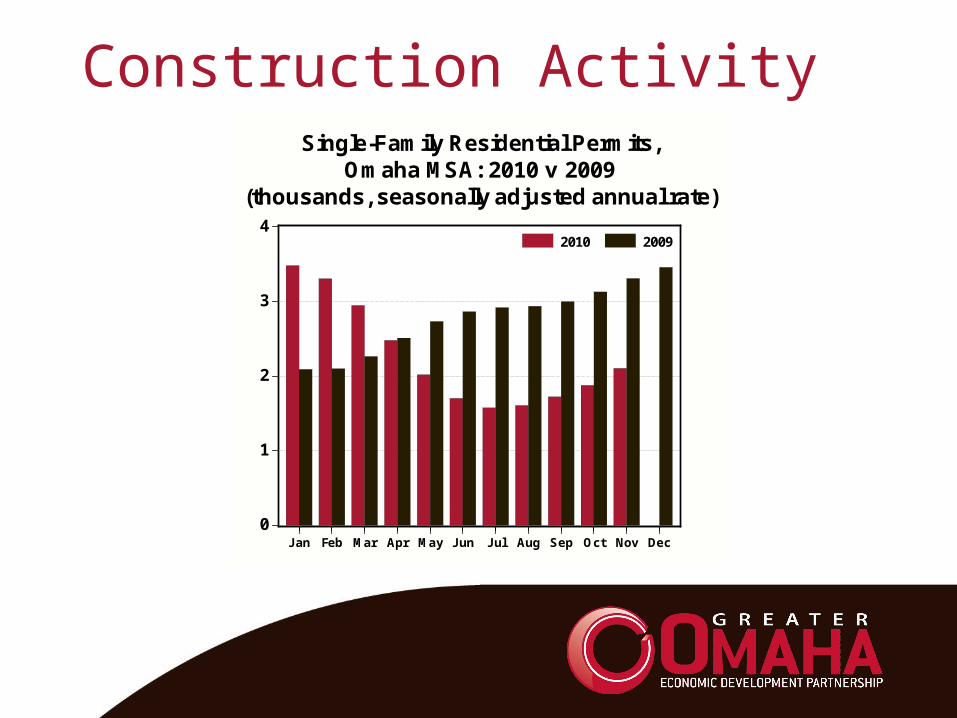
Construction Activity
0
1
2
3
4
Jan Feb Mar Apr May Jun Jul Aug Sep Oct Nov Dec
2010 2009
Single-Family Residential Permits,Omaha MSA: 2010 v 2009
(thousands, seasonally adjusted annual rate)

California Visit – November 2010

47 National Rankings
2010 Rankings and Recognition
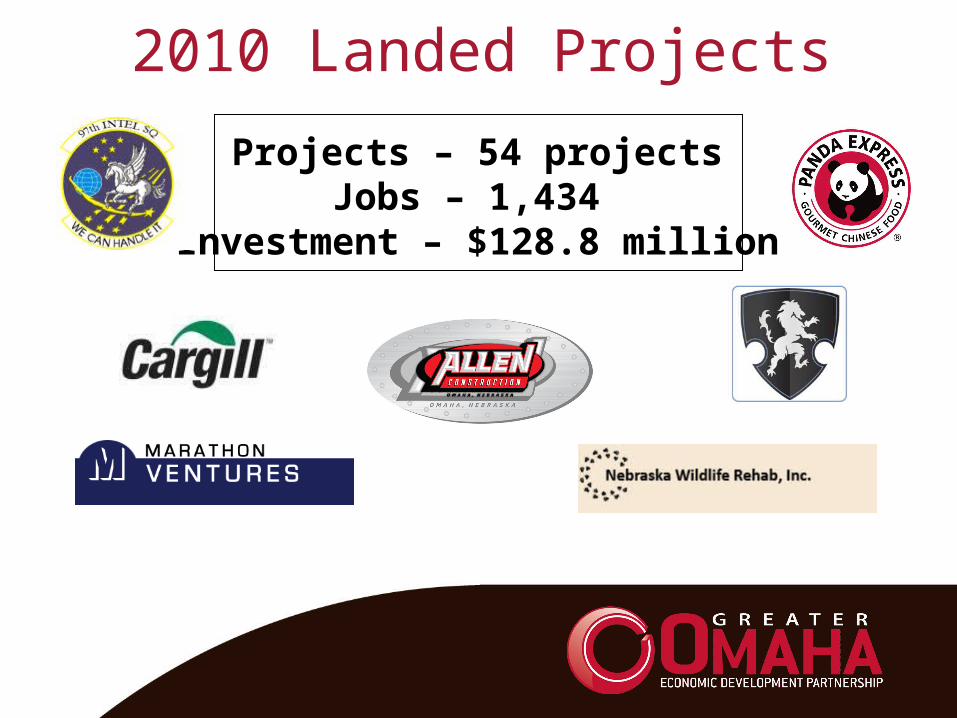
Projects – 54 projectsJobs – 1,434
Investment – $128.8 million
2010 Landed Projects
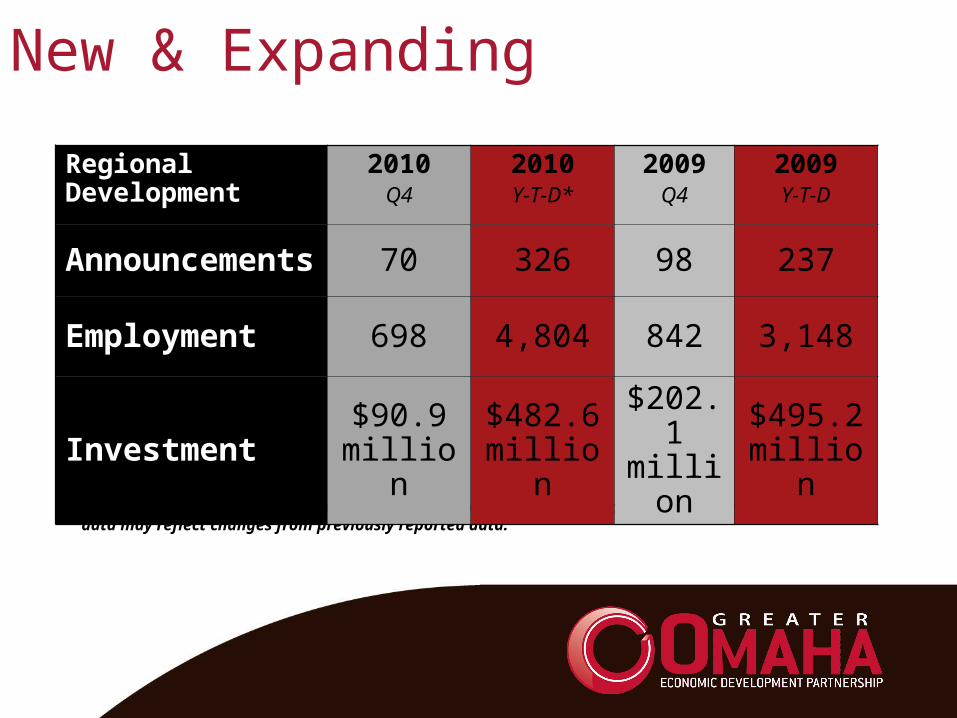
New & Expanding
*Note: Adjustments are made quarterly to New & Expanding business announcements; therefore current data may reflect changes from previously reported data.
Regional Development
2010Q4
2010Y-T-D*
2009Q4
2009Y-T-D
Announcements 70 326 98 237
Employment 698 4,804 842 3,148
Investment $90.9 million
$482.6 million
$202.1 million
$495.2 million
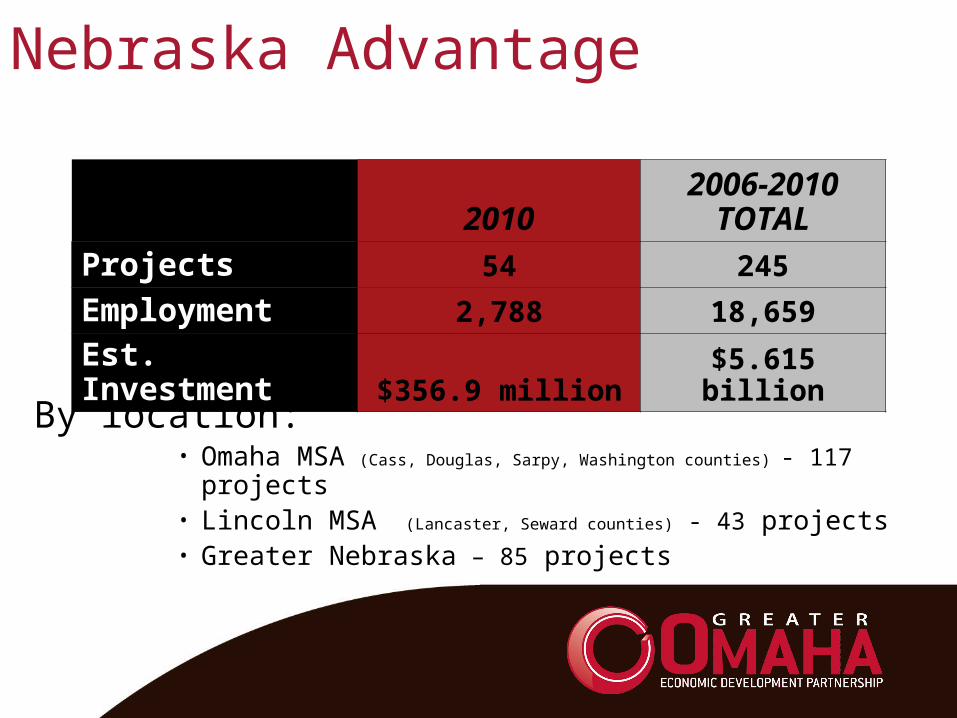
Nebraska Advantage
By location:• Omaha MSA (Cass, Douglas, Sarpy, Washington counties) - 117 projects• Lincoln MSA (Lancaster, Seward counties) - 43 projects• Greater Nebraska – 85 projects
20102006-2010
TOTAL
Projects 54 245
Employment 2,788 18,659
Est. Investment $356.9 million $5.615 billion
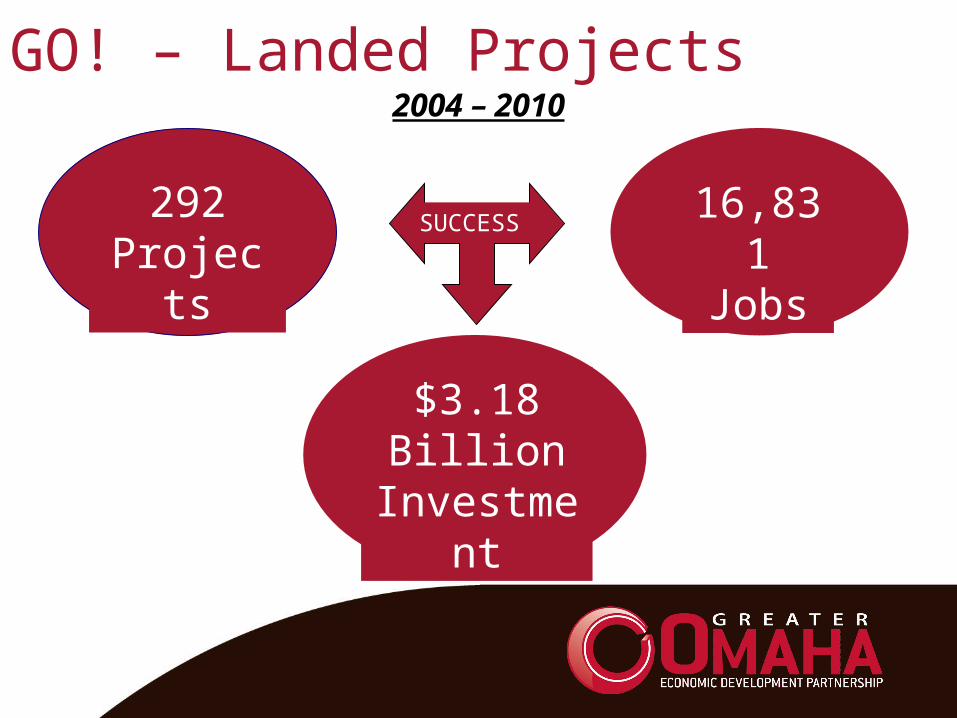
GO! – Landed Projects
292 Projects
16,831 Jobs
SUCCESS
2004 – 2010
$3.18 Billion
Investment

Q & A
• Contact• Scott Strain• Senior Director – Research• Greater Omaha Chamber• 402.978.7903• [email protected]
Recommended