21COE, University of Tokyo MMRC Discussion Paper No.65
MMRC
DISCUSSION PAPER SERIES
MMRC-F-65
Competition and Cooperation between Korea and Japan: A Business Perspective
Hwy-Chang MOON
Professor of International Business and Strategic Management The Graduate School of International Studies
Seoul National University
January 2006


21COE, University of Tokyo MMRC Discussion Paper No. 65
1
Competition and Cooperation between
Korea and Japan: A Business Perspective
Hwy-Chang MOON
Professor of International Business and Strategic Management The Graduate School of International Studies
Seoul National University
January 2006
Abstract This article studies the possibility of cooperation between Korea and Japan, using analytical frameworks in both competitiveness and cultural perspectives. The empirical results show that Korea and Japan are not in a competitive relationship and that there are several ways for cooperation between the two countries. This article further demonstrates that the two countries can complement their cultural differences and reinforce their national competitiveness structures.
Keywords Korea, Japan, Cooperation, Culture, DDD Model, OUI Model

Hwy-Chang Moon
2
Introduction With an increasing global trend of forming regional economic blocs, the importance of
cooperation among the countries in Northeast Asia, especially that between Korea and Japan has long
been discussed without much success. In order for Northeast Asia to be in a better economic position
in comparison to other economic blocs, cooperation between Korea and Japan is imminent. This must
be based on correct analyses with appropriate frameworks that can incorporate fundamental variables
of national competitiveness.
This article studies the possibility of cooperation between Korea and Japan through rigorous
analytical frameworks in both competitiveness and cultural perspectives. After analyzing both
competitiveness and cultural determinants, the article suggests ways of cooperation between Korea
and Japan through simultaneous consideration of both perspectives. Therefore, this article is more
comprehensive than other existing studies in analyzing the relationship between the two countries.
Several studies in the past have emphasized the importance of cooperation between Korea and
Japan. For example, after analyzing trade patterns between Korea and Japan, Koh et al. (2003)
proposed the formation of a free trade agreement (FTA) between the two countries. Concerning the
economic cooperation among Korea, Japan, and China, they suggested that FTA between Korea and
Japan should be established before the access of China to the FTA, because China might have a good
enough incentive to join the FTA between Korea and Japan.
Lee (2004) studied the possibility and the effects of FTA among China, Korea, and Japan. They
showed that the creation of this FTA would bring benefits not only to trade-related areas, but also to
other areas such as customs cooperation, the IT sector, science and technology, and the environment.
Similarly, based on the analysis of international input-output tables, Lee and Okamoto (2002) found
that the industrial structure of Korea and Japan is deeply interdependent, especially in the electronics
industry. Cheong (2004) also suggested the creation of FTA among China, Korea, and Japan to
increase economic benefits in production, trade, and economic welfare.
However, these existing studies do not look at the whole picture of competitiveness and thus do
not provide comprehensive analyses. Any approach, used to determine the fundamental relationship
between the two countries should be based on a strong analytical framework of national
competitiveness. This article will first suggest an appropriate analytical model of competitiveness for
this purpose and then another model, i.e., the cultural model, to complement the competitiveness
model. After related empirical tests, some useful implications will be derived.

Competition and Cooperation between Korea and Japan: A Business Perspective
3
THE COMPETITIVENESS MODEL The Diamond Model
Traditional trade theorists have considered capital, labor, and natural resources as sources of
national competitiveness. In reality, however, there are many counter examples that go against what
traditional theorists have argued. Criticizing the conventional model, for being at best incomplete and
at worst incorrect, Porter (1990) introduced the diamond model in his book, The Competitive
Advantage of Nations. As the title implies, this book was meant to replace The Wealth of Nations
(Smith, 1776).
In this book, Porter argues that national prosperity is created, not inherited. Thus, his model is
dynamic. In addition, this model is comprehensive because it creates a single model by incorporating
the production factor conditions that most traditional theorists have employed, along with other
important variables to explain national competitiveness. Therefore, the explanatory power of the
diamond model is revolutionary.
The diamond model is composed of two parts: indigenous and exogenous variables. The
indigenous variables are Factor Conditions, Firm Structure, Strategy and Rivalry, Related and
Supporting Industries, and Demand Conditions. The exogenous variables are Government and
Chances.
Factor Conditions measure the factors of production necessary to compete in certain industries,
which are further divided into two subcategories of basic factor conditions such as natural resources,
climate, and population, and advanced factor conditions such as skilled labor, technology, and
know-how. Firm Structure, Strategy and Rivalry represent the national environment in which
companies are created, organized, and managed, as well as the nature of domestic rivalry. Related
and Supporting Industries test competitiveness of industries related to a given industry or supplier
industries. Demand Conditions show the nature of the domestic market for its size and sophistication.
Previous Studies Evaluated by the Diamond Model
Koh et al. (2003) approached the relationship among Korea, Japan and China through the
analyses of market share, ESI (Export Similarity Index), RCA (Revealed Comparative Analysis), and
TSI (Trade Specialization Index), using the data from world trade statistics by the UNCTAD, Asia
International Input-Output Table by the Institute of Developing Economies, and the Direction of
Trade Statistics by the IMF. This is clearly a trade-oriented approach to the relationship between the
two countries, which falls under the Demand Conditions of the diamond model.
Hwy-Chang Moon
4
In their study of economic cooperation among China, Korea, and Japan, Lee (2004) covered such
fields as trade and investment, customs cooperation, IT, science and technology, transportation,
energy, and environment. Although this study is surely more comprehensive than other studies, it still
misses some important variables to comprehensively estimate the relationship between the countries
when evaluated by the diamond model. Trade and investment, and customs cooperation are elements
of Demand Conditions. The IT sector, science and technology, transportation, and environment are
under Related and Supporting Industries. Only energy falls under Factor Conditions and there is no
variable for Firm Strategy, Structure, and Rivalry.
Lee and Okamoto (2002) empirically tested the industrial relationship between Korea and Japan,
using import coefficients and production inducement coefficients. They then studied the direction of
‘trade creation effects’ and the changes in trade dependency ratios. In the perspective of the diamond
model, these elements are under Factor Conditions and Demand Conditions.
Cheong (2004) emphasized economic benefits in population, production, GDP, and trade as a
rationale for the creation of FTA among China, Korea, and Japan. Population and production,
however, are variables of Factor Conditions, and GDP and trade are those of Demand Conditions.
Therefore, their study considered merely half of the whole picture.
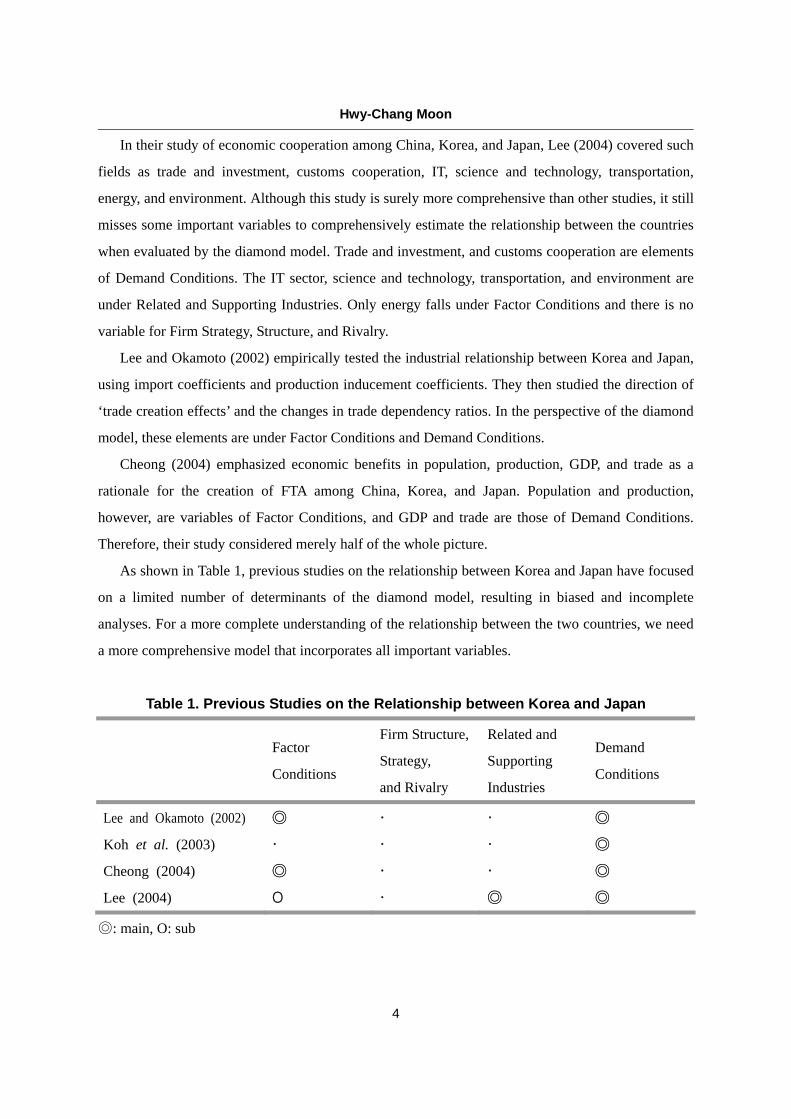
As shown in Table 1, previous studies on the relationship between Korea and Japan have focused
on a limited number of determinants of the diamond model, resulting in biased and incomplete
analyses. For a more complete understanding of the relationship between the two countries, we need
a more comprehensive model that incorporates all important variables.
Table 1. Previous Studies on the Relationship between Korea and Japan
Factor
Conditions
Firm Structure,
Strategy,
and Rivalry
Related and
Supporting
Industries
Demand
Conditions
Lee and Okamoto (2002) ◎ · · ◎
Koh et al. (2003) · · · ◎
Cheong (2004) ◎ · · ◎
Lee (2004) O · ◎ ◎
◎: main, O: sub

Competition and Cooperation between Korea and Japan: A Business Perspective
5
The Dual Double Diamond Model
Although Porter’s diamond model is a revolutionary enhancement in explaining national
competitiveness, the model is not free from criticism and has been extended in two directions (scopes
and sources) of national competitiveness. The first was an incorporation of multinational activities
through the introduction of the double diamond model (Rugman, 1991; Rugman and D’Cruz, 1993;
Moon, Rugman, and Verbeke, 1998; Dunning, 2003). While the variables of Porter’s diamond model
are useful when analyzing a nation’s competitiveness, the model has a narrow focus which is limited
only to home-base. The second extension to Porter’s original model was the addition of human
factors through the proposition of the nine-factor model (Cho, 1994; Cho and Moon, 2000). Porter’s
diamond model is mainly designed to explain the sources of national competitiveness possessed by
the economies of advanced countries, but is limited when explaining the levels and dynamic changes
of economies in developing countries. The human factors in the nine-factor model drive the national
economy by creating, motivating, and controlling the four physical factors in Porter’s diamond
model.
A good theory should be comprehensive enough to capture all of the important explanatory
variables. Although the double diamond model and the nine-factor model enhance Porter’s diamond
model in terms of the source and context of competitiveness, they are not integrated into a single
model. In order to analyze and explain national competitiveness more thoroughly, this article
incorporates both of these extensions into an integrated model, i.e., the Dual Double Diamond (DDD)
model.
Figure 1 illustrates Porter’s diamond model and its extensions. The horizontal axis shows the
extension to the diamond model in terms of the sources of national competitiveness. The vertical axis,
on the other hand, demonstrates the extension with regard to the scopes of national competitiveness.
The sources (physical/human factors) and scopes (domestic/international contexts) interact with each
other to determine a nation’s competitiveness.
The two extensions double the original single diamond in two distinct ways. Model 2 in Figure 1
introduces a new diamond of human factors as an extension to sources of national competitiveness.
On the other hand, Model 3 doubles its original diamond as an extension to scopes of national
competitiveness, from a domestic context to an international context. Thus, the integration of these
two extensions into a single framework results in a dual double diamond. At the lower right hand
corner of Figure 1 is the DDD model, encompassing the previous extensions. The DDD model
considers both physical and human factors in both domestic and international contexts, and

Hwy-Chang Moon
6
consequently, provides a more comprehensive explanation for national competitiveness than other
models.
Figure 1. Extensions to the Diamond Model
Model 1: The Single Diamond
Porter (1990)Porter (1998)Porter, Takeuchi & Sakakibara (2000)Porter (2003)
Model 2: The Nine Factor
Cho (1994)Cho & Moon (2000)
Model 3: The Double Diamond
Rugman (1991)Rugman & D’Cruz (1993)Moon, Rugman & Verbeke (1998)Dunning (2003)
Model 4: The Dual Double Diamond
Physical Factors Human Factors
Dom
estic C
onte
xtIn
t’l C
onte
xt
Sources of National Competitiveness
Scopes o
f N
ational C
om
petitive
ness
The Cultural Model Traditional Models in Explaining Cultural Differences
Cultural phenomena had been thought to be independent from other social fields for a long time.
Scholars, however, have recently come forth with various cultural models on the cultural phenomena
that influence diverse aspects of the society, recognizing that cultural differences affect national and
business competitiveness. Although several models (Hofstede, 1983; Schein, 1992; Hall and Hall,
1990; Hampden-Turner and Trompenaars, 1997) have already been established to explain the
fundamental differences in culture among nations, they are not satisfactory and thus need to be
revised.
Perlmutter (1969) first presented variables focusing on the primary attitudes among international
executives, which consist of three variables - ethnocentricity (home-country orientation),
polycentricity (host-country orientation), and geocentricity (world-orientation). Trompenaars and

Competition and Cooperation between Korea and Japan: A Business Perspective
7
Hampden-Turner (1998), on the other hand, presented seven fundamental dimensions of culture -
universalism vs. particularism; individualism vs. collectivism; neutral vs. affective; specific vs.
diffuse; achievement vs. ascription; time (sequential vs. synchronous); and environment (internal vs.
external control). These variables influence the way people live and work in different environments.
Hall and Hall (1990) also introduced an interesting cultural model in which they defined culture in
the contexts of time and space into three categories – high-low context; time orientation; and
interpersonal space.
Hofstede (1997) suggested a more comprehensive cultural model with five dimensions. The first
dimension, Individualism vs. Collectivism, refers to the relationship between the individual and
others. The second dimension, Power Distance, focuses on the inequality that exists between people
within a society. Uncertainty Avoidance, the third dimension, denotes the extent to which individuals
within a culture feel threatened by uncertain or unknown events. The fourth dimension, Masculinity
vs. Femininity, determines whether a society is assertive or modest through gender. The fifth
dimension, which has been newly added to the original model, is Long-term Orientation vs.
Short-term Orientation. A long-term (future) orientation embodies traits such as perseverance and
thrift (saving), while a short-term (past and present) orientation involves respecting tradition and
fulfilling social obligations. Table 2 describes the previous studies on culture and their variables.
Table 2. Studies on Cultural Models and Their Variables
Perlmutter
(1969)
Hall and
Hall
(1990)
Hofstede
(1997)
Trompenaars and
Hampden-Turner
(1998)
Ethnocentrism Context Individualism vs. Collectivism Universalism vs. Particularism
Polycentrism Time Power Distance Individualism vs. Collectivism
Geocentrism Space Uncertainty Avoidance Neutral vs. Affective
Long-term Orientation vs.
Short-term Orientation Specific vs. Diffuse
Masculinity vs. Femininity Achievement vs. Ascription
Time (Sequential vs. Synchronous)
Environment
(Internal vs. External Control)

Hwy-Chang Moon
8
Although Hofstede’s model covers most of the cultural variables in the previous models (e.g.,
Hall and Hall 1990, Trompenaars and Hampden-Turner 1998), this model also has some problems.
According to Moon and Choi (2001), Hofstede’s model misses Perlmutter’s (1969) EPG Profile. In
addition, there are some overlapping and unsuitable dimensions in Hofstede’s model. Moon and Choi
(2001) thus argued that Hofstede’s model needs to be restructured to yield a better measurement of
cultural diversity, by adding a dimension corresponding to “openness,” and fixing the overlap in the
five dimensions.
The OUI Model
Excluding Masculinity vs. Femininity and Short-term vs. Long-term Orientation, and
incorporating Power Distance as an attribute of Individualism, the Hofstede model can be abridged
into two dimensions: Individualism and Uncertainty Avoidance. In addition, a new dimension,
Openness, needs to be added for a correct understanding of cultural differences. The Openness
variable is particularly useful in understanding the changing competitiveness of East Asian countries.
Because the new model has three variables, i.e., Openness, Uncertainty Avoidance and Openness, it
is called the OUI model.
Each of these three variables is further classified into two sub-variables to allow for a more
precise conceptualization and accurate measurement of culture. Individualism is measured by how
much Reward is given with respect to Responsibility and vice versa. Uncertainty Avoidance is
assessed by Disciplinism, which emphasizes rules, laws, and standards, and Frontierism, which
accentuates challenge, originality, and investment. Openness consists of two elements:
Aggressiveness and Attractiveness. Aggressiveness is the tendency to push home country values
abroad, and Attractiveness is the willingness to accept foreign values and cultures. For further
information, refer to Moon and Choi (2001).
DATA AND METHODOLOGY Data
For the empirical analysis, data was selected from the IPS National Competitiveness Research
(IPS 2005), published by the Institute for Industrial Policy Studies. The report covers 66 countries
and collects data for 275 criteria comprising physical and human factors in both domestic and
international contexts. Table 3 shows the list of criteria in the report. The national competitiveness
indices of Korea and Japan are calculated by eight factors comprising the DDD model. Factors are

Competition and Cooperation between Korea and Japan: A Business Perspective
9
calculated as an average of 23 sub-factors, and sub-factors are also calculated as an average of the
criteria under each sub-factor. Among the 275 criteria, 212 are selected to calculate the national
competitiveness index. The unselected criteria are used for informative purposes.
Table 3. List of Criteria for the Calculation of National Competitiveness Index
6756
39116
108
221639
1023111029755
176
Total
Number of Criteria
000070540
111021011
1800080
B. I.
6756
3211168
1115379
23109
1175596
Input
Cluster Development
Social ContextPersonal Competence
Professionals
Social ContextPersonal Competence
Entrepreneurs
BureaucratsPoliticiansPoliticians &
Bureaucrats
Quality of Labor ForceQuantity of Labor Force
Workers
Human Factors
Demand QualityDemand SizeDemand
Conditions
Overall Living Environment
Science & TechnologyEducation FinanceCommunicationTransportation
Related & Supporting Industries
Foreign InvestmentBusiness CultureGlobal MindsetStrategy & Structure
Business Context
Other ResourcesEnergy ResourcesFactor
Conditions
Physical Factors
Sub-factorsMain Factors
*B. I.: Background Information
For the OUI model, three proxy variables are chosen for each of the six cultural sub-variables.
For Individualism, the sub-variables are Responsibility and Reward. The proxies for Responsibility
are job description and individual roles, corporate governance, and the relationship between labor
and management. Whether or not job description and individual roles are clear is critically important
to define each person's responsibility. In the individualistic society, each individual is responsible for
one's conduct for personal independence. In a corporate governance of well-defined responsibility,
each employee and employer can be faithful to one's own duty by maintaining a cooperative
relationship between labor and management. The proxies for Reward are reward system, firm's
decision process, and professional's compensation. The system will inspire if reward is based on
performance rather than seniority; if professionals are appropriately compensated; and if the firm's
decision process is transparent.

Hwy-Chang Moon
10
As for Uncertainty Avoidance, Disciplinism and Frontierism are chosen as sub-variables. Specific
elements of Disciplinism include public order, bureaucracy, and bribery and corruption. A society is
highly disciplined when public order and bureaucracy are well maintained; and bribery and
corruption are not common. Innovation and creativity, entrepreneur's core competences, and ability to
seize opportunities are sub-variables for Frontierism. Traits that challenge undeveloped fields can be
observed by whether innovativeness and creativity are highly appreciated in the society and whether
entrepreneurs have differentiated core competences to take a big step forward.
Finally, Aggressiveness and Attractiveness are chosen as sub-variables of Openness. Three
proxies for Aggressiveness are international changes, global standards, and new ideas. A firm's quick
adaptation to the international changes and global standards, as well as accepting new ideas, are
important factors for having or showing determination and energetic pursuit of business goals. Equal
treatment, professional job's openness and the inward foreign investment promotion policy are
proxies for Attractiveness. Whether foreign and domestic firms are equally treated, and whether
professional jobs are open to foreigners are important criteria for encouraging the inflow of
foreigners. Likewise, the policy of inward foreign investment promotion is an important element to
measure the degree of openness of a country. The cultural variables, together with sub-variables and
proxies are summarized in Table 4.
Table 4. Cultural Variables
Cultural Variables Sub-variables Proxy Variables
Job description and individual roleCorporate governanceResponsibility The relationship between labor and management Reward systemFirms' decision process
Individualism
Reward Professional's compensationPublic orderBureaucracyDisciplinism Bribery and corruptionInnovation and creativityEntrepreneur's core competences
Uncertainty
Avoidance Frontierism
Ability to seize opportunitiesInternational changesGlobal standardsAggressivenessNew ideasEqual treatmentProfessional job's openness
Openness
Attractiveness The inward foreign investment promotion policy

Competition and Cooperation between Korea and Japan: A Business Perspective
11
Methodology While productivity is the internal competence of an organization, competitiveness is an
organization’s relative competitive position compared to its competitors (Moon and Peery, 1995).
Therefore, in order to find the fundamental relationship between Korea and Japan, we need to
analyze the national competitiveness of the countries and to understand the relative position of the
countries from the viewpoint of each other. For this, cluster analysis is used to analyze the
characteristics of objects with distance between them.
Cluster analysis is a statistical technique that classifies objects into clusters according to the
characteristics of the objects. Objects in the same cluster share significant homogeneity, while there
is significant heterogeneity among objects in different clusters (Hair et al., 1998). In this study, we
apply K-means clustering in non-hierarchical clustering techniques to the 23 sub-factor variables of
66 countries in the world and classify the countries into three categories of A, B, C in accordance
with the competitiveness of the countries. We define the relationship between Korea and Japan as
competitive in a certain sub-factor, if the result of cluster analysis shows that Korea and Japan are in
the same category in the sub-factor. If not, they are in a cooperative relationship.
To perform a statistical test on the overall relationship between Korea and Japan using the results
from the cluster analysis, we use the cross-tabulation analysis. The cross-tabulation analysis shows
the overall relationship between the two countries by calculating the number of sub-factors in which
the two countries are in a cooperative or competitive relationship, respectively.
RESULTS Competitiveness Perspective
Table 5 shows the results of the k-means cluster analysis of eight factors in both Physical Factors
and Human Factors of the DDD model, with the competitive positions of Korea and Japan. Each
country is classified into three competitiveness groups of A, B, and C, according to the results of
K-means cluster analysis of 66 countries in the world. Cluster A is the group of countries with high
competitiveness; Cluster B with middle competitiveness; and Cluster C with low competitiveness. In
the ‘K-means cluster analysis’ column, data are arranged in the order of ‘Cluster mean square’, ‘Error
mean square’, ‘F-Value’, and ‘Sig.’. Dotted lines in the ‘Graph’ column represent the results of
cluster analyses of 66 countries in each factor. Korea and Japan show a cooperative relationship in
Related and Supporting Industries, Politicians and Bureaucrats, and Entrepreneurs.

Hwy-Chang Moon
12
Table 5. Cluster Analysis in Physical and Human Factors
Graphs( Low -- Competitiveness Rankings -- High)K-means
ClusterAnalysis
18
22
32
57
Korea
Rankings
1
14
22
39
Japan JapanKorea
A
A
B
C
Relation-ship
CompetitivenessGroup
0.000
292.556
12.638
0.000
315.762
21.118
0.000
213.861
35.042
0.000
289.563
8.298
2402.749
Comp.A
3697.231
DC
Coop.B
6668.287
R&S
Comp.B
7494.133
BC
Comp.CFC
66 44 22 1
K J
JK
JK
JK
17
11
32
61
15
35
19
42
A
B
A
C
0.000
284.870
41.536
0.000
200.657
46.211
0.000
209.081
56.616
0.000
101.907
18.632
1898.745
Comp.A
11832.199
P
Coop.A
9272.622
E
Coop.B
11837.238
P&B
Comp.CW
K J
JK
KJ
KJ
In ‘K-means cluster analysis’ column, data are arranged in the order of ‘Cluster mean square’, ‘Error mean square’, ‘F-Value’, ‘Sig.’. Dotted lines in ‘Graph’ column represent the results of cluster analyses of 66 countries in each factor. K: Korea, J: Japan

Competition and Cooperation between Korea and Japan: A Business Perspective
13
To analyze the relationship between the two countries in more detail, the same method is applied
to the 23 sub-factors and the results are described in Table 6. The ‘Graph’ column and three statistical
figures other than ‘F-values’ are omitted because of space limitation. Although no conspicuous
pattern is found, there are 10 sub-factors in which Korea and Japan are in a cooperative relationship.
In the remaining 13 categories, two countries are in a competitive relationship.
Table 6. Cluster Analysis of 23 Sub-factors
233.812**
115.145**
104.780**
179.793**
190.818**
210.305**
168.769**
144.265**
196.425**
142.592**
282.876**
149.806**
185.709**
271.255**
249.204**
323.684**
114.677**
171.729**
246.428**
239.171**
182.267**
208.749**
248.313**
F-Value
Social Context
Personal Competence
Social Context
Personal Competence
Bureaucrats
Politicians
Quality of Labor Force
Quantity of Labor Force
Demand Quality
Demand Size
Overall Living Environment
Cluster Development
Science & Technology
Education
Finance
Communication
Transportation
Foreign Investment
Business Culture
Global Mindset
Strategy & Structure
Other Resources
Energy Resources
Sub-FactorsRankings
Main Factors
JapanKorea
18
18
21
8
30
40
60
42
14
20
29
43
13
41
23
6
22
45
34
32
22
49
53
JapanKorea
A
B
B
B
A
B
A
C
A
A
B
B
A
B
A
A
B
C
A
A
A
C
C
15
13
52
31
18
21
13
55
3
3
28
30
1
38
6
12
4
27
18
21
27
26
44
A
B
A
A
B
C
C
B
A
B
B
B
A
B
B
A
B
C
B
B
A
C
C
Competitive-ness
Group
Comp.
Comp.
Coop.
Coop.
Coop.
Coop.
Coop.
Coop.
Comp.
Coop.
Comp.
Comp.
Comp.
Comp.
Coop.
Comp.
Comp.
Comp.
Coop.
Coop.
Comp.
Comp.
Comp.
Relation-ship
Professionals
Entrepreneurs
Politicians&
Bureaucrats
Workers
DemandConditions
Related & Supporting Industries
BusinessContext
FactorConditions
Phys
ical Facto
rsH
um
an F
acto
rs
Using the results of cluster analysis on 23 sub-factors, we conduct cross-tabulation analysis to
find out the overall relationship between Korea and Japan. As cross-tabulation analysis is a statistical

Hwy-Chang Moon
14
technique that assesses the relationships between nominal variables, it is useful to apply this
technique to the analysis of the relationship between two countries with nominal variables
(cooperation or competition) on 23 categories. If the results of the analysis show significant
relationship, two countries are in a competitive relationship because the countries have similar
distribution of 23 sub-factors.
Table 7 shows the results of cross-tabulation analysis. Results from both the Pearson Chi-Square
test and the Likelihood Ratio test yield a significance level of greater than 0.05, which does not allow
us to reject the null hypothesis. Thus, we conclude that Korea and Japan are not in a competitive
relationship, although there are more competitive than cooperative cases as shown in Table 6.
Table 7. Results of Chi-Square Tests
Value df Asymp. Sig.
(2-sided)
Pearson Chi-Square 9.26 4 0.06
Likelihood Ratio 8.67 4 0.07
Number of Valid Cases 23 · ·
Summarizing the analysis of Korea and Japan in a competitiveness perspective, we can find
neither a competitive nor cooperative relationship. However, the following analysis from a cultural
perspective suggests how the two countries can cooperate to enhance their competitiveness.
Cultural Perspective
The OUI indices of Korea and Japan are calculated as shown in Table 8, using proxies listed in
Table 4. In Openness, Japan shows a higher index than Korea. In sub-variables of Openness, Korea is
higher in Aggressiveness, while Japan is higher in Attractiveness. On the other hand, Korea is higher
than Japan in Uncertainty Avoidance because Korea is much stronger in Frontierism, while Japan is
better in Disciplinism. In Individualism, the index of Japan is higher than that of Korea because
Japan scores very high in Responsibility compared to Korea.

Competition and Cooperation between Korea and Japan: A Business Perspective
15
Table 8. National Competitiveness Indices of OUI Model
Country Main Factors Sub Factors
Openness Aggressiveness Attractiveness
Korea 56.56 59.89 53.22
Japan 61.50 48.94 74.06
Uncertainty
Avoidance Frontierism Disciplinism
Korea 67.15 80.29 54.01
Japan 59.48 51.79 67.17
Individualism Responsibility Reward
Korea 55.50 38.62 72.39
Japan 64.80 63.88 65.72
The same method applied to the cluster analysis in the competitiveness perspective is employed
in the cultural analysis. The variables in the cluster analysis are classified into three groups of A, B
and C, respectively, using the OUI indices of 66 countries in the world. The results are described in
Table 9. The competitiveness groups of each variable in OUI are calculated by concatenating the
competitiveness groups of sub-factors. For example, in Uncertainty Avoidance, Korea is in group A
in Frontierism and in group B in Disciplinism, while Japan is in group B in Frontierism and in group
A in Disciplinism. As the competitiveness groups in Uncertainty Avoidance are calculated by
concatenating the competitiveness groups in Frontierism and Disciplinism, the competitiveness group
of Korea in Uncertainty Avoidance is AB, while that of Japan is BA.

Hwy-Chang Moon
16
Table 9. Cluster Analysis of Cultural Variables
Competitiveness Group
Sub-Factors Main Factors Main Factors Sub-Factors
Korea Japan Korea Japan
Relationship
Aggressiveness B B Openness
Attractiveness B A BB BA Complementary
Frontierism A B Uncertainty
Avoidance Disciplinism B A AB BA Complementary
Reward A B Individualism
Responsibility C B AC BB Complementary
By comparing the competitiveness groups, we can figure out the relationship between Korea and
Japan in a cultural perspective, as shown in Table 5. As described in the main factors column of the
competitiveness group in Table 9, not a single group in all three OUI variables between Korea and
Japan is the same. Therefore, Korea and Japan are in culturally complementary positions. In other
words, Korea and Japan can work together by providing the cultural aspects the other lacks.
CONCLUSION This article considered both competitiveness and cultural perspectives to suggest ways in which
Korea and Japan can cooperate with each other. This is difficult and blurred when only a
competitiveness perspective is considered. In a competitiveness analysis, Japan is stronger than
Korea in Related and Supporting Industries, while Korea performs better in Entrepreneurs than Japan.
On the other hand, in a cultural perspective, Korea is better in Frontierism, while Japan is stronger in
Disciplinism.
Based on these analyses, Korea and Japan can work together. Japan may help Korea with its high
technologies in such areas as R&D, which is an important Related and Supporting sector, and Korea
can enhance the entrepreneurship of Japan with its strong Frontierism, which is an element of
Entrepreneurs. Considering this kind of cooperation, the relationship between Korea and Japan is not
one-way traffic, such as technology transfer or leakage from Japan to Korea, but mutually beneficial
interactions.
Previous studies on the relationship between Korea and Japan have focused on the limited

Competition and Cooperation between Korea and Japan: A Business Perspective
17
number of factors comprising national competitiveness, thus inevitably resulting in biased analyses,
compared to the diamond model. This article applies the diamond model to the analysis of national
competitiveness and the OUI model to understand the cultural characteristics. Contrary to what has
been widely understood, there is no clear evidence that Korea and Japan are in an economically
competitive relationship. In addition, the two countries can establish a cooperative system by
complementing cultural differences, which would bring significant benefits to both countries.
This article employs the cluster analysis technique in which the variables comprising national
competitiveness and cultural characteristics are grouped into 3 clusters. Further classification of each
cluster would result in a more accurate analysis of the relationship between Korea and Japan, which
may be a good topic for further studies. The two countries can also cooperate in the fields where they
are competing with each other. Two conditions can be suggested for this possibility. One is when
there exist very large economies of scale which cannot be fully exploited by one party. The other is
when a significant level of absorptive technological capabilities for learning, thereby a certain level
of competitive position, is needed for an efficient cooperation. While these are interesting topics for
future studies, these studies will also support cooperative rather than competitive nature of business
between the two countries.
REFERENCES Cheong, I. K. (2004), 2003 Studies on a China-Japan-Korea FTA, Seoul: KIEP. (In Korean)
Cho, D. S. (1994), “A Dynamic Approach to International Competitiveness: The Case of Korea”,
Journal of Far Eastern Business, 1(1): 17-36.
Cho, D. S. and Moon, H. C. (2000), From Adam Smith to Michael Porter, Singapore: World
Scientific.
Dunning, J. H. (2003), “The Role of Foreign Direct Investment in Upgrading China’s
Competitiveness”, Journal of International Business and Economy, 4(1), 1-13.
Hair, J. F., Anderson, R. E., Tatham, R. L and Black, W. C. (1998), Multivariate Data Analysis
(5th edition), Upper Saddle River, N.J.: Prentice Hall.
Hall, E. T. and Hall, M. R. (1990), Understanding Cultural Differences: Germans, French, and
Americans. Yarmough, Maine: Intercultural Press, Inc.
Hampden-Turner, C. and Trompenaars, F. (1997), “Response to Geert Hofstede”, International
Journal of Intercultural Relations, 21(1): 149-159.

Hwy-Chang Moon
18
Hofstede, G. (1983), “The Cultural Relativity of Organizational Practices and Theories,” Journal of
International Business Studies, 14(2): 75-89.
Hofstede, G. (1997), Cultures and Organizations: Software of the Mind, New York: McGraw-Hill.
IPS (2005), IPS National Competitiveness Research 2005 Report, Seoul: IPS and IPS-NaC.
Koh, I. D., Lee, J. H., Cho, B. K. (2003), Trade Pattern among East Asian Countries and its
Implication for Korea-China-Japan Trade, Seoul: KDI. (In Korean)
Lee, H. B. and Okamoto N. (2002), Analysis of Industrial Interdependency among Japan, China,
and Korea: Application of International Input-Output Table, Seoul: KIEP. (In Korean)
Lee, J. C. (2004), Current Status and Future Direction of Economic Cooperation between China,
Japan and Korea: Related to a Possible CJK FTA, Seoul: KIEP. (In Korean)
Moon, H. C. and Peery, N. S. (1995), “Competitiveness of Product, Firm, Industry, and Nation in a
Global Business”, Competitiveness Review, 5(1): 37-43.
Moon, H. C., Rugman, A. M. and Verbeke, A. (1998), “A Generalized Double Diamond Approach
to the Global Competitiveness of Korea and Singapore”, International Business Review, 7:
135-150.
Moon, H. C. and Choi, E. K. (2001), Cultural Impact on National Competitiveness, Journal of
International and Area Studies, 8(2): 21-36.
Perlmutter, H. V. (1969), “The Tortuous Evolution of the Multinational Corporation,” Columbia
Journal of World Business, (4): 9-18.
Porter, M. E. (1990), The Competitive Advantage of Nations, New York: Free Press.
Porter, M. E. (1998), “Clusters and the New Economics of Competition”, Harvard Business Review,
76(6): 77-90.
Porter, M. E. (2003), Malaysia's Competitiveness: Moving to the Next Stage, Kuala Lumpur,
Malaysia (Presentation slides).
Porter, M. E., Takeuchi, H. and Sakakibara, M. (2000), Can Japan compete?, Cambridge,
Massachusetts: Perseus Publishing.
Rugman, A. M. and D'Cruz, J. R. (1993), “The Double Diamond Model of International
Competitiveness: The Canadian Experience”, Management International Review, 33: 17-39.
Rugman, A. M. (1991), “Diamond in the Rough”, Business Quarterly, 55(3): 61-64.
Schein, E. H. (1992), Organizational Culture and Leadership. San Francisco: Jossey-Bass Publishers.
Smith, A. (1776) (1937), “An Inquiry into the Nature and Causes of the Wealth of Nations”, in
Charles W.E. (Eds.), The Harvard Classics, New York: P.F. Collier & Son Corporation.

Competition and Cooperation between Korea and Japan: A Business Perspective
19
Trompenaars, Fon and Hampden-Turner, C. (1998), Riding The Waves of Culture: Understanding
Cultural Diversity in Global Business, New York: McGraw-Hill.
Recommended