Mobile source emission estimates using remote sensing data from Mexican cities
José Andrés Aguilar V. Garibay, G. Tzintzun, I. Cruz-Jimate & G. Echániz
(collaborating authors)
National Institute of Ecology - México

Contents
• Motivation and goals
• Method
• Results

Motivation andstudy goals
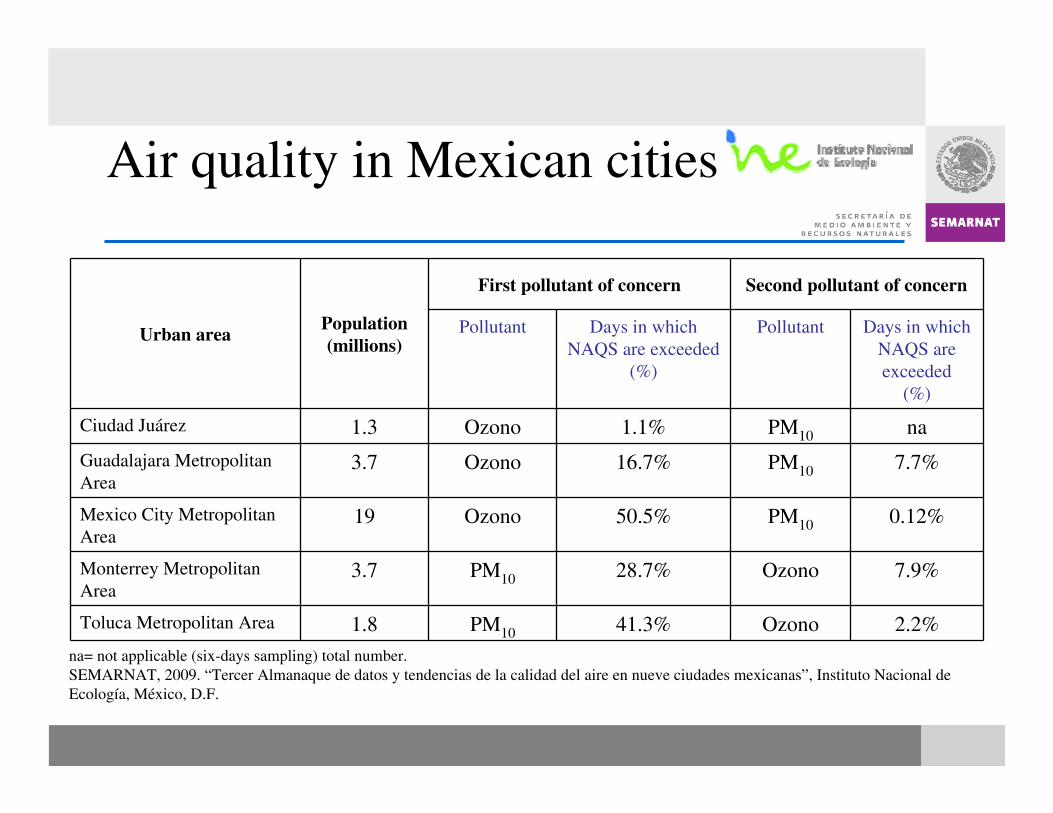
Air quality in Mexican cities
Urban areaPopulation(millions)
First pollutant of concern Second pollutant of concern
Pollutant Days in whichNAQS are exceeded
(%)
Pollutant Days in whichNAQS are exceeded
(%)
Ciudad Juárez 1.3 Ozono 1.1% PM10 na
Guadalajara Metropolitan Area
3.7 Ozono 16.7% PM10 7.7%
Mexico City Metropolitan Area
19 Ozono 50.5% PM10 0.12%
Monterrey Metropolitan Area
3.7 PM10 28.7% Ozono 7.9%
Toluca Metropolitan Area 1.8 PM10 41.3% Ozono 2.2%
na= not applicable (six-days sampling) total number. SEMARNAT, 2009. “Tercer Almanaque de datos y tendencias de la calidad del aire en nueve ciudades mexicanas”, Instituto Nacional de Ecología, México, D.F.
National EmissionsInventory (NEI 1999)• México’s NEI shows transport is the main source of NOx and
VOC emissions
• However, in Mexican cities, mobile source emission inventories are traditionally calculated using emission factors and deterioration rates developed by the US-EPA
México-specific data for urban areas besides Mexico City is required to improve emissions estimates from mobile sources
(vehicle characteristics, activity data, emission factors), to design adequate policies and measure progress of on-road fleet.
Goals
• Assess the emission characteristics of in-use vehicle fleet, in terms of vehicle age and type
• Obtain emission factors, activity data and relevant characteristics of in-use vehicles in the Monterrey Metropolitan Area
• Derivate a fuel-based emissions inventory based on information gathered through the use of a remote sensing device and surveys.
Provide national policymakers and city officials with input for decision making.
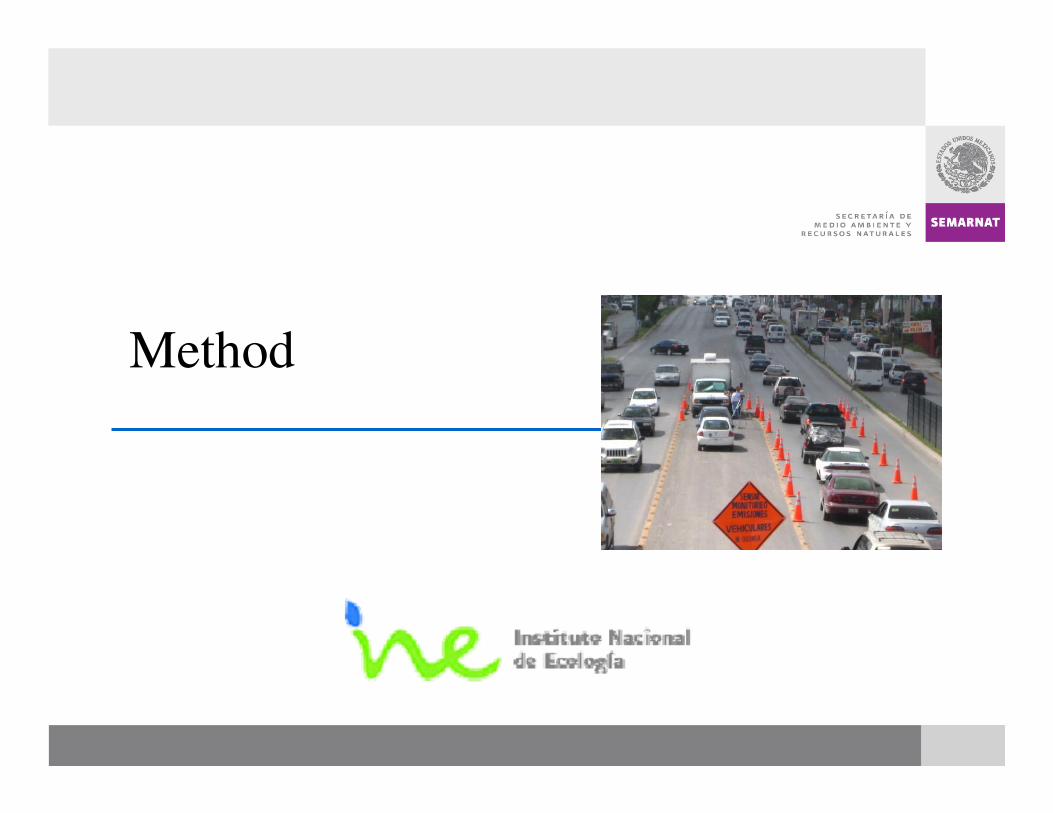
Method
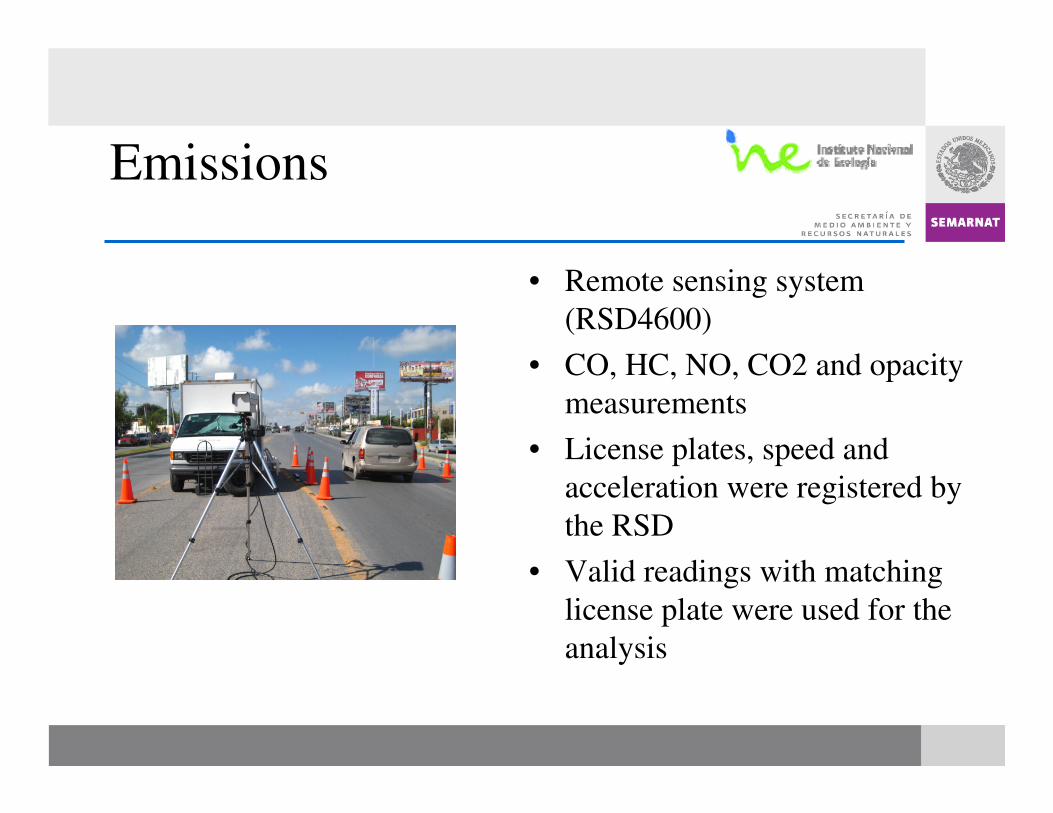
Emissions
• Remote sensing system (RSD4600)
• CO, HC, NO, CO2 and opacity measurements
• License plates, speed and acceleration were registered by the RSD
• Valid readings with matching license plate were used for the analysis
Emissions
• Duration: ten days (May 27 to June 5, 2008), approx. six hours (3 to 4 thousand vehicles per day)
• Ten different sampling sites in seven different municipalities in the MMA
• Sites were selected to ensure diversity of land use and socioeconomic strata
• Vehicle counts at selected sites: 200 to 2,000 per hour
• Average vehicle speed: 5-65 mph
• Vehicles were under slight acceleration
Fleet characteristics
• RSD readings:- Vehicle types distribution (automobiles, pick-ups, SUVs) from license plates database
• Vehicle counts:- To estimate actual size of on-road fleet
- Carried out at selected intersections near RSD sampling sites
• Sales statistics:– From national Association of Automobile Manufacturers
(AMIA)
– To estimate mortality curves and size of on-road fleet
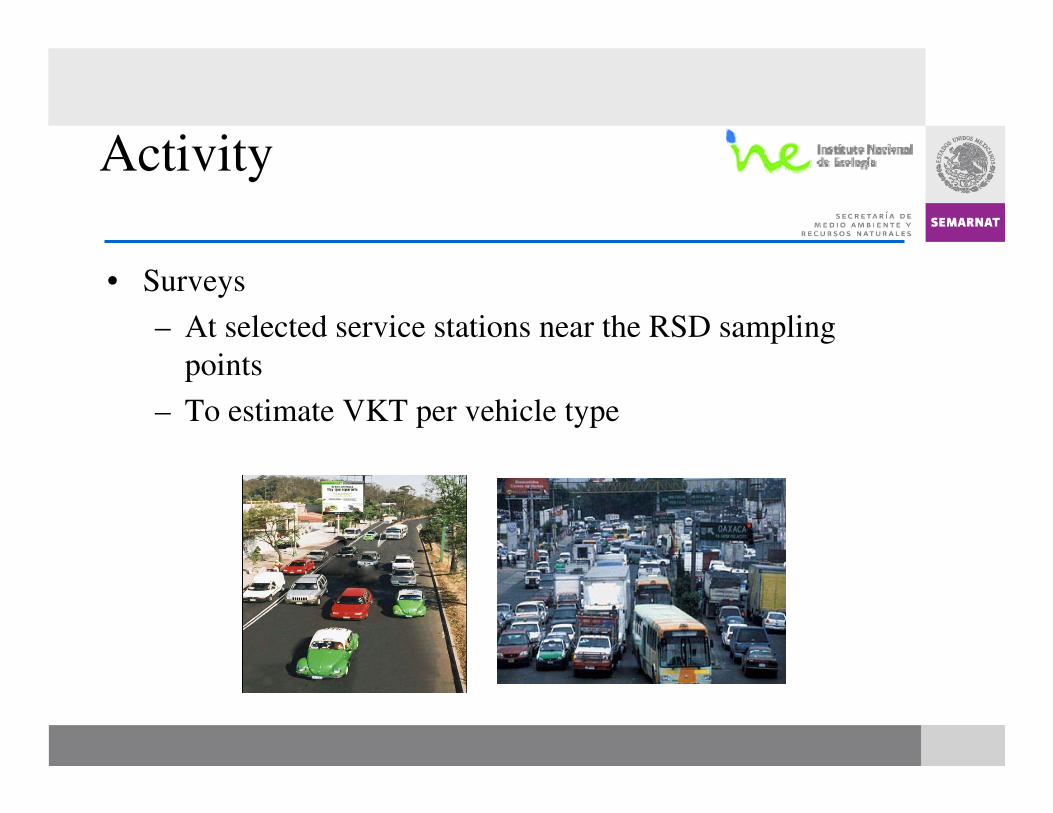
Activity
• Surveys
– At selected service stations near the RSD sampling points
– To estimate VKT per vehicle type
Emissions inventory
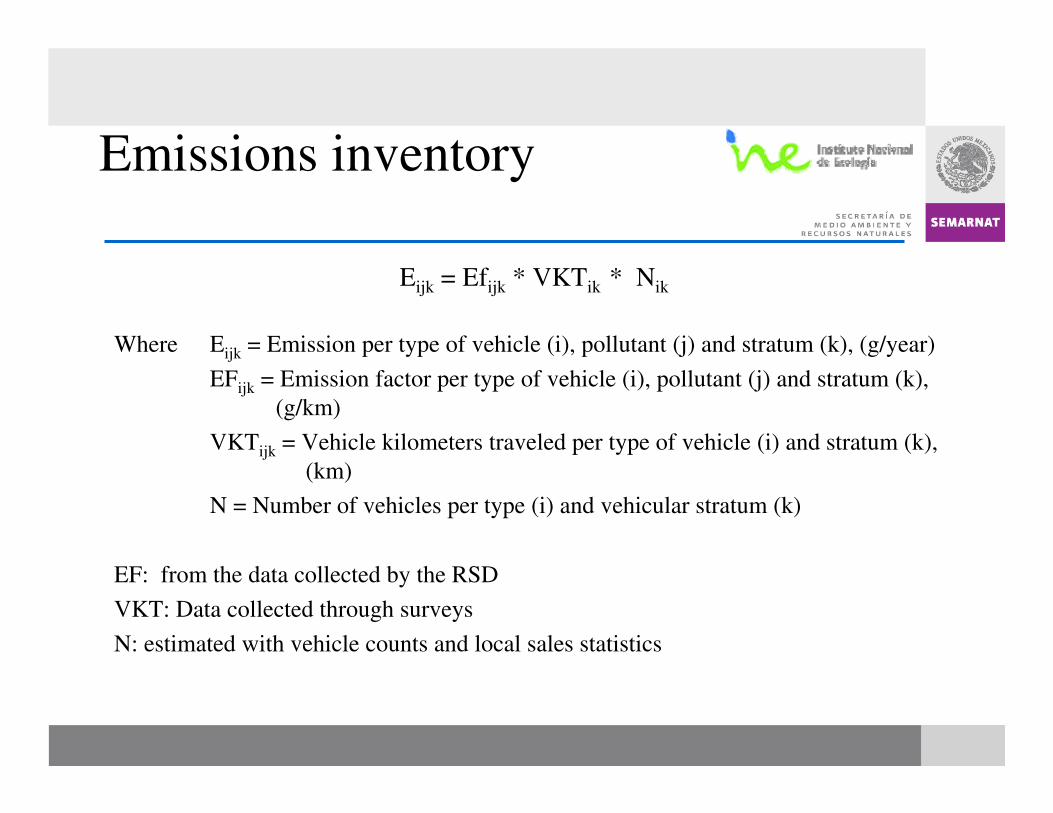
Eijk = Efijk * VKTik * Nik
Where Eijk = Emission per type of vehicle (i), pollutant (j) and stratum (k), (g/year)
EFijk = Emission factor per type of vehicle (i), pollutant (j) and stratum (k), (g/km)
VKTijk = Vehicle kilometers traveled per type of vehicle (i) and stratum (k), (km)
N = Number of vehicles per type (i) and vehicular stratum (k)
EF: from the data collected by the RSD
VKT: Data collected through surveys
N: estimated with vehicle counts and local sales statistics
Emissions inventory (2)
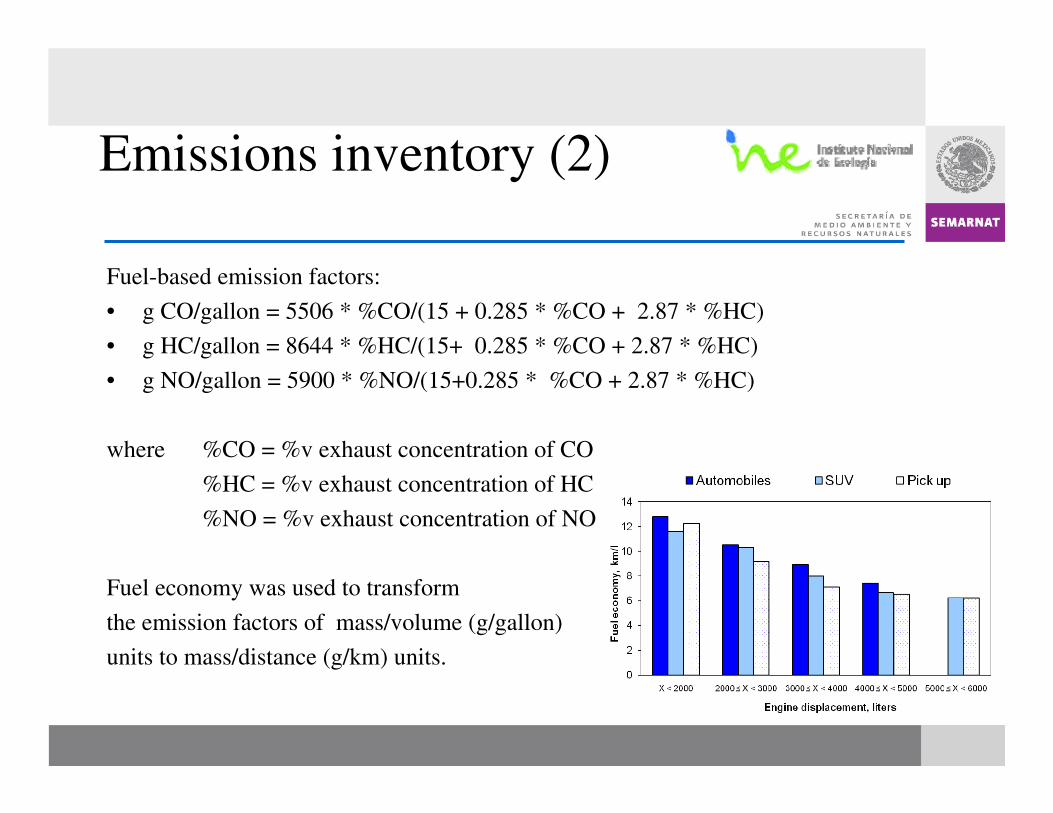
Fuel-based emission factors:
• g CO/gallon = 5506 * %CO/(15 + 0.285 * %CO + 2.87 * %HC)
• g HC/gallon = 8644 * %HC/(15+ 0.285 * %CO + 2.87 * %HC)
• g NO/gallon = 5900 * %NO/(15+0.285 * %CO + 2.87 * %HC)
where %CO = %v exhaust concentration of CO
%HC = %v exhaust concentration of HC
%NO = %v exhaust concentration of NO
Fuel economy was used to transform
the emission factors of mass/volume (g/gallon)
units to mass/distance (g/km) units.
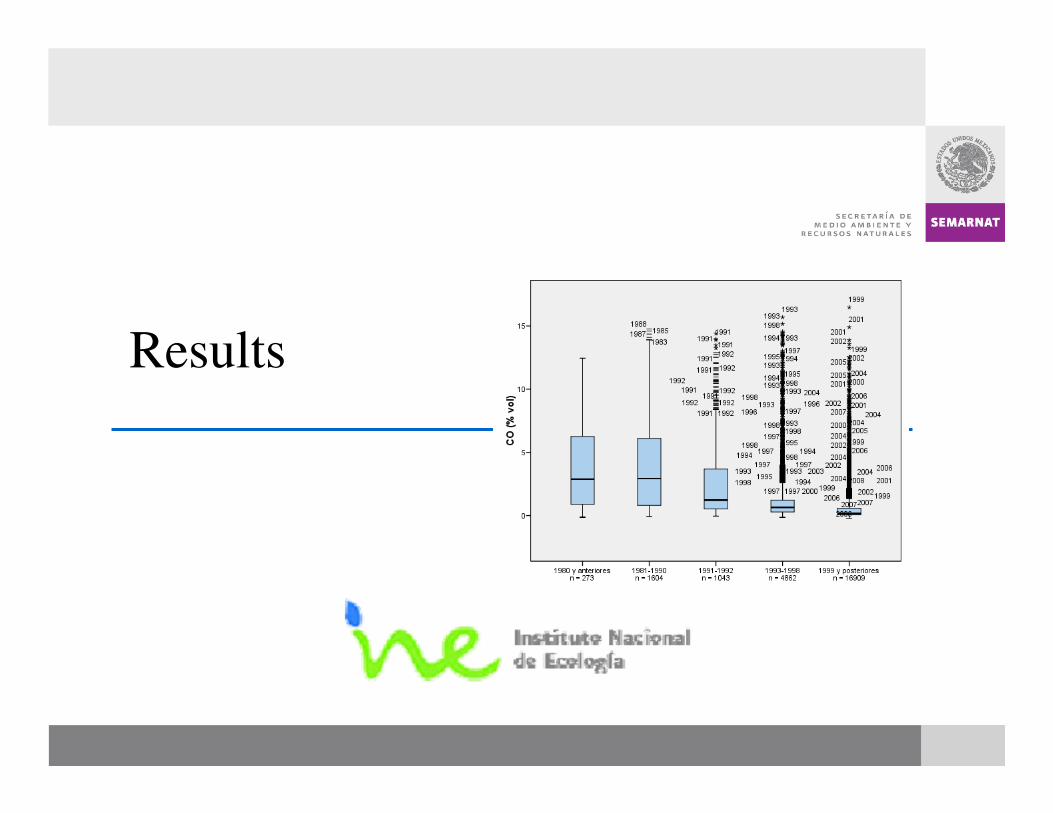
Results
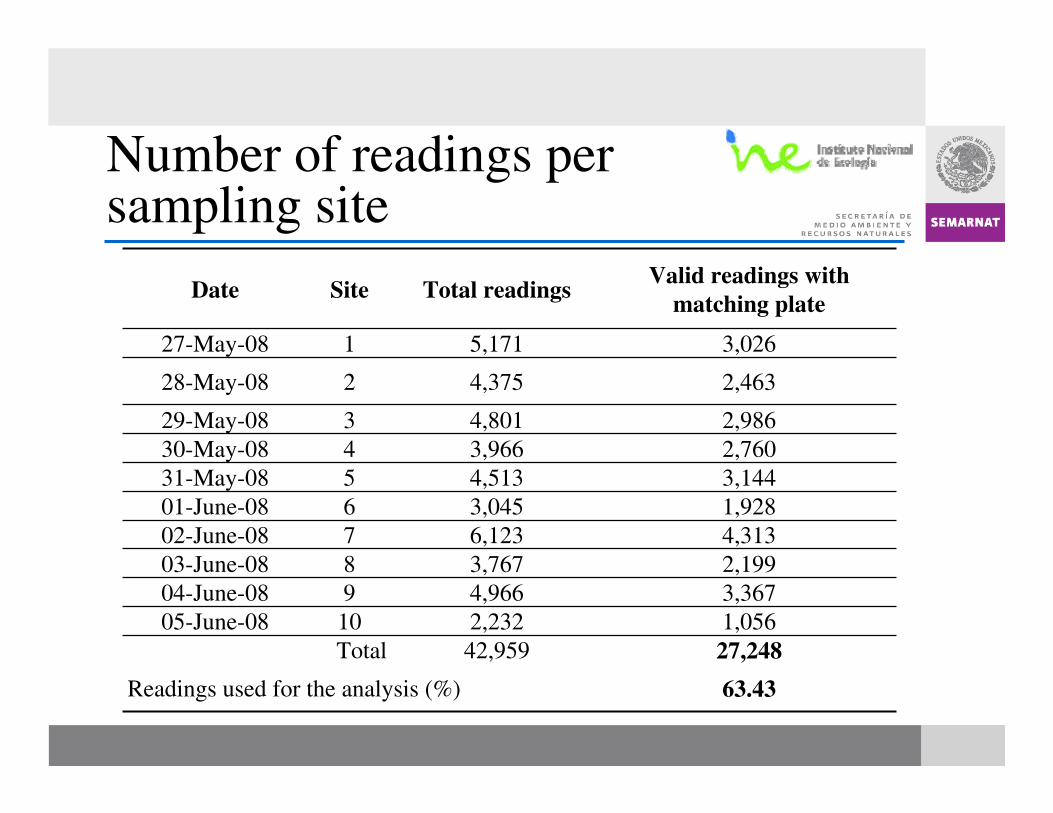
Date Site Total readingsValid readings with
matching plate
27-May-08 1 5,171 3,026
28-May-08 2 4,375 2,463
29-May-08 3 4,801 2,98630-May-08 4 3,966 2,76031-May-08 5 4,513 3,14401-June-08 6 3,045 1,92802-June-08 7 6,123 4,31303-June-08 8 3,767 2,19904-June-08 9 4,966 3,36705-June-08 10 2,232 1,056
Total 42,959 27,248
Readings used for the analysis (%) 63.43
Number of readings per sampling site
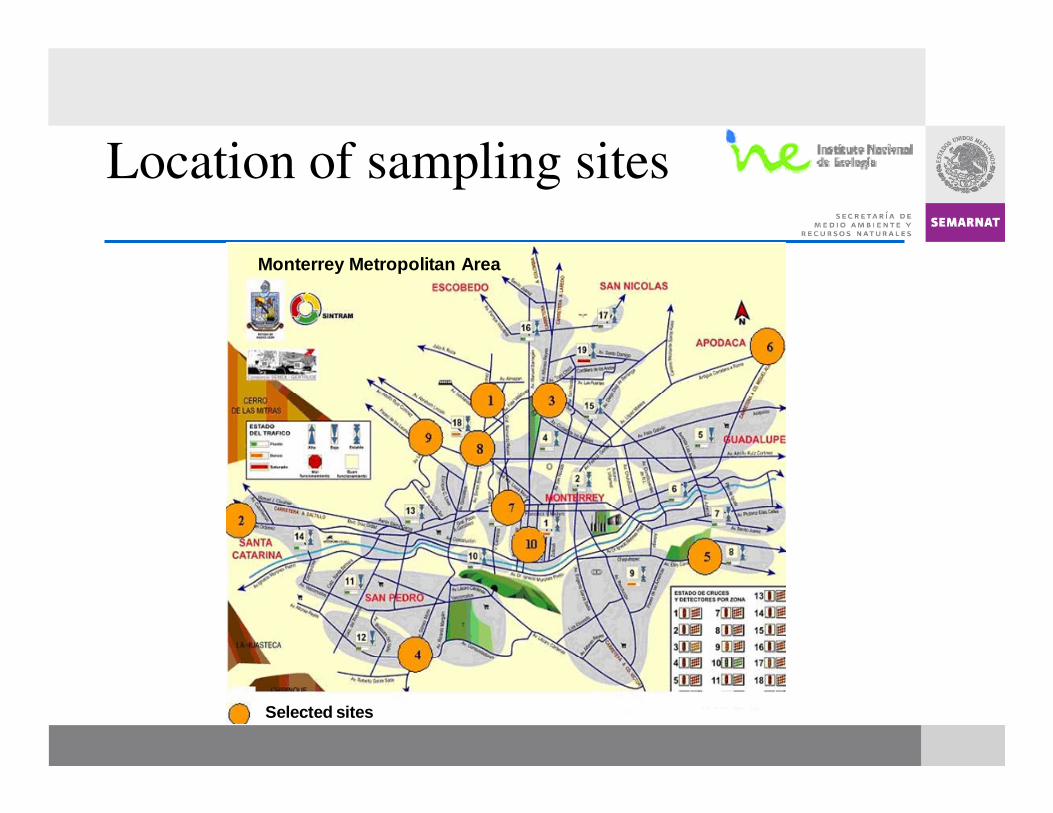
Location of sampling sites
Monterrey Metropolitan Area
Selected sites
0
5
10
15
20
25
30
5 10 15 20 25 30 35 40 45 50 55 60 65 70
Speed (km.h-1)
Perc
enta
ge o
f veh
icle
s
0
5
10
15
20
25
30
35
-5 -4 -3 -2 -1 -0.5 -0.2 0.2 1 2 3 4 5 6
Acceleration (Km.h-1.s-1)
Perc
enta
ge o
f veh
icle
s
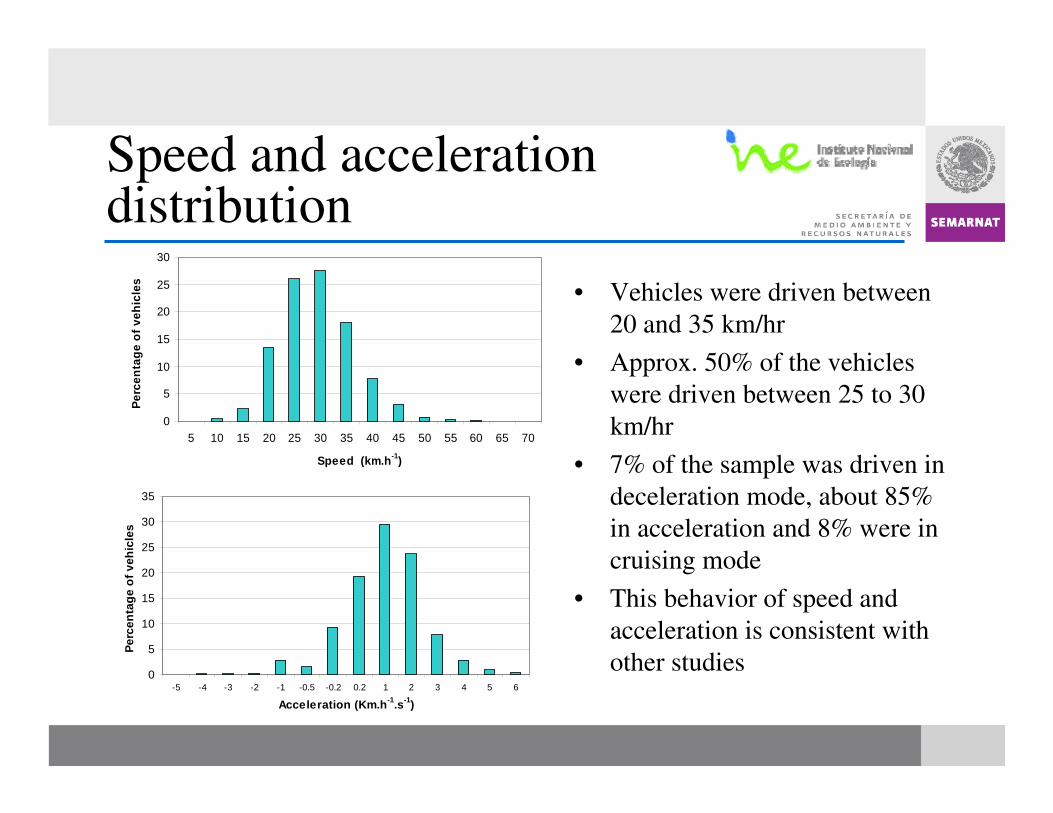
Speed and accelerationdistribution
• Vehicles were driven between 20 and 35 km/hr
• Approx. 50% of the vehicles were driven between 25 to 30 km/hr
• 7% of the sample was driven in deceleration mode, about 85% in acceleration and 8% were in cruising mode
• This behavior of speed and acceleration is consistent with other studies
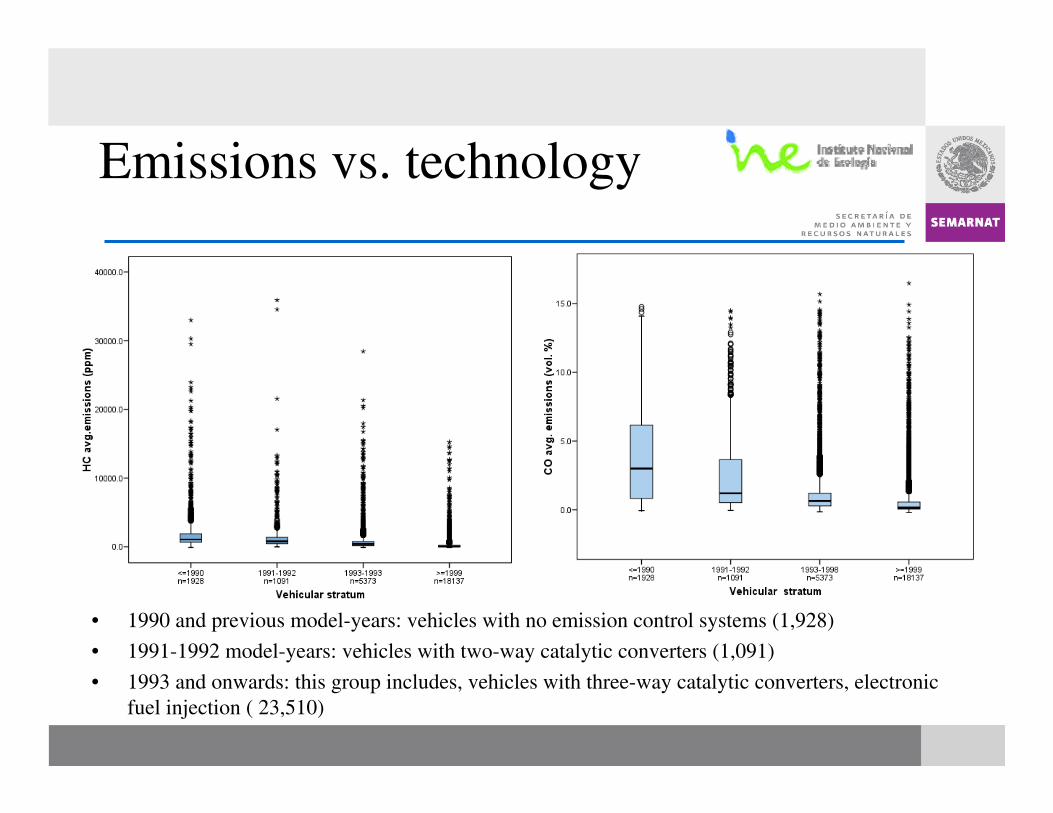
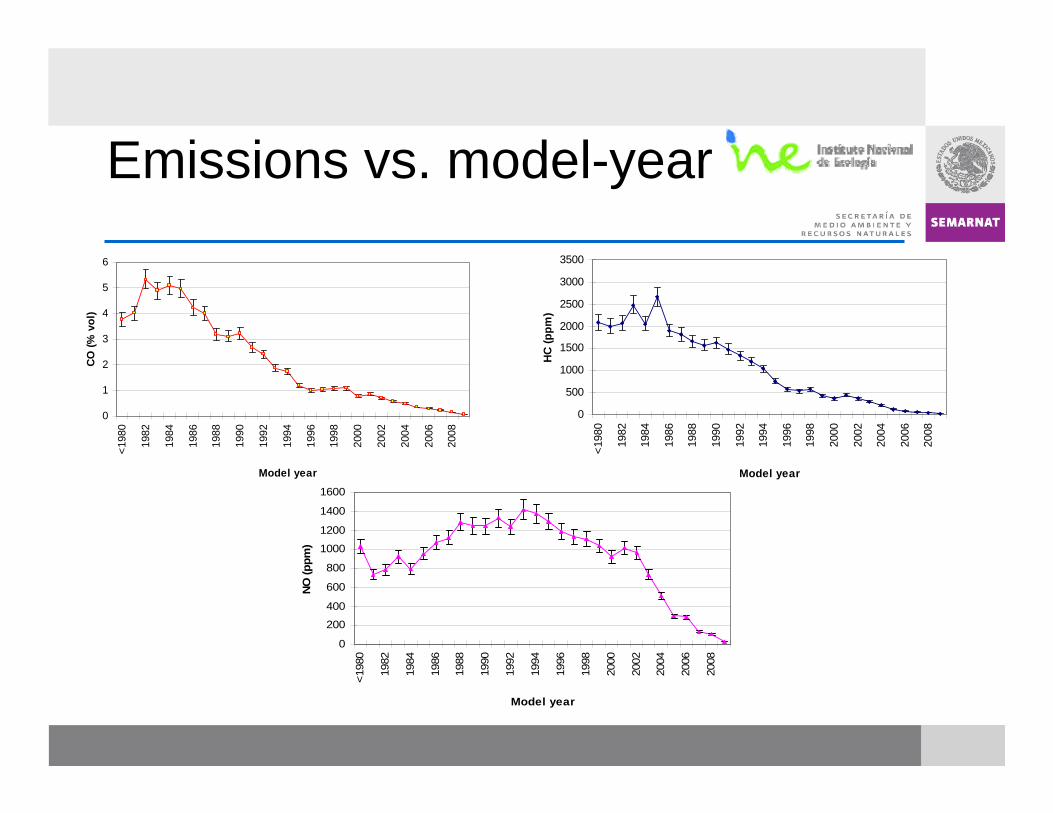
Emissions vs. technology
• 1990 and previous model-years: vehicles with no emission control systems (1,928)
• 1991-1992 model-years: vehicles with two-way catalytic converters (1,091)
• 1993 and onwards: this group includes, vehicles with three-way catalytic converters, electronic fuel injection ( 23,510)
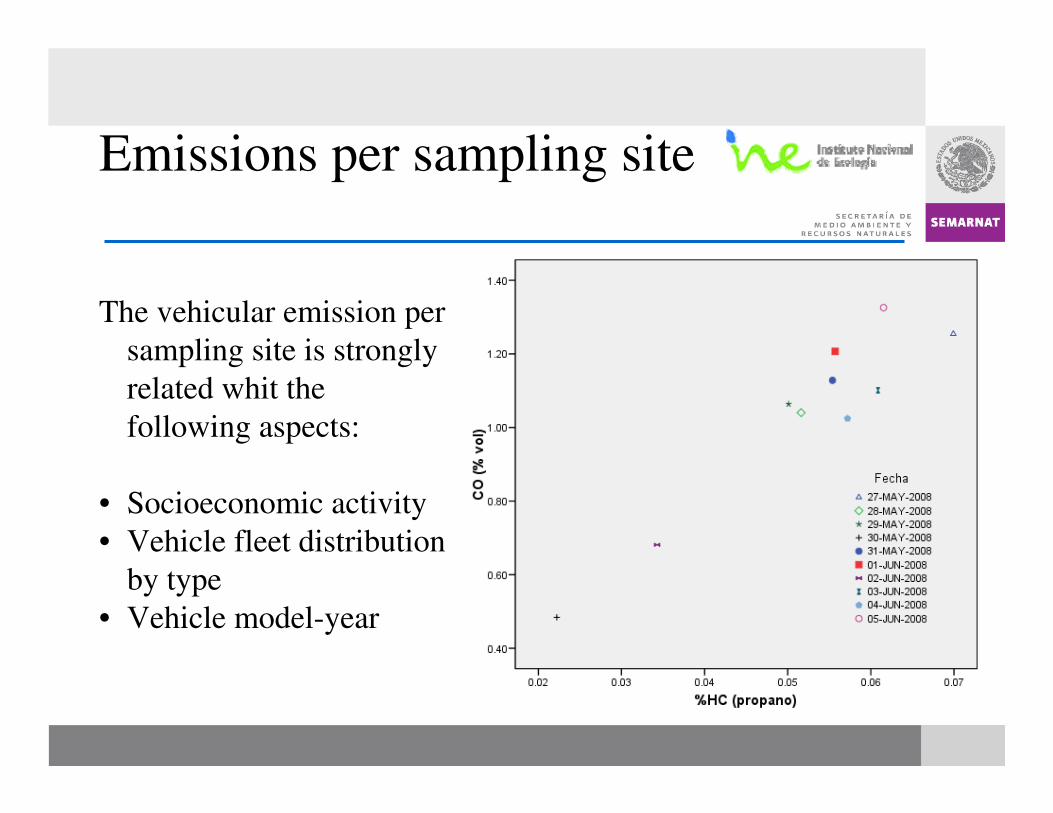
Emissions per sampling site
The vehicular emission per sampling site is strongly related whit the following aspects:
• Socioeconomic activity• Vehicle fleet distribution
by type• Vehicle model-year
0
200
400
600
800
1000
1200
1400
1600
<198
0
1982
1984
1986
1988
1990
1992
1994
1996
1998
2000
2002
2004
2006
2008
Model year
NO (p
pm)
0
1
2
3
4
5
6
<198
0
1982
1984
1986
1988
1990
1992
1994
1996
1998
2000
2002
2004
2006
2008
Model year
CO (%
vol
)
0
500
1000
1500
2000
2500
3000
3500
<198
0
1982
1984
1986
1988
1990
1992
1994
1996
1998
2000
2002
2004
2006
2008
Model year
HC
(ppm
)
Emissions vs. model-year
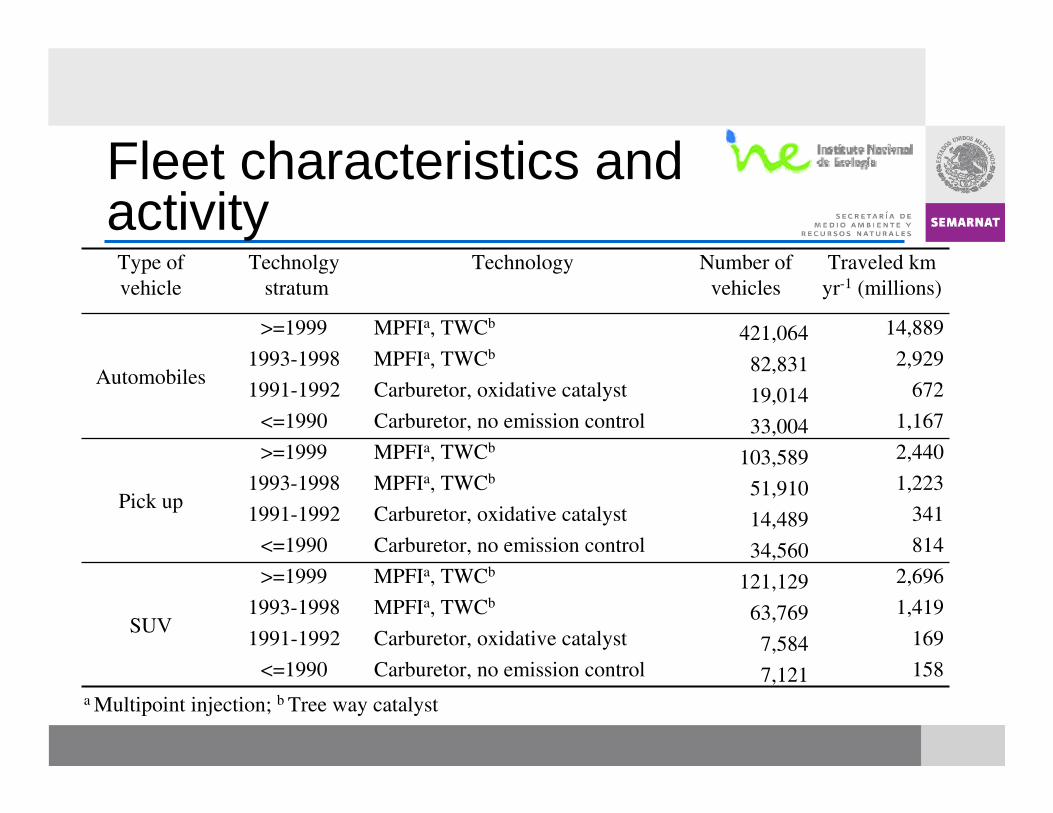
Type of vehicle
Technolgystratum
Technology Number of vehicles
Traveled km yr-1 (millions)
Automobiles
>=1999 MPFIa, TWCb421,064 14,889
1993-1998 MPFIa, TWCb82,831 2,929
1991-1992 Carburetor, oxidative catalyst 19,014 672
<=1990 Carburetor, no emission control 33,004 1,167
Pick up
>=1999 MPFIa, TWCb103,589 2,440
1993-1998 MPFIa, TWCb51,910 1,223
1991-1992 Carburetor, oxidative catalyst 14,489 341
<=1990 Carburetor, no emission control 34,560 814
SUV
>=1999 MPFIa, TWCb121,129 2,696
1993-1998 MPFIa, TWCb63,769 1,419
1991-1992 Carburetor, oxidative catalyst 7,584 169
<=1990 Carburetor, no emission control 7,121 158a Multipoint injection; b Tree way catalyst
Fleet characteristics and activity
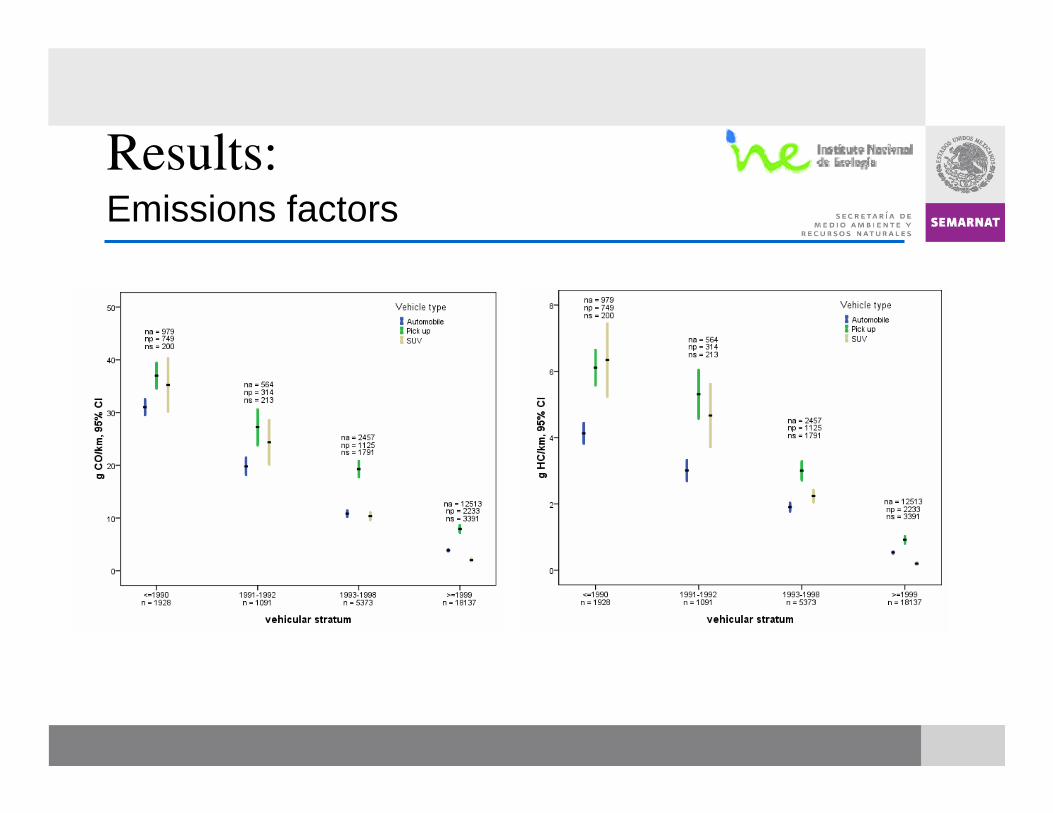
Emissions factorsResults:
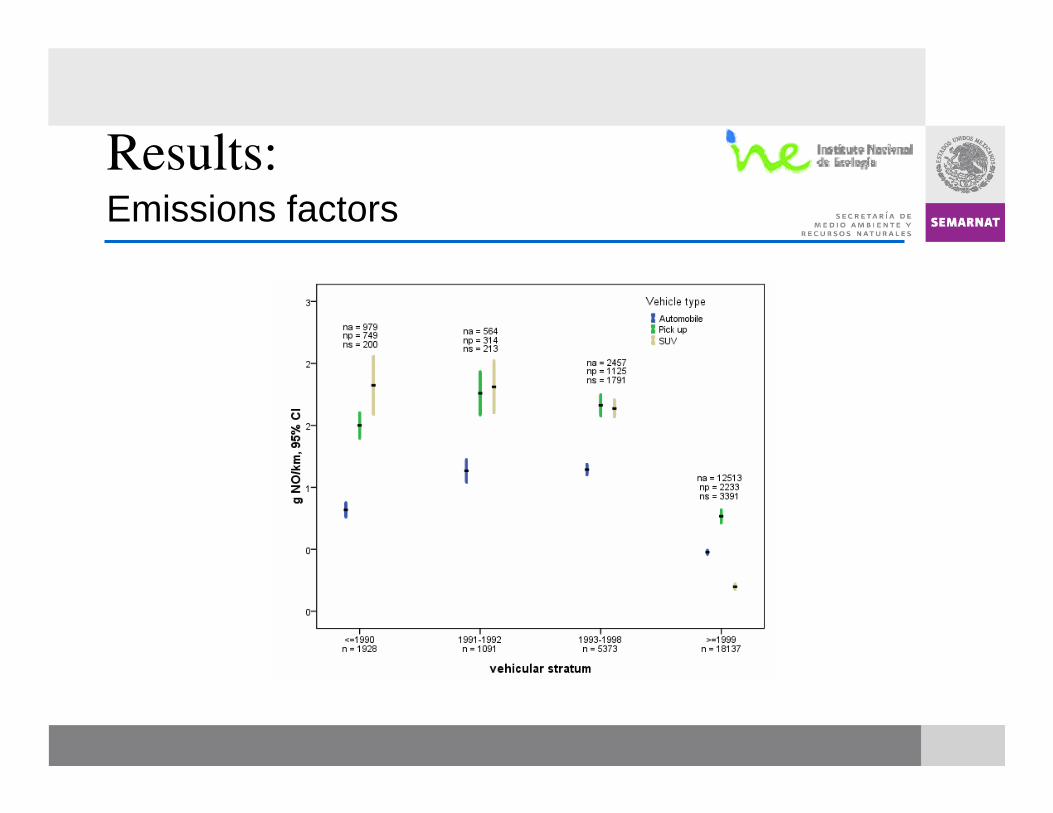
Emissions factorsResults:
81,668±124124,624 ± 3711126,712 ± 1,911441,0861991-1992
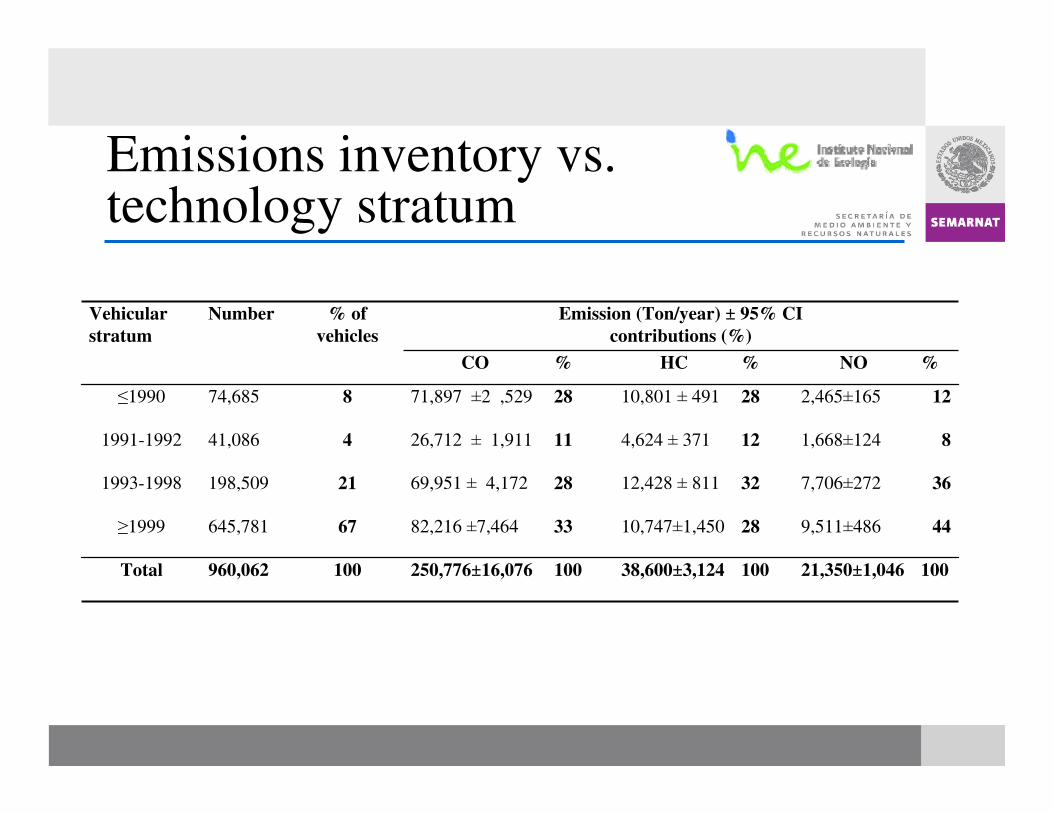
Vehicular stratum
Number % ofvehicles
Emission (Ton/year) ± 95% CIcontributions (%)
CO % HC % NO %
≤1990 74,685 8 71,897 ±2 ,529 28 10,801 ± 491 28 2,465±165 12
1993-1998 198,509 21 69,951 ± 4,172 28 12,428 ± 811 32 7,706±272 36
≥1999 645,781 67 82,216 ±7,464 33 10,747±1,450 28 9,511±486 44
Total 960,062 100 250,776±16,076 100 38,600±3,124 100 21,350±1,046 100
Emissions inventory vs. technology stratum
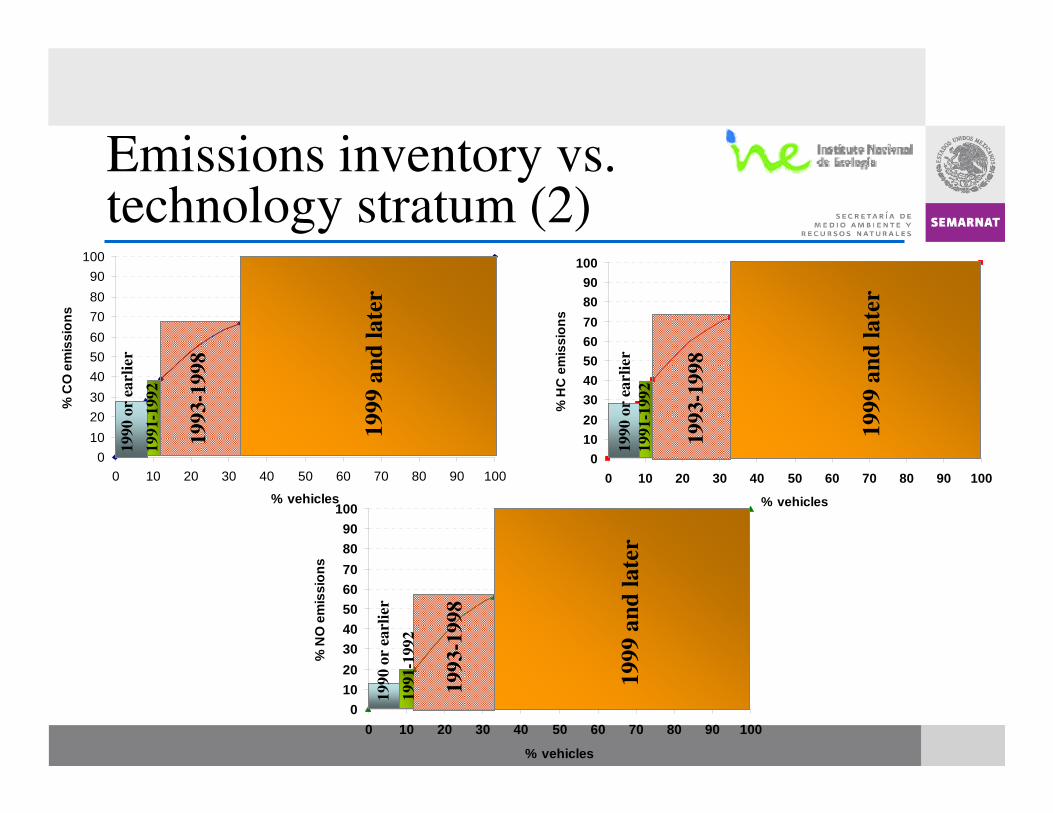
Emissions inventory vs. technology stratum (2)
0102030405060708090
100
0 10 20 30 40 50 60 70 80 90 100
% vehicles
% C
O e
mis
sion
s
0102030405060708090
100
0 10 20 30 40 50 60 70 80 90 100
% vehicles
% H
C e
mis
sion
s
0102030405060708090
100
0 10 20 30 40 50 60 70 80 90 100
% vehicles
% N
O e
mis
sion
s
1990
or
earl
ier
1991
-199
2
1993
-199
8
1999
and
late
r
1990
or
earl
ier
1991
-199
2
1993
-199
8
1999
and
late
r
1990
or
earl
ier
1991
-199
2
1993
-199
8
1999
and
late
r
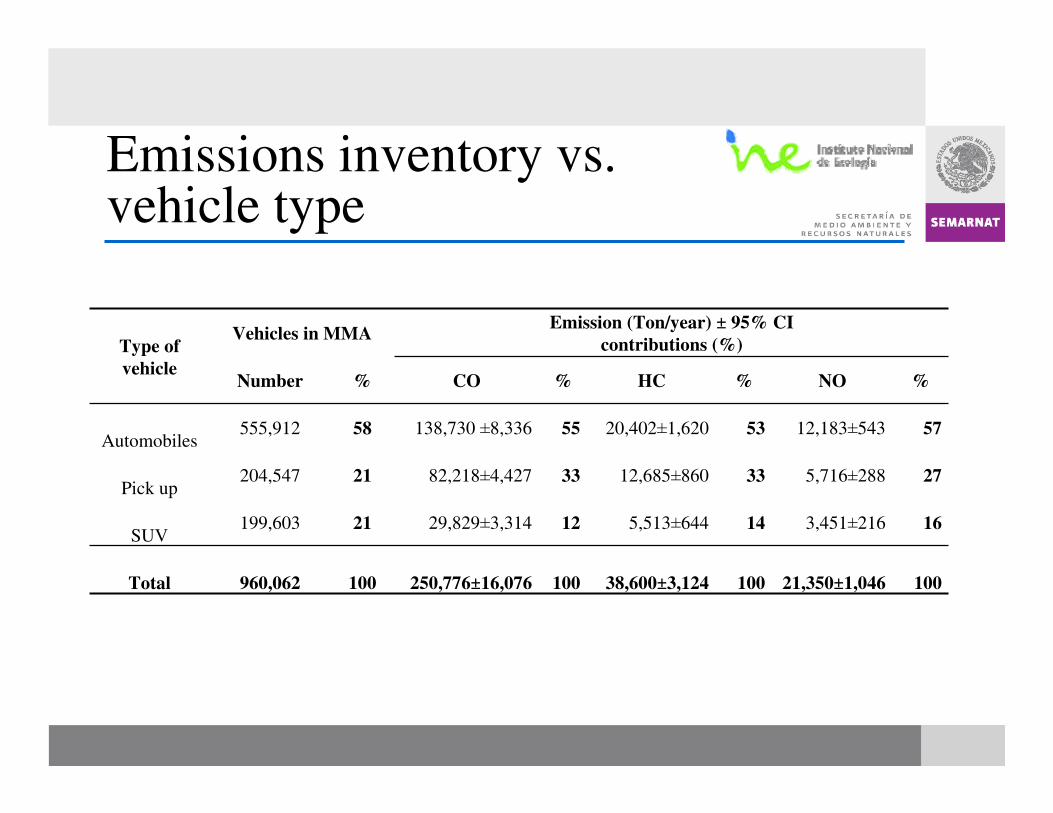
Type of vehicle
Vehicles in MMAEmission (Ton/year) ± 95% CI
contributions (%)
Number % CO % HC % NO %
Automobiles555,912 58 138,730 ±8,336 55 20,402±1,620 53 12,183±543 57
Pick up204,547 21 82,218±4,427 33 12,685±860 33 5,716±288 27
SUV199,603 21 29,829±3,314 12 5,513±644 14 3,451±216 16
Total 960,062 100 250,776±16,076 100 38,600±3,124 100 21,350±1,046 100
Emissions inventory vs. vehicle type
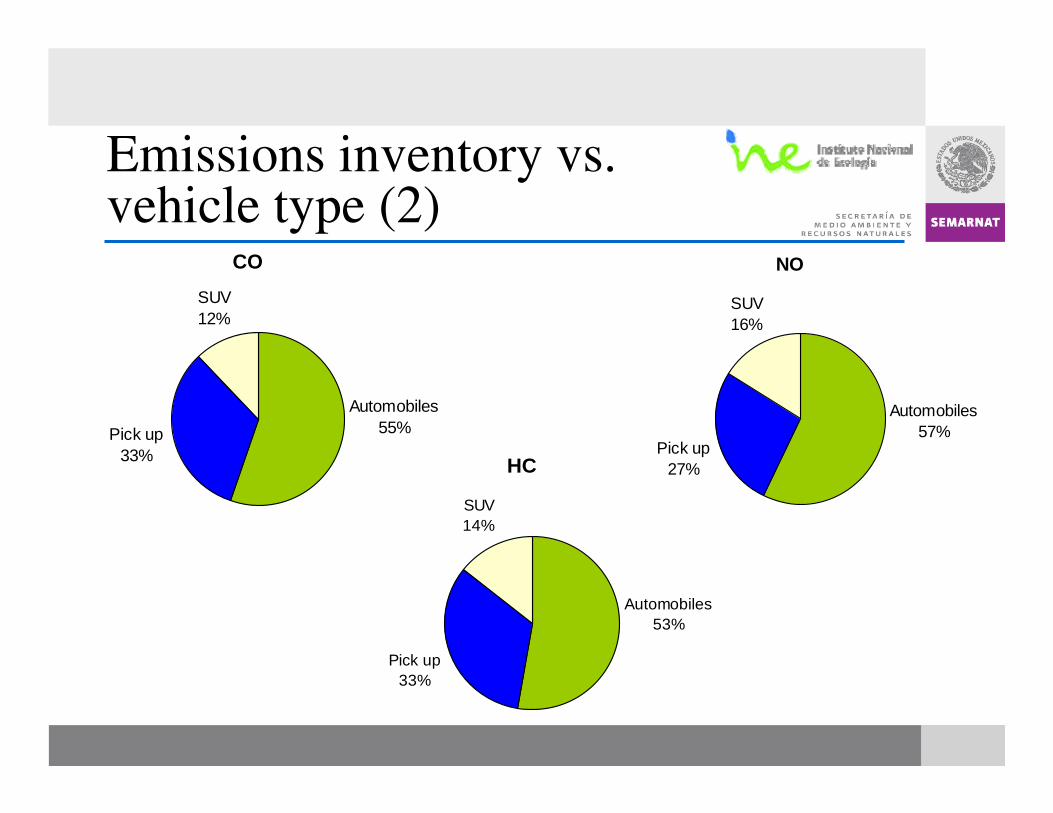
HC
SUV14%
Automobiles53%
Pick up33%
NO
Pick up27%
Automobiles57%
SUV16%
COSUV12%
Automobiles55%Pick up
33%
Emissions inventory vs. vehicle type (2)
Conclusions
• The inventory shows that even though the fraction of vehicles older than 10 years is not large, their contribution to emissions is quite significant
• The differences in the emission factors calculated for pick-up trucks vs. SUVs and automobiles in the two newer strata suggest that emissions from pick-ups increase more rapidly with age, probably because pick-ups are mostly used for more intensive uses than SUVs and automobiles.
• These results provide local officials with field input for the development of a local mandatory I/M program
• Future work includes comparing our results with existing mobile source emissions inventories in the MMA
Acknowledgements
The authors would like to thank:
• The personnel of CENICA-INE
• The Agency for Environmental Protection and Natural
Resources from Nuevo León
• SEMARNAT’s Regional Office in Nuevo León
• Environmental and transit authorities of the 7
municipalities in the MMA
• Jim Lents from ISSRC
• The Center for Sustainable Transport in Mexico
Recommended