US EPA, Office of Research and DevelopmentNational Exposure Research Laboratory, Ecosystems Research Division, Athens, Georgia
Christopher D. Knightes,1 Heather E. Golden,2 Paul M. Bradley,3
Gary M. Davis1, Celeste Journey3, Paul A. Conrads,3
Modeling Mercury Exposure at Different Scalesin the McTier Creek Watershed and Edisto
River Basin, SC, USA
1 US EPA, Office of Research and Development, National Exposure Research Laboratory, Athens, Georgia, USA2 US EPA, Office of Research and Development, National Exposure Research Laboratory, Cincinnati, Ohio, USA
3 US Geological Survey, South Carolina Water Science Center, Columbia, South Carolina, USA
Water: One Resource – Shared Effort – Common FutureEighth National Monitoring Conference
April 30 – May 4, 2012 ● Portland, Oregon

US EPA, Office of Research and DevelopmentNational Exposure Research Laboratory, Ecosystems Research Division, Athens, Georgia 1
Presentation Outline
Research Background
Research Motivation
Goal and Questions
Research Approach
Results
Parallel Research and Future Work

US EPA, Office of Research and DevelopmentNational Exposure Research Laboratory, Ecosystems Research Division, Athens, Georgia
Research Background In the USA as of 2008
50 states, 1 USterritory, and 3 tribeshave Hg fishadvisories
80% of all fishadvisories in USsurface waters are atleast partially due tomercury
68,000 km2 of lakes
2,100,000 km ofrivers

US EPA, Office of Research and DevelopmentNational Exposure Research Laboratory, Ecosystems Research Division, Athens, Georgia
US Clean Water Act Section 303(d)
Number of Causes of Impairment Reported
0 2000 4000 6000 8000 10000 12000
Habitat Alterations
Noxious Aquatic Plants
Cause Unknown
Salinity/Total Dissolved
Solids/Chlorides/Sulfates
Pesticides
Temperature
Turbidity
Cause Unknown -
Impaired Biota
pH/Acidity/Caustic
Conditions
Mercury
Polychlorinated Biphenyls
(PCBs)
Sediment
Organic
Enrichment/Oxygen
Nutrients
Metals (other than
Mercury)
PathogensLaw requires statesdevelop a list ofimpaired waters anddevelop TMDLs foridentified waters
Almost 4,000 waters inthe US require HgTMDLs
“to restore and maintain the chemical, physical, and biological integrityof the Nation’s waters”

US EPA, Office of Research and DevelopmentNational Exposure Research Laboratory, Ecosystems Research Division, Athens, Georgia
Research Motivation 80% of all fish advisories in US surface waters are at least partially
due to Hg
> 2,000,000 km of rivers have Hg fish consumption advisories
Almost 4,000 water bodies are listed on State Clean Water ActSection 303(d) as impaired due to Hg, triggering the developmentand implementation of Total Maximum Daily Loads (TMDLs) for Hg
Hg comes from a variety of sources, all of these sources must beaccounted for in the TMDL process
Streams and Rivers are intimately linked with their watersheds andincorporating out-of-channel processes and loading sources is criticalto understanding Hg exposure

US EPA, Office of Research and DevelopmentNational Exposure Research Laboratory, Ecosystems Research Division, Athens, Georgia
Overall Research Goals
Understand and minimize mercury exposure towildlife and humans by improving the
understanding of mercury fate and transport inwatersheds and surface waters

US EPA, Office of Research and DevelopmentNational Exposure Research Laboratory, Ecosystems Research Division, Athens, Georgia
Research Questions
What processes and factors govern mercury exposureconcentrations in streams and rivers
How can we better inform the development of mercury TMDLsthat are often developed for large basins (series of 8 digit HUCs)
How can we use mechanistic, differential mass-balance models tobetter understand mercury fate and transport in
- Streams
- Rivers
- Headwater watersheds
- Regional Basins
How can we scale up detailed research studies to understandmercury exposure at larger scales and better understand impactsof management strategies

US EPA, Office of Research and DevelopmentNational Exposure Research Laboratory, Ecosystems Research Division, Athens, Georgia
Research Approach
Use mechanistic, differential mass balance models tosimulate the fate and transport of mercury.
Use multiple scales of models to investigate processesat different scales
Use focused reach study to inform sub-basin and basinwatershed modeling of Hg
Use watershed model to inform spatially explicit regionalbasin

US EPA, Office of Research and DevelopmentNational Exposure Research Laboratory, Ecosystems Research Division, Athens, Georgia
Research Approach: Mechanistic Models
Watershed Model: Visualizing Ecosystems for LandManagement Assessment for Hg (VELMA-Hg) (seeposter session)
o Simulates
– Hydrology (Runoff, subsurface for 4 soil layers)
– Carbon: Dissolved Organic and Soil Organic
– Nitrogen: Ammonium, Nitrate, Dissolved Organic
– Mercury: MeHg, Hg(II)
– Processes: methylation, demethylation,reduction/evasion
Spatially and temporally explicit mechanistic,differential mass balance model

US EPA, Office of Research and DevelopmentNational Exposure Research Laboratory, Ecosystems Research Division, Athens, Georgia
Study Site: McTier Creek Watershed, SC, US
Sand Hills region of UpperCoastal Plain, SC
79 km2 drainage area
Mixed land cover: 49% forest,21% grassland and herbaceous,16% agriculture, 8% wetland, 5%developed, 1% open water
Shallow groundwater systemo Low – normal flow: towardstream channelo High flow: same withincreased area of groundwater-surface water exchange
Land-cover data from 2001National Land-Cover Dataset (Homer and others, 2004)Albers projection, NAD 83 datum,Central Meridian - 95 00 00
33”50’
33”48’
33”46’
33”44’
81”38’ 81”36’ 81”34’ 81”32’
Land-cover data from 2001National Land-Cover Dataset (Homer and others, 2004)Albers projection, NAD 83 datum,Central Meridian - 95 00 00
33”50’
33”48’
33”46’
33”44’
81”38’ 81”36’ 81”34’ 81”32’

US EPA, Office of Research and DevelopmentNational Exposure Research Laboratory, Ecosystems Research Division, Athens, Georgia
Research Approach:Modeling Range of Scales
79.4 km2
28 km2
0. 1 km2
Focused Reach sub-watershed watershed

US EPA, Office of Research and DevelopmentNational Exposure Research Laboratory, Ecosystems Research Division, Athens, Georgia
Focused Reach Study:
Sampling• HgT and MeHg concentrations insoil• Sampled at different depths• Provides spatial snapshot of Hgconcentrations
Modeling• VELMA watershed model• Calibrated rate constants usingobserved data• Simulates soil concentrations
• (Hg, N, C)• Output: Q, Hg(II) and MeHg
Vertical Lateral
Layer 1 4.4 m/d 4.1 m/d
Layer 2 2.0 m/d 0.1 m/d
Layer 3 3.2 m/d 4.1 m/d
Layer 4 0.16 m/d 0.074 m/d
Hydraulic Conductivity
Hill top
Hill slope
Riparian
PrecipitationThroughfall
(Hg(II), MeHg)

US EPA, Office of Research and DevelopmentNational Exposure Research Laboratory, Ecosystems Research Division, Athens, Georgia
Focused Reach Study:Methylation/Demethylation
Methylation Rate = km x [Hg(II)] x Q10,m(Tm-20) x Soil Saturation
Demethylation Rate = kd x [MeHg] x Q10,d(Td-20) x Soil Saturation
RateConstant
Zone Layer Value
km Riparian,uplands
All 0.007 d-1
Wetlands All 0.01 d-1
kd All Layers1,2,4
0.015 d-1
All 3 0.03 d-1
Q10,m All All 1.14
Q10,d All All 1.04
Tm All All 15
Td All All 22
Laboratory and fieldstudy being used toparameterizeconstants
Comparingobserved streamconcentrations andsoil concentrationsfor evaluation

US EPA, Office of Research and DevelopmentNational Exposure Research Laboratory, Ecosystems Research Division, Athens, Georgia
Focused Reach Study:Soil Mercury Concentrations and Simulations
Layer 1 Layer 2 Layer 3
MeH
gH
gT
0.0
20.0
40.0
60.0
80.0
100.0
120.0
140.0
D-9
9
A-0
1
S-02
J-04
M-0
5
O-0
6
F-08
J-09
N-1
0
Upland THg (ug/kg)Midland THg (ug/kg)Lowland THg (ug/kg)Wetland THg (ug/kg)
0.0
10.0
20.0
30.0
40.0
50.0
60.0
70.0
D-9
9
A-0
1
S-02
J-04
M-0
5
O-0
6
F-08
J-09
N-1
0
0.0
10.0
20.0
30.0
40.0
50.0
60.0
D-9
9
A-0
1
S-02
J-04
M-0
5
O-0
6
F-08
J-09
N-1
0
0.00
0.50
1.00
1.50
2.00
D-9
9
A-0
1
S-02
J-04
M-0
5
O-0
6
F-08
J-09
N-1
0
Upland THg (ug/kg)Midland THg (ug/kg)
Lowland THg (ug/kg)Wetland THg (ug/kg)
0.000.050.10
0.150.200.250.30
0.350.40
D-9
9
A-0
1
S-02
J-04
M-0
5
O-0
6
F-08
J-09
N-1
0
0.000.050.100.150.200.250.300.350.400.45
D-9
9
A-0
1
S-02
J-04
M-0
5
O-0
6
F-08
J-09
N-1
0

US EPA, Office of Research and DevelopmentNational Exposure Research Laboratory, Ecosystems Research Division, Athens, Georgia
Focused Reach Study

US EPA, Office of Research and DevelopmentNational Exposure Research Laboratory, Ecosystems Research Division, Athens, Georgia
McTier Creek Watershed Modeling:VELMA
15
Gully Creek, 25 km2
Focused Reach, 0.1 km2
Monetta Gauge, 28 km2
New Holland, 79.4 km2
US EPA, Office of Research and DevelopmentNational Exposure Research Laboratory, Ecosystems Research Division, Athens, Georgia
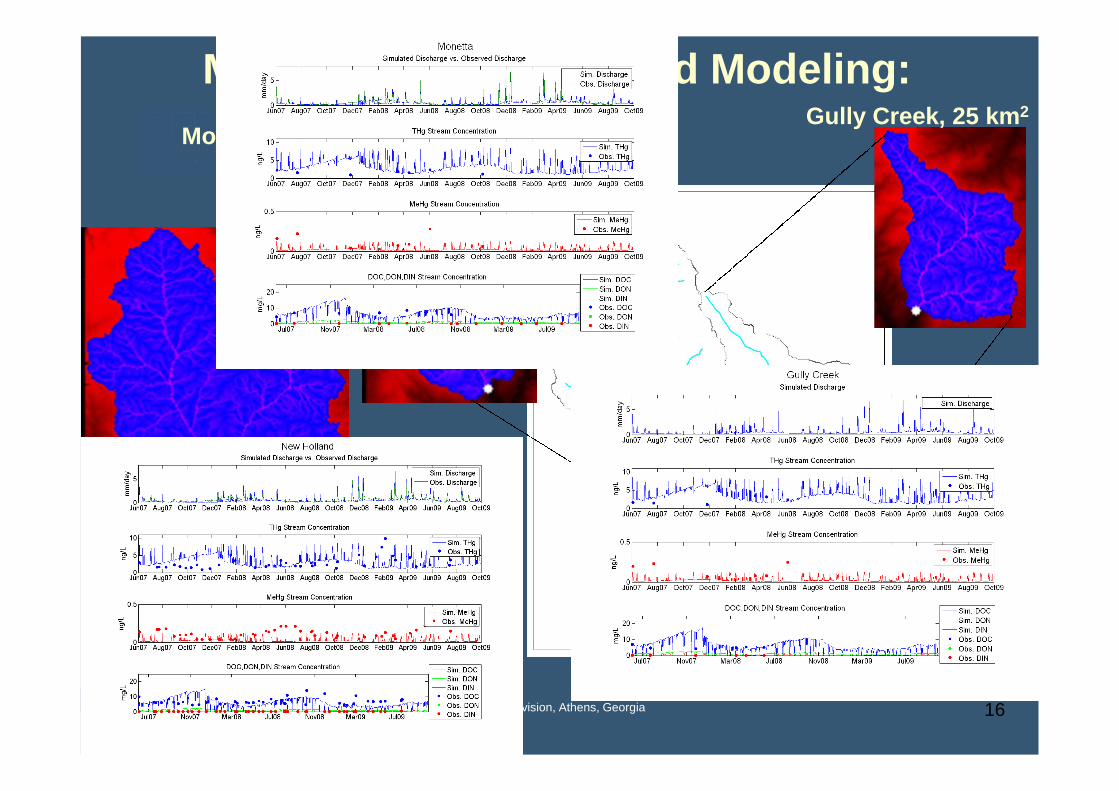
McTier Creek Watershed Modeling:VELMA
16
Gully Creek, 25 km2
Focused Reach, 0.1 km2
Monetta Gauge, 28 km2
New Holland, 79.4 km2

US EPA, Office of Research and DevelopmentNational Exposure Research Laboratory, Ecosystems Research Division, Athens, Georgia
Summary
17
Combination of a field study and modeling effortsprovides insight into biogeochemical cycling of mercury thatneither could afford on its own
Comparison with observed and LOADEST values indicates THgstream concentrations are capture well in VELMA simulations
VELMA simulates MeHg stream concentrations well during part ofthe year, but over-predicts in late summer and early fall

US EPA, Office of Research and DevelopmentNational Exposure Research Laboratory, Ecosystems Research Division, Athens, Georgia
Future Research
18
•VELMA simultaneously simulates• DON (Dissolved Organic Nitrogen),• DIN (Dissolved Inorganic Nitrogen),• and DOC (Dissolved Organic Carbon)
• We can investigate their importance and their feasible impactson Hg exposure concentrations (land use change, climatechange)
• Linking VELMA to WASP to BASS to simulate fish tissueconcentrations to link atmospheric Hg deposition to human andwildlife exposure (source to receptor)
• Continual improvements on VELMA (land use, land cover)

Future Research
Using focused reach study to inform McTier Creek (HUC12),
Can we then use McTier Creek to inform regional scale?
South Fork Edisto (HUC8)?North and South Fork Edisto?

Future Research
?
How far can wezoom out?
South CarolinaCoastal Plain
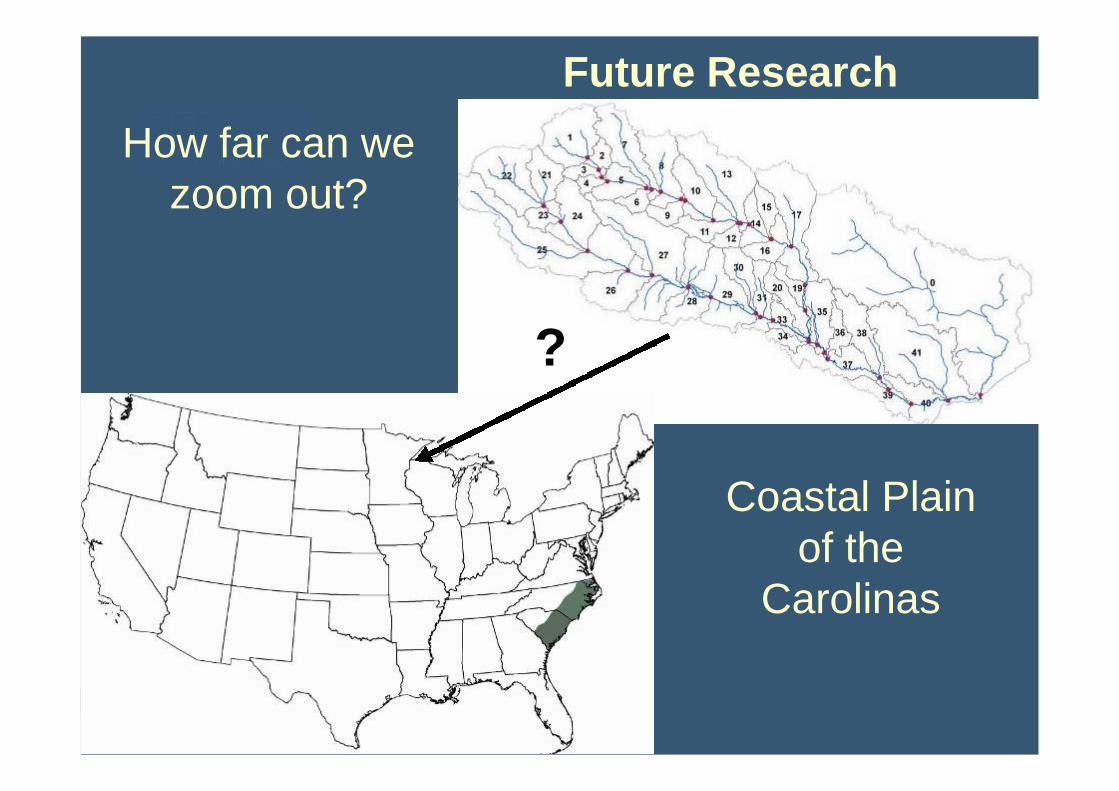
Future Research
?
How far can wezoom out?
Coastal Plainof the
Carolinas
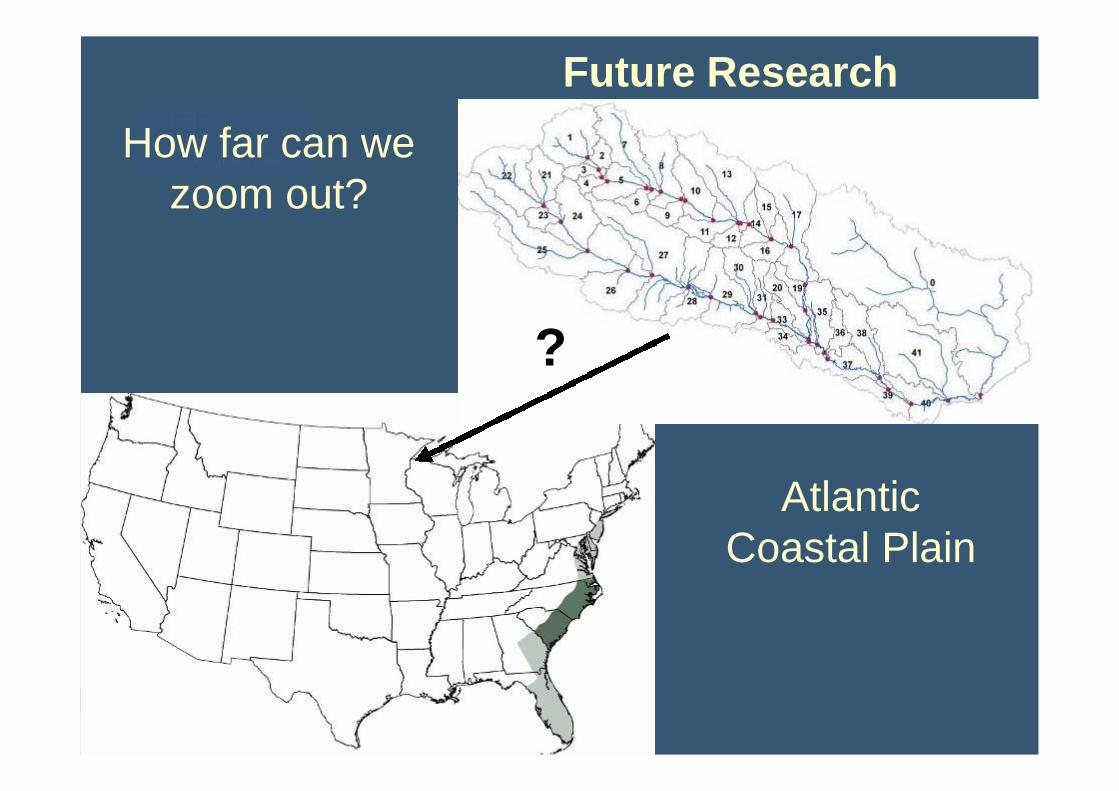
Future Research
?
How far can wezoom out?
AtlanticCoastal Plain

Future Research
?
How far can wezoom out?
Coastal Plain
Recommended


![HANGING SCALES/CRANE SCALES - Aviga HFO 159 page 166 1020,-from € Hanging scales/Crane scales Lisa Mayer Product specialist Hanging scales/Crane scales Tel. +49 [0] 7433 9933 - 219](https://img.pdfslide.net/doc/110x75/5afd22507f8b9a68498c727e/hanging-scalescrane-scales-hfo-159-page-166-1020-from-hanging-scalescrane.jpg)