Molecular Phylogenetics of Diurnal Birds of Prey in the Avian Accipitridae Family
By
Heather R. L. Lerner
A dissertation submitted in partial fulfillment
of the requirements for the degree of Doctor of Philosophy
(Ecology and Evolutionary Biology) in The University of Michigan
2007
Doctoral Committee:
Professor David P. Mindell, Chair Professor Jeffrey Long Professor Emeritus Robert B. Payne Assistant Professor L. Lacey Knowles

© Heather R. L. Lerner
All rights reserved 2007
ii
Acknowledgements
I have benefited from the generous assistance of many colleagues, friends, family
and support staff while working on this research. From our first meeting, David Mindell,
welcomed me to and facilitated my path in the study of evolution and conservation
genetics never doubting my ability to succeed despite a complete lack of experience in
the field. David has been a terrific mentor to me both personally and scientifically,
providing rapid and thoughtful feedback. Bob Payne has also been a valued advisor,
teaching me about bird diversity and nomenclature, paving my way for field research in
South Africa, providing tissue samples, and offering prompt and helpful advice on my
manuscripts and presentations. Bob has made himself available at any time of day to
answer even the most ponderous of questions. Jeff Long and Lacey Knowles were helpful
in providing feedback throughout my dissertation research, especially in regards to
Chapter four and in preparation for interviews for a post-doctoral position. These four
committee members offered guidance and training in critical areas with their diverse
expertise, for which I am very grateful.
My experience as a graduate student was immeasurably improved by interacting
with colleagues at the University of Michigan, especially Robyn Burnham, Liliana
Cortes, Chris Dick, Tom Duda, Deborah Goldberg, Doug Futyma, Phil Myers, Gerald
Smith and John Vandermeer. LaDonna Walker and Julia Eussen helped me navigate
logistical requirements to complete my degree requirements. Janet Hinshaw directed my
use of the specimen and literature collections, which were essential to my research.

iii
Many individuals and organizations assisted me with sample collection and foreign
colleagues contributed to making my fieldwork both productive and immensely enjoyable
(see acknowledgements sections within Chapters).
My research was generously supported by many grants (see acknowledgement
sections within Chapters) that I received thanks in large part to the outstanding letters of
recommendation I received from David Mindell, Bob Payne, and John Vandermeer.
Past and present office and lab mates assisted in my scientific training. Tanya
Dewey, Toni Gorog, Alec Lindsay, Mallika Krishnan, and Jeff Johnson taught me
molecular laboratory techniques; Josh Rest and Joseph Brown guided me with regards to
phylogenetic and divergence date analyses; Jeff Johnson, David Lahti and Josh Rest read
and commented on my manuscripts; and, Anne Fowler, David Lahti, Elen Oneal and
Matthew Wund created a welcoming and intellectually stimulating environment that
characterized a productive part of my tenure.
In the best and most difficult of times I was supported personally with great
kindness and understanding by my family, Michael Lerner, Neill and Fannie Kiley,
Mildred Thompson, Bob and Mary Kay Gottschalk, David and Esther Lerner, Kerry-Jon
Thompson, and Maiken, Jeff, Jacob and Lucas Schroedl; my close friends, Sue Burke,
Althea Dotzour, Anne Fowler, Elen Oneal, Anne Reis, Cristen Willer and Abby
Woodroffe; and my neighbors, Mary Butler, Sue Garcia, Josh Pollock, Lisa Rohde,
Annette Sandretto, Judy Valenti, and Ida. My husband, Michael Lerner, has been an

iv
inspiration both personally and scientifically. He has been a devoted field assistant,
valued computer programmer and data recoverer, critical reviewer and loving companion.
No doubt my graduate career was also facilitated by organized diversion as a
member of the Ann Arbor Ultimate Frisbee, University of Michigan Flywheel and Ann
Arbor Potter’s Guild communities, special thanks to these community members and
organizers.
My deepest thanks to and respect for those who helped me, whether they are
mentioned here or not, and apologies to those who played a role in my success but have
been overlooked or not properly thanked here.

v
Table of Contents
Acknowledgements ....................................................................................................... ii List of Figures...............................................................................................................vi List of Tables ...............................................................................................................vii
Chapter 1. Introduction ........................................................................................................1
References ........................................................................................................4 2. Phylogeny of eagles, Old World vultures and other Accipitridae based on nuclear
and mitochondrial DNA..........................................................................................5 Methods..........................................................................................................12 Results ............................................................................................................24 Discussion ......................................................................................................35 Conclusions ....................................................................................................47 Acknowledgements.........................................................................................48 Author note.....................................................................................................49 References ......................................................................................................50
3. Molecular phylogenetics of the buteonine birds of prey (Aves: Accipitridae) ....53 Methods..........................................................................................................55 Results and Discussion....................................................................................66 Acknowledgements. ........................................................................................81 References ......................................................................................................83
4. Genetic divergence among Harpy eagles (Harpia harpyja) in Central America and South America ...............................................................................................86 Methods..........................................................................................................88 Results ............................................................................................................97 Discussion ....................................................................................................104 Acknowledgments ........................................................................................112 References ....................................................................................................113
5. Conclusion......................................................................................................122
vi
List of Figures
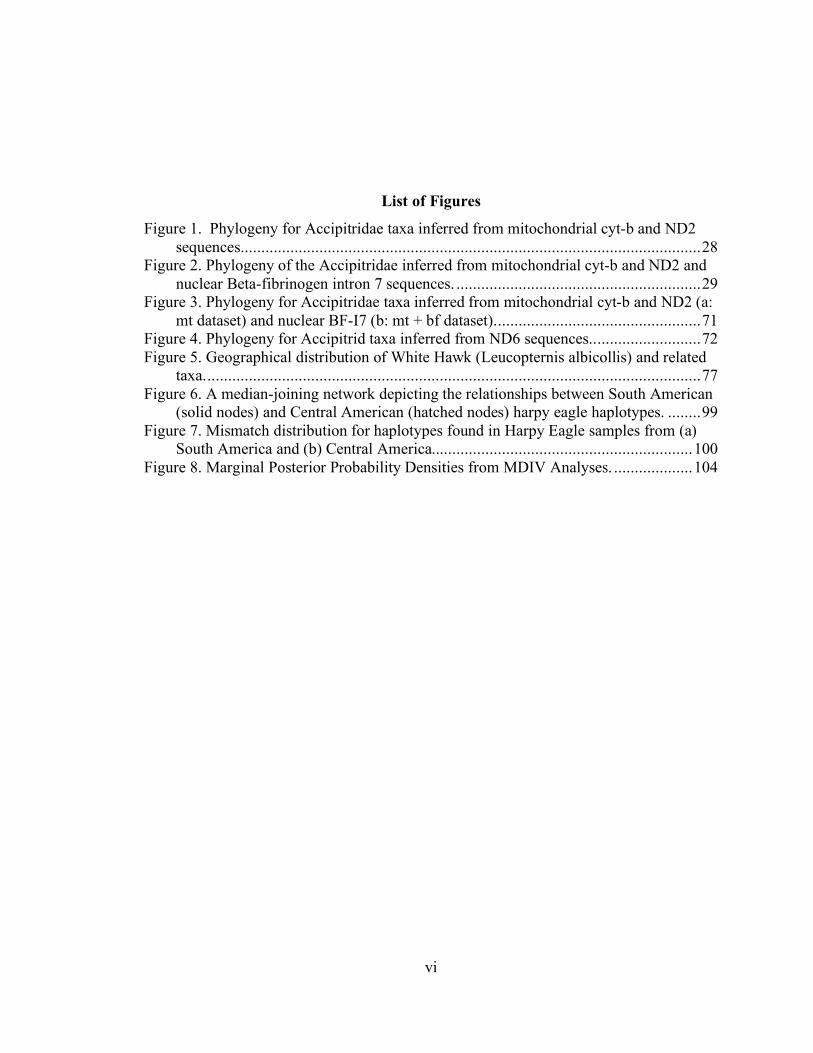
Figure 1. Phylogeny for Accipitridae taxa inferred from mitochondrial cyt-b and ND2 sequences...............................................................................................................28
Figure 2. Phylogeny of the Accipitridae inferred from mitochondrial cyt-b and ND2 and nuclear Beta-fibrinogen intron 7 sequences. ...........................................................29
Figure 3. Phylogeny for Accipitridae taxa inferred from mitochondrial cyt-b and ND2 (a: mt dataset) and nuclear BF-I7 (b: mt + bf dataset)..................................................71
Figure 4. Phylogeny for Accipitrid taxa inferred from ND6 sequences...........................72 Figure 5. Geographical distribution of White Hawk (Leucopternis albicollis) and related
taxa........................................................................................................................77 Figure 6. A median-joining network depicting the relationships between South American
(solid nodes) and Central American (hatched nodes) harpy eagle haplotypes. ........99 Figure 7. Mismatch distribution for haplotypes found in Harpy Eagle samples from (a)
South America and (b) Central America...............................................................100 Figure 8. Marginal Posterior Probability Densities from MDIV Analyses. ...................104

vii
List of Tables
Table 1. Accipitridae subfamilies.....................................................................................6 Table 2. List of Taxa and Samples Used for DNA Sequencing ......................................13 Table 3. Primers used in study to amplify mitochondrial and nuclear gene regions ........21 Table 4. Sequence composition and divergence .............................................................25 Table 5. Sample information..........................................................................................56 Table 6. Primer Sequences.............................................................................................63 Table 7. Harmonic mean log likelihood scores for each partitioning scheme..................67 Table 8. Sample information for harpy eagles (Harpia harpyja) and one outgroup
(Morphnus guianensis) analyzed in this study........................................................89 Table 9. Primer sequences used for the amplification of the mitochondrial control region
in harpy eagles.......................................................................................................92 Table 10. Matrix of pairwise FST values for geographic subgroups. All values were
significant with the exception of that denoted as n.s. ..............................................98 Table 11. Sequence characteristics from 417 bp of mitochondrial domain I control region
sequence. All values of DF, F and Fs were significant except where noted (n.s.). .102 Table 12. Genetic diversity of the control region reported in published studies of
Accipitridae taxa..................................................................................................111

1
Chapter 1
Introduction
Eagles, hawks, kites, accipiters and Old World vultures comprise the avian family
Accipitridae. As ecologically sensitive predators, accipitrids are valuable indicators of
habitat quality (Sergio et al., 2005) and all accipitrid species are protected as CITES I or
II species (IUCN, 2006). Traditionally recognized accipitrid species and subspecies vary
morphologically from nearly indistinguishable to highly divergent, such that species and
genera boundaries are not clear in many cases. Endemic populations within some species
may warrant recognition as separate species or evolutionary units if diagnosable based on
molecular data. A phylogeny, both within and among species and genera of Accipitridae,
is therefore needed to delineate the genetic and overall biological diversity, which is of
immediate concern to conservation efforts. A well-supported phylogeny of the
Accipitridae can also provide insight into the evolution of the diverse accipitrid life-
styles, and the biogeographic history of the family.
Previous phylogenetic studies using morphological (e.g. Holdaway, 1994; Kemp,
Crowe, 1990; Kemp, Crowe, 1994) or molecular data (e.g. Bunce et al., 2005; do Amaral
et al., 2006; Gamauf, Haring, 2004; Helbig et al., 2005; Riesing et al., 2003b; Seibold,
Helbig, 1995) have produced incongruent results. Convergent morphology due to similar
predatory lifestyles and morphological plasticity (Bunce et al., 2005) has made
morphological characteristics difficult to use in phylogenies, thus further investigations
based on molecular datasets are needed.
In chapter two I evaluate relationships among all 14 previously described
Accipitridae subfamilies with a molecular phylogeny based on 2087 bases of
mitochondrial data and 1074 bases of nuclear data. Phylogenetic relationships within
four subfamilies of eagles (booted eagles, sea eagles, harpy eagles and snake eagles) and
two subfamilies of Old World vultures (Gypaetinae and Aegypiinae) are investigated
with nearly complete taxonomic representation for these groups. In two species, H.

2
fasciatus and H. morphnoides, where subspecies are both morphologically distinct and
separated by substantial geographical distance, I sampled multiple individuals of each
subspecies to investigate their monophyly.
In chapter three I present a detailed analysis of the phylogenetic relationships within
the accipitrid subfamily Buteoninae based on over 3000 bases of nuclear and
mitochondrial DNA. Buteoninae is of particular interest as it comprises one of the largest
accipitrid subgroups and includes multiple species of conservation concern. This study
includes representatives of all genera previously included within or proposed as close
relatives of the Buteoninae subgroup: Buteo, Leucopternis, Buteogallus, Harpyhaliaetus,
Busarellus, Parabuteo, Geranoaetus, Geranospiza, Ictinia, Rostrhamus, Kaupifalco and
Butastur. Multiple representatives of each nominal subspecies and species were included
for three different “superspecies” complexes within the genus Leucopternis (L. albicollis,
L. polionotus and L. occidentalis; L. plumbeus and L. schistaceus; and, L. kuhli and L.
melanops).
In addition to establishing evolutionary relationships among and within
subfamilies of Accipitridae, molecular sequence data is useful for identifying
monophyletic groups for species delineation as shown in chapters two and three. In
chapter four, fast-evolving sequences of DNA are used to evaluate levels of genetic
diversity and population structure within a species where reciprocal monophyly is not
present. With sequence data from 417 bases of the highly variable domain I of the
mitochondrial control region for 66 harpy eagles (Harpia harpyja) sampled from across
their broad geographic distribution this study uses a combination of test statistics and
phylogenetic and coalescent-based analyses to assess levels of genetic diversity,
population structure and demographic history for the harpy eagle. The harpy eagle
(Harpia harpyja), the largest Neotropical bird of prey, is currently threatened by habitat
loss, fragmentation and human persecution. Conservation and management programs,
including captive-breeding, have been undertaken in multiple locations throughout the
Neotropics (e.g. The Peregrine Fund in Panama, Parque Nacional Guayaquil in Ecuador
and The Harpy Eagle Conservation Program in Brazil). The results of this study will be
valuable for conservation efforts that aim to preserve genetic variability and retain

3
maintain historical levels of gene flow among geographic areas in the wild by quantifying
existing levels of genetic diversity and identifying historic levls of gene flow.

4
References Bunce M, Szulkin M, Lerner HRL, et al. (2005) The evolutionary history of New
Zealand's extinct giant eagle revealed by ancient DNA. Public Library of Science Biology 3, e (9).
do Amaral F, Miller M, Silveira L, Bermingham E, Wajntal A (2006) Polyphyly of the hawk genera Leucopternis and Buteogallus (Aves, Accipitridae): multiple habitat shifts during the Neotropical buteonine diversification. BMC Evolutionary Biology 6, 10.
Gamauf A, Haring E (2004) Molecular phylogeny and biogeography of Honey-buzzards (genera Pernis and Henicopernis). J. Zool. Syst. Evol. Research 42, 145-153.
Helbig AJ, Kocum A, Seibold I, Braun MJ (2005) A multi-gene phylogeny of aquiline eagles (Aves : Accipitriformes) reveals extensive paraphyly at the genus level. Molecular Phylogenetics and Evolution 35, 147-164.
Holdaway RN (1994) An exploratory phylogenetic analysis of the genera of the Accipitridae, with notes on the biogeography of the family. In: Raptor Conservation Today (eds. Meyburg B-U, Chancellor RD), pp. 601-649. World Working Group on Birds of Prey and Owls, London.
IUCN (2006) UCN Red List of Threatened Species. Kemp AC, Crowe TM (1990) A preliminary phylogenetic and biogeographic analysis of
the genera of diurnal raptors. Proceedings of the International Symposium on Vertebrate Biogeography and Systematics in the Tropics. Bonn: Museum Alexander Koenig, 161–175.
Kemp AC, Crowe TM (1994) A Morphometric Analysis of Accipiter Species. In: Raptor Conservation Today (eds. Meyburg B-U, Chancelor RD), pp. 651-665. WWGBP/The Pica Press, London.
Riesing MJ, Kruckenhauser L, Gamauf A, Haring E (2003) Molecular phylogeny of the genus Buteo (Aves: Accipitridae) based on mitochondrial marker sequences. Molecular Phylogenetics and Evolution 27, 328-342.
Seibold I, Helbig AJ (1995) Evolutionary history of New and Old World vultures inferred from nucleotide sequences of the mitochondrial cytochrome b gene. Philosophical Transactions of the Royal Society of London Series B-Biological Sciences 350, 163-178.
Sergio F, Newton I, Marchesi L (2005) Top predators and biodiversity. Nature 436, 192.

5
Chapter 2
Phylogeny of eagles, Old World vultures and other Accipitridae based on nuclear and mitochondrial DNA
Accipitridae is a diverse avian family, comprising up to 14 subfamilies, 65 genera
and 231 species (see Table 1, Dickinson, 2003; Stresemann, Amadon, 1979). Of the
Accipitridae species, some of the largest and most threatened by anthropogenic factors
belong to four eagle subfamilies (Circaetinae, Haliaeetinae, Aquilinae and Harpiinae) and
two Old World vulture subfamilies (Gypaetinae and Aegypiinae). All Accipitridae
species are protected under the Convention on International Trade in Endangered Species
(CITES) and four eagles are listed as top priority species (CITES I, CITES-Secretariat,
2003). As ecologically sensitive predators, birds of prey are valuable indicators of
habitat quality. The Accipitridae are found in a variety of habitats from primary
rainforest to arctic tundra throughout the world. Some taxa are restricted in distribution
such as the snake eagles (Circaetinae) which are found only in the Old World, while
others, such as the sea eagles (Haliaeetinae), are global in distribution. Thorough
phylogenetic analyses are needed to delineate the genetic and overall biological diversity
of this family, and to inform conservation programs which aim to preserve genetic
diversity of distinguishable taxonomic units.

6
Table 1. Accipitridae subfamilies
Subfamily Common Name
Genera Brief Description Genera placed in the subfamily by this analysis
Elaninae1
Kites Elanus, Gampsonyx, Chelictinia
Kites noted for having a bony shelf above the eye, Elanus is cosmopolitan, Gampsonyx is restricted to the New World and Chelictinia is found in Africa
Elanus (Gampsonyx and Chelictinia not sampled)
Perninae1 Kites Pernis, Aviceda, Leptodon, Chondrohierax, Henicopernis, Elanoides, Machaerhamphus?
Kites mainly found in the tropics and specializing on insects and bee or wasp larvae, all lack the bony eye shield found in the Elaninae
Pernis, Leptodon, Chondrohierax, Elanoides, Hamirostra and Lophoictinia (Aviceda, Henicopernis and Machaerhamphus not sampled)
Milvinae1 Milvine or Brahminy kites
Milvus, Rostrhamus, Harpagus, Ictinia, Lophoictinia, Hamirostra, Haliastur
Diverse kites found in the New and Old World, several species have fusion of joints of the second and third toes (Brown and Amadon, 1968)
Milvus and Haliastur
Aegypiinae1.
Old World vultures
Gyps, Pseudogyps, Necrosyrtes, Aegypius, Torgos, Trigonoceps, Sarcogyps
Largest Old World vultures, scavengers, most with long necks and lightly feathered to bare heads
Gyps/Pseudogyps, Necrosyrtes, Aegypius, Torgos, Trigonoceps and Sarcogyps
Gypaetinae2 Old World vultures
Neophron, Gypaetus, Gypohierax angolensis
Generally smaller vultures found in the Old World with more restricted ranges, various specialized feeding behaviors, vocalizations, breeding
Neophron, Gypaetus and Gyophierax
6

7
displays, Gyophierax and Neophron similar to each other in plumage coloration and molt stages
Circaetinae1
Snake eagles Circaetus, Terathopius, Dryotriorchis, Eutriorchis, Spilornis
Old World species feeding mainly on snakes, other reptiles and small mammals, have a reticulate pattern of heavy scales on the tarsi and relatively short toes
Circaetus, Terathopius, Dryotriorchis, Spilornis and Pithecophaga; sister relationship and subfamily for Eutriorchis undetermined here
Polyboroidinae3 Harrier Hawks Polyboroides, Geranospiza
One New World and one Old World species, both exploit species found in tree cavities for prey, have short outer toe, increased mobility and length of the tarsus, relatively weak bill
Polyboroides
Aquilinae2
Booted eagles, hawk-eagles
Aquila, Spizaetus, Hieraaetus, Stephanoaetus, Polemaetus, Ictinaetus (considered a kite by Sushkin), Spizastur, Oroaetus
Large eagles with feathered tarsi, globally distributed in diverse habitats taking a wide variety of prey, the hawk-eagles have crests
Aquila, Spizaetus, Hieraaetus, Stephanoaetus, Polemaetus, Ictinaetus, Spizastur, Oroaetus, and Lophaetus
Accipitrinae2 Sparrowhawks and (?) Chanting goshawks
Accipiter, Urotriorchis, Megatriorchis, Erythrotriorchis, Melierax, Heterospizias (?)
Small, fast fliers specializing on small birds as prey, long and slim tarsometatarsus and toes
Accipiter (Urotriorchis, Megatriorchis, Erythrotriorchis and Heterospizias not sampled)
Circinae 1, 6 Harriers Circus broad and long-winged birds with facial feather disks, found mainly in open habitat such as fields or
Circus
76

8
marshes, have specialized outer ears and related bones
Haliaeetinae4
Sea and Fish eagles
Haliaeetus, Ichthyophaga
Large eagles found in riverine and coastal habitat throughout the world, all have fused basal joint of middle toe
Haliaeetus, Ichthyophaga
Buteoninae2
Hawks, buzzards, (usually includes booted eagles, sea eagles and harpy eagles which we have separated out here)
Buteo, Geranoaetus, Parabuteo, Kaupifalco, Buteogallus, Harpyhaliaetus, Busarellus, Heterospizias (?), Leucopternis, Butastur
Predominately New World species of soaring hawks with long broad wings and relatively short tails and legs
Buteo, Geranoaetus, Parabuteo, Buteogallus, Harpyhaliaetus, Leucopternis ,Ictinia, Geranospiza and Rostrhamus, (Busarellus, Heterospizias, Kaupifalco and Butastur not sampled)
Harpiinae5 Harpy eagles
Harpia, Morphnus, Harpyopsis, Pithecophaga, Harpyhaliaetus (?)
Extremely large and powerful eagles with unfeathered tarsi, tropical forest predators of medium-sized mammals
Harpia, Morphnus and Harpyopsis
Melieraxinae5, 6 Chanting goshawks
Melierax (Micronisus)
Forest accipiters, larger than Accipiter species otherwise similar to that genus
Melierax (Micronisus)
1Peters 1931 2Gadow 1893 3Brown and Amadon 1968 4Sushkin 1905 in Jollie 1976 5this study 6Alternatively Circinae and Melieraxinae may be united under Accipitrinae with birds of the genus Accipiter
86

9
Phylogeny for Accipitridae based on morphological traits has been difficult to
resolve (e.g. Brown, Amadon, 1968; Jollie, 1976; 1977a; 1977b). The few published
molecular studies have been limited in sampling and have proposed some previously
unrecognized relationships (see below). The goal of the present study is to identify
phylogenetic relationships within and among the six subfamilies of eagles and Old World
vultures in the context of the other primary accipitrid groups using molecular data.
The booted eagles (Aquilinae) are one of the largest accipitrid groups containing
35-36 species in 8-9 genera and are distributed worldwide. The majority of the species
fall into three genera, Aquila, Hieraaetus and Spizaetus, while the remaining five genera
are all monotypic. All species have “boots,” or feathered tarsi, a trait that separates this
group from most other accipitrid taxa. The booted eagles have been considered to be
monophyletic (Jollie, 1977b) or polyphyletic (Holdaway, 1994) with morphological data,
and only a few species in one genus have been studied phylogenetically with molecular
data (Cyt-b, Seibold et al., 1996; control region, Vali, 2002). Monophyly of the three
Aquilinae genera is not well-supported with morphological characters, such that the
Hieraaetus species and some Spizaetus species have been placed in the genus Aquila by
various authors (described by Brown, Amadon, 1968; and Thiollay, 1994). The two
molecular studies included about half of the species in the genus Aquila, and both found
that A. chrysaetos was genetically distant from four other Aquila species. Sister
relationships for A. clanga and A. pomarina, A. nipalensis and A. heliaca or A. heliaca
and A. adalberti were also proposed.
The sea eagles (Haliaeetinae) are a much smaller and more easily defined group
of large eagles found in coastal and riverine areas worldwide except South America and
10
Antarctica. The two sea eagle genera, Haliaeetus and Ichthyophaga, share some
morphological traits with two genera of kites (Milvus and Haliastur), suggesting a close
relationship (Holdaway, 1994; Jollie, 1977b; Thiollay, 1994). The sea eagles also share
some traits with the palmnut vulture (Gypohierax angolensis), suggesting a relationship
between them and Old World vultures (Brown, Amadon, 1968). Using cyt-b sequence
data, Seibold and Helbig (1996) studied eight of the nine species of sea eagles in the
genus Haliaeetus. They supported a clear split between species with temperate versus
tropical distributions, and a close relationship between the sea eagles and two Milvus
kites. The relationship between the two genera of sea eagles has not been investigated
with molecular sequence data and the possibility of paraphyly of the genera remains
unresolved.
The four species and genera of harpy eagles (Harpiinae) are some of the largest
raptors and are found in tropical rain forests in the Americas, the Philippines and New
Guinea. This group is generally considered monophyletic due to their large size, lack of
feathers on the tarsi and similarities in behavior (Brown, Amadon, 1968; Thiollay, 1994);
however, some have suggested that the Old World species are not sister to the New
World species (e.g. Jollie, 1977b). Holdaway (1994) removed one Old World
(Pithecophaga) and one New World (Morphnus) species from the Harpiinae. A close
relationship between the booted eagles and the harpy eagles has been proposed but not
tested with molecular data.
The 14 species of snake eagles (Circaetinae) in five genera are found only in the
Old World. Although usually considered monophyletic (Brown, Amadon, 1968;
Friedmann, 1950a), the possibility of polyphyletic origins for snake eagles has been

11
raised (Jollie, 1977b could not identify sister relationships for Eutriorchis and
Dryotriorchis; Thiollay, 1994).
The final group we focused on is the Old World vultures, a diverse mix of
scavengers including at least one species that uses tools (Egyptian vulture, Neophron
percnopterus), and potentially including a frugivorous raptor (palmnut vulture,
Gypohierax angolensis). One or two subfamilies have been proposed for the Old World
vultures. Three species are highly divergent from the remaining 11 and have been placed
by some in a separate family called Gypaetinae (Mundy et al., 1992). The core 11
species are called the Aegypiinae. Seibold and Helbig (1995) used cyt-b sequence from
eleven Old World vulture species and found evidence of polyphyly for the Old World
vultures.
There are no previously published molecular studies that include representatives
of all of the Accipitridae subfamilies; however, several molecular studies have used
mitochondrial DNA to examine particular Accipitridae subgroups and have found
evidence for polyphyly of some traditionally recognized taxa (and the genus Buteo,
Gamauf, Haring, 2004; e.g., polyphyly of the Perninae kites, Riesing et al., 2003a).
Relationships among a small set of accipitrids based on mtDNA indicated a closer
relationship between a representative sea eagle and kite in the genus Milvus, than
between the sea eagle and a snake eagle in the genus Circaetus. A representative Old
World vulture was more closely related to the snake eagle than other accipitrid taxa in the
study, including species of Buteo, Haliaeetus, Milvus, Circus, Accipiter, and Pernis
(Mindell et al. 1997). Increased sampling of species and molecular characters are needed
to improve our understanding of phylogenetic relationships among the Accipitridae.

12
In this study we focus on full or nearly complete taxonomic representation of five
accipitrid subgroups (sea and fish eagles, harpy eagles, booted eagles, snake eagles and
Old World vultures), corresponding to six potential subfamilies. We use both
mitochondrial and nuclear sequences for representatives of 51 out of 65 genera (78%)
and just under half of the known Accipitridae species (n=111). At least one
representative of each previously proposed subgroup/subfamily within the Accipitridae
have been included to help in phylogenetic placement of the focal taxa.
Methods Taxon sampling.—We include at least one representative from all genera and the
majority of species of sea and fish eagles (2 genera, 10 species), snake eagles (4 genera,
12 species), harpy eagles (4 genera, 4 species), booted eagles (8 genera, 29 species) and
Old World vultures (9 genera, 13 species), based on the taxonomy in Dickinson (2003).
In two cases where significant morphological differences among geographical
populations have been documented, multiple samples representing different subspecies
were included in the analysis. To infer relationships among these subfamilies within the
Accipitridae we also include at least one representative from each primary group or clade
within the Accipitridae family as proposed by Gadow (1893), Peters (1931), Brown and
Amadon (1968), Jollie (1977b), Stresemann and Amadon (1979) and Holdaway (1994).
Falco longipennis, Falco peregrinus, and Phalcoboenus megalopterus (Falconidae) were
used as outgroup taxa. Samples, their sources and locality information are listed in Table
2.

13
Table 2. List of Taxa and Samples Used for DNA Sequencing
Order Family
Subfamily Species Locality Sourcea and Voucher # b Tissue ID
Falconiformes Falconidae Falco peregrinus N. America
Falco longipennis Australia AM-EBU 10665 Phalcoboenus megalopterus South Africa Captive, WOB, P WOB-3
Sagiitaridae Sagittarius serpentarius South Africa Captive, JBZ, P JBZ-12 Pandionidae Pandion haliaetus Michigan UMMZ 225997 T-264 Accipitridae
Elaninae
Elanus leucurus South Africa Captive, CRH, P CRH-4
Polyboroidinae
Polyboroides typus Gambia, Africa UMMZ 235187 T-1423
Gypaetinae Neophron percnopterus DWC, Captive, P DWC-1 Gypohierax angolensis Gambia, Africa UMMZ 235794 A-1232 Gypaetus barbatus Captive, SDZ Eutriorchis astur Madagascar TPF, Wild, P
Perninae Chondrohierax uncinatus Grenada TPF, Wild, P Leptodon cayanensis Paraguay KUNHM 139 Elanoides forficatus Ecuador LSUMNS B-12133
Pernis apivorus TAU
Hamirostra melanosternon Australia AM-EBU 1
Lophoictinia isura Australia AM-EBU 0.50591 Pithecophaga jefferyi The Philippines TPEF, captive
13

14
Circaetinae Pithecophaga jefferyi The Philippines TPEF, captive Pithecophaga jefferyi Mindanao, Philippines AMNH 534856 Terathopius ecaudatus South Africa UBP, Captive UMG-3 Spilornis elgini S. Andamens NHM-UK 1885.8.19.1626
Spilornis holospilus Mount Calavite, Occ.
Mindoro AMNH 784054
Spilornis cheela burmanicus Cherrapunji, India UMMZ 140566
Spilornis rufipectus S. Celebes AMNH 536566
Circaetus pectoralis South Africa Captive, PBC, P PBC-3
Circaetus gallicus TAU 363
Circaetus cinereus Zambia UMMZ A752
Dryotriorchis spectabilis Eastern Congo Forest,
Africa AMNH 448333
Circaetus fasciolatus South Africa WOB, Captive, P WOB-3 Circaetus cinerascens Karonga, Nyasaland NHM-UK 1948.26.1
Aegypiinae
Necrosyrtes monachus Gambia UMMZ A1234
Gyps bengalensis TPF Gyps rueppellii Gambia UMMZ A1119 Gyps fulvus Gambia UMMZ 235890 B19181 Gyps coprotheres South Africa DWC, Captive, P DWC-10 Gyps africanus TAU Sarcogyps calvus South Africa DWC, Captive, P DWC-20 Trigonoceps occipitalis Senegal UMMZ 130316 Aegypius monachus DZ, Captive, P 1903 14

15
Torgos tracheliotus UMMZ 234705 T-2046
Harpiinae Harpyopsis novaeguineae New Guinea, Southern Highlands Province, Piambil Village, Mt.Giluue
UMMZ 238858
Morphnus guianensis Peru HUA, Captive, P HUA-19
Harpia harpyja Colombia Captive, SDZ 402158
Aquilinae Spizaetus lanceolatus Celebes NHM-UK 1887.11.1.337 Spizaetus cirrhatus lineatus Bamanigaon, Assam,
India UMMZ 140516
Spizaetus nanus Lambuk River, Central
North Borneo NHM-UK 1956.60.11
Spizaetus nipalensis NBPC, Captive, P
Spizaetus alboniger Gomantong, North
Borneo NHM-UK 1956.60.9
Spizaetus tyrannus Peru HUA, Captive, P HUA-25 Spizastur melanoleucus Peru HUA, Captive, P HUA-28
Spizaetus ornatus Darien Province, Panama
LSU B2267
Oroaetus isidori Peru HUA, Captive, P HUA-23 Stephanoaetus coronatus South Africa PBC, Captive, P PBC-9 Hieraaetus kienerii NHM-UK
1877.85.8.19.1331
Polemaetus bellicosus South Africa EES, Captive, P EES-1 Lophaetus occipitalis South Africa PBC, Captive, P PBC-15 Ictinaetus malayensis malayensis NHM-UK 1932.12.21.-35 Hieraaetus pennatus South Africa WOB, Captive, P WOB-5
15

16
Hieraaetus pennatus Punjab, India UMMZ 75313
Hieraaetus morphnoides morphnoides UMMZ T-2796 Hieraaetus morphnoides morphnoides Australia NHM-UK 1969.4.22 Hieraaetus morphnoides weiskei New Guinea AMNH 535061 Hieraaetus morphnoides weiskei New Guinea NHM-UK 1913.3.6.35 Hieraaetus ayresii Uganda, Africa UMMZ 535074 Aquila wahlbergi DWC, Captive, P DWC-21 Aquila chrysaetos N. America UMMZ 238855 Spizaetus africanus NHM-UK 1977.20.43 Hieraaetus fasciatus fasciatus Red Sea, Egypt UMMZ 224053 Hieraaetus fasciatus fasciatus Bhadwar, India UMMZ 78295 Hieraaetus fasciatus fasciatus Parwali, India UMMZ 78294 Hieraaetus fasciatus spilogaster South Africa WOB, Captive, P WOB-13 Hieraaetus fasciatus spilogaster South Africa EES, Captive, P EES-3 Aquila verreauxii South Africa PBC, Captive, P PBC-8 Aquila audax Moomba, South
Australia SAM, SAMAB48364 ABTC-02866
Aquila gurneyi Halmahera, Indonesia NHM-UK 1873.5.9.8 Melieraxinae Melierax gabar Zimbabwe UMMZ A765
Circinae Circus aeruginosus TAU 353 Circus ranivorus South Africa Captive, PBC-6, P PBC-6
Accipitrinae Accipiter bicolor Santa Cruz Dept., Bolivia
LSU B-18875
Accipiter cooperii Michigan, U.S.A. UMMZ 227082 T-293 Milvinae Haliastur indus girenera Brunswick Heads,
Australia AM-EBU, 064910 EBU 11377
16

17
Haliastur sphenurus Gregory, Northern Territory, Australia
SAM, NTMT651 ABTC-27746
Milvus migrans parasitus Cameroon, Africa AMNH 388140 Milvus milvus Rome, Italy AMNH 531856
Haliaeetinae
Haliaeetus leucoryphus Palasbari, India UMMZ 142065
Haliaeetus pelagicus NBPC, Captive, P JPJ MB 26 Haliaeetus albicilla TAU Haliaeetus leucocephalus N. America UMRC N42 Ichthyophaga humilis Bhadwar, India UMMZ 78356 Ichthyophaga ichthyaetus Palasbari, India UMMZ 140540 Haliaeetus vocifer Durban, South Africa UMMZ A1075 Haliaeetus vociferoides Madagascar R. Tingay MFE 60 0051 Haliaeetus leucogaster Lincoln, South Australia SAM, SAMAB48773 ABTC 03064 Haliaeetus sanfordi Solomon Islands UMMZ 112326
Buteoninae
Ictinia plumbea Paraguay KUNHM 2900
Geranospiza caerulescens Paraguay KUNHM 3110 Rostrhamus sociabilis Guyana KUNHM 5852 Buteogallus urubitinga Paraguay UMMZ 227470 SMG 2546 Harpyhaliaetus coronatus Capitan Bado, Paraguay UMMZ 101669 Harpyhaliaetus solitarius Peru HUA, Captive, P HUA-18 Buteo magnirostris Loreto Dept., Peru LSU B-2862 Parabuteo unicinctus Arizona, U.S.A. UMMZ T-1039 Geranoaetus melanoleucus Peru HUA, Captive, P HUA-03 Leucopternis albicollis Tigre Playa, Sucumbios, ZMUC 114919
17

18
Ecuador Buteo buteo Genbank Buteo jamaicensis N. America UMMZ T-2797 Leucopternis kuhli Loreto Dept., Peru LSU B-4598 Leucopternis melanops Loreto Dept., Peru LSU B-7167
a AM-EBU, Australian Museum Evolutionary Biology Unit, Sydney, Australia; CRH, Center for Rehabilitation of Wildlife, South Africa; DWC, De Wildt Cheetah and Wildlife Reserve, Pretoria, South Africa; DZ, Detroit Zoo, Detroit, MI; EES, Eagle Encounters at Spier, Stellenbasch, South Africa; HUA, El Huayco, Peru; JBZ, Johannesburg Zoo, South Africa; KUNHM, Kansas University Natural History Museum; LSUMNS, Louisiana State University Museum of Natural Science; NBPC, National Birds of Prey Centre, Newent, England; NHM-UK, The Natural History Museum, Tring, United Kingdom; PBC, Predatory Bird Centre, South Africa; SAM, South Australia Museum, Adelaide, Australia; SDZ, San Diego Zoo, CA; TAU, Tel Aviv University Research Zoo; TPEF, The Philippine Eagle Foundation, The Philippines; TPF, The Peregrine Fund; UBP, Umgeni Bird Park, South Africa; UMMZ, University of Michigan Museum of Zoology, Ann Arbor, MI; UMRC, University of Minnesota Raptor Center, MN; WOB, World of Birds, Cape Town, South Africa; b When a live bird was sampled, a photo was taken at the time of sample collection. Availability of a photo is signified by the letter “P.” When a museum skin was sampled only the voucher number is given, no tissue number is given.
18

19
Sequencing.—Genomic DNA was extracted from muscle tissue or blood using proteinase
K digestion following the manufacturer’s protocols (DNeasy tissue kit, Qiagen), or from
the calamus of primary feathers by adding dithiothreitol (30 ml of 100 mg/ml, Cooper,
1994) to the overnight tissue digestion buffer, and then proceeding according to the
manufacturer’s protocols. For museum skin (toe pad) samples, genomic DNA was
extracted from toe pad tissue digested overnight as described for feathers above, with
additional washes of 500ul Salton Wash 1 and Salton Wash 2 (Qbiogene, Inc.).
All museum toe pad extractions and PCR preparations were conducted in a
facility exclusively designated for old/degraded DNA samples at the University of
Michigan Museum of Zoology and the Ancient Biomolecules Centre (ABC) at Oxford
University. To prevent contamination, no contemporary samples or PCR products are
permitted in either facility (Cooper, Poinar, 2000).
We sequenced 1047 bases of mitochondrial NADH dehydrogenase subunit 2
(ND2), 1041 bases of mitochondrial Cytochrome-b (cyt-b) and 1074 bases of nuclear
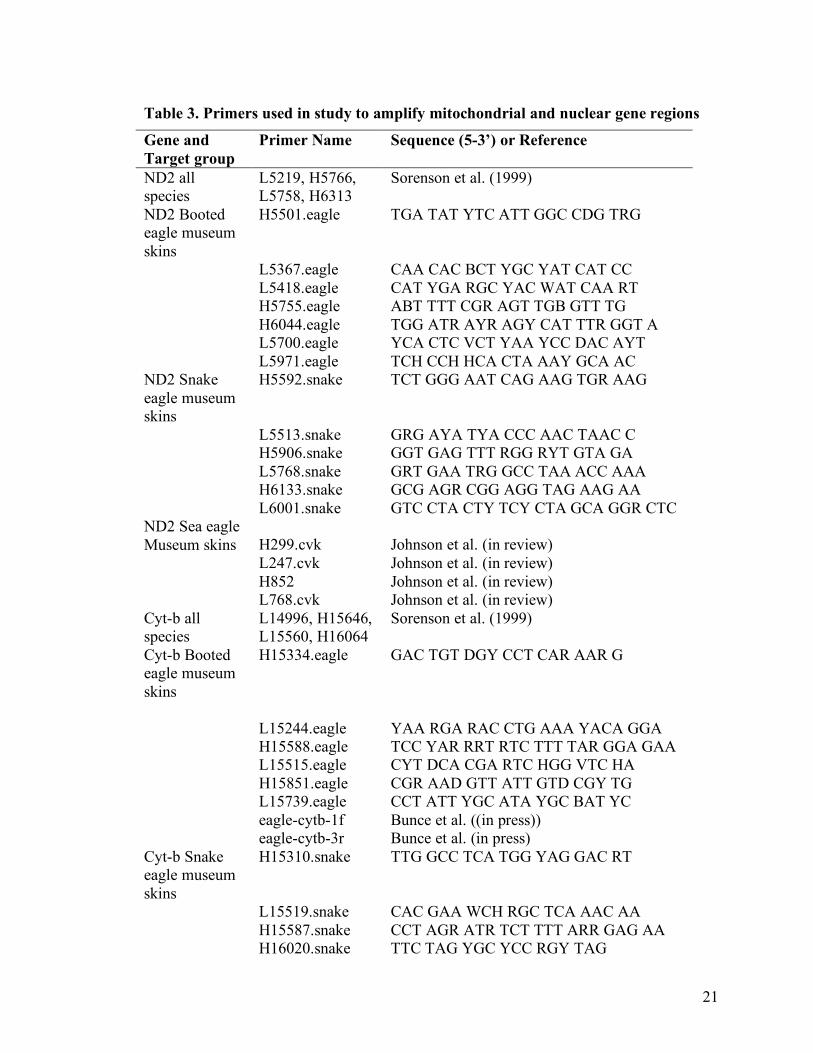
Beta-fibrinogen intron 7 (BF-I7) in segments of ~250 to 1080 bases in length. Primers
used are described in Table 3. PCR products were visualized on a 1% low melting point
agarose gel stained with ethidium bromide and gel extracted with a Gel Purification kit
(Qiagen). Sequencing was performed on an ABI Model 3730 sequencer. Resulting
chromatographs for both strands of DNA were resolved in Sequencher version 4.1.
We took standard precautions against inadvertent amplification of nuclear copies
of mitochondrial genes (see Arctander, 1995; Mindell et al., 1997; Sorenson, Fleischer,
1996). In cases where double peaks on chromatographs identified potential multiple
copies for ND2, we cloned the PCR products using a TOPOTM TA Cloning kit

20
(Invitrogen), and sequenced 5 clones to identify separate DNA sequences. Two
sequences of identical length lacking internal stop codons were found in multiple clones
of the Morphnus guianensis PCR product. Both clones were included in the analyses.
Dataset construction and analyses.—Sequences were aligned in BioEdit v. 7.0.0 (Hall,
1999a) by eye. Cyt-b did not contain indels and the indels found in ND2 and BF-I7 were
easily resolved. Nine vulture species had an insertion of two amino acids immediately
preceding the stop codon of ND2 (Aegypius monachus, Torgos tracheliotus, Gyps
africanus, G. bengalensis, G. coprotheres, G. fulvus, G. rueppellii, Sarcogyps calvus, and
Trigonoceps occipitalis). In BF-I7 the two Haliastur species shared an insertion of one
base and the two Accipiter species shared an insertion of one base and a separate
insertion two bases in length. An insertion of twelve bases was found in three Falco
species (Falco longipennis, F. subniger and F. biarmicus, though the last species was not
included in further analyses) and eleven separate insertions were autapomorphic. The
two Buteogallus species and Geranospiza caerulescens share a deletion of two bases; the
two Buteogallus species and Harpyhaliaetus solitarius share another separate deletion of
two bases; the three Falco species share a deletion of one base; the two Harpyhaliaetus
species share a deletion of two bases; Harpia harpyja, Harpyopsis novaeguineae and
Morphnus guianensis share a deletion of eight bases; and, Harpyhaliaetus solitarius,
Leptodon cayanensis and Rostrhamus sociabilis share a deletion of two bases.
21
Table 3. Primers used in study to amplify mitochondrial and nuclear gene regions
Gene and Target group
Primer Name Sequence (5-3’) or Reference
ND2 all species
L5219, H5766, L5758, H6313
Sorenson et al. (1999)
ND2 Booted eagle museum skins
H5501.eagle TGA TAT YTC ATT GGC CDG TRG
L5367.eagle CAA CAC BCT YGC YAT CAT CC L5418.eagle CAT YGA RGC YAC WAT CAA RT H5755.eagle ABT TTT CGR AGT TGB GTT TG H6044.eagle TGG ATR AYR AGY CAT TTR GGT A L5700.eagle YCA CTC VCT YAA YCC DAC AYT L5971.eagle TCH CCH HCA CTA AAY GCA AC ND2 Snake eagle museum skins
H5592.snake TCT GGG AAT CAG AAG TGR AAG
L5513.snake GRG AYA TYA CCC AAC TAAC C H5906.snake GGT GAG TTT RGG RYT GTA GA L5768.snake GRT GAA TRG GCC TAA ACC AAA H6133.snake GCG AGR CGG AGG TAG AAG AA L6001.snake GTC CTA CTY TCY CTA GCA GGR CTC ND2 Sea eagle Museum skins H299.cvk Johnson et al. (in review) L247.cvk Johnson et al. (in review) H852 Johnson et al. (in review) L768.cvk Johnson et al. (in review) Cyt-b all species
L14996, H15646, L15560, H16064
Sorenson et al. (1999)
Cyt-b Booted eagle museum skins
H15334.eagle
GAC TGT DGY CCT CAR AAR G
L15244.eagle YAA RGA RAC CTG AAA YACA GGA H15588.eagle TCC YAR RRT RTC TTT TAR GGA GAA L15515.eagle CYT DCA CGA RTC HGG VTC HA H15851.eagle CGR AAD GTT ATT GTD CGY TG L15739.eagle CCT ATT YGC ATA YGC BAT YC eagle-cytb-1f Bunce et al. ((in press)) eagle-cytb-3r Bunce et al. (in press) Cyt-b Snake eagle museum skins
H15310.snake TTG GCC TCA TGG YAG GAC RT
L15519.snake CAC GAA WCH RGC TCA AAC AA H15587.snake CCT AGR ATR TCT TTT ARR GAG AA H16020.snake TTC TAG YGC YCC RGY TAG

22
Cyt-b Sea eagle museum skins H15332.cvk (Johnson et al., in press) L15279.cvk (Johnson et al, in review) L15560.cvk (Johnson et al, in review) H15828.cvk (Johnson et al, in review) L15748.cvk (Johnson et al, in review)
Phylogenetic analyses were first performed on the individual genes to assess
congruence of the phylogenetic signal among genes. Then the data were combined into
two data sets for final analyses: one dataset includes 2088 bases of ND2 and cyt-b for
113 taxa and is referred to hereafter as the “mt dataset;” the other dataset includes the
2088 bases of mitochondrial data from the first dataset, plus an additional 1074 bases of
nuclear data (BF-I7) for 71 taxa and is hereafter referred to as the “nuc + mt dataset.”
Homoplasy and heterogeneity of base composition are two factors that, if not
addressed in the phylogenetic model, may confound analyses. We tested our data for
saturation at each codon position as a measure of homoplasy. Saturation plots (not
shown) were constructed for each gene from the data matrix produced in DAMBE
version 4.213 (Xia, 2000) using Tamura-Nei genetic distance and pairwise numbers of
transitions and transversions. Saturation of codon position three in both ND2 and cyt-b
was observed. Codon positions one and two did not show significant saturation in either
mitochondrial gene. All base positions were analyzed together for BF-I7 as it does not
encode protein, and no evidence of saturation was identified for BF-I7. We also tested
for skewness in base composition as implemented in PAUP* 4.0b10 (Swofford, 2004)
and found no significant departure from homogeneous base composition in both the mt
and nuc + mt datasets.

23
To reconstruct phylogenies we used both maximum parsimony (MP) as
implemented in PAUP* 4.0b10 (Swofford, 2004) and Bayesian inference using Markov
chain Monte Carlo in the program MrBayes 3.01 (Huelsenbeck, Ronquist, 2001). MP
analyses were heuristic with starting trees obtained by random addition of taxa with 100
replicate searches and TBR branch swapping. Successive analyses were done with all
characters equally weighted, with a transition:transversion ratio of 5:1 for mitochondrial
data and 2:1 for the nuclear data. These values were obtained by estimating the
transition:transversion ratios from the alignments and from preliminary trees. The data
were resampled using 500 bootstrap replicates to determine support at each node.
Models of evolution for parameter estimation and likelihood analysis were
determined using the hierarchical log-likelihood ratio tests in the programs MrModelTest
(Nylander, 2002) and DT ModSel (Minin et al. 2003). The simplest best-fit model for the
two mitochondrial genes (analyzed separately) was GTR + I + G. Therefore, the mt
dataset was not partitioned by gene as the model selected independently for both genes
was the same. Third codon positions were unlinked from first and second positions to
minimize the effect of saturation. We ran four Markov Chains in the program MrBayes
for six million generations (mt dataset only), sampling every 500 generations for each
dataset.
For the nuclear sequences DTModSel and MrModelTest both identified the GTR
+ G as the simplest best-fit model. The combined nuc + mt dataset was partitioned for
Bayesian analyses so that the best-fit models were applied separately to the mitochondrial
and nuclear data, and mitochondrial codon positions were all unlinked from each other.

24
We ran four Markov Chains for four million generations, sampling every 500
generations.
Analyses of both datasets were performed independently three times from random
starting points so that convergence of topology and log-likelihood scores could be
evaluated. Parameter stationarity was visualized in the program Tracer (Rambaut,
Drummond, 2003). All three Bayesian runs of the mt dataset reached stationarity in all
substitution model parameters and likelihood scores prior to 400,000 generations and a
slightly more conservative burn-in time of 600,000 generations was used. The three
Bayesian runs of the nuc + mt dataset reached stationarity in all substitution model
parameters and likelihood scores prior to 200,000 generations and a conservative burn-in
time of 400,000 generations was used. The tree topologies produced from the three
separate runs of each dataset were identical in topology, only varying slightly in support
values for nodes (<0.02 difference among Bayesian posterior probabilities).
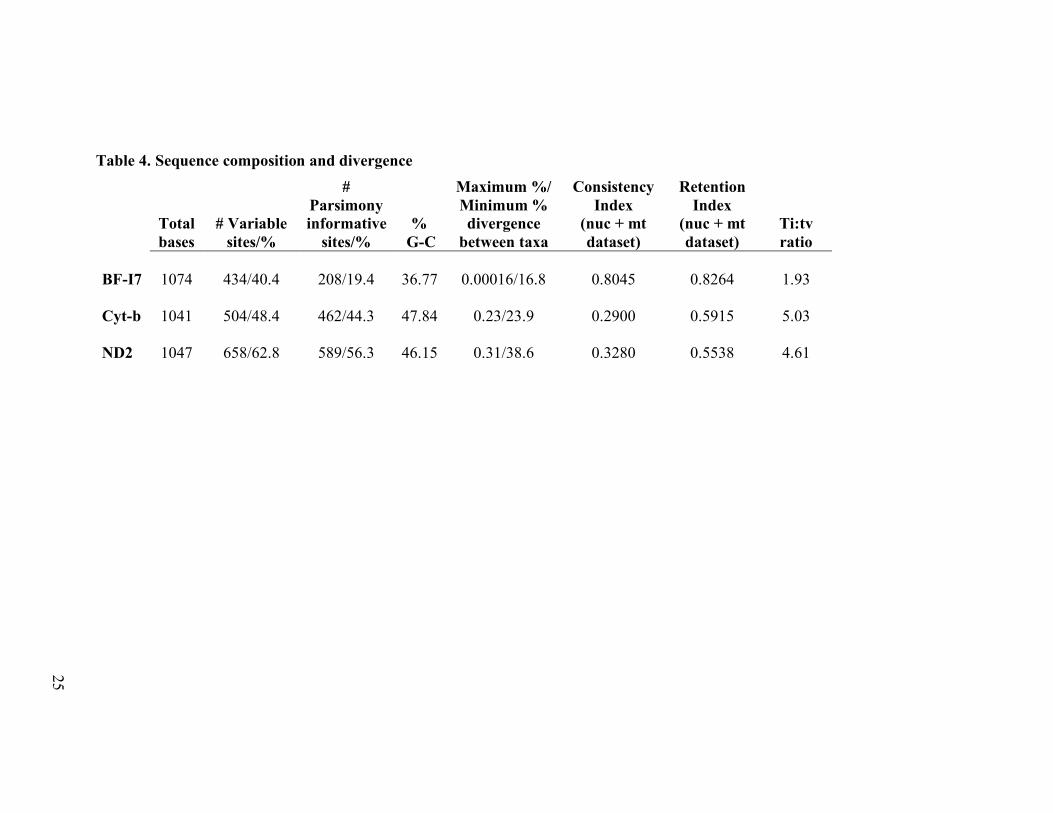
Results Gene properties: sequence composition and divergence.—We sequenced 1047 bases of
ND2 and 1041 bases of cyt-b for 110 individuals representing 106-108 species and 1074
bases of BF-I7 for 68 of the same 106-108 species. ND2 contained the most variable
sites, the most parsimony informative sites, the highest transition-transversion ratio and
had a higher maximum divergence among species as compared to BF-I7 and cyt-b (Table
4). BF-I7 had the lowest percent divergence among taxa and the lowest transition –
transversion ratio of the three sequences. Cyt-b had the highest G-C content.
Consistency and retention indices are reported for each gene although such measures are
not predictive of the ability of the gene to infer the correct tree topology (Simmons et al.,
2004).
25
Table 4. Sequence composition and divergence
Total bases
# Variable sites/%
# Parsimony informative
sites/% %
G-C
Maximum %/ Minimum % divergence
between taxa
Consistency Index
(nuc + mt dataset)
Retention Index
(nuc + mt dataset)
Ti:tv ratio
BF-I7 1074 434/40.4 208/19.4 36.77 0.00016/16.8
0.8045
0.8264 1.93
Cyt-b 1041 504/48.4 462/44.3 47.84 0.23/23.9
0.2900
0.5915 5.03
ND2 1047 658/62.8 589/56.3 46.15 0.31/38.6
0.3280
0.5538 4.61
25

26
Phylogenetic analyses.—Two to three species of Falconidae were used as outgroup taxa.
Some initial analyses were performed using two Musophagiformes as outgroups: Crinifer
piscator and Musophaga violacea. However, this did not alter the results, and trees
rooted with Falconidae species are shown here given the existing evidence for a close
relationship between the Accipitridae and Falconidae (Mindell et al., 1997; Seibold,
Helbig, 1995). We also included the secretarybird (Sagittarius serpentarius) and the
osprey (Pandion haliaetus) to help reduce any long branches between accipitrids and the
falconid outgroup.
Both datasets contained at least one representative of every major Accipitridae
taxon or clade previously proposed. We used preserved museum skins where fresh
tissue, blood or feathers was not available. DNA in museum skins is more degraded than
in fresh tissue, requiring amplification of at least two to four times the number of
overlapping regions per gene. Nuclear DNAs are already at a lower concentration than
mitochondrial DNAs in bird tissues, increasing the difficulty of amplification of nuclear
sequences from museum skins. We attempted to amplify four regions of nuclear BF-I7
for five museum skins of which four amplifications of two regions were successful
despite several attempts. Given the lower variability of BF-I7 and the increased amount
of work and cost, we did not pursue nuclear sequence for all museum skins but instead
focused on representing each major subgroup/subfamily of Accipitridae in both datasets
and all species of eagles and vultures in the mt dataset. We also added taxa to our initial
analyses to break up long branches among Perninae and Gypaetinae species. While the
increased taxon sampling did serve to break up some of those long branches, the longest
27
branches in both analyses, aside from the Elaninae and other families or outgroups, are
still found in the early-diverging Perninae clade.
Analyses using Bayesian inference of the two different datasets recovered
identical tree topologies (Figures 1 and 2). The tree topology in Figure 1 was recovered
by three independent Bayesian analyses of the mitochondrial dataset and the topology
presented in Figure 2 resulted from 3 independent Bayesian runs using the nuc + mt
dataset. The average Bayesian posterior probability for each node, and bootstrap values
for clades corresponding to those recovered in the parsimony analysis are shown on each
tree.
The MP analysis of the mitochondrial dataset found three shortest trees, each
18847 steps in length. There was one polytomy present in the final MP bootstrap tree
(not shown). Resolved branching patterns followed the topology recovered in the
Bayesian analyses with the following minor discrepancies. First, MP analysis was not
able to resolve the branching pattern within the earliest diverging clade of kites and
vultures beyond the sister relationships between Chondrohierax uncinatus and Leptodon
cayanensis, Gypaetus barbatus and Neophron percnopterus, and Hamirostra
melanosternon and Lophoictinia isura. A sister relationship between Pithecophaga
jefferyi and Terathopius ecaudatus was recovered with very low bootstrap support (bs =
52) by MP. In the MP topology Necrosyrtes monachus was not sister to the Gyps
species, but formed the first branch splitting from the clade containing Sarcogyps
(bs=54). Finally, branching patterns within the Buteoninae clade including hawks
(Leucopternis, Geranoaetus, Buteo, Geranospiza and Parabuteo) and kites (Ictinia and
Rostrhamus) differed slightly in the two analyses, however both recovered a topology

28
Figure 1. Phylogeny for Accipitridae taxa inferred from mitochondrial cyt-b and ND2 sequences. Topology shown is the Bayesian inference majority rule tree (see text for details). Bayesian posterior probability values are shown above branches and MP bootstrap values (>50%) are shown in italics below the branches.

29
Figure 2. Phylogeny of the Accipitridae inferred from mitochondrial cyt-b and ND2 and nuclear Beta-fibrinogen intron 7 sequences. Topology shown is the Bayesian inference majority rule tree (see text for details). Bayesian posterior probability values are shown above branches and MP bootstrap values (>50%) are shown in italics below branches.

30
where the two Harpyhaliaetus species are nested within a clade of two Buteogallus
species. The relationships within the Buteoninae aside from the Harpyhaliaetus species
are not the focus of this paper and will not be addressed further here.
The MP analysis of the nuc + mt dataset with all characters equally weighted,
gaps as a 5th state and a transition-transversion ratio (reflecting their relative frequencies)
of 5:1 for mitochondrial genes and 2:1 for BF-I7 found three best trees of length 15306.
Resolved branching patterns followed the topology recovered in the Bayesian analyses
and bootstrap values are shown on the Bayesian consensus tree for resolved nodes
(Figure 2). As found in the MP analysis of the mt dataset, in the nuc + mt MP analysis
relationships among species in the earliest diverging kite/vulture clade were unresolved,
Pithecophaga jefferyi and Terathopius ecaudatus were sister with low support (bs=55)
and the position for Necrosyrtes monachus was unresolved.
Phylogeny of Accipitridae (Combined results from all datasets and analyses).—Both
datasets and all analyses support monophyly for two of the four eagle groups: sea eagles
(Haliaeetinae) and booted eagles (Aquilinae). Monophyly of the harpy eagle group
(Harpiinae), the snake eagle group (Circaetinae) and the Old World vultures, however, is
not supported in any of the analyses. Topologies within these groups are discussed in
detail below. Where Bayesian posterior probabilities (PP) and parsimony bootstrap
values (bs) are shown in the text, the value from the mitochondrial dataset is listed first
followed by the value from the nuclear dataset when available.
Several other Accipitridae genera and subfamilies are also polyphyletic in our
analyses. Three separate clades of kite species (Elaninae, Perninae and Milvinae)

31
proposed by morphological data were identified, however the Milvinae and Perninae
subfamilies are polyphyletic. Two other kite species (Ictinia plumbea and Rostrhamus
sociabilis) were more closely related to buteonine taxa than to other kites and did not fall
into any of the traditional kite subfamilies. Polyboroides typus and Geranospiza
caerulescens were not closely related to each other. The genus Buteo was polyphyletic
with the roadside hawk (Buteo magnirostris) not sister to two other Buteo species. The
genus Buteogallus was also polyphyletic, with two Harpyhaliaetus species nested within
the genus.
Booted eagles (Aquilinae).—While the large booted eagle subfamily forms a well-
supported monophyletic group with high Bayesian posterior probability (PP=1.00, 1.00)
and high bootstrap values (bs=100, 100) with respect to other Accipitridae groups in all
analyses, three genera within this group are not monophyletic: Spizaetus, Aquila and
Hieraaetus. Forcing monophyly of the genus Spizaetus in the mt dataset adds 226
parsimony steps to the shortest tree of length 18847 (all such topological constraints in
the following text refer to the MP analysis of the mt dataset). Members of the genus
Aquila are found in three of six main clades in the booted eagle group. To force
monophyly of the genus Aquila an additional 103 parsimony steps are needed. Species in
the genus Hieraaetus are placed in the two latest diverging clades of booted eagles and
one species forms a separate early-diverging clade by itself. Forcing monophyly of the
genus Hieraaetus requires 84 additional parsimony steps
Hieraaetus f. fasciatus and H. f. spilogaster have been treated variously as
separate species (Ferguson-Lees, Christie, 2001; Thiollay, 1994), a superspecies

32
(Stresemann, Amadon, 1979) or subspecies (Sinclair et al., 2002). Here we sampled two
H. f. fasciatus individuals from India, one H. f. fasciatus individual from Egypt, two H. f.
spilogaster individuals from South Africa and one H. f. spilogaster from Zimbabwe. The
three Indian and Egyptian samples shared identical cyt-b sequence except for one Indian
sample at one base (sequence identity = 98.9%). The three H. f. spilogaster individuals
from South Africa and Zimbabwe were different from the three other samples at 16 base
positions in cyt-b (sequence identity = 90.2%) and another 18 bases in ND2 (sequence
identity = 93.2%).
Two individuals of each Hieraaetus morphnoides subspecies were sampled: H.
m. morphnoides and H. m. weiskei. Additionally two H. pennatus individuals from
disparate locales were sequenced. All H. pennatus individuals shared identical ND2 and
cyt-b sequences. H. m. weiskei samples also had identical mitochondrial sequence to
each other, but differed from the H. m. morphnoides sequences. Parsimony and
Bayesian analyses show that H. m. weiskei is most closely related to H. pennatus with
weak support (sequence identity for cyt-b = 97.8%, for ND2 = 98.1%; PP =0.63, bs=95).
H. m. morphnoides and H. m. weiskei are slightly more divergent: sequence identity for
cyt-b is 97.3% and for ND2 is 94.2%. Bayesian posterior probability is 1.00 and the
bootstrap support is 100 for the node separating H. m. morphnoides from H. m. weiskei
and H. pennatus.
Sea eagles (Haliaeetinae).—The sea eagles form a well-supported monophyletic group in
the mt dataset consisting of two genera: Haliaeetus and Ichthyophaga. In this analysis

33
the genus Haliaeetus is paraphyletic when the two Ichthyophaga species are included.
Forcing monophyly of the genus Haliaeetus, requires 7 additional steps.
Analyses of the nuc + mt data support a sister relationship between the sea eagles
and kites in the genus Haliastur (PP = 1.00, bs=90), however a sister relationship
between the Milvinae and Haliaeetinae was not recovered with the mt dataset
Harpy eagles (Harpiinae).—Three of four proposed harpy eagles form a clade with high
support (PP = 1.00, 1.00, bs=95, 97): Harpia harpyja, Morphnus guianensis and
Harpyopsis novaeguineae. These 3 species are highly similar in sequence (~91%
identical). A fourth species typically included in the Harpy eagle group, the Philippine
eagle (Pithecophaga jefferyi), is placed sister to a clade of snake eagles (Circaetinae)
which is distant from and earlier diverging than the three species found here to belong to
the Harpiinae. The support values for these relationships are high in all analyses. We are
unaware of any other analysis suggesting a relationship between the Philippine eagle and
the Circaetinae. Given this exceptional result in our dataset, we took extra measures to
confirm the validity of the sequence and its phylogenetic placement. We sequenced two
individual Philippine eagles for all three genes and portions of all three genes for a third
individual. All sequences obtained were identical for the three individuals, and uniquely
different from other species in the dataset. This novel finding is also corroborated by the
distribution of indels noted previously. In particular, the Philippine eagle lacks an eight
base deletion in BF-I7 that is shared by the three other traditional members of the harpy
eagle group (lack of monophyly for the harpy eagle group species is consistent whether
gaps are counted as missing data or as a 5th base state in MP analyses). Forcing

34
monophyly of the traditional harpy eagle group (4 members) would require an additional
51 parsimony steps.
It was proposed that the two species in the genus Harpyhaliaetus are members of
the harpy eagle group or are closely related (Brown, 1970). In our analyses
Harpyhaliaetus solitarius and Harpyhaliaetus coronatus are placed within the
Buteoninae and, more specifically, within a clade of two Buteogallus species. Neither
Harpyhaliaetus species shares the eight base deletion in BF-I7 found in three members of
the harpy eagle group. Forcing monophyly of the harpy eagle group including all six
potential members increases the tree length by 292 steps.
Circaetinae (snake eagles).—All of the snake eagles form a monophyletic group sister to
the Old World vulture group Aegypiinae, except the Madagascar serpent-eagle
(Eutriorchis astur) which is placed within the Gypaetinae. Forcing monophyly of all
snake eagles requires an additional 168 parsimony steps.
The genus Circaetus is not monophyletic in these analyses when the West African
serpent-eagle (Dryotriorchis spectabilis) is included. An additional 7 parsimony steps
are needed to force monophyly of the genus Circaetus.
The Bayesian posterior probability for the node uniting the Philippine eagle and
the African snake eagles (rather than the non-African snake eagles) was high (PP=0.84,
1.00). The MP analyses recovered a sister relationship between the Philippine eagle and
the bateleur albeit with low support (bs=52, 55).

35
Old World vultures (Aegypiinae and Gypaetinae).—The Old World vultures also do not
form a monophyletic group, but form two separate clades in the analyses (Aegypiinae and
Gypaetinae). Each of the Gypaetinae species (Gypohierax angolensis, Eutriorchis astur,
Neophron percnopterus and Gypaetus barbatus) are highly divergent from each other
genetically (sequence identities ~87%) but are more closely related to each other than to
other Accipitridae species (PP = 0.80). Here we also find that the Madagascar snake
eagle is a member of the Gypaetinae, a relationship not proposed before. All remaining
Old World vultures form a separate clade (Aegypinae) with a close relationship to other
snake eagles (Circaetinae). The relationships within this clade of vultures, the
Aegypiinae, are highly concordant in all analyses except the position of Necrosyrtes
monachus. This species is more closely related to, although highly divergent from, the
species of the genus Gyps than to the other four monotypic Aegypiinae genera with high
support in the Bayesian analyses (PP = 1.00, 0.99), but is sister to the other Aegypiinae
taxa in the parsimony analyses (bs = 0.54, unresolved in the nuc + mt dataset).
Necrosyrtes also lacks the ND2 insertion of two bases that all other Aegypiinae species
share.
Discussion We have presented data from both mitochondrial and nuclear sequences for
approximately 50% of the recognized species in the Accipitridae, focusing on groups
commonly known as eagles and Old World vultures with nearly complete species
representation. This is the most complete systematic treatment of the Accipitridae family
to date based on molecular data. We found strong evidence for non-monophyly of some
existing genera and subfamilies. Although Accipitridae subfamilies are infrequently used

36
in recent classifications we agree with Brown (1976) that subfamilies are useful in
clarifying relationships among these diverse birds. Designation of subfamilies is not our
primary goal; however, we use and reconfigure the twelve existing subfamilies and
recognize two new subfamilies in an effort to make the evolutionary history of the
Accipitridae more easily understood (Table 1). Our analyses included representatives of
all 14 primary Accipitridae clades that have been recognized by previous researchers. In
the following section we discuss the taxonomic history of the focal subfamilies and
several examples of convergences, generally involving traits related to feeding habits,
revealed by findings of non-monophyly for traditional taxa.
Booted eagles (Aquilinae).—We found good support for monophyly of the booted eagles
(Figs. 1 and 2), corroborating earlier morphological assessments. Proposed phylogenetic
relationships and taxonomy within the booted eagles, however, have a long history of
confusion and revision among authors. Our analyses confirm that the three main genera
(Aquila, Hieraaetus and Spizaetus) are not monophyletic, a result suspected by many
morphologists but that has been difficult to resolve with morphological traits.
Our data support an early diverging clade of Asian hawk-eagles (Spizaetus
species) separate from the New World hawk-eagles (Spizaetus spp., Oroaetus sp. and
Spizastur sp.). Brown and Amadon (1968) recognized that the Asian Spizaetus species
are more similar to each other morphologically than to the other Spizaetus species, but
did not separate the genus accordingly. Within the Asian hawk-eagle clade we find
support for sister relationships between S. cirrhatus and S. lanceolatus, and S. alboniger

37
and S. nipalensis. Within each pairing, the two species have largely overlapping ranges
and are similar morphologically (Ferguson-Lees, Christie, 2001).
The New World hawk-eagles comprise three genera (including Spizaetus) and are
all each others closest relatives, forming a separate clade within the booted eagles that is
not sister to the Old World hawk-eagles. These species have largely overlapping ranges
within the New World but are found in vastly different habitat types ranging from open
areas (Spizaetus tyrannus) to heavily forested regions at higher altitude (Oroaetus
isidori).
Three Old World species each branch off separately within the Aquilinae and are
shown not to have any close relationships with other species: the crowned hawk-eagle
(Stephanoaetus coronatus), the rufous-bellied eagle (Hieraaetus kienerii), and the Martial
eagle (Polemaetus bellicosus). Both the crowned hawk-eagle and the martial eagle have
been placed in monotypic genera because of their divergent morphology. Genetically
these birds are also highly divergent from other booted eagles in our dataset. Recently
the rufous-bellied eagle was recognized as a member of the genus Hieraaetus (Dickinson,
2003), although monophyly of the genus Hieraaetus has been questioned (Brown,
Amadon, 1968). The rufous-bellied eagle is a morphologically specialized bird having
long toes, a crest, and adult plumage that is dissimilar from the other booted eagles. Here
it is shown that it is genetically distant from other extant booted eagles, and
phylogenetically distinct from its current congeners in Hieraaetus.
The well-supported clade including the Asian black eagle (Ictinaetus malayensis),
the long-crested eagle (Lophaetus occipitalis) of Africa and two species in the genus
Aquila has not been proposed before. The species of these two monotypic genera are

38
highly unique in morphology. The long-crested eagle is an African woodland species
found in moist savannahs and riverine strips feeding on rodents, while the Asian black
eagle is a resident of mountain woodlands with morphological traits that accompany its
feeding specialization on bird’s eggs and young. The other two species in this clade, the
lesser spotted eagle (Aquila pomarina) and the greater spotted eagle (Aquila clanga) are
difficult to separate morphologically and hybrids of the two species have been
documented (Vali, Lohmus, 2004). The two specimens we sampled were significantly
different genetically, but clearly more closely related to each other than any of the other
accipitrid taxa in the study.
The next three diverging Aquilinae clades include species from the genera
Hieraaetus and Aquila, and one species currently in the genus Spizaetus. Most of these
species have been recognized as members of different genera in the past. Brown and
Amadon (1968) separate Hieraaetus species from those in the genus Aquila by
morphological traits. Hieraaetus species appear generally smaller than eagles in the
genus Aquila, with a smaller bill, longer and more slender legs and deeper emargination
on primaries; however, these characters do not hold for all species in these genera. In our
analyses we find members of these two genera intermixed with each other and with
Cassin’s hawk-eagle (Spizaetus africanus) such that, again, none of these genera are
monophyletic. One of these clades includes six closely related species: A. chrysaetos,
Spizaetus africanus, H. fasciatus, A. verreauxii, A. audax, and A. gurneyi. A close
relationship among A. gurneyi, A. chrysaetos, A. audax and A. verreauxii has been
proposed based on morphological data (Brown and Amadon, 1968). Cassin’s hawk-eagle
is morphologically divergent from these four Aquila species so it was not previously

39
included in that group. This species has been placed in the genus Hieraaetus (Thiollay,
1994) and a monotypic genus (Cassin, 1865), but has not been a member of the genus
Aquila. The remaining two species (H. fasciatus and H. spilogaster) in this clade have
sometimes been considered as conspecific subspecies (see below).
Three species currently placed in the genus Aquila (A. nipalensis, A. rapax and A.
heliaca) form a monophyletic group whereas seven other Aquila species are separated
from these three and, variously, from each other (Fig. 1). The close relationship of these
species relative to each other rather than the remaining booted eagle species is clear from
morphological data, our analysis and some previously published genetic data (Vali,
2002). The placement of these three species separate from the other seven congeners in
this study supports the need for taxonomic revision of the genus Aquila, so that it
designates a monophyletic group.
The final clade of booted eagles in our analyses includes four currently
recognized species with wide distributions and habitats: Aquila wahlbergi, Hieraaetus
ayresii, H. morphnoides and H. pennatus. All but one of these species is in the genus
Hieraaetus. This outlying species, Wahlberg’s eagle (A. wahlbergi) is an Afrotropical
species of wooded savannah or bushveld. It has been placed in the genus Hieraaetus as
well as the genus Spizaetus before.
Two booted eagle clades identified in our analyses correspond closely to the
geographical distribution of species: Indomalayan hawk-eagles of the genus Spizaetus
form a clade separate from the New World hawk-eagles (Spizaetus, Spizastur and
Oroaetus). The remaining booted eagle clades show evidence of only one other

40
(apparent) colonization of booted eagles in the New World, which is by the Golden eagle
(Aquila chrysaetos), a species that is found in both the Old and New Worlds.
Aquilinae Subspecies.—While our study has focused on recognized eagle species, we
realize that some taxa currently classified as subspecies might be better elevated to
species. The results of such analyses could have important implications for conservation,
as many Accipitridae species are declining or endangered.
In the first case we sampled multiple representatives of the two known
subspecies of Hieraaetus morphnoides (H. m. morphnoides and H. m. weiskei) which do
not overlap in range. H. m. morphnoides is found only in Australia whereas H. m.
weiskei is found only in New Guinea. Furthermore, H. m. weiskei is both smaller in size
and darker in color than H. m. morphnoides. Although Brown and Amadon (1968)
reported the differences between these two subspecies and a close relationship between
the two species H. pennatus and H. morphnoides they maintained subspecies status for
these birds. Other authors have elevated the two to species status (in Brown, Amadon,
1968). While sister relationships among these three Hieraaetus taxa is not entirely
resolved here, the amount of sequence variation between H. m. morphnoides and H.
morphnoides weiskei is as much as is found between species in this analysis. This result
is based on the sampling of multiple individuals of each species/subspecies in our
analysis and a previous study (Bunce et al., 2005) and supports the phylogenetic
distinctiveness and recognition of H. m. weiskei and H. m. morphnoides as separate
species (H. weiskei and H. morphnoides, respectively).

41
In the second case we sampled multiple individuals of Hieraaetus fasciatus. The
distribution of H. fasciatus is disjunct in that birds that reside year-round in southern
Africa are separated from migratory birds found in Europe, northern Africa, Asia and
India. Some of the more northern birds migrate to spend the winter in southern Africa,
but do not remain to breed. South African birds are also smaller in size with recognizable
plumage differences. The taxonomy of H. fasciatus has long been debated. Brown and
Amadon (1968) recognized one species H. fasciatus with two subspecies noting the
distinct appearance but similar habits of the South African representatives (H. f.
spilogaster). Two H. f. spilogaster individuals that are residents of the countries of South
Africa and a third from Zimbabwe form a distinct lineage separate from the H. f.
fasciatus individuals in our analyses with high Bayesian posterior probability. Genetic
distances between the H. f. spilogaster individuals and the H. f. fasciatus individuals are
slightly greater than that of other sister species pairings in booted eagles, such as H.
morphnoides and H. pennatus, and Aquila audax and A. gurneyi (95%, 98%, 97%
sequence similarity respectively). Our findings suggest that further study with greater
sampling of individuals is warranted in order to determine if H. f. spilogaster should be
elevated to species status (H. spilogaster) and, if so, where the limits of its distribution
lie.
Sea eagles (Haliaeetinae).—Sea eagles have long been considered to be a monophyletic
group with a close relationship to the Milvinae kites. This relationship is largely based
on the shared trait of fusion of the second and third phalanges found in all sea eagles and
the Milvinae kites (Holdaway, 1994), but not in other accipitrid taxa. Previous molecular
42
studies supported monophyly of the sea eagles in the genus Haliaeetus (Seibold, Helbig,
1996), and indicated a close relationship between single species representatives of the
two groups (Mindell et al. 1997). Here, with more comprehensive sampling, we support
monophyly of the subfamily Haliaeetinae, but not of the genus Haliaeetus when the other
sea eagle genus, Ichthyophaga, is included in analyses. We also support a sister
relationship between the Milvinae kites (species in the genera Milvus and Haliastur only)
and the sea eagles with the nuc + mt dataset.
The monotypic palmnut vulture (Gypohierax angolensis) is one of the few
frugivorous Accipitridae species, eating palm fruits, and occasionally fish, crabs, snails
and other small animals. Behavioral and morphological traits, such as rounding of the
underside of the talons, suggest a relationship between the sea eagles and the palmnut
vulture. Brown and Amadon (1968), and Jollie (1977) note that it resembles the Egyptian
vulture (Neophron). In a phylogenetic analysis of osteological characters, Holdaway
(1994) found support for a monophyletic group of vultures with the palmnut vulture as
the earliest diverging lineage. Here we present the first molecular evidence that the
palmnut vulture is an early diverging Old World vulture species more closely related to
the lammergeyer (Gypaetus barbatus), the Madagascar snake eagle and the Egyptian
vulture. Thus, the similarities between the sea eagles and the palmnut vulture are clearly
convergent in nature.
The sea eagles of the genus Haliaeetus are neatly divided by a split between
species with northern distributions (H. albicilla, H. leucocephalus and H. pelagicus) and
species of tropical distributions (H. vocifer, H. vociferoides, H. leucogaster and H.
sanfordi). H. leucoryphus is a year-round resident of the tropics, however this species

43
also breeds in the northern temperate region. Here, we find that H. leucoryphus clusters
with the northern species. These results are similar to those found by Seibold and Helbig
(1996). We also included three taxa not represented in previous studies: Ichthyophaga
ichthyaetus, I. humilis and H. vociferoides. These three species further support the
tropical—temperate split, as all of these species have tropical distributions and are found
to be members of the tropical clade. H. vociferoides, the Madagascar sea eagle and H.
vocifer, the African sea eagle are sister species, a relationship also supported by their
unique reddish plumage and complex, melodious vocalizations.
Harpy eagles (Harpiinae).—The members of the harpy eagle group (as defined by
Brown and Amadon, 1968) are easily distinguished from other Accipitridae eagles by
traits such as their extremely large size, with female wing-spans ranging from 1.76 to
2.01 meters in length and female body weights ranging from six to nine kilograms in
Pithecophaga and Harpia (Ferguson-Lees, Christie, 2001). All of the traditional harpy
eagle group members live in primary tropical forest, preying on medium-sized mammals
(e.g. monkeys, sloths, tree kangaroos). There are two Old World species, the Philippine
eagle (Pithecophaga jefferyi) and the New Guinea harpy eagle (Harpyopsis
novaeguineae), and two New World harpy eagles, the harpy eagle (Harpia harpyja) and
the crested eagle (Morphnus guianensis). Brown and Amadon (1968) suggested that
specialization in tropical forests and on a diet of mammals may have led to convergent
characters such that the Old World species are not closely related to the New World
species. Our data partially agree with this hypothesis as we found strong support for one
of the Old World species, the Philippine eagle, being more closely related to the snake

44
eagles (Circaetinae) than to the three others species in the traditional harpy eagle group.
Therefore, we do not include the Philippine eagle in the Harpiinae.
The two Harpyhaliaetus species are not members of the Harpy eagle group, but
are more closely related to the two Buteogallus species, a relationship proposed by
Brown and Amadon (1968). The genus Buteogallus is paraphyletic in our analyses when
the Harpyhaliaetus species are included.
Snake eagles (Circaetinae).—Genetic data has previously been published for only two of
the snake eagles, and morphologists have had difficulty identifying species that are
closely related to the snake eagle group. Here we present strong evidence that, when the
Madagascar serpent-eagle is excluded, the snake eagles form a monophyletic subfamily
(Circaetinae) that is most closely related to some Old World vultures (Aegypiinae) and
the Philippine eagle than to other Accipitridae. We are the first to propose that the
Madagascar serpent-eagle (Eutriorchis astur) is not a member of the clade including the
other snake eagles. For instance, Brown and Amadon (1968) suggested that Eutriorchis
and Dryotriorchis should be united in one genus, or, based on the shape of the crown
feathers, that the Madagascar serpent-eagle is more closely related to the Spilornis
species. In our analyses the Madagascar serpent-eagle clusters with three Old World
vultures in the subfamily Gypaetinae.
Another surprising finding is the placement of the Philippine eagle (Pithecophaga
jefferyi) within the snake eagle clade (see section 4.3).
The Spilornis species are extremely rare and generally island endemics in the
Indomalayan region, a region of high species loss and conservation importance (Collar et

45
al., 2001; Mooers, Atkins, 2003). Jepson et al. (2001) suggest that Indonesia’s lowland
forests will entirely vanish by 2006 and the outlook for Malaysian forests is similarly
poor. This situation highlights the importance of assessing the phylogenetic history and
genetic distinctiveness of the Indonesian Spilornis species. Here we included four
Spilornis species, Brown and Amadon (1968) proposed five, Sibley and Monroe (1990)
recognized six and Ferguson-Lees et al (2001) identified 13 Spilornis species. We
suggest relationships of all of the snake eagle species and subspecies should be further
explored with increased sampling to inform attempts to conserve these unique and
relatively little known taxa.
Snake eagles are found only in the Old World and mainly in the Indomalayan and
the Afrotropical regions. One species (Circaetus gallicus) is found in the western part of
the Palearctic region. The deepest split within the snake eagles corresponds largely to
their geographic distribution where Indomalayan species form a clade separate from the
Afrotropical species. Only the Philippine eagle does not follow this pattern as it is more
closely related to the African snake eagles. The West African serpent-eagle
(Dryotriorchis spectabilis) falls within a clade of species in the genus Circaetus,
suggesting that the taxonomy of these two genera should be revised.
Old World vultures (Aegypiinae and Gypaetinae).—Old World vultures have been
proposed to be monophyletic (Brown, Amadon, 1968; Thiollay, 1994) or polyphyletic
with Gyophierax, Neophron and Gypaetus forming one or more groups separate from the
others (Jollie, 1977b; Mundy et al., 1992; Seibold, Helbig, 1995). Sister groups have not
been identified for the Old World vultures, although the palmnut vulture (see 4.2.1) was
46
proposed to represent the “transition” from vultures to sea eagles (Brown, Amadon,
1968). Here we find clear support for two separate subfamilies of different evolutionary
origin. The Gypaetinae is the earlier diverging group, and its constituent taxa (including
Gypohierax, Gypaetus, Eutriorchis and Neophron) are relatively divergent genetically as
well as morphologically. The remaining vultures form a monophyletic group, the
Aegypiinae, sister to the Circaetinae snake eagles. The phylogenetic position of
Necrosyrtes within the Aegypiinae remains uncertain.
Kites (Milvinae, Perninae, Elaninae.—Friedmann (1950a) described three kite
subfamilies (Milvinae, Perninae and Elaninae) without identifying sister relationships
among them, and considered them as early diverging Accipitridae taxa. Brown and
Amadon (1968) considered kites to be the most “primitive” Accipitridae group due to
their specialization on insects (e.g. bee and wasp larvae) or snails. Here we provide
evidence of at least four distinct clades, including the three traditional kite subfamilies
with some novel hypotheses of relationships, and two non-sister lineages within the
Buteoninae. The non-sister relationship for Ictinia and Rostrhamus requires further
analysis as nodal support values are relatively low and taxonomic representation of kites
and Buteoninae is limited.
Convergent evolution in Polyboroides and Geranospiza .—The gymnogene
(Polyboroides typus) and the crane hawk (Geranospiza caerulescens) are specialized
birds that have developed a series of morphological characteristics related to capturing
birds in cavity nests or other small animals in holes or crevices. These traits include an

47
extended circular range of motion for the tarsus, a short outer toe and a relatively weak
bill. Based on these traits a close relationship between the two species has been proposed
(Friedmann, 1950a). Some morphological differences between these two species,
including differences in extent of tarsus rotation, suggest that two different evolutionary
paths led to the traits allowing exploitation of cavity nesting species (Burton, 1978).
These two species are not closely related in our analyses, denoting a clear example of
convergent evolution in specialized morphology in the Accipitridae.
Conclusions This study takes a large step toward resolving the uncertain relationships among
birds in the Accipitridae. Our analyses include over 3,000 bases of nuclear and
mitochondrial DNA and a sampling of almost half of the known Accipitridae species,
with nearly complete species sampling for eagles and Old World vultures. We find
support for a set of phylogenetic relationships among Accipitridae taxa that differ from
previous hypotheses based on morphological data. Fourteen subfamilies, of which two
are new, are discussed here in order to represent the diversity and evolutionary history of
Accipitridae taxa in a manner reflecting our findings. If taxonomy is to reflect phylogeny,
revisions are warranted within the booted eagle (Aquilinae), snake eagle (Circaetinae) sea
eagle (Haliaeetinae) and harpy eagle (Harpiinae) groups. We report significant genetic
differentiation among several sets of subspecies investigated, suggesting that further
analyses, particularly of booted eagles, should include multiple samples of species across
their ranges or representing described subspecies. The rarity and threatened status of
many of the Accipitridae species make such investigations of imminent importance to
conservation.

48
Acknowledgements This manuscript was published in the journal Molecular Phylogenetics and
Evolution (Lerner, Mindell, 2005). We are very grateful to the many institutions and
individuals that contributed samples for this study (see Table 1) as well as those who
helped in aspects of data collection: Mike Bunce and others at the ABC, Joshua Rest,
Wendy Grus, Jeff Johnson, Jared Rubenstein, Mathew S. Klaver, Jill Ceitlin, Christie
Chapin, Soochin Cho, Michael Lerner, Walter Boles, David Allen, Alistair McInnes, Ben
Hoffman, Sarah Chabangu, Andrew Jenkins, Gerwin van Deventer, Kerri Wolters,
Jeanne-Marie Pittman, Hendrik Louw, Clair Louw, Craig Copeland, Shawn Williamson,
Pam Struttenburg, Dora Susanibar, Oscar Beingolea, Hector Miranda, Russell Thorstrom,
Lindsay Oaks and Martin Gilbert. Many individuals at various governmental and private
organizations assisted us in obtaining the appropriate permits for collection and shipment
of the samples, including: Ellen Paul (The Ornithological Council), The Peregrine Fund,
Deon Hignett (Western Cape Nature Conservation Board, South Africa), Dora Susanibar
(Museo de Historia Natural, Peru), Peter Thomas (USFWS), Mike Carpenter (USFWS),
Paul Scobie (ISIS), Department of Wildlife and National Parks for the Gambia, Hector
Miranda, and Andrea Gaski (USFWS). The Philippine Eagle Foundation went to great
lengths to provide samples for this study. Without these samples we could not have
confirmed the outstanding relationship between the Philippine eagle and Old World
snake eagles (rather than other harpy eagles). The Philippine Department of
Environment and Natural Resources graciously granted permits for transfer of the
Philippine Eagle blood and feather samples. We thank Jeff Johnson and Bob Payne for
valuable comments on manuscript drafts. This research was supported by grants from the

49
University of Michigan (UM) Rackham Graduate School, Latin American and Caribbean
Studies Program, International Institute, Dept. of Ecology and Evolutionary Biology, the
National Institutes of Health (graduate student support for HL) and the National Science
Foundation.
Author note After this article was accepted for publication a treatment of a subset of booted eagles
(Aquilinae) using cyt-b and additional nuclear sequences was published by Helbig et al.
(2005). The findings of Helbig et al. are concordant with our study, as are the cyt-b
sequences with the notable exception of Aquila pomarina. While both analyses place A.
pomarina as sister to A. clanga with high support, the cyt-b sequences are relatively
dissimilar (87.4% similarity index). Aquila pomarina has a disjunct population
distribution with separate Indian and European populations; the Indian population is
morphologically distinct and denoted by the subspecies A. p. hastata. The specimen used
in our study is from the Indian population/subspecies, while Helbig et al. used a specimen
of European origin. This large sequence divergence between two specimens from
separate populations of the same species suggests that further study of the populations of
this species is warranted. The placement of the crowned hawk-eagle (Stephanoaetus
coronatus) also differs between the two studies. We find the crowned hawk-eagle to be
the first diverging species after the Old and New World hawk-eagles, while Helbig et al.
support a sister relationship between Old World hawk-eagles and the crowned hawk-
eagle. This difference is likely a result of the larger and slightly different taxon set used
in our study, as we do not find a sister relationship between the crowned hawk-eagle and
the Old World hawk-eagles even when we analyze our cyt b sequences separately from
the other sequences in our study.

50
References Arctander P (1995) Comparison of a mitochondrial gene and a corresponding nuclear
pseudogene. Proc. R. Soc. Lond. B Biol. Sci. 262:13-19 Brown LH (1970) Eagles. Arco Publishing, Inc., New York Brown LH (1976) Birds of Prey their biology and ecology. A & W Publishers, Inc, New
York Brown LH, Amadon D (1968) Eagles, hawks and falcons of the world. Country Life
Books, London Bunce M, Szulkin M, Lerner HRL, Barnes I, Shapir B, Cooper A, Holdaway RN ((in
press)) The evolutionary history of New Zealand's extinct giant eagle revealed by ancient DNA. Public Library of Science Biology
Bunce M, Szulkin M, Lerner HRL, Barnes I, Shapiro B, Cooper A, Holdaway RN (2005) The evolutionary history of New Zealand's extinct giant eagle revealed by ancient DNA. Public Library of Science Biology 3:e (9)
Burton PJK (1978) The intertarsal joint of the Harrier-hawks Polyboroides spp. and the Crane hawk Geranospiza caerulescens. The Ibis 120:171-177
Cassin (1865) Proc. Acad. Nat. Sci. Philadelphia:4 CITES-Secretariat (2003) update to Appendices I, II, III. Convention on International
Trade in Endangered Species of Wild Fauna and Flora Collar NJ, Andreev AV, Chan S, Crosby MJ, Subramanya S, Tobias JA (2001)
Threatened birds of Asia: the Birdlife International Red Data Book. BirdLife International, Cambridge, U.K.
Cooper RA (1994) DNA from museum specimens. In: Herrmann B, Herrmann S (eds) Ancient DNA: recovery and analysis of genetic material from paleontological, archaeological, museum, medical, and forensic specimens. Springer, New York, p 149-165
Cooper RA, Poinar HN (2000) Ancient DNA: Do it right or not at all. Science 289:1139
Dickinson EC (2003) The Howard and Moore Complete Checklist of the Birds of the World. Christopher Helm, London
Ferguson-Lees J, Christie DA (2001) Raptors of the World. Christopher Helm, London Friedmann H (1950) The Birds of North and Middle America. U.S. Government
Printing Office, Washington, D.C. Gadow H (1893) Vogel. In: Bronns HG (ed) Klassen und Ordnungen des Thier-Reichs,
wissenschaftlich dargestellt in Wort und Bild. Sechster Band. C.F. Winter'sche, Leipzig und Heidelberg
Gamauf A, Haring E (2004) Molecular phylogeny and biogeography of Honey-buzzards (genera Pernis and Henicopernis). J. Zool. Syst. Evol. Research 42:145-153
Hall TA (1999) BioEdit: a user-friendly biological sequence alignment editor and analysis program for Windows 95/98/NT. Nucl. Acids. Symp. Ser. 41:95-98
Helbig AJ, Kocum A, Seibold I, Braun MJ (2005) A multi-gene phylogeny of aquiline eagles (Aves : Accipitriformes) reveals extensive paraphyly at the genus level. Molecular Phylogenetics and Evolution 35:147-164
Holdaway RN (1994) An exploratory phylogenetic analysis of the genera of the Accipitridae, with notes on the biogeography of the family. In: Meyburg B-U,

51
Chancellor RD (eds) Raptor Conservation Today. World Working Group on Birds of Prey and Owls, London, p 601-649
Huelsenbeck JP, Ronquist F (2001) MR BAYES: Bayesian inference of phylogenetic trees. Bioinformatics 17:754-755
Jepson P, Jarvie JK, MacKinnon K, Monk KA (2001) The end for Indonesia's lowland forests? Science 292:859-+
Johnson JA, Watson RT, Mindell DP (in press) Prioritizing species conservation: does the Cape Verde kite exist?
Jollie M (1976) A contribution to the morphology and phylogeny of the Falconiformes, part 1. Evolutionary Theory 1:285-298
Jollie M (1977a) A contribution to the morphology and phylogeny of the Falconiformes, Part 2. Evolutionary Theory 2:285-298
Jollie M (1977b) A contribution to the morphology and phylogeny of the Falconiformes, part 3. Evolutionary Theory 2:209-300
Lerner HRL, Mindell DP (2005) Phylogeny of eagles, Old World vultures, and other Accipitridae based on nuclear and mitochondrial DNA. Molecular Phylogenetics and Evolution 37:327–346
Mindell DP, Sorenson MD, Huddleston CJ, Miranda HCJ, Knight A, Sawchuck SJ, Yuri T (1997) Phylogenetic relationships among and within select avian orders based on mitochondrial DNA. In: Mindell DP (ed) Avian Molecular Evolution and Systematics. Academic Press, London, p 211-245
Mooers AO, Atkins RA (2003) Indonesia's threatened birds: over 500 million years of evolutionary heritage at risk. Animal Conservation 6:183-188
Mundy P, Butchart D, Ledger J, Piper S (1992) The vultures of Africa. Academic Press, London
Nylander JAA (2002) MrModeltest. Program distributed by the author., Uppsala University Department of Systematic Zoology
Peters JL (1931) Check-List of Birds of the World. Harvard University Press, Cambridge
Rambaut A, Drummond AJ (2003) Tracer. available from http://evolve.zoo.ox.ac.uk/, Oxford
Riesing MJ, Kruckenhauser L, Gamauf A, Haring E (2003) Molecular phylogeny of the genus Buteo (Aves : Accipitridae) based on mitochondrial marker sequences. Molecular Phylogenetics and Evolution 27:328-342
Seibold I, Helbig AJ (1995) Evolutionary history of New and Old World vultures inferred from nucleotide sequences of the mitochondrial cytochrome b gene. Philosophical Transactions of the Royal Society of London Series B-Biological Sciences 350:163-178
Seibold I, Helbig AJ (1996) Phylogenetic relationships of the sea eagles (genus Haliaeetus): Reconstructions based on morphology, allozymes and mitochondrial DNA sequences. Journal of Zoological Systematics and Evolutionary Research 34:103-112
Seibold I, Helbig AJ, Meyburg BU, Negro JJ, Wink M (1996) Genetic Differentiation and Molecular Phylogeny of European Aquila Eagles according to Cytochrome b Nucleotide Sequences. In: Meyburg BU, Chancellor RD (eds) Eagle Studies. World Working Group on Birds of Prey (WWGBP), London

52
Sibley CG, Monroe BL (1990) Distribution and Taxonomy of Birds of the World. Yale University Press, New Haven
Simmons MP, Reeves A, Davis JI (2004) Character-state space versus rate of evolution in phylogenetic inference. Cladistics-the International Journal of the Willi Hennig Society 20:191-204
Sinclair I, Hockey P, Tarboton W (2002) Birds of Southern Africa. Struik Publishers, Cape Town
Sorenson MD, Ast JC, Dimcheff DE, Yuri T, Mindell DP (1999) Primers for a PCR-Based Approach to Mitochondrial Genome Sequencing in Birds and Other Vertebrates. Molecular Phylogenetics and Evolution 12:105-114
Sorenson MD, Fleischer RC (1996) Multiple independent transpositions of mitochondrial DNA control region sequences to the nucleus. Proceedings of the National Academy of Sciences of the United States of America 93:15239-15243
Stresemann E, Amadon D (1979) Order Falconiformes. In: Peters JL (ed) Check-list of the birds of the world. Harvard University Press, Cambridge, Massachusetts, p 271-425
Swofford DL (2004) PAUP*: phylogenetic analysis using parsimony (* and other methods. Sinauer, Sunderland, Mass
Thiollay JM (1994) Family Accipitridae (Hawks and Eagles). In: del Hoyo J, Elliott A, Sargatal J (eds) Handbook of the Birds of the World. Lynx Ediciones, Barcelona, p 52-205
Vali C, Lohmus A (2004) Nestling characteristics and identification of the lesser spotted eagle Aquila pomarina, greater spotted eagle A-clanga, and their hybrids. Journal of Ornithology 145:256-263
Vali U (2002) Mitochondrial pseudo-control region in old world eagles (genus Aquila). Molecular Ecology 11:2189-2194
Xia X (2000) Data analysis in molecular biology and evolution. Kluwer Academic Publishers, Boston

53
Chapter 3
Molecular phylogenetics of the buteonine birds of prey (Aves: Accipitridae)
The Buteoninae subfamily of hawk, hawk-like and kite species forms one of the
largest groups in the avian Accipitridae family including 24 sub-buteo species (Amadon,
1982a) two kite genera (Lerner, Mindell, 2005) and 25-28 Buteo species (Dickinson,
2003; Ferguson-Lees, Christie, 2001). They are of particular interest as eleven species
are of conservation concern (Baillie et al., 2004) with one critically endangered (Buteo
ridgwayi) and two endangered species (Leucopternis occidentalis and Harpyhaliaetus
coronatus). Buteoninae has also included the sea and booted eagles (Grossman, Hamlet,
1964) or the sea, booted and harpy eagles (Friedmann, 1950b). Our recent molecular
analysis, however, showed that the sea, booted and harpy eagles form monophyletic
groups separate from a clade of ten sub-buteos, two kites and three Buteo species (Lerner,
Mindell, 2005). Therefore, we do not consider any of the eagle groups as members of
Buteoninae. For purposes of this study, we consider Buteoninae to be comprised of the
genus Buteo and the nine sub-buteo and two kite genera all previously proposed as or
found to be close relatives of Buteo: New World hawks Leucopternis, Buteogallus
(including Heterospizias), Harpyhaliaetus, Busarellus, Parabuteo, Geranoaetus,
Asturina (now within Buteo) and Geranospiza; Old World hawks Kaupifalco and
Butastur (Amadon, 1982a); and, kites Ictinia and Rostrhamus (Lerner, Mindell, 2005).
54
While polyphyly of the sub-buteo group with respect to Buteo has long been
suspected, only recently has it been shown that the genera Buteo, Leucopternis and
Buteogallus are not monophyletic with respect to each other (do Amaral et al., 2006;
Lerner, Mindell, 2005; Riesing et al., 2003b). The full extent of polyphyletic
relationships in Buteoninae is not known since not all nominal species and subspecies
have been included in a single analysis. Further, previous analyses have not tested
Buteoninae phylogenetic relationships in context of the other major accipitrid clades. In
particular, the placement of the Lizard Buzzard (Kaupifalco monogrammicus), Black-
collared Hawk (Busarellus nigricollis) and genus Butastur remains to be assessed with
molecular data in the broader context of the Accipitridae. The three species of Butastur
have not previously been included in peer-reviewed molecular datasets. Neither
Kaupifalco nor Busarellus formed close sister relationships with three other sub-buteo
genera, 25 Buteo species, a booted eagle and an accipiter in a study by Riesing et al.
(2003b) using mitochondrial NADH dehydrogenase subunit 6 (ND6) and pseudo-control
region. With a phylogeny generated from 191 osteological characters for 44 Accipitrid
taxa, Holdaway (1994) did not find a close relationship between Kaupifalco and any
other accipitrid species. In the same study, Busarellus was sister to booted eagles
Hieraaetus and Polemaetus although nodal support values were not presented for the
phylogeny.
Species status has been questioned for taxa in the sub-buteonine genera
Buteogallus (B. anthracinus, B. subtilis and B. aequinoctialis) and Leucopternis (L.
schistaceus and L. plumbeus; L. kuhli and L. melanops; and, L. albicollis, L. occidentalis
and L. polionotus) where widespread taxa occupying similar niches have been divided

55
into multiple subspecies or separate species without conclusive evidence one way or the
other (Amadon, 1982a). A recent mitochondrial phylogeny found sister relationships for
L. kuhli and L. melanops and L. albicollis, L. occidentalis and L. polionotus but not for L.
schistaceus and L. plumbeus (do Amaral et al., 2006). Still, the other questioned
Leucopternis and Buteogallus groups have not been tested with molecular data and
further testing of most of these groups is needed to evaluate current taxonomy.
A comprehensive analysis of the phylogenetic relationships among proposed
buteonine genera and species is needed to address remaining questions about the group’s
evolutionary history. With complete taxonomic representation of genera and nearly all
nominal species and sub-species of sub-buteos, we address the following questions: (1)
are Kaupifalco, Busarellus and Butastur closely related to other proposed buteonines?
(2) what are the sister relationships among Buteoninae genera? (3) to what extent are the
genera polyphyletic? (4) is there evidence of genetic divergence and reciprocal
monophyly to support current taxonomy for species and subspecies of Buteogallus and
Leucopternis?
Methods We sampled at least one individual of each nominal genus, species and nearly all
subspecies of sub-buteos. Our final sampling included 107 individuals representing 45
out of 55 buteonine species, 26 out of 176 non-Buteonine accipitrid species and 2 non-
accipitrid outgroup species (Table 1, Dickinson, 2003; Ferguson-Lees, Christie, 2001).
To test monophyly of Buteoninae we included representatives of each recognized
Accipitridae subfamily/clade. We also included multiple representatives of Circus,

56
Table 5. Sample information. Dataset Genus speciesa Voucher or Tissue IDf,
Tissue typec mtd mt +
bf ND6e Locality
Accipiter bicolor guttiferb LSUMZ B18875, T √ √ Santa Cruz Dept., Bolivia Accipiter cooperiib KUNH 1757, T √ √ Unknown, U.S.A. Accipiter gentilis atricapillus UMMZ 233684, T √ Michigan, U.S.A. Accipiter gularis LSUMZ 16971, T √ Saitama Prefecture, Japan Accipiter c. cirrocephalus AMS O.65038, T √ √ New South Whales, Australia Accipiter n. nisus KUNH 4501, T √ Entracque, Italy Accipiter r. rufiventris PBC 19, T, P √ √ South Africa Aegypius monachusb DZ 1903, B √ √ Captive, Unknown Asturina nitida/Buteo nitidus pallida LSUMZ B9624, T √ √ √ Nicolás Suarez, Bolivia Busarellus nigricollis leucocephalus UMMZ 105267, M √ √ Paraguay Butastur indicus UMMZ 65937, M √ Ishigaki, Japan Butastur rufipennis UMMZ A1290, T √ √ √ Gambia Butastur teesa UMMZ 209040, M √ Kampur, India Buteo albicaudatus hypospodius MSB 20414, T √ √ √ Texas, U.S.A. Buteo albigula LSUMZ 31984, T √ √ √ Quebrada Lanchal, Peru Buteo jamaicensisb UMMZ T-2797, T √ √ √ North America Buteo lagopus sanctijohannis KUNHM 3450, T √ √ Kansas, U.S.A. Buteo/Percnohierax leucorrhous ZMUC P526 (113928), D √ √ √ Cotopaxi, Ecuador Buteo lineatus LSUMZ B1344, T √ √ unkown Buteo/Rupornis magnirostris
occiduusb LSUMZ B2862, T √ √ √ Loreto Dept, Peru
Buteo oreophilus trizonotatus WOB 17, B, P √ √ South Africa Buteo p. platypterus UMMZ DM36, T √ √ √ Michigan, U.S.A. Buteo poecilochrous HUA 8, B, P √ √ √ Peru
56

57
Buteo p. polyosoma LSUMZ B5135, T √ √ √ Las Pampas, Peru Buteo regalis KUNHM 1767, T √ √ √ Kansas, U.S.A. Buteo rufinus UMMZ DM54, T √ √ unknown Buteo rufofuscus JBZ 5, B √ √ √ South Africa Buteo swainsoni UMMZ DM11, T √ √ √ unknown Buteogallus aequinoctialis UMMZ 116637, M √ Matapica, Surinam Buteogallus a. anthracinusb LSUMZ B28575, T √ √ Fort Sherman, Panama Buteogallus meridionalis UMMZ 155624, M √ √ √ El Pao, Venezuela Buteogallus subtilis bangsi UMMZ 132087, M √ √ Pigres, Costa Rica Buteogallus urubitinga ridgwayi UMMZ 132082, T √ √ √ Catalina, Costa Rica Busarellus nigricollis leucocephalus UMMZ 105267, M √ √ √ Riacho Negro, Paraguay Chondrohierax uncinatusb TPF 147, B, P √ √ Grenada Circaetus cinereusb PNZ 8, B, P √ √ South Africa Circaetus gallicusb TAU 363, T √ √ Unknown Circus aeruginosus b TAU 353, T √ √ Unknown Circus ranivorusb PBC 6, B, P √ √ South Africa Elanus leucurus majusculus LSUMZ 24997, T √ √ Texas, U.S.A. Geranoaetus/Buteo melanoleucus
australisb HUA 3, B, P √ √ √ Peru
Geranospiza caerulescens LSUMZ B4226, T √ √ Peru Geranospiza caerulescens flexipesb KUNHM 3110, T √ √ Paraguay Haliaeetus leucocephalusb UMRC N42, T √ √ North America Haliastur sphenurusb SAM NTMT651, ABTC-
27746, T √ √ Northern Territory, Australia
Hamirostra melanosternonb AMS 1, F √ √ Australia Harpyhaliaetus coronatusb UMMZ 101669, M √ Amambay, Paraguay Harpyhaliaetus s. solitariusb HUA 18, B √ √ √ Peru Ictinia plumbea KUNHM 2900, T √ √ Paraguay Ictinia mississippiensis KUNHM B1581, T √ Lousiana, USA Kaupifalco monogrammicus UMMZ 214672, M √ Mozambique
57

58
meridionalis Leptodon cayanensisb KUNHM 139, T √ √ Paraguay Leucopternis a. albicollis ZMUC P1517 (114919),
D √ √ √ Tigre Playa Sucumbios, Ecuador
Leucopternis a. albicollis HUA 10, B, P √ √ √ Selva Central, Peru Leucopternis. a. albicollis HUA 11, B, P √ √ √ Selva Central, Peru Leucopternis. a. albicollis HUA 12, B, P √ √ √ El Huayco, Peru Leucopternis a. albicollis UMMZ 117773, M √ Surinam Leucopternis albicollis costaricensis LSUMZ B2312, T √ √ √ Panama Leucopternis albicollis costaricensis TPF WHH-024, B √ √ √ Panama Leucopternis albicollis costaricensis UMMZ 56218, M √ Barro Colorado Island, Panama Leucopternis albicollis costaricensis UMMZ 85741, M √ Nicaragua Leucopternis albicollis costaricensis UMMZ 199396, M √ Honduras Leucopternis albicollis ghiesbreghti TPF, LM-0, B √ √ √ Tikal National Park, Guatemala Leucopternis. albicollis ghiesbreghti TPF, LM-1, B √ √ √ Naranjol, Guatemala Leucopternis albicollis ghiesbreghti TPF, LM-2, B √ √ √ Yucatan Peninsula Leucopternis. albicollis ghiesbreghti UMMZ 210554, M √ Oaxaca, Mexico Leucopternis albicollis ghiesbreghti UMMZ 94013, M √ Chiapas, Mexico Leucopternis albicollis williaminae USNM 372349, M √ Cesar, Colombia Leucopternis albicollis williaminae
(TYPE) ANSP 160392, M √ Bolivar, Colombia
Leucopternis kuhlib LSUMZ B4598, T √ √ √ South Rio Amazonas, Peru Leucopternis kuhli FMNH 101120, M √ Brazil Leucopternis kuhli FMNH 297880, M √ Peru Leucopternis kuhli USNH 512908, M √ Para, Brazil Leucopternis lacernulatus AMNH 317243, M √ Espirito Santo, Brazil Leucopternis melanops LSUMZ B4493, T √ √ √ Lower Rio Napo, Peru Leucopternis melanopsb LSUMZ B7167, T √ √ √ Peru Leucopternis melanops FMNH 260137, M √ √ Surinam Leucopternis melanops AMNH 471056, M √ Caura, Venezuela Leucopternis occidentalis UMMZ DM BE5, T √ √ √ unknown 58

59
Leucopternis occidentalis LSUMZ B7805, T √ √ √ Ecuador Leucopternis occidentalis LSUMZ B7890, T √ √ √ Ecuador Leucopternis occidentalisb ZMUC P1319 (114721),
D √ √ √ Esmeraldas, Ecuador
Leucopternis plumbeus BMNH 1939.12.9.295, M
√ Perme
Leucopternis plumbeus BMNH 1955.6.n.20.2453, M
√ √ Ecuador
Leucopternis polionotus BMNH 1895.4.1.510, M √ √ Rio de Janeiro, Brazil Leucopternis polionotus USNM 264120, M √ Santa Catharina, Brazil Leucopternis princeps zimmeri LSUMZ B11751, T √ √ √ Ecuador Leucopternis p. princeps AMNH 389182, M √ Turrialba, Costa Rica Leucopternis schistaceus LSUMZ B4946, T √ √ √ S Rio Amazonas, Peru Leucopternis schistaceus FMNH 217636, M √ Bolivia Leucopternis semiplumbeus LSUMZ B2291, T √ √ √ Panama Leucopternis semiplumbeus LSUMZ B2326, T √ √ √ Panama Leucopternis semiplumbeus UMMZ DM35, T √ Unknown Lophoictinia isurab AMS 0.7591, F √ Australia Melierax canorus WOB 7, B, P √ √ South Africa Melierax poliopterus TPF MB-15, F, P √ Unknown Micronisus g. gabarb UMMZ A765, T √ √ Zimbabwe Oroaetus isidorib HUA 23, B, P √ √ Peru Parabuteo unicinctus harrisib UMMZ DM40, T √ √ √ Arizona, U.S.A. Rostrhamus s. sociablisb KUNHM 5852, T √ √ Guyana Spizaetus ornatus vicariousb LSUMZ B2267, T √ √ Darien Province, Panama Torgos tracheliotusb UMMZ 234705, T √ √ South Africa Urotriorchis macrourus FMNH 204470, M √ Centre Sud, Cameroon Sagittarius serpentariusb JBZ 12, B, P √ √ South Africa Pandion haliaetusb UMMZ 225997, T √ √ Michigan, U.S.A.
59
60
a Scientific names (Table 5) follow Dickinson (2003) with changes suggested by David and Gosselin (2002). Riesing et al.’s
(2003b) proposed generic changes follow a slash after the traditional name.
bSequence data from Lerner and Mindell (2005)
cTissue type: Blood (B), muscle or organ (T), museum toepad (M), feather (F), DNA extract (D), Photo voucher (P)
dGenbank sequence used in the mt dataset: NC 003128
eGenbank sequences used in the ND6 dataset: NC 003128, AY213011, AY213034, AY213045, AY216914, AY216916-
AY216919, AY216921-AY216924, 15990570, 29569538, 29569560; odd numbers 7407009-7407013, 7407023-7407029, 7407057-
7407059, 76009021-76009069; even numbers 29569512-29569514, 29569518-29569524, 29569530-29569534, 29569542-29569554,
29569564-29569568, 29569572-29569576
fAustralian Museum Evolutionary Biology Unit, Sydney (AMS); American Museum of Natural History, New York (AMNH);
Academy of Natural Sciences, Philadelphia (ANSP); Natural History Museum, London (BMNH); Field Museum of Natural History,
Chicago (FMNH); El Huayco, Lima (HUA); Johannesburg Zoo, Johannesburg (JBZ); Kansas University Natural History Museum,
Lawrence (KUNHM); Louisiana State University Natural History Museum, Baton Rouge (LSUMZ); Museum of Southwestern
Biology, Albuquerque (MSB); Predatory Bird Centre, Pietermaritzburg (PBC); National Zoological Gardens of South Africa, Pretoria,
(PNZ); South Australia Museum, Adelaide (SAM); Tel Aviv University Research Zoo, Tel Aviv (TAU); The Peregrine Fund, Boise
(TPF); University of Michigan Museum of Zoology, Ann Arbor (UMMZ); University of Minnesota Raptor Center, Saint Paul
60

61
(UMRC); National Museum of Natural History, Washington D.C. (USNM); World of Birds Wildlife Sanctuary, Houtbay (WOB);
Zoologisk Museum, Københavns Universitet, Copenhagen (ZMUC).
61

62
Melierax, and Accipiter and one sample each for two monotypic genera (Micronisus,
Urotriorchis) based on findings of a close relationship between these taxa and Kaupifalco
using published ND2 and cyt-b sequences (Lerner, Mindell, 2005). In order to
incorporate more Buteo species in our analyses and compare our results to two recent
molecular studies, we also sequenced ND6 from 42 of our buteonine samples and
analyzed them in a dataset with previously published ND6 sequences from an additional
eight Buteo species, eight Buteo subspecies and three non-Buteo buteonine subspecies
(Table 1, do Amaral et al., 2006; Riesing et al., 2003b). Samples were identified to the
subspecies level based on specimen labels or collection locality and are reported as such
in Table 5 and Figure 4. Common names follow the 7th edition of the AOU Check-list of
North American Birds and its supplements (AOU, 1988) or The Handbook of Birds of
the World (Thiollay, 1994).
Total genomic DNA was extracted from blood or other tissue of contemporary
specimens or from toe-pad tissue of museum specimens using a DNeasy Tissue
Extraction Kit (QIAGEN Inc.). Lab work involving DNA extraction and PCR set-up
from museum samples was conducted in a facility reserved for ancient DNA at the
University of Michigan Museum of Zoology using protocols developed for ancient DNAs
including multiple extraction and PCR controls (Cooper, Poinar, 2000). PCR
amplifications were conducted using primers we designed for Buteoninae as well as
published primer sequences for avian mitochondrial cytochrome-b (cyt-b), ND2, ND6
and the non-repetitive part of the pseudo-control region, and nuclear BF-I7 (primer
sequences are reported in Table 6). These genomic regions were chosen for their ability
to resolve both recent and deep divergences and their comparability with published

63
Table 6. Primer Sequences.
Regiona Primer ID Sequence (5-3’)
cyt-b b
H15370.leuc
L15287.leuc
H15599.leuc
L15508.leuc
L15718.leuc
H15778.leuc
GAT GTA GGG GAT RGC TGA GA
CYC TYA TAG CAA CYG CCT TC
AGG GAR AAG TAR GGR TGR AA
CAC CTY ACC TTC CTC CAC GA
CCC CAC ACA TCA AAC CAG A
GGG ATT GAG CGT AGR ATR GC
ND2 b
H5469.leuc
L5432.leuc
H6022.leuc
L5993.leuc
KAG RAG YGT RGA GGC TGT TG
GCC ATC GAA GCY ACR ATC AA
TGT RGY TRT TTC TTG YTT GG
CAG GCT TCC TRC CCA AAT GR
BF-I7c
1H.bf.leuc
2L.bf.leuc
2H.bf.leuc
3L.bf.leuc
3H.bf.leuc
4L.bf.leuc
4H.bf.leuc
TAC TTG GTT GTG GAG CAG CA
AGC CAA ATG TCC ATG CAG TT
AAC TGA GCA CCT GTC TTC TGA G
CAG TAA CAC ATA ATG GGT CCT GA
TGG AAG GTG AAG CAG CTA AGA
GCA ATT ATC ATT ATG AAC TGC AAG
CCA TCC ACC ACC ATC TTC TT
a ND6: tPROfwd, tGLUfwd, tGLUrev, YCR2rev (Riesing et al., 2003b)
b cyt-b, nd2: L14996, H15646, L15560, H16064, L5219, H5766, H6313 (Sorenson et al.,
1999)c BF-I7: FIB-BI7U, FIB-BIL2, FIB-BIU2, FIB-BI7L (Prychitko, Moore, 2000)

64
sequences (do Amaral et al., 2006; Lerner, Mindell, 2005; Prychitko, Moore, 2000;
Riesing et al., 2003b; Sorenson et al., 1999). PCR products were gel purified using a
QIAquick Gel Extraction Kit (Qiagen), directly sequenced from both strands with ABI
big dye terminator chemistry and resolved on an ABI 3730 automated sequencer.
Sequences were viewed as chromatographs in Sequencher version 4.5 (Gene Codes) and
aligned by eye in BioEdit Sequence Alignment Editor (Hall, 1999b).
Corrected sequence divergence (csd) estimates among taxa were calculated using
Tamura-Nei (1993) distances in MEGA v2.1 (Kumar et al., 2001). Empirical base
frequencies and nucleotide composition bias were calculated in PAUP* (Swofford,
2004). Substitution saturation plots were constructed by codon position and gene for
mitochondrial loci in DAMBE using Tamura-Nei genetic distance (1993) and pairwise
numbers of transitions and transversions (Xia, 2000).
Phylogenetic reconstruction was carried out using maximum parsimony (MP),
maximum likelihood (ML) and Bayesian inference (BI) separately on each gene or intron
and then on multi-locus datasets (see below). MP trees were constructed in PAUP*
v.4.0b10 (Swofford, 2004) using heuristic searches with starting trees obtained by
random addition of taxa with 10 replicate searches and TBR branch swapping for 1000
bootstrap replicates. Gaps were treated as a fifth state and missing data were treated as
uncertainties.
Nonparametric bootstrap ML analyses were conducted on unpartitioned datasets
in GARLI v0.94 (Zwickl, 2006). GARLI applies a genetic algorithmic approach similar
to GAML (Lewis, 1998). Sequence evolution models are implemented in a manner
analogous to that conducted in PAUP* (Swofford, 2004) such that resulting log
65
likelihood scores are directly comparable to those that would be recovered in PAUP*
analyses of sufficient length. We used ModelTest v. 3.7 (Posada, Crandall, 1998) to
determine the best fit model for each gene, intron and codon position with the
hierarchical likelihood ratio test, all characters equally weighted and a Neighbor-joining
starting tree as implemented in PAUP* (Swofford, 2004). The simplest model with the
lowest Akaike information criterion (AIC) was chosen for analyses. Bootstrap runs for
ML analyses consisted of 500 pseudoreplicate heuristic searches with a GTR + I + G
model.
Models with similarly low AIC values were applied separately for each gene,
codon position and intron in MrBayes v.3.1.2 (Huelsenbeck, Ronquist, 2001) using four
Markov chains sampling every 500 generations for six million generations. For each run
the distributions of parameter sampling were visualized and burn-in periods assessed in
Tracer v.1.1 (Rambaut, Drummond, 2003). Conservative burn-in periods of 10% were
sufficient for all runs. In all cases resulting topologies were identical regardless of the
model used and therefore, the simplest model producing the most even distribution of
sampling with the greatest number of independent samples (ESS values in Tracer) was
chosen for Bayesian inference (Alfaro, Huelsenbeck, 2006).
We assessed four partitioning schemes for joint analyses of cyt-b and ND2: one
partition including both genes, one partition for each gene (two partitions), one for each
codon position (three partitions) and one for each codon position in each gene (six
partitions). Similarly, ND6 was assessed as a single partition versus three partitions each
corresponding to a different codon position. Joint analyses with the nuclear intron
forming a separate partition from the cyt-b and ND2 data were performed after the best

66
partitioning strategy was determined (see below). Parameters were allowed to vary
independently for each partition during MrBayes runs. Harmonic mean log likelihoods
for each partitioning scheme were calculated using the “sump” command in MrBayes
(Table 7). Bayes factors were calculated for each pair-wise combination of partitioning
schemes as an objective criterion for determining the best partitioning strategy for final
analyses (Brandley et al., 2005). Three independent BI analyses using the partitioning
strategy with the highest likelihood score were conducted to test for convergence on
similar likelihood scores and topologies.
Results and Discussion Sequence characteristics and phylogeny.—Numbers of parsimony informative
sites and variable but uninformative sites were 487 and 48 out of a total 1120 aligned bps
of cyt-b, 564 and 74 out of 1047 bps of ND2, 122 and 189 out of 981 bps of BF-I7, and
200 and 42 out of 519 bps of ND6. Empirical base frequencies correspond to those found
in other avian studies (mitochondria: A, ~30%; C, ~35%, G, ~10%; T ~24%; BF-I7: A =
31%; C = 17%, G =18%; T = 33%). The χ2 test of homogeneity showed no significant
nucleotide composition bias across study taxa.
Substitution saturation plots (not shown) show nearly linear increases of both
transitions and transversions, with a steeper slope for transitions than transversions,
except for third base codon positions in ND6 which show some saturation beginning at a
genetic distance of ~7%.
An insertion of three adenines was found in Accipiter nisus and A. rufiventris
directly preceding the stop codon of cyt-b. Autapomorphic indels in BF-I7 ranged from 1
to 11 base pairs (bps) in length and were found in 12 species. Parsimony informative
indels were found for Circus aeruginosus and C. ranivorus (nine bps deletion);

67
Table 7. Harmonic mean log likelihood scores for each partitioning scheme.
Partition strategy # of
partitions
Harmonic mean log
likelihood
a. mt dataset
No partitioning: (cyt-b + ND2) 1 -30987.72
Gene: (cyt-b), (ND2) 2 -30924.55
Codon position: (cyt-b & ND2 codon 1), (cyt-b &
ND2 codon 2), (cyt-b & ND2 codon 3)
3 -29934.30, -
29946.06, -29937.33
Gene and codon position: (cyt-b codon 1), (cyt-b
codon 2), (cyt-b codon 3), (ND2 codon 1), (ND2
codon 2), (ND2 codon 3)
6 -30049.61
b. ND6 dataset
No partitioning: (ND6) 1 -4936.33
Codon position: (ND6 codon 1), (ND6 codon 2),
(ND6 codon 3)
3 -4767.79, -4767.92, -
4768.40
68
C. aeruginosus, C. ranivorus, A. bicolor, A. cirrocephalus, A. cooperii and A. rufiventris
(one bp deletion), and an insertion for five of these species (one bp not shared by A.
cirrocephalus). Leptodon cayanensis, Rostrhamus sociabilis, Geranospiza caerulescens,
Leucopternis schistaceus, Harpyhaliaetus solitarius, and all four Buteogallus species
share a two bp deletion of TG or GT; and, all four Buteogallus species, H. solitarius and
L. schistaceus share a two bp deletion. Due to ambiguity in the DNA sequence it could
not be determined if the two bp deletion (TG or GT) described above was synapomorphic
for all nine sampled individuals so the two bases were excluded from the analyses for all
species. Missing data comprised <10 bps for all individuals except for in cyt-b for three
individuals: Butastur indicus (216 missing bases), Leucopternis p. princeps (308 missing
bases) and Buteogallus aequinoctialis (569 missing bases). No significant difference in
topology or likelihood was found between analyses of the mt dataset with and without
these sequences; thus, mt analyses shown here include them.
Separate phylogenetic analyses of BF-I7 (not shown) produced a less resolved
tree than the other analyses. The relationships among major accipitrid clades were
recovered with high support values (Bayesian posterior probability [bpp]=1.00-0.97) as
were most sister relationships; however, the branching pattern within the Buteoninae was
not resolved beyond finding three separate clades for the buteonine kites and
Geranospiza, the Buteogallus species sister to Leucopternis schistaceus and all other
Buteoninae (bpp=0.99). Also, the position of Buteo/Rupornis magnirostris was
unresolved. Separate analyses of cyt-b and ND2 also produced trees with several
Buteoninae polytomies: (1) a polytomy of three clades: Busarellus, Geranospiza,
Leucopternis princeps, L. plumbeus, B./Percnohierax leucorrhous and Parabuteo

69
unicinctus; the kites; and the Buteogallus species, Harpyhaliaetus species and L.
schistaceus and L. lacernulatus; and (2) a polytomy of the three remaining buteonine
clades (clades diverging after node A in Fig. 3 described below). There were two main
differences between the separate ND2 and cyt-b analyses: (1) B./R. magnirostris
diverged before all of the other Buteoninae in the cyt-b analyses (bpp=1.00) but in the
ND2 analyses was part of an unresolved polytomy with B./P. leucorrhous, Parabuteo
unicinctus and a clade containing the later-diverging Buteoninae (species diverging after
node A in Fig. 3 described below, bpp=0.98); and (2) in cyt-b analyses the Butastur
species were part of a five-way polytomy with Kaupifalco, a clade of goshawks (genera
Melierax, Micronisus and Urotriorchis), a clade of accipiters and harriers (genus Circus),
and a clade of sea eagles and buteonines (bpp=1.00), while in the ND2 analyses the
Butastur species were sister to the Ictinia species (bpp=0.74). Since single-locus
analyses produced overall very similar topologies, we performed joint analyses of cyt-b
and ND2 and cyt-b, ND2 and BF-I7.
Three datasets were assembled. The “mt” dataset included 2066 aligned (i.e.
including indels) base pairs (bps) of mitochondrial DNA (1020 bps cyt-b and 1046 bps
nd2) from 105 Accipitridae individuals representing 76 named species. The “mt + bf”
dataset included 3048 bases of aligned combined mitochondrial and nuclear data (the mt
dataset appended to 981 bases of BF-I7) for 73 accipitrid taxa representing 56 nominal
species. The “ND6” dataset included 519 aligned bases of ND6 for 110 taxa representing
47 nominal species.
For the mt dataset the first codon position was modeled by HKY + I + G and the
second and third codon positions were modeled by GTR + I + G. The mt + bf dataset had

70
four independent partitions: the three mitochondrial partitions described above and a
separate partition for BF-I7 using the GTR + G model. For the ND6 dataset the first and
third positions were modeled with GTR + G; the second codon position was modeled
with HKY + G.
Bayesian consensus trees are shown in Figure 3a for the mt dataset, Figure 3b for
the mt + bf dataset and Figure 4 for the ND6 dataset. Posterior probabilities (averages
from three independent Bayesian analyses) and MP and ML bootstrap values are shown
on the figures. The three different types of analyses produced largely congruent
topologies, with the few differences involving nodes resolved with low support in the BI
analyses and not resolved in the MP or ML analyses. For instance, the branching pattern
of the buteonine kites and Geranospiza were unresolved in MP and ML runs and
supported by low posterior probabilities in Bayesian analyses (bpp=0.51-0.77).
Nodes were supported with bpp ≥ 0.90 for 85% of mt and mt + bf nodes.
Analyses resolved nearly all nodes in the mt + bf analyses with higher bpp values than
with the mt dataset alone, potentially a result of the larger number of base pairs in the mt
+ bf dataset. For example, the placement of Buteo/Rupornis magnirostris and B. lineatus
were unresolved in the Bayesian analyses of the mt dataset but were resolved in the mt +
bf analyses with high support (bpp=0.96 and 0.98 respectively).
The phylogeny recovered in analyses of the ND6 dataset (Fig. 4) largely agrees
with the topologies in Figure 3 except for a polytomy of deeper divergences within and
directly preceding the Buteoninae (i.e. placement of Haliaeetus, Busarellus, Geranospiza
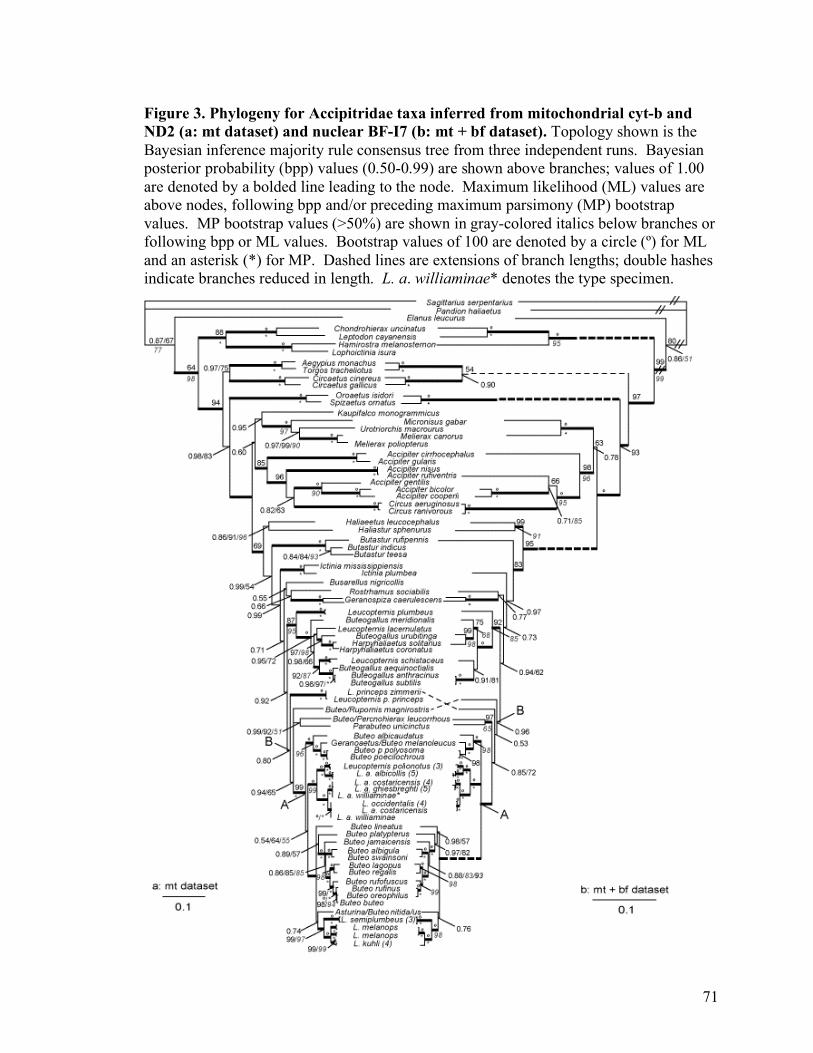
71
Figure 3. Phylogeny for Accipitridae taxa inferred from mitochondrial cyt-b and ND2 (a: mt dataset) and nuclear BF-I7 (b: mt + bf dataset). Topology shown is the Bayesian inference majority rule consensus tree from three independent runs. Bayesian posterior probability (bpp) values (0.50-0.99) are shown above branches; values of 1.00 are denoted by a bolded line leading to the node. Maximum likelihood (ML) values are above nodes, following bpp and/or preceding maximum parsimony (MP) bootstrap values. MP bootstrap values (>50%) are shown in gray-colored italics below branches or following bpp or ML values. Bootstrap values of 100 are denoted by a circle (º) for ML and an asterisk (*) for MP. Dashed lines are extensions of branch lengths; double hashes indicate branches reduced in length. L. a. williaminae* denotes the type specimen.

72
Figure 4. Phylogeny for Accipitrid taxa inferred from ND6 sequences.Topology shown is the Bayesian inference majority rule consensus tree from three independent runs. Bayesian posterior probability (bpp) values (0.50-0.99) are shown above branches and values of 1.00 are denoted by a bolded line leading to the node. Maximum likelihood (ML) values are above nodes, following bpp and/or preceding maximum parsimony (MP) bootstrap values. MP bootstrap values (>50%) are shown in gray-colored italics below the branches or following bpp or ML values. Bootstrap values of 100 are denoted by a circle (º) for ML and an asterisk (*) for MP analyses.

73
and Butastur) which likely results from increased substitution saturation for this gene
among older divergences. Within the Buteoninae the positions of Leucopternis princeps,
L. plumbeus, Buteo p. platypterus and Asturina nitida/B. nitidus were unresolved. The
ND6 analyses differ from the mt analyses in that they recover a sister relationship
between L. lacernulatus and Buteogallus meridionalis and show an earlier but unresolved
divergence of B. platypterus. This could reflect differences in taxon sampling between
the analyses, differences between samples of L. lacernulatus (ND6 sequence from do
Amaral et al. 2006) or differences in their molecular evolution, given that ND6 is the
only mitochondrial protein-coding gene encoded by the light strand. Our ND6 analyses
were concordant with previous studies (do Amaral et al., 2006; Riesing et al., 2003b)
except that we found a sister relationship between B. r. rufinus (not B. auguralis as in fig
2 of Riesing et al., 2003b, MP bootstrap=83, Neighbor-joining support=82) and a clade
containing B. brachypterus and B. j. japonicus (bpp=0.90, Fig. 4). Other differences
between our analyses and those of Riesing et al. (2003b) involve nodes supported by
bootstrap values <50% in their figures.
Old World Taxa (Kaupifalco and Butastur) and Accipiter.—Three species of
Butastur form a monophyletic group (bpp=1.00, Figs. 3a and 3b) diverging after the sea
eagles but before the other sub-buteos, in a clade that is not closely related to Kaupifalco.
By including representatives from each previously identified clade or subfamily of
Accipitridae and expanding sampling of harriers, accipiters and goshawks, we found that
Kaupifalco is sister to a clade including Melierax, Micronisus and Urotriorchis
(bpp=0.95, Fig. 3a) and sister to an Accipiter when the goshawks and other non-
Buteonine genera were not included (bpp=0.64, Fig. 4). Kaupifalco and Butastur, both
74
described as sub-buteos by Amadon in 1982, were later removed from the group by
Amadon and Bull (1988). Kaupifalco was removed based on observations by Kemp that
the “voice and habits” of Kaupifalco are more similar to Melierax than to sub-buteos.
Amadon and Bull also removed Butastur from Buteoninae at the same time emphasizing
its similarity to Kaupifalco. Our results confirm that Kaupifalco is indeed more closely
related to Melierax than to sub-buteos but show that Butastur is more closely related to
the sub-buteos than to the clade containing Kaupifalco and Melierax. Therefore, of the
two Old World genera, we find support only for Butastur as a buteonine genus.
With this expanded sampling, we also found non-monophyly of the genus
Accipiter when Circus species are included. In the mt dataset two Circus species are
nested within a clade of seven Accipiter species (bpp=0.82, Fig. 3a) or three accipiters
(bpp=1.00, Fig. 3b). This finding of Circus nested within the larger Accipiter clade, has
not been previously published as far as we know. Earlier studies including both genera,
based on smaller sets of taxa and characters with less detailed searches, did not find
Accipiter polyphyly, but indicated their reciprocal monophyly and a close but non-sister
relationship instead (Wink, Sauer-Gurth, 2004; Wink, Seibold, 1996). Our finding of
Accipiter polyphyly is also supported in analyses with greater sampling of species in both
genera that are part of a larger consideration of Accipitridae (in preparation).
Black-collared hawk (Busarellus nigricollis).— Busarellus diverges early within the
Buteoninae, after a clade of Butastur species and sister to Geranospiza and Rostrhamus
with low support in the mt analyses (bpp=0.55, Fig. 3a) or unresolved with respect to
Butastur, Geranospiza and Haliaeetus (bpp=0.95, Fig. 4). Previously proposed sister
groups for Busarellus include milvine kites and sea eagles (Olson, 1982; Ridgway, 1876),

75
sub-buteos Buteogallus and Parabuteo (Brown, Amadon, 1968) or Hieraaetus and
Polemaetus (Holdaway, 1994). We did not find a well-supported close sister relationship
for Busarellus here, but did confirm its position within Buteoninae.
Relationships among and within New World Buteoninae genera.— Divergence of
Ictinia follows that of the sea eagles and the genus Butastur (bpp=0.99, 0.97, Fig. 3).
Rostrhamus is sister to Geranospiza but with low support (bpp=0.66, 0.77, Fig. 3). With
nearly complete sampling in Buteogallus and Leucopternis, we confirmed their non-
monophyly (do Amaral et al., 2006; Lerner, Mindell, 2005). Both L. schistaceus and L.
plumbeus had been placed in the genus Urubitinga (Ridgway, 1876; Sharpe, 1874), now
synonymous with Buteogallus (AOU, 1988; Peters, 1931), based on morphological
similarities with B. anthracinus and B. urubitinga. Here we find that these two
Leucopternis species are indeed more closely related to Buteogallus species than to other
Leucopternis species, however they are not sister taxa as proposed (Amadon, 1982a).
The clade including some Leucopternis, all Buteogallus and both Harpyhaliaetus
species shows a well-supported split between species that are dependent on aquatic
habitats such as mangroves, marshes, forest and wetlands (B. aequinoctialis, B.
anthracinus, B. subtilis and L. schistaceus) and mostly forest or open-vegetation habitats
(L. lacernulatus, B. urubitinga, H. solitarius and H. coronatus, Fig. 2, bpp=0.98, 1.00,
Ferguson-Lees, Christie, 2001).
Leucopternis species are members of four different non-sister clades within the
Buteoninae (Fig. 3, two species unresolved in Fig. 4). We found that L. princeps is more
closely related to a large clade of Buteo and other Leucopternis taxa (bpp=0.80, 0.53 Fig.
3; unresolved in Fig. 4) than to a clade of Buteogallus, Harpyhaliaetus and Leucopternis

76
(figure 1 bpp=0.68, bootstrap=58, do Amaral et al., 2006). The lack of resolution for L.
princeps in Fig. 4 and the difference between Fig. 3 and the results of do Amaral et al.
(2006) likely reflect differences in the size and informativeness the datasets.
Genetic divergence among Buteogallus subtilis, B. anthracinus and B.
aequinoctialis.—The Mangrove Black Hawk (B. subtilis) and Common Black Hawk (B.
anthracinus) individuals we sampled had identical BF-I7 sequence, only one base pair
difference in cyt-b and another single difference in ND2, while the Rufous Crab-hawk (B.
aequinoctialis) was different from both of these species at 20 mitochondrial bases (2%
csd). B. subtilis has been considered a subspecies of B. anthracinus and a member of a
superspecies with B. aequinoctialis (Brown, Amadon, 1968). Given that these three taxa
are distributed in adjacent and sometimes overlapping ranges in similar habitat on the
Atlantic and Pacific coasts and islands of the New World tropics, potential for
interbreeding exists and broader geographic sampling is needed before taxonomic
revisions can be made.
Non-monophyly of nominal White Hawk subspecies (Leucopternis albicollis).—
We sampled two to five (average=4) individuals from the broad geographic range of each
White Hawk subspecies, the Grey-backed Hawk (L. occidentalis) and Mantled Hawk (L.
polionotus; Figure 5). The White Hawk was not monophyletic, with the nominate form
(L. a. albicollis) more closely related to L. polionotus than to other L. albicollis
subspecies (bpp=1.00, Fig. 3; bpp=0.60, Fig. 4). L. a. albicollis individuals are 2.3% (mt
csd) divergent from L. polionotus individuals, a value similar to that found for other
Accipitrid sister taxa (0.5-3.8% csd among Gyps species, Johnson et al., 2006; 95-98%
sequence similarity for booted eagles, Lerner, Mindell, 2005).

77
Figure 5. Geographical distribution of White Hawk (Leucopternis albicollis) and related taxa. Compiled from published descriptions and maps (Ferguson-Lees, Christie, 2001; Hilty, 2003; Hilty, Brown, 1986; Howell, Webb, 1995; BirdLife International, 2004; Jones, 2003; Land, 1970; Monroe, 1968; Sick, 1993; Slud, 1964; Thurber et al., 1987; Wetmore, 1965).
L. occidentalis
L. polionotus
L. a. albicollis
L. a. costaricensis
L. a. ghiesbreghti
L. a. williaminae
L. occidentalis
L. polionotus
L. a. albicollis
L. a. costaricensis
L. a. ghiesbreghti
L. a. williaminae

78
The three trans-Andean (i.e. west of the Andean cordillera) subspecies of L.
albicollis and L. occidentalis share mt haplotypes (Fig. 3a) and exhibit gradation of
plumage coloration from nearly all white birds in the north (L. a. ghiesbreghti) to heavy
black coloration on the heads and wings of southern birds (L. occidentalis; Lerner, Klaver
and Mindell, unpublished). Individuals from the most northern subspecies, L. a.
ghiesbreghti, formed a clade sister to representatives of L. occidentalis, the most southern
species; however, individuals from two White Hawk subspecies occurring in the center of
the trans-Andean range for these taxa (L. a. costaricensis and L. a. williaminae from
southern Central America and northern South America) were found in both clades. The
subspecies L. a. williaminae has a very small range and is known from only a few
museum specimens (the type specimen is denoted by “*” after the name on Fig. 3). The
two clades identified in trans-Andean birds do not strictly correspond to current
taxonomy, geography or plumage coloration. These clades diverge by an average 1.2%
(mt csd), which is similar to but on the low end of that observed between other
Accipitridae sister species pairs (Johnson et al., 2006; Lerner, Mindell, 2005). Members
of the trans-Andean clades differ from their sister clade containing L. a. albicollis and L.
polionotus by 4.4% (average mt csd).
Analyses with greater sampling of individuals are needed, however, the current
set of relationships based on mitochondrial data (Figs. 3a and 4 but not Fig. 3b) support
L. a. albicollis being recognized as L. albicollis and L. a. costaricensis, L. a.
ghiesbreghti, and L. a. williaminae as one or more distinct species. Four to six
endangered Grey-backed Hawks (L. occidentalis) form a monophyletic (Fig. 4) or
unresolved group nested within a clade of L. a. costaricensis, L. a. ghiesbreghti, and L.

79
williaminae individuals (Fig. 3). None of these clades were recovered with nuclear intron
data alone. This may reflect differences in expected coalescence times among maternally
versus biparentally inherited loci, especially if these divergences are recent and/or the
effective population sizes are large (Hudson, 1990). Using more variable loci, additional
specimens and population genetic methods could help in further taxonomic assessment
and to distinguish between alternative hypotheses such as incipient speciation, secondary
contact or isolation by distance for this clade. Given the status of the small and isolated
populations of L. occidentalis, such analyses could be useful for conservation programs..
Genetic divergence between Leucopternis kuhli and L. melanops.— White-
browed Hawks (L. kuhli) and Black-faced Hawks (L. melanops) are similar in
appearance and are considered separate but closely related species (Amadon, 1982b;
Hellmayr, Conover, 1949). There were no shared mt or BF-I7 haplotypes between the
species and with mt data they are 1.8% divergent from each other. The polytomy in
Figure 3a, however, precludes strong conclusions in this regard. The four L. melanops
individuals are nearly as divergent from each other as they are from L. kuhli individuals,
with 1.4% average csd, while the average csd among four conspecific L. kuhli individuals
is 0.56%. Using the more variable ND6 dataset plus additional pseudo control region
sequence, two L. melanops individuals from Peru are 0.24% divergent from each other,
and on average 2.04% divergent from a Peruvian L. kuhli. These values are similar to but
on the low end of those found between other closely related Accipitridae species (see
above).
Although originally described as allopatric, potential for hybridization exists as
individuals of L. melanops have been trapped simultaneously with L. kuhli south of the

80
Amazon river (Olalla collections of 1930 at the American Museum of Natural History
[AMNH], and recent trappings described in Barlow et al., 2002). The two species,
however, appear identifiable by plumage: about 20 specimens of each species examined
at the AMNH were distinct in plumage with no intermediate plumage types observed.
Given the high level of genetic diversity within L. melanops, the lack of resolution of the
mitochondrial dataset and potential for hybridization, further analysis of these two
species or “superspecies” is warranted.
Phylogeny and taxonomy of the genus Buteo.— In Figure 3 all members of the
nominal genus Buteo diverge after the node labeled “B.” Following the early divergence
of L. princeps and B./R. magnirostris, a sister relationship between B./Percnohierax
leucorrhous and Parabuteo unicinctus is supported (bpp=0.99, 1.00, Fig. 3; bpp=0.82,
Fig. 4). The remaining Buteo species fall into two clades: (1) B. albicaudatus,
Geranoaetus melanoleucus, B. poecilochrous and B. polyosoma and (2) all others (11
species in Fig. 3, 18 species in Fig. 4). The positions of B. lineatus, Asturina nitida/Buteo
nitidus and B. jamaicensis have not been resolved or well-supported previously (nodes III
[MP bootstrap=58, Neighbor-joining support=90] and IV [support values <50] in Riesing
et al., 2003b). In Figure 3 we find that the divergence of B. lineatus (bpp=0.98, Fig. 3b)
is followed by that of B. platypterus (bpp=0.97, Fig. 3b), and Asturina nitida/B. nitidus is
more closely related to several species of Leucopternis than to these two Buteo species
(bpp=0.74, 0.76, Fig. 4; node III in Riesing et al. 2003). We also find that divergence of
B. jamaicensis (bpp=1.00, Fig. 3) is followed by divergence of the sister species B.
albigula and B. swainsonii (bpp=1.00, 0.88, Fig. 3; bpp=0.65, Fig. 4). Within the
Buteoninae we find that earlier divergences correspond to taxa with New World

81
distributions followed by the sister pair of Nearctic B. regalis and circumpolar B. lagopus
(bpp=1.00, Figs. 3 and 4) and all Old World taxa diverging last (Figs. 3 and 4; see also
Riesing et al. 2003).
We support the idea that taxonomy should reflect phylogeny. In that spirit, one
proposal for redefinition of the genus Buteo includes all species descended from node A
(Figs. 2 and 3 and in Riesing et al., 2003b). With the dataset used by Riesing et al.
(2003) this proposal would have required changing the generic names for three species
(Asturina nitida to Buteo nitidus, B. magnirostris to Rupornis magnirostris and B.
leucorrhous to Percnohierax leucorrhous). Delimiting the genus Buteo at node A of Fig.
3 in our analyses would require changing the generic names for an additional six species
of Leucopternis as well as for Geranoaetus. We suggest, however, that delimiting Buteo
earlier in the tree at node B (Fig. 3) is preferable, comprising a single clade including all
current members of the genus Buteo sampled in both studies, and involving a change in
genus name for two more species (Parabuteo unicinctus and L. princeps).
Acknowledgements.
This manuscript was accepted for publication in the Auk (Lerner, Mindell, in press,
2008). Our sincere thanks to specimen collectors, curators and museum staff for
providing samples (see Table 5) and we particularly thank D. Whitacre, N. Rice, M.
Watson, D. Susanibar, J. Antonio, O. Beingolea, A.V. Benavides, N. Benavides, R. Luna,
and J. Hendriks. R.B. Payne, D. Lahti, N. David and A. Peterson clarified nomenclatural
issues. J. Johnson, M. Bunce and J. Brown provided valuable expertise on laboratory
techniques or data analysis. R.B. Payne, C. Dick, L. Kiff, two anonymous reviewers and
R. Brumfield provided helpful comments on the manuscript. This research was

82
supported by grants from the University of Michigan (UM) Museum of Zoology, UM
Department of Ecology and Evolutionary Biology, UM Rackham Graduate School, UM
Latin American and Caribbean Studies Program, NIH (support for HRLL), UM-LSA
Whittaker Grant for Undergraduate Education (support for MK) and NSF (DM).

83
References Alfaro, M. E., and J. P. Huelsenbeck. 2006. Comparative performance of Bayesian and
AIC-based measures of phylogenetic model uncertainty. Systematic Biology 55:89-96.
Amadon, D. 1982a. A revision of the sub-buteonine hawks (Accipitridae, Aves). American Museum of Novitates 1741:1-20.
Amadon, D. 1982b. A revision of the sub-buteonine hawks (Accipitridae, Aves). American Museum Novitates 1741:1-20.
Amadon, D., and J. Bull. 1988. Hawks and owls of the world. Proceedings of the Western Foundation of Vertebrate Zoology 3:295-357.
AOU. 1988. Checklist of North American Birds, 7 ed. American Ornithologists’ Union, Washington, D.C.
Baillie, J. E. M., C. Hilton-Taylor, and S. N. Stuart, Eds. 2004. IUCN Red List of Threatened Species: A Global Species Assessment. IUCN, Cambridge, UK.
Barlow, J., T. Haugaasen, and C. Peres. 2002. Sympatry of the Black-faced Hawk Leucopternis melanops and the White-browed Hawk Leucopternis kuhli in the Lower Rio Tapajós, Pará, Brazil. Cotinga 18:77-79.
Brandley, M., A. Schmitz, and T. Reeder. 2005. Partitioned Bayesian Analyses, Partition Choice, and the Phylogenetic Relationships of Scincid Lizards. Systematic Biology 54:373-390.
Brown, L. H., and D. Amadon. 1968. Eagles, hawks and falcons of the world. Country Life Books, London.
Cooper, R. A., and H. N. Poinar. 2000. Ancient DNA: Do it right or not at all. Science 289:1139.
David, N., and M. Gosselin. 2002. Gender agreement of avian species names. Bulletin of the British Ornithologists' Club 122:14-49.
Dickinson, E. C., Ed. 2003. The Howard and Moore Complete Checklist of the Birds of the World, 3 ed. Christopher Helm, London.
do Amaral, F., M. Miller, L. Silveira, E. Bermingham, and A. Wajntal. 2006. Polyphyly of the hawk genera Leucopternis and Buteogallus (Aves, Accipitridae): multiple habitat shifts during the Neotropical buteonine diversification. BMC Evolutionary Biology 6:10.
Ferguson-Lees, J., and D. A. Christie. 2001. Raptors of the World. Christopher Helm, London.
Friedmann, H. 1950. The Birds of North and Middle America. Part XI. Cathartidae to Falconidae. Volume 50. Smithsonian Institution, Washington D.C.
Grossman, M., and J. Hamlet. 1964. Birds of prey of the world. Bonanza Books, New York.
Hall, T. A. 1999. BioEdit: a user-friendly biological sequence alignment editor and analysis program for Windows 95/98/NT. Nucleic Acids Symposium Series 41:95-98.
Hellmayr, C. E., and B. Conover. 1949. Catalogue of Birds of the Americas. Falconiformes. XIII: Part 1, No.4. Field Museum of Natural History Zoological Series.
Hilty, S. L. 2003. Birds of Venezuela. Christopher Helm, London.

84
Hilty, S. L., and W. L. Brown. 1986. A guide to the birds of Colombia. Princeton University Press, Princeton.
Holdaway, R. N. 1994. An exploratory phylogenetic analysis of the genera of the Accipitridae, with notes on the biogeography of the family. Pages 601-649 in Raptor Conservation Today (B.-U. Meyburg, and R. D. Chancellor, Eds.). World Working Group on Birds of Prey and Owls, London.
Howell, S. N. G., and S. Webb. 1995. A guide to the birds of Mexico and northern Central America. Oxford University Press, New York.
Hudson, R. R. 1990. Gene genealogies and the coalescent process. Pages 1-44 in Oxford surveys in evolutionary biology, vol. 7 (D. Futuyma, and J. Antonovics, Eds.). Oxford University Press, New York.
Huelsenbeck, J. P., and F. Ronquist. 2001. MR BAYES: Bayesian inference of phylogenetic trees. Bioinformatics 17:754-755.
International, B. 2004. Species factsheet: Leucopternis occidentalis. vol. 2005. Johnson, J. A., H. R. L. Lerner, P. C. Rasmussen, and D. P. Mindell. 2006. Systematics
within Gyps vultures: a clade at risk. BMC Evolutionary Biology 6. Jones, H. L. 2003. Birds of Belize, 1 ed. University of Texas Press, Austin. Kumar, S., K. Tamura, I. B. Jakobsen, and M. Nei. 2001. MEGA2: Molecular
evolutionary genetics analysis software. Bioinformatics 17:1244-1245. Land, H. C. 1970. Birds of Guatemala. Livingston Publishing Company, Wynnewood. Lerner, H. R. L., and D. P. Mindell. 2005. Phylogeny of eagles, Old World vultures, and
other Accipitridae based on nuclear and mitochondrial DNA. Molecular Phylogenetics and Evolution 37:327–346.
Lerner, H. R. L., and D. P. Mindell. in press, 2008. Molecular phylogenetics of the buteonine birds of prey (Aves: Accipitridae). The Auk.
Lewis, P. 1998. A genetic algorithm for maximum-likelihood phylogeny inference using nucleotide sequence data. Molecular Biology and Evolution 15:277-283.
Monroe, B. L. J. 1968. A distributional survey of the birds of Honduras. Ornithological Monographs 7.
Olson, S. L. 1982. The distribution of fused phalanges of the inner toe in the Accipitridae. Bulletin of the British Ornithologists' Club 102:8-12.
Peters, J. L. 1931. Check-List of Birds of the World. Harvard University Press, Cambridge.
Posada, D., and K. A. Crandall. 1998. Modeltest: testing the model of DNA substitution. Bioinformatics 14:817-818.
Prychitko, T. M., and W. S. Moore. 2000. Comparative evolution of the mitochondrial cytochrome b gene and nuclear beta-fibrinogen intron 7 in woodpeckers. Molecular Biology and Evolution 17:1101-1111.
Rambaut, A., and A. J. Drummond. 2003. Tracer. http://evolve.zoo.ox.ac.uk/, Oxford. Ridgway, R. 1876. Studies of the American Falconidae. Bulletin of the U.S. Geological
and Geographic Survey Territories 2:91-182. Riesing, M. J., L. Kruckenhauser, A. Gamauf, and E. Haring. 2003. Molecular phylogeny
of the genus Buteo (Aves: Accipitridae) based on mitochondrial marker sequences. Molecular Phylogenetics and Evolution 27:328-342.
Sharpe, R. B. 1874. Catalogue of Birds in the British Museum. Sick, H. 1993. Birds in Brazil. Princeton University Press, Princeton.

85
Slud, P. 1964. The birds of Costa Rica: distribution and ecology. Bulletin of the American Museum of Natural History 128:63.
Sorenson, M. D., J. C. Ast, D. E. Dimcheff, T. Yuri, and D. P. Mindell. 1999. Primers for a PCR-Based Approach to Mitochondrial Genome Sequencing in Birds and Other Vertebrates. Molecular Phylogenetics and Evolution 12:105-114.
Swofford, D. L. 2004. PAUP*: Phylogenetic analysis using parsimony (* and other methods. Sinauer, Sunderland, Mass.
Tamura, K., and M. Nei. 1993. Estimation of the number of nucleotide substitutions in the control region of mitochondrial DNA in humans and chimpanzees. Molecular Biology and Evolution 10:512-526.
Thiollay, J. M. 1994. Family Accipitridae (Hawks and Eagles). Pages 52-205 in Handbook of the Birds of the World, vol. 2: New World Vultures to Guineafowl (J. del Hoyo, A. Elliott, and J. Sargatal, Eds.). Lynx Ediciones, Barcelona.
Thurber, W. A., J. F. Serrano, A. Sermeno, and M. Benitez. 1987. Status of uncommon and previously unreported birds of El Salvador. Western Foundation of Vertebrate Zoology 3:161.
Wetmore, A. 1965. The birds of the republic of Panama. Part 1.--Tinamidae (Tinamous) to Rynchopidae (Skimmers).
Wink, M., and H. Sauer-Gurth. 2004. Phylogenetic Relationships in Diurnal Raptors based on nucleotide sequences of mitochondrial and nuclear marker genes. Pages 483-504 in Raptors Worldwide (R. D. Chancellor, and B.-U. Meyburg, Eds.). World Working Group on Birds of Prey and Owls, Berlin.
Wink, M., and I. Seibold. 1996. Molecular phylogeny of Mediterranean raptors (families Accipitridae and Falconidae). Pages 335-344 in Biology and Conservation of Mediterranean raptors, vol. Monografia 4 (J. Muntaner, and J. Mayol, Eds.). SEO/BirdLife, Madrid.
Xia, X. 2000. Data analysis in molecular biology and evolution. Kluwer Academic Publishers, Boston.
Zwickl, D. J. 2006. GARLI, Genetic Algorithm for Rapid Likelihood Inference. www.bio.utexas.edu/grad/zwickl/web/garli.html.
86
Chapter 4
Genetic divergence among Harpy eagles (Harpia harpyja) in Central America and South America
Top predators play a crucial role in maintaining the trophic interactions of
terrestrial systems (e.g. Gutiérrez et al., 1997; Letourneau, Dyer, 1998a; Letourneau,
Dyer, 1998b; Strong et al., 2000; Van Bael et al., 2003). In particular, vertebrate
carnivores have the strongest direct effects on herbivores and strongest indirect effects on
limiting plant damage (Schmitz et al., 2000). These “top-down” effects have been studied
in a Venezuelan tropical forest where the construction of a hydroelectric dam formed a
giant lake, Lago Guri that isolated and fragmented once-continuous tropical forest habitat
into a series of islands where vertebrate top-predators were excluded. In the absence of
predators such as harpy eagles (Harpia harpyja), jaguars and pumas (Felis concolor), the
Lago Guri islands have experienced population explosions of one or more different
herbivores and seed predators including howler monkeys, iguanas, rodents and ants
(Lopez et al., 2005; Terborgh et al., 2001). These islands in turn show vast reductions in
plant species diversity including an 80% reduction in the recruitment of canopy trees
(Terborgh et al., 2006). Similarly, while bird density increased, diversity decreased
(Terborgh et al., 1997).
The dramatic alterations of the Lago Guri islands provide a glimpse of the potential
future for Neotropical forests as populations of many top predators decline. Harpy eagles
are the largest extant birds of prey in the New World feeding on sloths, monkeys and
87
other arboreal mammals of lowland rainforests (Eason, 1989; Fowler, Cope, 1964; Rettig,
1977; Rettig, 1978). Their current distribution spreads from southern Mexico to east-
central Brazil (del Hoyo et al., 1994), however destruction of rain forest habitat,
particularly extensive in Central America (FAO, 2006), has fragmented their distribution
and has likely contributed to local extinctions throughout their range (del Hoyo et al.,
1994; Vargas et al., 2006).
As with other Neotropical top-predators such as jaguars (Panthera onca), ocelots
(Leopardus pardalis) and margays (L. wiedii), harpy eagle population reductions are
attributed to slow rates of reproduction, dependence on high-quality rainforest habitat and
human persecution (Collar et al., 2001; Eizirik et al., 1998; Eizirik et al., 2001). The
World Conservation Union lists the harpy eagle as near-threatened (IUCN, 2006) and
conservation programs are underway in many Latin American countries. Since genetic
diversity is important for the persistence of populations (Frankham, 2005; Reed,
Frankham, 2003; Spielman et al., 2004), estimates of genetic variability and demographic
parameters for species threatened with extinction are valuable for conservation efforts
(O'Brien, 1994).
In this study we use coalescent and phylogenetic based analyses and quantitative test
statistics of molecular sequence data to reconstruct the population demographic history of
the harpy eagle. In particular, we quantify levels of genetic diversity, assess the
possibility of gene flow among geographic populations, and estimate relative effective
population sizes using mitochondrial control region sequence data from harpy eagles
collected from a broad geographic range across 12 Neotropical countries.
88
Methods Samples.—Harpy eagle samples were collected from all of the South American and most
Central American countries where they have not been extirpated (Table 8). Because of
the larger area of intact rain forest habitat in Panama as compared to other Central
American countries and the availability of samples from collaborators associated with
The Peregrine Fund, Panamanian samples dominate the Central American dataset. The
majority of samples are from contemporary specimens collected after 1960; however, ten
specimens were collected between 1902 and 1938 and one sample was collected in 1868.
The samples obtained from museum collections were used to represent geographic areas
where harpy eagles have been extirpated (e.g., Mexico) or from countries where the
current export of tissue samples is difficult (e.g., Brazil)., The Crested Eagle (Morphnus
guianensis), the sister species to the harpy eagle (see Lerner & Mindell 2005), was
included as an outgroup for the phylogenetic analyses.
DNA sequences.—DNA was extracted from blood, feathers, and organ tissues using a
DNeasy Extraction Kit (QIAGEN Inc.), with 30 µl of 100 ng/ml dithiothreitol (DTT)
added to the extraction buffer when working with feathers. DNA extraction from
museum toe pads was performed as described in Lerner and Mindell (2005) and
conducted in a facility reserved for ancient DNA work at the University of Michigan
Museum of Zoology using protocols developed for ancient DNAs including negative
extraction and blank amplification controls (Cooper, 1994; Gilbert et al., 2005).

89
Table 8. Sample information for harpy eagles (Harpia harpyja) and one outgroup (Morphnus guianensis) analyzed in this study.
Source name1/ Cat. No. Collection
Date Collection Locality
Tissue Type
Bell-07 1994 Venezuela Liver WFVZ 10471 1962 Mexico Feather TPF Freedom 1997 Unknown Blood TPF 94SD 1997 Colombia Blood TPF 0952 1997 Ecuador Blood TPF GBGrey 1997 Venezuela Blood TPF FRBL 1997 Panama Blood TPF CHEY 1997 Unknown Blood TPF CRAWL 1997 Venezuela Blood TPF COCA 1997 Ecuador Blood TPF OLIVA 1997 Venezuela Blood TPF OLAFA 1997 Ecuador Blood TPF MilZoo 1997 Ecuador Blood WFVZ 001 1999 Guyana Feather WFVZ 002 1999 Guyana Feather LSUMZ 111050 1982 Peru Feather TPF HE-021 2004 Panama Blood TPF 008 2004 Panama Blood TPF HE-018 2003 Panama Blood UMMZ 239465 2003 Panama Blood TPF 020 2004 Panama Blood TPF HE-015 2004 Panama Toepad TPF HE-016 2003 Panama Toepad TPF HE-007 2004 Panama Feather TPF HE-01 2004 Panama Feather TPF HE-017 2004 Panama Feather TPF HE-014 2004 Panama Feather TPF HE-010 2004 Panama Feather TPF HE-001 2003 Panama Feather TPF CRE-005 2002 Panama Feather TPF HE-013 2004 Panama Feather TPF HE-012 2004 Panama Feather TPF HE-006 2003 Panama Feather TPF HE-003 2002 Panama Feather TPF HE-008 2004 Panama Feather TPF HE-004 unknown Panama Feather TPF HE-002 2002 Panama Feather TPF HE-009 2003 Panama Feather UMMZ 239466 2005 Panama Tissue UMMZ BD-8225 2005 Panama Tissue

90
UMMZ 239471 2005 Panama Tissue UMMZ PAN-01 2003 Ecuador Feather SDZ 402158 2004 Unknown3 Feather SB 2003 Guyana Feather KUNH 24802 unknown Mexico Toe pad FMNH 260141 1964 Surinam Toe pad FMNH 264326 1965 Surinam Toe pad FMNH 371026 1977 Ecuador Toe pad FMNH 104888 1938 Guyana Stomach Contents FMNH 32150 unknown Guyana Toe pad USNM 54224 1868 Mexico Toe pad USNM 193559 1902 Nicaragua Toe pad USNM 253473 1917 Brazil Toe pad JMM-A-3224 1960 Guyana Toe pad MCZ 58503 Costa Rica Toe pad ROM 94251 1963 Guyana Toe pad LSUMZ 31239 1963 Peru Toe pad LSUMZ 35120 1964 Peru Feather LSUMZ B-51351 1963 Peru Toe pad LSUMZ B-51352 1963 Peru Toe pad LSUMZ 51268 1946 Bolivia Toe pad AMNH 102432 1911 Nicaragua Toe pad AMNH 238836 1932 Peru Toe pad AMNH 406859 1931 Peru Toe pad AMNH 429102 1935 Brazil Toe pad TPF CUBL.2IH 1997 Ecuador Feather AMNH 272336 1932 Venezuela Toe pad HUA, Morphnus guianensis 2003 Peru Blood 1Bell Museum of Natural History (BELL), Western Foundation of Vertebrate Zoology
(WFVZ), Louisiana State University (LSUMZ), The Peregrine Fund (TPF), Royal
Ontario Museum (ROM), Museum of Comparative Zoology (MCZ), American Museum
of Natural History (AMNH), Joseph Moore Museum (JMM), El Huayco, Peru (HUA),
San Diego Zoo (SDZ), Sue Boinski (SB), Western Foundation of Vertebrate Zoology
(WFVZ), University of Michigan Museum of Zoology (UMMZ), National Museum of
Natural History (USNM), Field Museum of Natural History (FMNH) 2sibling of HH-41, excluded from all analyses 3likely origin is Columbia

91
We sequenced 417 bp of domain I of the mitochondrial control region using either
two or four primers (LDL-1, HDL-3, LDL-3 and HDL-1) depending on whether we were
working with contemporary or museum samples, respectively (Table 9). PCR
amplification was performed using Platinum Taq polymerase (Invitrogen). Amplification
products were purified on 1.5% low-melting point agarose gels, excised and recovered
with a Gel Extraction Kit (Qiagen). PCR products were used for direct sequencing with
ABI PRISM Big Dye Terminator Reaction Kits (Applied Biosystems) and resolved on an
ABI 3730 automated sequencer. Sequences were aligned by eye in BioEdit Sequence
Alignment Editor (Hall, 1999b).
Analyses.—Samples were grouped by geographic regions (see Table 10) to test possible
effects of barriers to gene flow such as mountains and discontinuities of lowland forest
habitats. The Andean mountains bisect the rainforest habitat of Panama and western
Colombia from the Amazon basin forming a barrier known to limit gene flow in a variety
of organisms (e.g. passerine birds, Bates et al., 1998; butterflies, Brower, 1994; howler
monkeys, Cortes-Ortiz et al., 2003; rainforest trees, Dick et al., 2003). Harpy eagles,
however, have large geographic ranges and are capable of traveling long distances by
flight (e.g. harpy eagles released in Brazil have traveled over 300 km from the release
site, Curti, 2007). Therefore, few geographic features may actually act as barriers to gene
flow for this species; although geographic structure has been identified in several felid
species having large home ranges in Neotropical forests (Eizirik et al., 1998; Eizirik et
al., 2001). To investigate regional gene flow, we identified two major regions

92
Table 9. Primer sequences used for the amplification of the mitochondrial control region in harpy eagles.
Primer ID Sequence (5’-3’)
LDL-1 CCCATTATCATGCACTATTCTAGG
HDL-1 GAGCAAGGTCGTAGGACTAACC
HDL-3 ATAACCTGGTCCGACAYACG
LDL-3 CGGATATTCTTGGGGACAAA
(1) Central America (including the Darien of Panama and western Colombia), and (2)
South America. Within the Central American region we grouped individuals from
Mexico, Nicaragua and Costa Rica separately from Panamanian birds based on the lack
of continuity of lowland tropical forest between these areas and evidence of
corresponding geographic structure in other organisms (Dick et al., 2003; Eizirik et al.,
1998; Eizirik et al., 2001). Within South America we defined a north-eastern subgroup
(Guyana, Surinam and Venezuela), a western subgroup (Ecuador, Peru, eastern
Colombia) and a southern subgroup (Brazil and Bolivia). These subgroups also
correspond to geographic division identified in other Neotropical organisms (see above).
The level of genetic diversity within regions and subgroups (defined above) was
estimated by calculating the number of haplotypes, haplotype diversity (h) and nucleotide
diversity (π) using the program Arlequin v. 3.0.1 (Excoffier et al., 2005). To visualize the
relationships among haplotypes we inferred a median-joining network (Bandelt et al.,
1999) with genetic distance parameter e = 0, equal weights for transitions and
transversions and all character sites, and with Morphnus guianensis as an outgroup using
the program NETWORK, v. 4.2 (available at www.fluxus-engineering.com). The median-
joining approach returns a network that corresponds most closely to the strict consensus

93
of maximum parsimony trees found in phylogenetic analyses (Cassens et al., 2003).
Relationships between harpy eagle haplotypes in Central and South America were
also estimated by maximum likelihood in PAUP*. A heuristic search with 10 random
addition sequence replicates and 100 bootstrap replicates under the HKY model of
sequence evolution (Hasegawa et al., 1985) selected using ModelTest (Posada, Crandall,
1998) was performed with and without constraining monophyly of Central American and
South American individuals. The significance of the difference in resulting likelihood
scores was evaluated using a parametric bootstrap where 1000 data matrices of 400 bases
were simulated under the HKY model in Mesquite (Maddison, Maddison, 2005). Each
simulated dataset was subjected to a maximum likelihood analysis as described above,
with and without monophyly constraints. The difference in likelihood scores between
these runs comprised the null distribution against which the likelihood value from the
harpy eagle dataset was tested.
The degree of population differentiation among regions was estimated with FST
using the infinite allele model. Partitioning of genetic variance among geographic
regions, among subgroups within regions and within subgroups was determined with
hierarchical analyses of molecular variance using haplotype frequencies (AMOVA,
Excoffier et al., 1992), and significance was determined based on 16002 non-parametric
permutations. AMOVA and FST calculations were performed in Arlequin v. 3.0.1
(Excoffier et al., 2005).
Demographic histories of harpy eagles in Central and South America were
evaluated with three approaches: standard quantitative test statistics, mismatch
distributions and coalescent-based estimations.

94
To test for genetic signatures of recent population size changes, Fu’s test of
neutrality (Fs, Fu, 1997), Tajima’s D (Tajima, 1989a) and Fu and Li’s F and DF test
statistics (Fu, Li, 1993) were compared among Central and South American regions and
subgroups. Both Fu’s Fs and Tajima’s D use the infinite site-model without
recombination to test for departures from selective neutrality and population equilibrium
for intraspecific data. Fu’s Fs uses information from the haplotype distribution and is
particularly sensitive to population demographic expansion where low Fs values indicate
an excess of singleton mutations usually due to expansion (Fu, 1997). Tajima’s D uses
the average number of pairwise differences and number of segregating sites in the
intraspecific DNA sequence to test for departure from neutral expectations, generally
assuming negative values in populations that have experienced size changes, especially
expansions, or for sequences that have undergone selection. In populations that have
undergone recent bottlenecks or have genetic substructure, values for Tajima’s D are
typically positive (Tajima, 1989b). Fu and Li’s F and DF compare mutations observed
within a population to an outgroup sequence, using information from the number of
recent mutations as evidence of recent expansion. Negative values of Fu and Li’s F and
DF indicate an excess of rare alleles and recent mutations that are consistent with an
increase in population size or positive selection, whereas positive values reflect an excess
of alleles at intermediate frequency that can result from population bottlenecks or
balancing selection (Fu, Li, 1993). Fu’s Fs and Tajima’s D were calculated in Arlequin v.
3.0.1with 1000 random permutations and Fu and Li’s F and DF were estimated in DNAsp
(Rozas et al., 2003).
The demographic history of each region was investigated by comparing the shape

95
of their respective mismatch distributions calculated in Arlequin v. 3.0.1 to shapes
expected in stationary and expanding populations. For samples drawn from populations
that are at demographic equilibrium, mismatch distributions are usually multimodal
(Slatkin, Hudson, 1991). Populations that have experienced recent expansions, on the
other hand, typically produce a unimodal distribution, although a similar shape may be
result from a bottleneck, making these two processes difficult to distinguish (Rogers,
Harpending, 1992). The distribution of the sum of squared differences (SSD) between the
observed mismatch distribution for each region and a mismatch distribution estimated
under a model of population expansion is used as a test statistic where a significant SSD
value indicates departure from a model of sudden population expansion (Schneider,
Excoffier, 1999). To estimate the time of expansion (t) we converted the parameter τ ,
estimated from the mismatch distribution, using the equation τ = 2µt (Rogers, 1995).
Confidence intervals for τ were calculated using a parametric bootstrap approach
(Schneider, Excoffier, 1999).
The migration rate between regions and relative effective population sizes (θ =
Nefµ, where Nef is the female effective population size and µ is the mutation rate per locus
per year) were estimated with MIGRATE (v. 2.1, Beerli, Felsenstein, 1999; Beerli,
Felsenstein, 2001). Estimates of µ generated from default settings were used as initial
starting points for final runs. Three final runs were conducted to check for convergence
upon similar values using the following parameters: 10 short chains of 100 000 steps and
two long chains of 20 000 000 steps with sampling every 100 steps and a burnin of 200
000 steps. Likelihood ratio tests were performed in each final run to evaluate the support
for symmetric versus asymmetric migration.

96
To evaluate the differing scenarios of recurrent gene flow and ancestral
polymorphism we used two coalescent-based methods that simultaneously estimate gene
flow and divergence times. Estimates of the female effective population sizes ((θΤ =
2Nefµ, where Nef is the female effective population size and µ is the mutation rate per
locus per year), migration between the regions (M=2Nef µ), time since divergence (T=
t/2Nef where t is the generation time) and time to most recent common ancestor
(TMRCA=tµ) were estimated using a Bayesian likelihood approach assuming the HKY
finite sites model in the program MDIV (Nielsen, Wakeley, 2001; Nielson, 2002). We
conducted three independent runs using different random number seeds to evaluate
convergence upon similar values of the modes in posterior distributions. Upper bounds
for M, θΤ, and T were set to ten. The posterior distribution of T approached but did not
reach zero in the upper portion of the distribution, so additional analyses were performed
with an upper bound of 20. The posterior distribution for runs with this larger prior
remained level rather than converging upon zero, so runs using the smaller prior are
reported here. The length of the markov chain was set to 2.5 million generations with a
burnin of 500,000 generations. Posterior distributions for the parameters were plotted and
the mode of the posterior distribution was selected as the best estimate with the exception
of the parameter T, where the point with the highest likelihood value was used.
To convert parameter estimates generated by MIGRATE and MDIV to biologically
informative values, an estimate of the neutral mutation rate per generation is needed for
the control region. A mutation rate has not been calibrated for any Accipitridae species,
so we used a range of mutation rates calculated for the entire control region in grouse
(4.54-12.54% [average 7.23%] divergence per million years, Drovetski, 2003) which is

97
similar to that found for the most variable part of the control region in diving ducks
(8.8%, Sorenson, Fleischer, 1996). When converting maximum likelihood estimates and
modes of parameters we used the average mutation rate of 7.23% divergence per million
years. To incorporate the effect of uncertainty around the mutation rate, we used the
upper and lower estimates of the mutation rate (4.54-12.54%) to calculate wider
credibility intervals (CI) than if we had simply used the average mutation rate.
Results Sequence characteristics.—Control region sequences were generated for 66 harpy eagles
and a single representative from the outgroup, Morphnus guianensis (Table 8). There
were 32 harpy eagles sampled from Central America, 31 from South America and three
for which the locality was unknown. Twenty-two harpy eagle haplotypes were identified
from a total of 21 variable sites, all of which were transitions (Table 11). There were four
and 13 unique haplotypes in Central and South America, respectively, and three
haplotypes were shared between regions. These shared haplotypes were observed only in
birds from Panama and northern South America (e.g., Colombia, Venezuela, Guyana and
Ecuador). Two additional haplotypes were shared by individuals sampled in South
America and individuals of unknown origin. The majority of haplotypes for individuals
sampled in South America were represented by only one or two individuals, with
exception of the three haplotypes shared by Central and South American individuals and
one haplotype shared by two South American individuals and a bird of unknown origin.
The South American region possessed higher haplotype diversity (0.9548 ±
0.0184; h ± s.e.) than Central America (0.7681 ± 0.0529). Total nucleotide diversity was
similar between the regions (South America, 0.008 ± 0.005; Central America, 0.005 ±
0.003). Of the 22 harpy eagle haplotypes sampled, 18 were found in the South American

98
region while only seven haplotypes occurred in samples from Central America.
Population subdivision.—Significant genetic subdivision between Central and South
America was identified with an FST value of 0.230 (p<0.0001). All pairwise comparisons
of subgroups within regions had significant FST values except Mexico-Costa Rica-
Nicaragua versus Panama (Table 10). Analysis of molecular variance (AMOVA) showed
substantial variation among regions (10.02%) and among subgroups within regions
(22.27%) with the majority of genetic variation observed within subgroups (67.71%).
Table 10. Matrix of pairwise FST values for geographic subgroups.
Geographic subgroup
(n=sample size)
Mexico-Costa Rica-
Nicaragua
Panama
Colombia-Ecuador-
Peru
Venezuela-Surinam-Guyana
Mexico-Costa Rica-
Nicaragua (n=6)
Panama (n=26)
0.10, n.s.
Colombia-Ecuador-
Peru (n=14)
0.33** 0.11*
Venezuela-Surinam-
Guyana (n=14)
0.61** 0.39**
0.19**
Brazil-Bolivia
(n=6)
0.57** 0.30**
0.29** 0.42**
* p<0.05 **p<0.01 n.s.= not significant
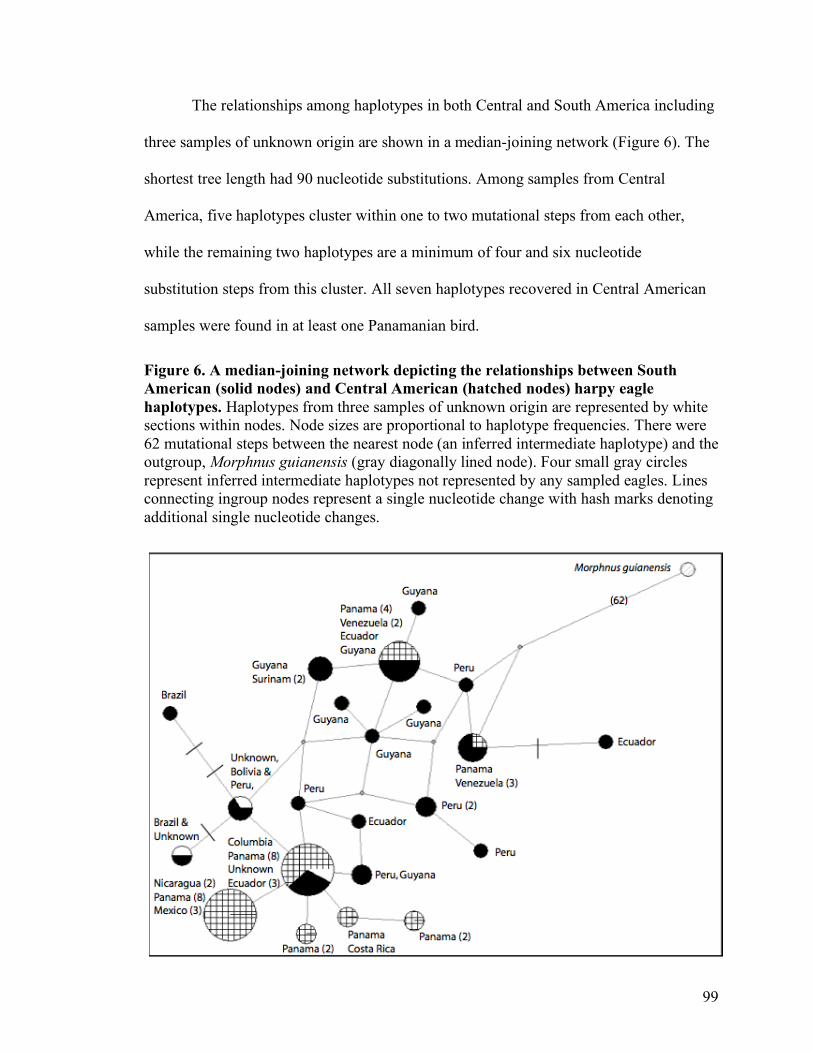
99
The relationships among haplotypes in both Central and South America including
three samples of unknown origin are shown in a median-joining network (Figure 6). The
shortest tree length had 90 nucleotide substitutions. Among samples from Central
America, five haplotypes cluster within one to two mutational steps from each other,
while the remaining two haplotypes are a minimum of four and six nucleotide
substitution steps from this cluster. All seven haplotypes recovered in Central American
samples were found in at least one Panamanian bird.
Figure 6. A median-joining network depicting the relationships between South American (solid nodes) and Central American (hatched nodes) harpy eagle haplotypes. Haplotypes from three samples of unknown origin are represented by white sections within nodes. Node sizes are proportional to haplotype frequencies. There were 62 mutational steps between the nearest node (an inferred intermediate haplotype) and the outgroup, Morphnus guianensis (gray diagonally lined node). Four small gray circles represent inferred intermediate haplotypes not represented by any sampled eagles. Lines connecting ingroup nodes represent a single nucleotide change with hash marks denoting additional single nucleotide changes.

100
Figure 7. Mismatch distribution for haplotypes found in harpy eagle samples from (a) South America and (b) Central America. The expected distributions of pairwise differences among haplotypes under a model of sudden expansion are shown as lines and the observed distances are shown as bars.
The Nicaraguan and Mexican samples all shared the same haplotype (also found in eight
Panamanian birds) and the haplotype of the Costa Rican individual was shared by one
Panamanian individual. Haplotypes recovered in South American individuals are found
throughout the network with no obvious clusters.
Population demographic histories.—The shape of the observed mismatch distribution for
South America is a unimodal curve often found in populations that have experienced a
sudden expansion (Rogers, Harpending, 1992), and it was not possible to reject a model
of sudden expansion (SSD = 0.0047, p = 0.063, Figure 7a). The low value of
Harpending's raggedness index (r = 0.03) reflects the unimodality of the mismatch
distribution and is characteristic of an expanding population although it was not
significant (p = 0.084). Expansion of the South American region was supported by
(a) (b)
0
20
40
60
80
100
120
0 1 2 3 4 5 6 7 8 9
0
20
40
60
80
100
120
140
160
0 1 2 3 4 5 6 7
Freq
uenc
y
Pairwise differences Pairwise differences
101
significant (p < 0.05) negative values of Fu and Li’s DF and F and Fu’s Fs (Table 11).
Within South America, significant values of DF, F and Fs were also found in two of the
three subgroups: Ecuador-Peru-Colombia and Venezuela-Surinam-Guyana. Values for
Tajima’s D (not shown) were negative for all groups with the exception of Colombia-
Ecuador-Peru, but were also not significant for any of the groups.The estimated time of
expansion calculated from τ for South American harpy eagles is apprxominately 60 000
BP (99 000 – 36 000 BP 95% CI).
The mismatch distribution for Central America shows a large number of haplotypes that
are identical or that differ by only one nucleotide (Figure 7b.) This shape is associated
with populations that have experienced a bottleneck or a very recent expansion (Johnson
et al., 2007). A model of population expansion was also not rejected for Central America
(SSD = 0.023, p = 0.596, Fig. 2b), and the raggedness index was low (r = 0.060) and not
significantly different than expected by chance (p > 0.713). In contrast, however,
population expansion in Central America was not supported by Fu and Li’s DF and F and
Fu’s Fs (p > 0.05, Table 11).
Genealogy .—The ML topology (not show) resulting from an unconstrained analysis
recovered two main clades with low support (bootstrap values of 56 and 60) that did not
correspond to geographical origin and a third clade comprised of three Peruvian
haplotypes each represented by a single bird (bootstrap value 94). While the constraint
tree had a higher likelihood score, the difference in likelihood scores between the
unconstrained and constrained phylogenies was not significant (p>0.10).
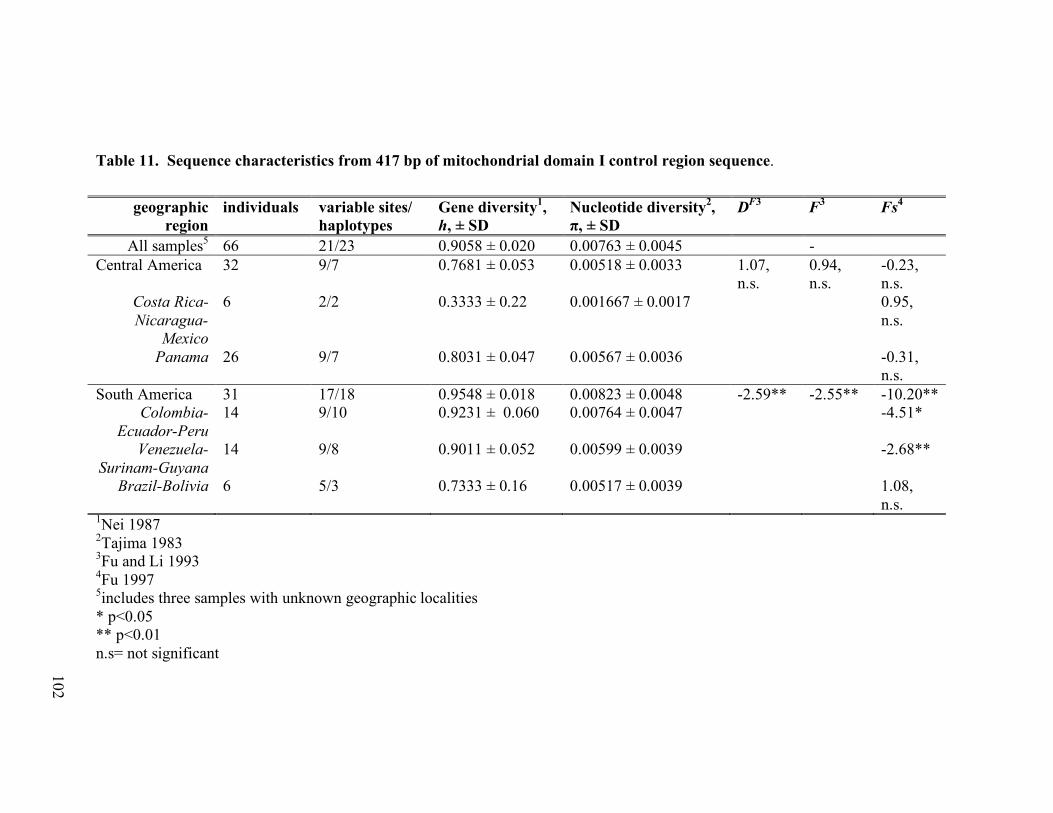
102
Table 11. Sequence characteristics from 417 bp of mitochondrial domain I control region sequence.
geographic region
individuals variable sites/ haplotypes
Gene diversity1, h, ± SD
Nucleotide diversity2, π, ± SD
DF3 F3 Fs4
All samples5 66 21/23 0.9058 ± 0.020 0.00763 ± 0.0045 - Central America 32 9/7 0.7681 ± 0.053 0.00518 ± 0.0033 1.07,
n.s. 0.94, n.s.
-0.23, n.s.
Costa Rica-Nicaragua-
Mexico
6 2/2 0.3333 ± 0.22 0.001667 ± 0.0017 0.95, n.s.
Panama 26 9/7 0.8031 ± 0.047 0.00567 ± 0.0036 -0.31, n.s.
South America 31 17/18 0.9548 ± 0.018 0.00823 ± 0.0048 -2.59** -2.55** -10.20** Colombia-
Ecuador-Peru 14 9/10 0.9231 ± 0.060 0.00764 ± 0.0047 -4.51*
Venezuela-Surinam-Guyana
14 9/8 0.9011 ± 0.052 0.00599 ± 0.0039 -2.68**
Brazil-Bolivia 6 5/3 0.7333 ± 0.16 0.00517 ± 0.0039 1.08, n.s.
1Nei 1987 2Tajima 1983 3Fu and Li 1993 4Fu 1997 5includes three samples with unknown geographic localities * p<0.05 ** p<0.01 n.s= not significant
102

103
Coalescent analyses of demography .—The average maximum likelihood estimate of θCA
from three MIGRATE analyses (0.0034, 90% CI 0.00216-0.0060) was an order of
magnitude lower than the corresponding average of the South American region (0.040,
90% CI 0.018-0.47). These values correspond to female effective population sizes of
9,406 (4,362-16,804 90% CI) for Central America and 111,787 (51,910-1,300,445 90%)
for South America. Likelihood ratio tests rejected the null hypothesis of symmetric
migration (p<0.001). Higher rates of female gene flow from Central America into South
America (mCA = 694.27, 95% CI 341.8-1306.9; mSA = 0.000002, 95% CI 0.000001-.0050)
were estimated by the haplotype data.
Parameter estimates from coalescent-based analyses in MDIV produced bell-
shaped curves with the exception of T which peaked and approached but did not
converge to zero in the upper portion of its distribution (Figure 8). The maximum
likelihood estimate of the total effective population size of female harpy eagles was 2.78
(2.52-3.04 95% CI), which corresponds to 51,544 female harpy eagles (27,145-89,728
95% CI). In contrast with the high migration levels found with the program MIGRATE,
estimates of migration from MDIV were relatively low, 1.08 (0.83-1.33 95% CI). The
maximum likelihood estimate of time since divergence (t=0.24) corresponds to 24,700
years (13,000-43,000 when applying low and high mutation rates). Time to most recent
common ancestor is a much older date, corresponding to 308,000 years (179,000-490,000
when applying low and high mutation rates respectively).
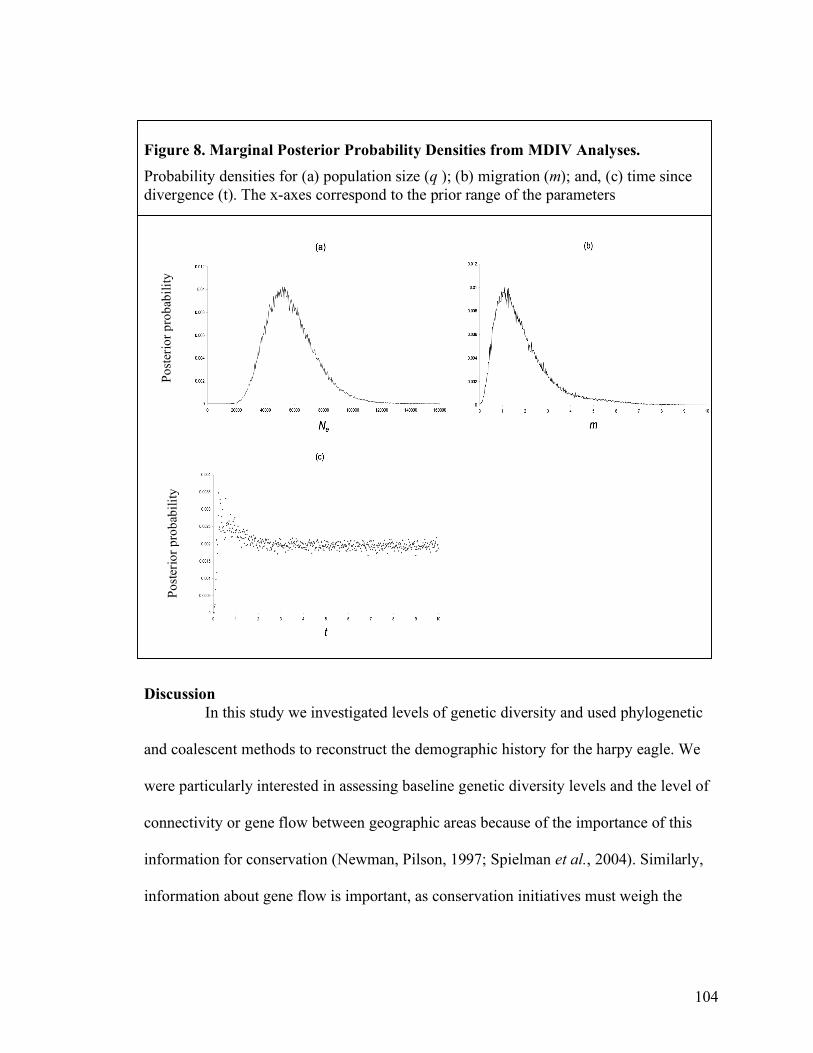
104
Post
erio
r pro
babi
lity
Post
erio
r pro
babi
lity
Figure 8. Marginal Posterior Probability Densities from MDIV Analyses. Probability densities for (a) population size (q ); (b) migration (m); and, (c) time since divergence (t). The x-axes correspond to the prior range of the parameters
Discussion In this study we investigated levels of genetic diversity and used phylogenetic
and coalescent methods to reconstruct the demographic history for the harpy eagle. We
were particularly interested in assessing baseline genetic diversity levels and the level of
connectivity or gene flow between geographic areas because of the importance of this
information for conservation (Newman, Pilson, 1997; Spielman et al., 2004). Similarly,
information about gene flow is important, as conservation initiatives must weigh the

105
importance of preserving not just total area of habitat, but also connectivity of habitat in
the face of increasing fragmentation.
Population structure and demographic history .—There was no evidence of complete
barriers to historical gene flow from phylogenetic, coalescent and network analyses,
which is consistent with a lack of observed morphological variation across the broad
distribution of harpy eagles (Ferguson-Lees, Christie, 2001). We did find evidence for
incomplete isolation between geographic regions and among some subgroups with FST
and AMOVA calculations. Significant genetic differentiation (FST = 0.23, p<0.001)
between Central and South America reflects some restriction of gene flow across the
Andean mountains as seen with other top predators of Neotropical forests, including the
jaguar (Eizirik et al., 2001), ocelot, margay (Eizirik et al., 1998) and puma (Culver et al.,
2000). Haplotypes shared between the two major regions were found in close geographic
proximity; that is, Panamanian birds shared haplotypes with individuals from
northwestern South America.
Lack of monophyly in mitochondrial DNA for birds from the Central and South
American regions and divergence time estimates from coalescent analyses suggest that
they are separated by a recent partial barrier. The estimate of the divergence time
between Central and South America must be interpreted cautiously, however, as the
posterior distribution for t did not converge upon zero in the upper part of its range.
Furthermore, control region mutation rates are highly variable across avian taxa
(Ruokonen, Kvist, 2002) and a rate has not been calibrated specifically for Accipitridae
taxa. In comparison with other avian taxa, two accipitrid vulture species were found to

106
have reduced variability in domain I of the control region potentially resulting from a
lower mutation rate (Roques, 2004). If the mutation rate of the control region in harpy
eagles is lower than that used here, the estimates of divergence time and time to most
recent common ancestor would be older than what we calculated. Further sampling of
individuals and locales may improve estimates in future work.
Significant FST values among subgroups within South America and among
Central and South American subgroups suggest a pattern of isolation by distance.
Increasingly higher values were observed between more distant subgroups and the lowest
values were observed between neighboring subgroups. Although our sampling within
northern Central America is not sufficient to evaluate the level of connectivity or
isolation of more northern areas, it should be noted that there were no haplotypes unique
to Central American locations outside of Panama. Every haplotype sampled in Central
America was also found in at least one individual from Panama, and two haplotypes were
found only in Panamanian birds. Population substructure within Central America has
been found in other top predators (e.g., Eizirik et al., 1998; Eizirik et al., 2001) so it is
not unlikely for harpy eagles to show some differentiation in Central America. Provided
that additional samples could be obtained, future work on harpy eagles should investigate
the potential for phylogeographic structure within Central America as this information is
important for conservation.
Given the smaller overall size of Central America compared to South America, it
is not surprising that coalescent-based analyses estimated a much smaller population size
in Central America (i.e. an order of magnitude smaller). Given the extent of recent habitat
loss (FAO, 2006), it is likely that harpy eagles in Central America have experienced a
107
recent bottleneck. The null hypothesis of population demographic expansion was not
rejected based on the mismatch distribution (i.e. SSD and raggedness index) for Central
America, but these statistics are conservative and use little information in the data
(Felsenstein, 1992). Detecting population demographic size changes can be difficult with
small sample sizes, few segregating sites or haplotypes, or when the population has
experienced a very recent expansion (Ramos-Onsins, Rozas, 2002). Fu’s Fs has been
shown to be more powerful in detecting demographic changes under a variety of
conditions including both very recent and older population expansions (Fu, 1997; Ramos-
Onsins, Rozas, 2002) and did not support expansion for Central America. Fu and Li’s F
and DF use an outgroup sequence to identify recent intraspecific mutations and are thus
less affected by sample size than test statistics based on mismatch distributions or Fu’s Fs
(Ramos-Onsins, Rozas, 2002). Neither Fu and Li’s F nor DF supported expansion, with
significant values. While this conflict in measures could reflect a bias in sampling (i.e.
sampling over a wide time period or predominantly sampling in the Darien, the evidence
for demographic expansion in Central America from our data is weak and it is more
likely that the population is at equilibrium or has experienced a very recent bottleneck.
Log-likelihood ratio tests in MIGRATE showed that gene flow is directional with
migration from Central into South America and essentially no reciprocal migration. If
real, this directional migration could be a result of greater loss and fragmentation of
habitat in northern Central America forcing birds into South America. Since our
sampling within Central America was densest in the area closest to South America (the
Darien of Panama), we should have detected South American migrants to the Darien, but
we did not find evidence for migration in this direction.

108
Within South America there was strong evidence of a recent population
expansion. The estimated date of expansion, 60 000 BP (99 000 – 36 000 BP 95% CI),
falls entirely within the last ice age and more specifically, well before the last glacial
maximum (LGM) of 22 000 – 19 500 BP (Seltzer et al., 2002) . Since the estimated time
of expansion, changes in temperature and rainfall in the Amazon basin have been
associated with a decrease of rain forest and cloud forest habitat until the LGM (Mayle et
al., 2004a) followed by expansion of these habitats to the present time. An increase in
deciduous and semi-deciduous forest in the southern Amazon and grassland habitat
surrounding the Amazon basin seen during the LGM is proposed to reoccur (Mayle et al.,
2004b) coincident with current rapid global climate change involving an increase of ca.
3° C and a reduction of annual precipitation of ~20% (Houghton et al., 2001). Given that
harpy eagles are found only rarely in dry forests (but see Muñiz-Lopez et al., 2007) and
population expansion for harpy eagles is associated with a substantially cooler and wetter
time period, anticipated climate and habitat changes present further challenges for the
persistence of this species.
Genetic diversity and conservation implications.—High levels of genetic diversity with
respect to other Accipitridae species (Table 12) were recovered from the mitochondrial
D-loop for 66 harpy eagles. While the inclusion of some older samples could have
inflated the genetic diversity measures, we think this effect was minimal for haplotype
diversity as only three haplotypes were found exclusively in samples collected before
1960 (two samples from Peru and one from Brazil). It is more likely that our genetic
diversity estimates are low for harpy eagles and that additional sampling, both in South

109
America where most haplotypes sampled were represented by only one or two
individuals and in unsampled parts of Central America, would identify more haplotypes
and higher genetic diversity.
Higher haplotype diversity among samples from the South American region as
opposed to Central America, likely reflects both the larger area of lowland rainforest
habitat and larger population size in South America. However, the greater loss of habitat
in Central America and the restriction of our sampling to predominantly Panamanian
samples likely also plays a part in the lower levels of genetic diversity found for that
region (26 Panamanian samples out of 32 Central American samples).
In order to better interpret the amount of genetic variability found for the overall
harpy eagle population, it is useful to compare these results with patterns of diversity
found in related species (Milot et al., 2007). With respect to mitochondrial control region
sequence data published for eight other taxa in the same avian family (i.e. Accipitridae,
Table 12) we find high gene diversity and a moderate level of nucleotide diversity for
harpy eagles in the DNA sequence we sampled. This suggests that present population
impacts may not have reduced levels of genetic diversity in the overall harpy eagle
population beyond that which could be aided by conservation efforts. However, the
majority of the genetic diversity observed was represented in South American individuals
so reduction of genetic variation in Central America is possible and remains a concern.
The lack of major population subdivision and evidence for recent and
incomplete isolation among and within regions are consistent with a pattern of gene flow
across the broad distribution of harpy eagles. Evidence for statistically significant
geographic differentiation supports reduced but ongoing levels of gene flow between
110
Central and South America and among northern, southern and north-western regions
within South America. Thus, attention should be paid to preventing further fragmentation
and isolation of harpy eagle subgroups. Active management may indeed be necessary to
promote gene flow among isolated remnant populations, particularly in Central America
where fragmentation of habitat is greatest and levels of genetic diversity are lowest.

111
Table 12. Genetic diversity of the control region reported in published studies of Accipitridae taxa. Species (n=sample size)
IUCN1 status
Control region domain
Total sites/ Variable sites/%
Haplotypes Gene diversity, h (SD)
Nucleotide diversity, π (SD)
Aquila adalbarti6 (n=60)
VU Domain I 345/2/ 0.6
3 0.3215 (0.0730)
0.00098 (0.00024)
Aquila heliaca6 (n=34)
VU Domain I 345/8/ 2.3
7 0.7790 (0.0420)
0.00548 (0.00068)
Buteo galapagoensis2 (n=122)
VU Domain I 415/5/ 1.2
5 0.625 (0.025)
0.0019
Harpia harpyja (n=66)
NT Domain I 400/21/ 5.3
23 0.9058 (0.0201)
0.007626 (0.004459)
Milvus milvus7 (n=105)
NT Domain I 357/10/ 2.8
10 0.61 0.0032
Buteo swainsoni2 (n=18)
LC Domain I 415/18/ 4.3
12 0.766 (0.081)
0.0059
Gypaetus barbatus3 (n=172)
LC Domain I 228/28/ 12.3
50 0.932 (0.012)
0.0292 (0.0153)
Haliaeetus leucogaster4 (n=128)
LC 390 bp Domain I, 163 bp Domain II
553/15/ 2.7
15 0.3497 (0.05447)
0.000806 (0.0008)
Hieraaetus fasciatus5 (n=72)
LC Domain I 253/3/ 1.2
4 0.542 (0.046)
0.0024 (0.0017)
1World conservation union red list status, vulnerable (VU), near-threatened (NT), least concern (LC, IUCN, 2006) 2(Bollmer et al., 2005) 3(Godoy et al., 2004)
4(Shephard et al., 2005) 5(Cadahía et al., 2007) 6(Martinez-Cruz et al., 2004) 7(Roques, Negro, 2005)

112
Acknowledgments We sincerely thank the many people and institutions that contributed samples (see Table
8), especially colleagues at The Peregrine Fund who, in addition to providing samples,
also conduct important long-term research and conservation programs that benefit the
harpy eagle. In particular, we would like to thank Jose Vargas, Magaly Linares, Angel
Muela, Bill Burnham, Lloyd Kiff and Sue Boinski. This research was funded by the
Peregrine Fund, a Dean Amadon Grant (Raptor Research Foundation) and a Peter Olaus
Okkelberg Award (University of Michigan Department of Ecology and Evolutionary
Biology). Jeff Long, Lacey Knowles, Robert Payne and Elen Oneal provided helpful
comments on earlier versions of the manuscript. The MDIV and MIGRATE analyses
were carried out by using the resources of the Computational Biology Service Unit from
Cornell University which is partially funded by Microsoft Corporation.

113
References Alfaro ME, Huelsenbeck JP (2006) Comparative performance of Bayesian and AIC-
based measures of phylogenetic model uncertainty. Systematic Biology 55, 89-96. Amadon D (1982a) A revision of the sub-buteonine hawks (Accipitridae, Aves).
American Museum Novitates 1741, 1-20. Amadon D (1982b) A revision of the sub-buteonine hawks (Accipitridae, Aves).
American Museum of Novitates 1741, 1-20. Amadon D, Bull J (1988) Hawks and owls of the world. Proceedings of the Western
Foundation of Vertebrate Zoology 3, 295-357. AOU (1988) Checklist of North American Birds, 7 edn. American Ornithologists’ Union,
Washington, D.C. Arctander P (1995) Comparison of a mitochondrial gene and a corresponding nuclear
pseudogene. Proc. R. Soc. Lond. B Biol. Sci. 262, 13-19. Baillie JEM, Hilton-Taylor C, Stuart SN (2004) IUCN Red List of Threatened Species:
A Global Species Assessment. IUCN, Cambridge, UK. Bandelt HJ, Forster P, Rohl A (1999) Median-joining networks for inferring intraspecific
phylogenies. Molecular Biology and Evolution 16, 37-48. Barlow J, Haugaasen T, Peres C (2002) Sympatry of the Black-faced Hawk Leucopternis
melanops and the White-browed Hawk Leucopternis kuhli in the Lower Rio Tapajós, Pará, Brazil. Cotinga 18, 77-79.
Bates JM, Hackett SJ, Cracraft J (1998) Area-relationships in the Neotropical lowlands: an hypothesis based on raw distributions of Passerine birds. Journal of Biogeography 25, 783-793.
Beerli P, Felsenstein J (1999) Maximum-Likelihood Estimation of Migration Rates and Effective Population Numbers in Two Populations Using a Coalescent Approach. Genetics 152, 763-773.
Beerli P, Felsenstein J (2001) Maximum likelihood estimation of a migration matrix and effective population sizes in n subpopulations by using a coalescent approach. PNAS 98, 4563-4568.
Bollmer JL, Kimball RT, Whiteman NK, Sarasola JH, Parker PG (2005) Phylogeography of the Galapagos hawk (Buteo galapagoensis): A recent arrival to the Galapagos Islands. Mol Phylogenet Evol.
Brandley M, Schmitz A, Reeder T (2005) Partitioned Bayesian Analyses, Partition Choice, and the Phylogenetic Relationships of Scincid Lizards. Systematic Biology 54, 373-390.
Brower A (1994) Rapid morphological radiationand convergence among races of the butterfly Heliconius erato infered from patterns of mitochondrial DNA evolution. Academy of Sciences of the United States of America 91, 6491-6495.
Brown LH (1970) Eagles Arco Publishing, Inc., New York. Brown LH (1976) Birds of Prey their biology and ecology A & W Publishers, Inc, New
York. Brown LH, Amadon D (1968) Eagles, hawks and falcons of the world Country Life
Books, London. Bunce M, Szulkin M, Lerner HRL, et al. ((in press)) The evolutionary history of New
Zealand's extinct giant eagle revealed by ancient DNA. Public Library of Science Biology.

114
Bunce M, Szulkin M, Lerner HRL, et al. (2005) The evolutionary history of New Zealand's extinct giant eagle revealed by ancient DNA. Public Library of Science Biology 3, e (9).
Burton PJK (1978) The intertarsal joint of the Harrier-hawks Polyboroides spp. and the Crane hawk Geranospiza caerulescens. The Ibis 120, 171-177.
Cadahía L, Negro JJ, Urios V (2007) Low mitochondrial DNA diversity in the endangered Bonelli’s Eagle (Hieraaetus fasciatus) from SW Europe (Iberia) and NW Africa. Journal of Ornithology 148, 99-104.
Cassens I, Van Waerebeek K, Best PB, et al. (2003) The phylogeography of dusky dolphins (Lagenorhynchus obscurus): a critical examination of network methods and rooting procedures. In: Molecular Ecology, pp. 1781-1792.
Cassin (1865) Proc. Acad. Nat. Sci. Philadelphia, 4. CITES-Secretariat (2003) update to Appendices I, II, III. Convention on International
Trade in Endangered Species of Wild Fauna and Flora. Collar NJ, Andreev AV, Chan S, et al. (2001) Threatened birds of Asia: the Birdlife
International Red Data Book. BirdLife International, Cambridge, U.K. Cooper RA (1994) DNA from museum specimens. In: Ancient DNA: recovery and
analysis of genetic material from paleontological, archaeological, museum, medical, and forensic specimens (eds. Herrmann B, Herrmann S), pp. 149-165. Springer, New York.
Cooper RA, Poinar HN (2000) Ancient DNA: Do it right or not at all. Science 289, 1139. Cortes-Ortiz L, Bermingham E, Rico C, et al. (2003) Molecular systematics and
biogeography of the Neotropical monkey genus, Alouatta. Molecular Phylogenetics and Evolution 26, 64-81.
Culver M, Johnson WE, Pecon-Slattery J, O'Brien SJ (2000) Genomic ancestry of the American puma (Puma concolor). Journal of Heredity 91, 186-197.
Curti M (2007) Released Harpy Eagles Disperse Throughout the Selva Maya. In: Harpy Eagle Releases--Notes from the Field.
David N, Gosselin M (2002) Gender agreement of avian species names. Bulletin of the British Ornithologists' Club 122, 14-49.
del Hoyo J, Elliot A, Sargatal J, Cabot J (1994) Handbook of the birds of the world, Lynx Edicions, Barcelona, Spain.
Dick CW, Abdul-Salim K, Bermingham E (2003) Molecular Systematic Analysis Reveals Cryptic Tertiary Diversification of a Widespread Tropical Rain Forest Tree. American Naturalist 162, 691-703.
Dickinson EC (2003) The Howard and Moore Complete Checklist of the Birds of the World. Christopher Helm, London.
do Amaral F, Miller M, Silveira L, Bermingham E, Wajntal A (2006) Polyphyly of the hawk genera Leucopternis and Buteogallus (Aves, Accipitridae): multiple habitat shifts during the Neotropical buteonine diversification. BMC Evolutionary Biology 6, 10.
Drovetski SV (2003) Plio-Pleistocene climatic oscilations, Holarctic biogeography and speciation in an avian subfamily. Journal of Biogeography 30, 1173-1181.
Eason P (1989) Harpy Eagle Attempts Predation on Adult Howler Monkey. The Condor 91, 469-470.
115
Eizirik E, Bonatto SL, Johnson WE, et al. (1998) Phylogeographic Patterns and Evolution of the Mitochondrial DNA Control Region in Two Neotropical Cats (Mammalia, Felidae). Journal of Molecular Evolution 47, 613-624.
Eizirik E, Kim J-H, Menotti-Raymond M, et al. (2001) Phylogeography, population history and conservation genetics of jaguars (Panthera onca, Mammalia, Felidae). Molecular Ecology 10, 65-79.
Excoffier L, Laval G, Schneider S (2005) Arlequin ver. 3.0: An integrated software package for population genetics data analysis. Evolutionary Bioinformatics Online 1.
Excoffier L, Smouse P, Quattro J (1992) Analysis of molecular variance inferred from metric distances among DNA haplotypes: Applicatin to human mitochondrial DNA restriction data. Genetics 136, 343-359.
FAO (2006) Global Forest Resources Assessment 2005. Main Report. Progress Towards Sustainable Forest Management. FAO Forestry Paper 147. Rome.
Felsenstein J (1992) Estimating effective population size from samples of sequences: inefficiency of pairwise and segregating sites as compared to phylogenetic estimates. Genetic Research 59, 139-147.
Ferguson-Lees J, Christie DA (2001) Raptors of the World Christopher Helm, London. Fowler JM, Cope JB (1964) Notes on the harpy eagle in British Guiana. Auk 81, 257-273. Frankham R (2005) Genetics and extinction. Biological Conservation 126, 131-140. Friedmann H (1950a) The Birds of North and Middle America U.S. Government Printing
Office, Washington, D.C. Friedmann H (1950b) The Birds of North and Middle America. Part XI. Cathartidae to
Falconidae. Volume 50. Smithsonian Institution, Washington D.C. Fu YX (1997) Statistical tests of neutrality of mutations against population growth,
hitchhiking and background selection. Genetics 147, 915-925. Fu YX, Li WH (1993) Statistical tests of neutrality of mutations. Genetics 133, 693-709. Gadow H (1893) Vogel. In: Klassen und Ordnungen des Thier-Reichs, wissenschaftlich
dargestellt in Wort und Bild. Sechster Band (ed. Bronns HG). C.F. Winter'sche, Leipzig und Heidelberg.
Gamauf A, Haring E (2004) Molecular phylogeny and biogeography of Honey-buzzards (genera Pernis and Henicopernis). J. Zool. Syst. Evol. Research 42, 145-153.
Gilbert MTP, Bandelt HJ, Hofreiter M, Barnes I (2005) Assessing ancient DNA studies. Trends Ecol Evol 20, 541-544.
Godoy JA, Negro JJ, Hiraldo F, Donazar JA (2004) Phylogeography, genetic structure and diversity in the endangered bearded vulture(Gypaetus barbatus, L.) as revealed by mitochondrial DNA. Molecular Ecology 13, 371-390.
Grossman M, Hamlet J (1964) Birds of prey of the world Bonanza Books, New York. Gutiérrez JR, Meserve PL, Herrera S, Contreras LC, Jaksic FM (1997) Effects of small
mammals and vertebrate predators on vegetation in the Chilean semiarid zone. Oecologia 109, 398-406.
Hall TA (1999a) BioEdit: a user-friendly biological sequence alignment editor and analysis program for Windows 95/98/NT. Nucl. Acids. Symp. Ser. 41, 95-98.
Hall TA (1999b) BioEdit: a user-friendly biological sequence alignment editor and analysis program for Windows 95/98/NT. Nucleic Acids Symposium Series 41, 95-98.
116
Hasegawa M, Kishino K, Yano T (1985) Dating the human-ape splitting by a molecular clock of mitochondrial DNA. Journal of Molecular Evolution 22, 160-174.
Helbig AJ, Kocum A, Seibold I, Braun MJ (2005) A multi-gene phylogeny of aquiline eagles (Aves : Accipitriformes) reveals extensive paraphyly at the genus level. Molecular Phylogenetics and Evolution 35, 147-164.
Hellmayr CE, Conover B (1949) Catalogue of Birds of the Americas. Falconiformes. XIII: Part 1, No.4 Field Museum of Natural History Zoological Series.
Hilty SL (2003) Birds of Venezuela Christopher Helm, London. Hilty SL, Brown WL (1986) A guide to the birds of Colombia Princeton University Press,
Princeton. Holdaway RN (1994) An exploratory phylogenetic analysis of the genera of the
Accipitridae, with notes on the biogeography of the family. In: Raptor Conservation Today (eds. Meyburg B-U, Chancellor RD), pp. 601-649. World Working Group on Birds of Prey and Owls, London.
Houghton JT, Ding Y, Griggs DJ, et al. (2001) Climate Change 2001: The Scientific Basis: Contribution of Working Group I to the Third Assessment Report of the Intergovernmental Panel on Climate Change Cambridge University Press.
Howell SNG, Webb S (1995) A guide to the birds of Mexico and northern Central America Oxford University Press, New York.
Hudson RR (1990) Gene genealogies and the coalescent process. In: Oxford surveys in evolutionary biology (eds. Futuyma D, Antonovics J), pp. 1-44. Oxford University Press, New York.
Huelsenbeck JP, Ronquist F (2001) MR BAYES: Bayesian inference of phylogenetic trees. Bioinformatics 17, 754-755.
International B (2004) Species factsheet: Leucopternis occidentalis. IUCN (2006) IUCN Red List of Threatened Species. Jepson P, Jarvie JK, MacKinnon K, Monk KA (2001) The end for Indonesia's lowland
forests? Science 292, 859-+. Johnson JA, Dunn PO, Bouzat JL (2007) Effects of recent population bottlenecks on
reconstructing the demographic history of prairie-chickens. Molecular Ecology 16, 2203-2222.
Johnson JA, Lerner HRL, Rasmussen PC, Mindell DP (2006) Systematics within Gyps vultures: a clade at risk. BMC Evolutionary Biology 6.
Johnson JA, Watson RT, Mindell DP (in press) Prioritizing species conservation: does the Cape Verde kite exist?
Jollie M (1976) A contribution to the morphology and phylogeny of the Falconiformes, part 1. Evolutionary Theory 1, 285-298.
Jollie M (1977a) A contribution to the morphology and phylogeny of the Falconiformes, Part 2. Evolutionary Theory 2, 285-298.
Jollie M (1977b) A contribution to the morphology and phylogeny of the Falconiformes, part 3. Evolutionary Theory 2, 209-300.
Jones HL (2003) Birds of Belize, 1 edn. University of Texas Press, Austin. Kemp AC, Crowe TM (1990) A preliminary phylogenetic and biogeographic analysis of
the genera of diurnal raptors. Proceedings of the International Symposium on Vertebrate Biogeography and Systematics in the Tropics. Bonn: Museum Alexander Koenig, 161–175.

117
Kemp AC, Crowe TM (1994) A Morphometric Analysis of Accipiter Species. In: Raptor Conservation Today (eds. Meyburg B-U, Chancelor RD), pp. 651-665. WWGBP/The Pica Press, London.
Kumar S, Tamura K, Jakobsen IB, Nei M (2001) MEGA2: Molecular evolutionary genetics analysis software. Bioinformatics 17, 1244-1245.
Land HC (1970) Birds of Guatemala Livingston Publishing Company, Wynnewood. Lerner HRL, Mindell DP (2005) Phylogeny of eagles, Old World vultures, and other
Accipitridae based on nuclear and mitochondrial DNA. Molecular Phylogenetics and Evolution 37, 327–346.
Lerner HRL, Mindell DP (in press, 2008) Molecular phylogenetics of the buteonine birds of prey (Aves: Accipitridae). The Auk.
Letourneau DK, Dyer LA (1998a) Density Patterns of Piper Ant-Plants and Associated Arthropods: Top-Predator Trophic Cascades in a Terrestrial System? Biotropica 30, 162-169.
Letourneau DK, Dyer LA (1998b) Experimental Test in Lowland Tropical Forest Shows Top-Down Effects through Four Trophic Levels. Ecology 79, 1678-1687.
Lewis P (1998) A genetic algorithm for maximum-likelihood phylogeny inference using nucleotide sequence data. Molecular Biology and Evolution 15, 277-283.
Lopez GO, Terborgh J, Ceballos N (2005) Food selection by a hyperdense population of red howler monkeys (Alouatta seniculus). Journal of Tropical Ecology 21, 445-450.
Maddison WP, Maddison DR (2005) Mesquite: a modular system for evolutionary analysis.
Martinez-Cruz B, Godoy JA, Negro JJ (2004) Population genetics after fragmentation: the case of the endangered Spanish imperial eagle (Aquila adalberti). Molecular Ecology 13, 2243-2255.
Mayle FE, Beerling DJ, Gosling WD, Bush MB (2004a) Responses of Amazonian ecosystems to climatic and atmospheric carbon dioxide changes since the last glacial maximum. Philosophical Transactions: Biological Sciences 359, 499-514.
Mayle FE, Beerling DJ, Gosling WD, Bush MB (2004b) Responses of Amazonian ecosystems to climatic and atmospheric carbon dioxide changes since the last glacial maximum. Philosophical Transactions of the Royal Society of London Series B-Biological Sciences 359, 499-514.
Milot E, Weimerskirch H, Duchesne P, Bernatchez L (2007) Surviving with low genetic diversity: the case of albatrosses. Proceedings of the Royal Society B: Biological Sciences 274, 779-787.
Mindell DP, Sorenson MD, Huddleston CJ, et al. (1997) Phylogenetic relationships among and within select avian orders based on mitochondrial DNA. In: Avian Molecular Evolution and Systematics (ed. Mindell DP), pp. 211-245. Academic Press, London.
Monroe BLJ (1968) A distributional survey of the birds of Honduras. Ornithological Monographs 7.
Mooers AO, Atkins RA (2003) Indonesia's threatened birds: over 500 million years of evolutionary heritage at risk. Animal Conservation 6, 183-188.
Mundy P, Butchart D, Ledger J, Piper S (1992) The vultures of Africa Academic Press, London.

118
Muñiz-Lopez R, Criollo O, Mendúa A (2007) Results of five years of the "Harpy Eagle (Harpia harpyja) Research Program" in the Ecuadorian tropical forest. In: Neotropical Raptors (eds. Bildstein KL, Barber DR, Zimmerman A),
pp. 22-32. Hawk Mountain Sanctuary, Orwigsburg. Newman D, Pilson D (1997) Increased probability of extinction due to decreased genetic
effective population size: Experimental populations of Clarkia pulchella. Evolution 51, 354-362.
Nielsen R, Wakeley JW (2001) Distinguishing Migration from Isolation: an MCMC Approach. Genetics 158, 885-896.
Nielson R (2002) MDIV software. Nylander JAA (2002) MrModeltest. Program distributed by the author., Uppsala
University Department of Systematic Zoology. O'Brien SJ (1994) A Role for Molecular Genetics in Biological Conservation. PNAS 91,
5748-5755. Olson SL (1982) The distribution of fused phalanges of the inner toe in the Accipitridae.
Bulletin of the British Ornithologists' Club 102, 8-12. Peters JL (1931) Check-List of Birds of the World Harvard University Press, Cambridge. Posada D, Crandall KA (1998) Modeltest: testing the model of DNA substitution.
Bioinformatics 14, 817-818. Prychitko TM, Moore WS (2000) Comparative evolution of the mitochondrial
cytochrome b gene and nuclear beta-fibrinogen intron 7 in woodpeckers. Molecular Biology and Evolution 17, 1101-1111.
Rambaut A, Drummond AJ (2003) Tracer. http://evolve.zoo.ox.ac.uk/, Oxford. Ramos-Onsins SE, Rozas J (2002) Statistical Properties of New Neutrality Tests Against
Population Growth. Mol Biol Evol 19, 2092-2100. Reed DH, Frankham R (2003) Correlation between Fitness and Genetic Diversity.
Conservation Biology 17, 230-237. Rettig N (1977) In quest of the snatcher. Audubon 79, 26-49. Rettig NL (1978) Breeding behavior of the harpy eagle (Harpia harpyja). Auk 95, 629-
643. Ridgway R (1876) Studies of the American Falconidae. Bulletin of the U.S. Geological
and Geographic Survey Territories 2, 91-182. Riesing MJ, Kruckenhauser L, Gamauf A, Haring E (2003a) Molecular phylogeny of the
genus Buteo (Aves : Accipitridae) based on mitochondrial marker sequences. Molecular Phylogenetics and Evolution 27, 328-342.
Riesing MJ, Kruckenhauser L, Gamauf A, Haring E (2003b) Molecular phylogeny of the genus Buteo (Aves: Accipitridae) based on mitochondrial marker sequences. Molecular Phylogenetics and Evolution 27, 328-342.
Rogers A, Harpending H (1992) Population growth makes waves in the distribution of pairwise genetic differences. Mol Biol Evol 9, 552-569.
Rogers AR (1995) Genetic Evidence for a Pleistocene Population Explosion. Evolution 49, 608-615.
Roques S (2004) Organization and Variation of the Mitochondrial Control Region in Two Vulture Species, Gypaetus barbatus and Neophron percnopterus. Journal of Heredity 95, 332-337.

119
Roques S, Negro JJ (2005) MtDNA genetic diversity and population history of a dwindling raptorial bird, the red kite (Milvus milvus). Biological Conservation 126, 41-50.
Rozas J, Sanchez-DelBarrio JC, Messeguer X, Rozas R (2003) DnaSP, DNA polymorphism analyses by the coalescent and other methods. Bioinformatics 19, 2496-2497.
Ruokonen M, Kvist L (2002) Structure and evolution of the avian mitochondrial control region. Molecular Phylogenetics and Evolution 23, 422-432.
Schmitz OJ, Hambaeck PA, Beckerman AP (2000) Trophic Cascades in Terrestrial Systems: A Review of the Effects of Carnivore Removals on Plants. The American Naturalist 155, 141-153.
Schneider S, Excoffier L (1999) Estimation of Past Demographic Parameters From the Distribution of Pairwise Differences When the Mutation Rates Vary Among Sites: Application to Human Mitochondrial DNA. Genetics 152, 1079-1089.
Seibold I, Helbig AJ (1995) Evolutionary history of New and Old World vultures inferred from nucleotide sequences of the mitochondrial cytochrome b gene. Philosophical Transactions of the Royal Society of London Series B-Biological Sciences 350, 163-178.
Seibold I, Helbig AJ (1996) Phylogenetic relationships of the sea eagles (genus Haliaeetus): Reconstructions based on morphology, allozymes and mitochondrial DNA sequences. Journal of Zoological Systematics and Evolutionary Research 34, 103-112.
Seibold I, Helbig AJ, Meyburg BU, Negro JJ, Wink M (1996) Genetic Differentiation and Molecular Phylogeny of European Aquila Eagles according to Cytochrome b Nucleotide Sequences. In: Eagle Studies (eds. Meyburg BU, Chancellor RD). World Working Group on Birds of Prey (WWGBP), London.
Seltzer GO, Rodbell DT, Baker PA, et al. (2002) Early Warming of Tropical South America at the Last Glacial-Interglacial Transition. Science 296, 1685-1686.
Sergio F, Newton I, Marchesi L (2005) Top predators and biodiversity. Nature 436, 192. Sharpe RB (1874) Catalogue of Birds in the British Museum. Shephard JM, Hughes JM, Catterall CP, Olsen PD (2005) Conservation status of the
White-Bellied Sea-Eagle Haliaeetus leucogaster in Australia determined using mtDNA control region sequence data. Conservation Genetics 6, 413-429.
Sibley CG, Monroe BL (1990) Distribution and Taxonomy of Birds of the World Yale University Press, New Haven.
Sick H (1993) Birds in Brazil Princeton University Press, Princeton. Simmons MP, Reeves A, Davis JI (2004) Character-state space versus rate of evolution
in phylogenetic inference. Cladistics-the International Journal of the Willi Hennig Society 20, 191-204.
Sinclair I, Hockey P, Tarboton W (2002) Birds of Southern Africa, 3 edn. Struik Publishers, Cape Town.
Slatkin M, Hudson RR (1991) Pairwise Comparisons of Mitochondrial DNA Sequences in Stable and Exponentially Growing Populations. Genetics 129, 555-562.
Slud P (1964) The birds of Costa Rica: distribution and ecology. Bulletin of the American Museum of Natural History 128, 63.

120
Sorenson MD, Ast JC, Dimcheff DE, Yuri T, Mindell DP (1999) Primers for a PCR-Based Approach to Mitochondrial Genome Sequencing in Birds and Other Vertebrates. Molecular Phylogenetics and Evolution 12, 105-114.
Sorenson MD, Fleischer RC (1996) Multiple independent transpositions of mitochondrial DNA control region sequences to the nucleus. Proceedings of the National Academy of Sciences of the United States of America 93, 15239-15243.
Spielman D, Brook BW, Frankham R (2004) Most species are not driven to extinction before genetic factors impact them. Proceedings of the National Academy of Sciences of the United States of America 101, 15261-15264.
Stresemann E, Amadon D (1979) Order Falconiformes. In: Check-list of the birds of the world (ed. Peters JL), pp. 271-425. Harvard University Press, Cambridge, Massachusetts.
Strong AM, Sherry TW, Holmes RT (2000) Bird predation on herbivorous insects: indirect effects on sugar maple saplings. Oecologia 125, 370-379.
Swofford DL (2004) PAUP*: Phylogenetic analysis using parsimony (* and other methods. Sinauer, Sunderland, Mass.
Tajima F (1989a) Statistical method for testing the neutral mutational hypothesis by DNA polymorphism. Genetics 123, 585-595.
Tajima F (1989b) The Effect of Change in Population Size on DNA Polymorphism. Genetics 123, 597-601.
Tamura K, Nei M (1993) Estimation of the number of nucleotide substitutions in the control region of mitochondrial DNA in humans and chimpanzees. Molecular Biology and Evolution 10, 512-526.
Terborgh J, Feeley K, Silman M, NuÑEz P, Balukjian B (2006) Vegetation dynamics of predator-free land-bridge islands. Journal of Ecology 94, 253.
Terborgh J, Lopez L, P.V. N, et al. (2001) Ecological Meltdown in Predator-Free Forest Fragments. Science 294, 1923-1926.
Terborgh J, Lopez L, S JT (1997) Bird Communities in Transition: The Lago Guri Islands. Ecology 78, 1494-1501.
Thiollay JM (1994) Family Accipitridae (Hawks and Eagles). In: Handbook of the Birds of the World (eds. del Hoyo J, Elliott A, Sargatal J), pp. 52-205. Lynx Ediciones, Barcelona.
Thurber WA, Serrano JF, Sermeno A, Benitez M (1987) Status of uncommon and previously unreported birds of El Salvador. Western Foundation of Vertebrate Zoology 3, 161.
Vali C, Lohmus A (2004) Nestling characteristics and identification of the lesser spotted eagle Aquila pomarina, greater spotted eagle A-clanga, and their hybrids. Journal of Ornithology 145, 256-263.
Vali U (2002) Mitochondrial pseudo-control region in old world eagles (genus Aquila). Molecular Ecology 11, 2189-2194.
Van Bael SA, Brawn JD, Robinson SK (2003) Birds defend trees from herbivores in a Neotropical forest canopy. PNAS 100, 8304-8307.
Vargas JJ, Whitacre D, Mosquera R, Albuquerque J (2006) Estado y distribucion actual del aguila arpia (Harpia harpyja) en Centro y Sur America. Ornitologia Neotropical 17, 39-55.

121
Wetmore A (1965) The birds of the republic of Panama. Part 1.--Tinamidae (Tinamous) to Rynchopidae (Skimmers).
Wink M, Sauer-Gurth H (2004) Phylogenetic Relationships in Diurnal Raptors based on nucleotide sequences of mitochondrial and nuclear marker genes. In: Raptors Worldwide (eds. Chancellor RD, Meyburg B-U), pp. 483-504. World Working Group on Birds of Prey and Owls, Berlin.
Wink M, Seibold I (1996) Molecular phylogeny of Mediterranean raptors (families Accipitridae and Falconidae). In: Biology and Conservation of Mediterranean raptors (eds. Muntaner J, Mayol J), pp. 335-344. SEO/BirdLife, Madrid.
Xia X (2000) Data analysis in molecular biology and evolution. Kluwer Academic Publishers, Boston.
Zwickl DJ (2006) GARLI, Genetic Algorithm for Rapid Likelihood Inference. www.bio.utexas.edu/grad/zwickl/web/garli.html.

122
Chapter 5
Conclusion
The dissertation research presented here assessed phylogenetic relationships for
birds of prey in the avian family Accipitridae using molecular sequence from two
mitochondrial genes (1047 bases ND2 and 1041 bases cyt-b) and one nuclear intron
(1074 bases Beta-fibrinogen intron 7). Relationships among all 14 previously described
Accipitridae subfamilies and within four subfamilies of eagles (booted eagles, sea eagles,
harpy eagles and snake eagles), two subfamilies of Old World vultures (Gypaetinae and
Aegypiinae) and one subfamily of hawks (Buteoninae) were specifically addressed.
Monophyly of sea eagles (Haliaeetinae) and booted eagles (Aquilinae) was supported;
however, harpy eagles (Harpiinae), snake eagles (Circaetinae), Old World vultures,
hawks (Buteoninae) and kites (Milvinae, Perninae and Elaninae) were found to be non-
monophyletic. Non-monophyly was also found for the polytypic genera Aquila,
Hieraaetus, Spizaetus, Haliaeetus, Leucopternis, Buteogallus, Buteo, Circaetus and
Accipiter.
The phylogenies described here highlight multiple examples of convergent
evolution throughout the Accipitridae family. Many of these convergences have misled
morphological studies and led to non-phylogenetic taxonomy throughout the family. Two
examples from this research involve the harpy eagle group and the gymnogene and crane-
hawk:

123
1. Birds of the Harpy eagle group are some of the largest birds of prey, matched in size
only by the Condors and two of the sea eagles. The four species described as members of
the Harpy Eagle group inhabit primary tropical forest and prey on medium-sized
mammals (e.g. monkeys, sloths, tree kangaroos). Two of the species are Old World in
distribution, the Philippine eagle (Pithecophaga jefferyi) and the New Guinea Harpy
Eagle (Harpyopsis novaeguinea) and two are of the New World, the Harpy eagle (Harpia
harpyja) and the Crested eagle (Morphnus guianensis). From the phylogeny presented in
chapter two it is clear that the Philippine eagle is not closely related to a clade containing
the other three harpy eagles. Thus, the harpy eagle lifestyle and associated
morphological traits have arisen at least twice independently within the Accipitridae.
2. The Gymnogene (Polyboroides typus) has a suite of morphological characteristics
related to preying of young birds in cavity nests. These traits include an extended
circular range of motion of the tarsus, a short outer toe and a weaker bill. Similar traits
are exhibited by the South American crane-hawk (Geranospiza caerulescens), a species
that also preys on nestlings. These two species are not closely related in our analyses,
presenting an example of convergent evolution for specialized limb morphology enabling
predation on cavity nesting species.
In this work, reciprocal monophyly and genetic distances of 2% and greater for
mitochondrial data characterize nominal sister species of Accipitridae vultures and
booted eagles. In chapter two, investigation of subspecies within Hieraaetus fasciatus
and H. morphnoides revealed significant genetic differentiation (7-10% and 2.7-5.8%,
respectively) or non-monophyly supporting recognition of H. spilogaster and H. weiskei

124
as distinctive species. Based on mitochondrial data in chapter three, the four subspecies
of White Hawk (L. albicollis) were not monophyletic: L. a. albicollis forms a clade with
L. polionotus, while L. a. costaricensis, L. a. ghiesbreghti, and L. a. williaminae form a
clade with L. occidentalis. L. occidentalis is currently recognized as a species of
conservation due to dwindling numbers and a restricted distribution. Although lack of
monophyly for this taxon was found, its geographic distance from other closely related
taxa suggests that it may currently be isolated from gene flow. Thus, our results may
reflect incomplete lineage sorting in a group undergoing processes that may lead to
speciation. Further study is needed to evaluate conflicting hypotheses of incomplete
lineage sorting and recent gene flow as they have implications for the species status of
this taxon.
Moderate to high levels of genetic diversity were found for the harpy eagle
(Harpia harpyja) based on 417 bases of the mitochondrial control region from 66 harpy
eagles (chapter four). No strong geographical structure was observed with phylogenetic,
coalescent and network analyses. However, measurable genetic differentiation was
observed between Central and South America and among subgroups within South
America suggesting that geographical barriers such as the Andean mountains and Darien
straits between northern South America and southern Central America have restricted
historical gene flowin the harpy eagle. The estimate of female effective population size
for harpy eagles from the Central American region was an order of magnitude smaller
than that of South American harpy eagles, likely reflecting both the smaller habitat area
available in Central America and the greater recent loss of habitat. Harpy eagles are
considered endangered or extinct throughout much of Central America, but are likely to

125
have experienced less of a detrimental impact in more remote areas of South America.
Higher levels of genetic diversity and a recent population expansion were supported for
harpy eagles of South American origin. Asymmetric gene flow from Central America
into South America suggests that habitat reduction and fragmentation may have driven
Central American birds into southern habitats. The results from this work support
conservation strategies for harpy eagles that maintain gene flow between southern
Central America and South America by preserving connectivity of the mature forest
habitat required by these eagles.
Recommended

![[MP] 02 - Phylogenetics - biologia.campusnet.unito.it · Molecular Phylogenetics Basis of Molecular Phylogenies Overview ¾Phylogenetics Definitions ¾Genetic Variation and Evolution](https://img.pdfslide.net/doc/110x75/5c6216d809d3f238158b4601/mp-02-phylogenetics-molecular-phylogenetics-basis-of-molecular-phylogenies.jpg)


![Diurnal and Nocturnal Animals. Diurnal Animals Diurnal is a tricky word! Let’s all say that word together. Diurnal [dahy-ur-nl] A diurnal animal is an](https://img.pdfslide.net/doc/110x75/56649dda5503460f94ad083f/diurnal-and-nocturnal-animals-diurnal-animals-diurnal-is-a-tricky-word-lets.jpg)