Monoclonal Antibody Characterization on Q Exactive and Oribtrap Elite
Yi Zhang, Ph.D Senior Proteomic Marketing Specialist Oct. 12, 2011
2
Outline
• Orbitrap Mass Spectrometer in mAb Characterization
• Intact Protein Analysis on Q Exactive Using Protein Deconvolution
• Top-Down Analysis of mAb Light Chain on Orbitrap Elite
• Conclusion
3
Mass Spectrometry in mAb Characterization
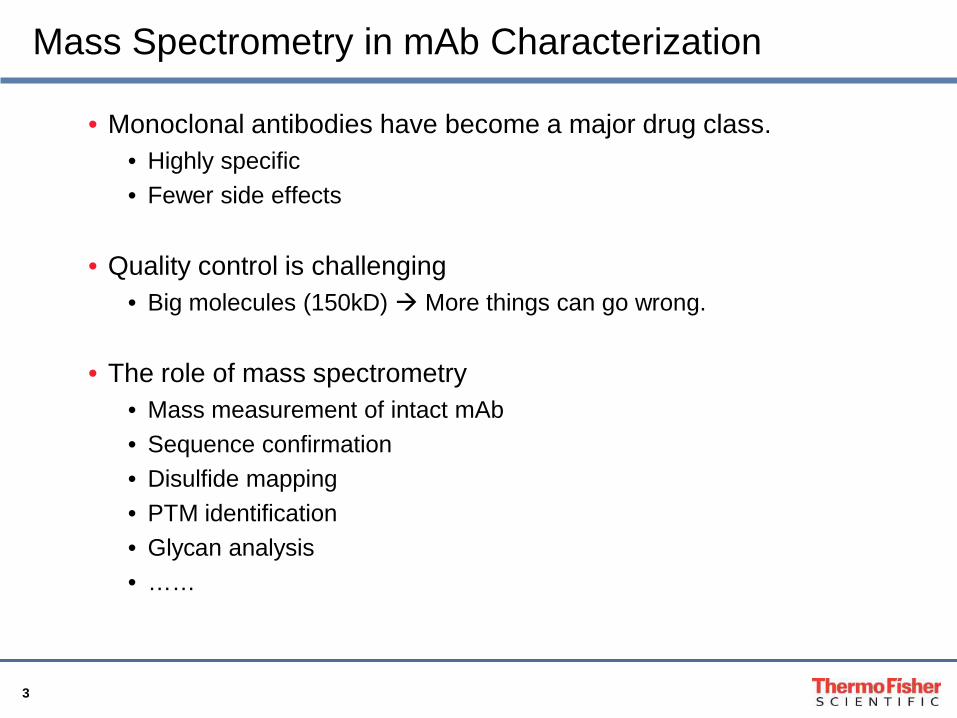
• Monoclonal antibodies have become a major drug class. • Highly specific • Fewer side effects
• Quality control is challenging
• Big molecules (150kD) More things can go wrong.
• The role of mass spectrometry • Mass measurement of intact mAb • Sequence confirmation • Disulfide mapping • PTM identification • Glycan analysis • ……

4
Challenges of Protein Detection in Orbitrap Analyzer
0 1000 2000 3000 t, ms
Myoglobin (16.9 kD) z: +16
0 1000 2000 3000 t, ms
0 1000 2000 3000 t, ms 0
Transferrin (78kD) z: +40
Enolase (46kD) z: +24
Solutions: • Higher Vacuum • Hardware Innovation • Software Innovation
Fast Signal Decay: • Collision of ions • Fragmentation of ions • De-phasing of ion packets
5
Hardware Inovations in New Orbitrap Analyzer
0 1 2 3 4 5 6 7 8 9 10m/z
0
5
10
15
20
25
30
35
40
45
50
55
60
65
70
75
80
85
90
95
100
Rela
tive I
nten
sity
6.56290.3585
6.4464
6.40610.5010
6.34466.3241
6.2629
6.24326.10036.0396
5.83635.77555.63274.96222.14822.0607 4.51544.08912.18082.0204
3.68333.52083.2571 9.90649.55888.95501.1884 8.84477.86337.2506
0 1 2 3 4 5 6 7 8 9 10m/z
0
5
10
15
20
25
30
35
40
45
50
55
60
65
70
75
80
85
90
95
100
Relat
ive In
tensit
y
0.1758
0.3435
0.4006
0.5435 4.7990 7.63040.6147 4.32664.0796 7.36875.5774 10.39.58811.0611 8.87952.9427 6.8835 7.7499
ms ms
8.9 ms < 0.6 ms
Exactive Q Exactive & Orbitrap Elite
Improved Detector Hardware Reduces Delay in Transient Acquisition
See aslo ASMS Poster MP093 Oliver Lange et al.
0 1000 2000 3000 t, ms 0
Transferrin (78kD) z: +40
<10ms Efficient Capture of Initial Transient
Stronger Signal Better Mass Accuracy
6
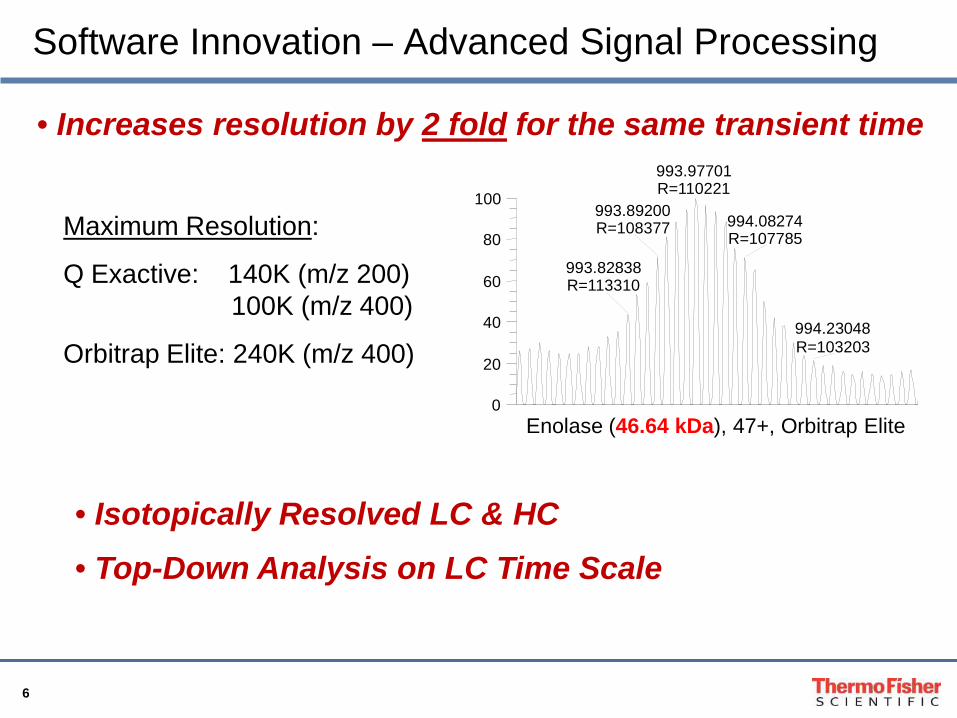
Software Innovation – Advanced Signal Processing
• Increases resolution by 2 fold for the same transient time
0
20
40
60
80
100
993.97701 R=110221
993.89200 R=108377 994.08274
R=107785
993.82838 R=113310
994.23048 R=103203
Maximum Resolution:
Q Exactive: 140K (m/z 200) 100K (m/z 400)
Orbitrap Elite: 240K (m/z 400)
Enolase (46.64 kDa), 47+, Orbitrap Elite
• Isotopically Resolved LC & HC • Top-Down Analysis on LC Time Scale
7
Outline
• Orbitrap Mass Spectrometer in mAb Characterization
• Intact Protein Analysis on Q Exactive Using Protein Deconvolution
• Top Down Analysis of mAb Light Chain on Orbitrap Elite
• Conclusion
8
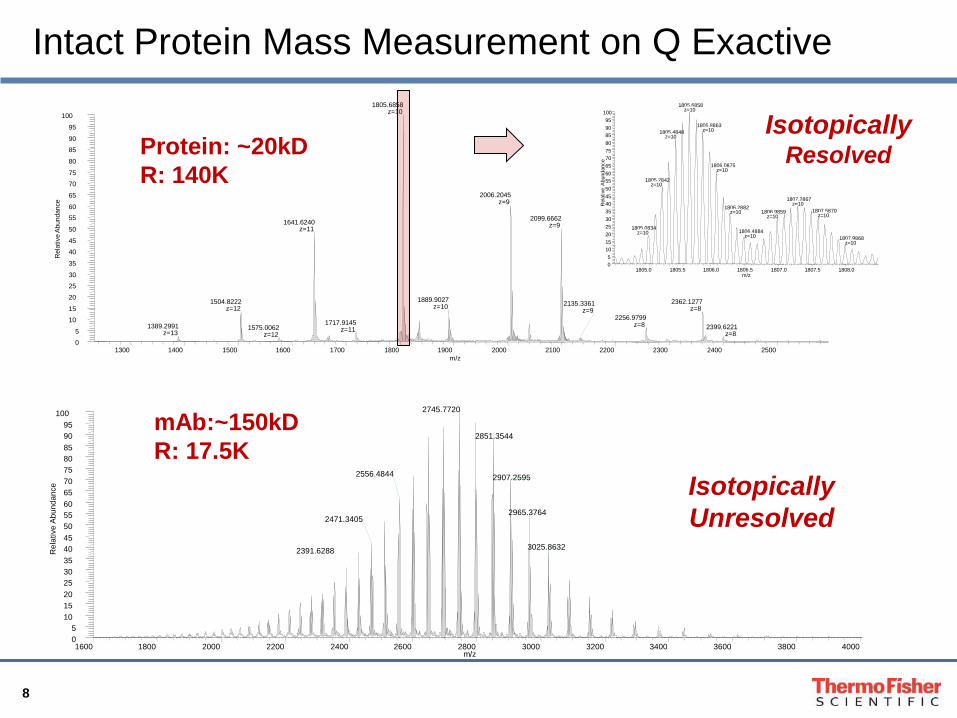
Intact Protein Mass Measurement on Q Exactive
1600 1800 2000 2200 2400 2600 2800 3000 3200 3400 3600 3800 4000 m/z
0 5
10 15 20 25 30 35 40 45 50 55 60 65 70 75 80 85 90 95
100
Rel
ativ
e Ab
unda
nce
2745.7720
2851.3544
2907.2595 2556.4844
2965.3764 2471.3405
3025.8632 2391.6288
1300 1400 1500 1600 1700 1800 1900 2000 2100 2200 2300 2400 2500 m/z
0 5
10 15
20
25 30
35
40 45
50
55 60
65
70 75
80
85 90
95
100
Rel
ativ
e A
bund
ance
1805.6858 z=10
2006.2045 z=9
2099.6662 z=9 1641.6240
z=11
1889.9027 z=10
1504.8222 z=12
2362.1277 z=8
2256.9799 z=8 1717.9145
z=11 1389.2991 z=13
2399.6221 z=8
2135.3361 z=9
1575.0062 z=12
1805.0 1805.5 1806.0 1806.5 1807.0 1807.5 1808.0 m/z
0 5
10 15 20 25 30 35 40 45 50 55 60 65 70 75 80 85 90 95
100
Rel
ativ
e A
bund
ance
1805.6858 z=10
1805.8863 z=10 1805.4848
z=10
1806.0875 z=10
1805.2842 z=10
1807.2867 z=10
1806.2882 z=10 1807.5870
z=10 1806.9859
z=10
1805.0834 z=10 1806.4884
z=10 1807.9868 z=10
Protein: ~20kD R: 140K
mAb:~150kD R: 17.5K
Isotopically Resolved
Isotopically Unresolved

9
Protein Deconvolution 1.0
• Workflow software for intact protein mass determination
• Includes 2 deconvolution algorithms: • Xtract for isotopically resolved proteins • ReSpectTM for isotopically unresolved proteins (e.g. IgG)
• As of today, the software is feature complete and undergoing testing
• Target release date: Late October, early November
10
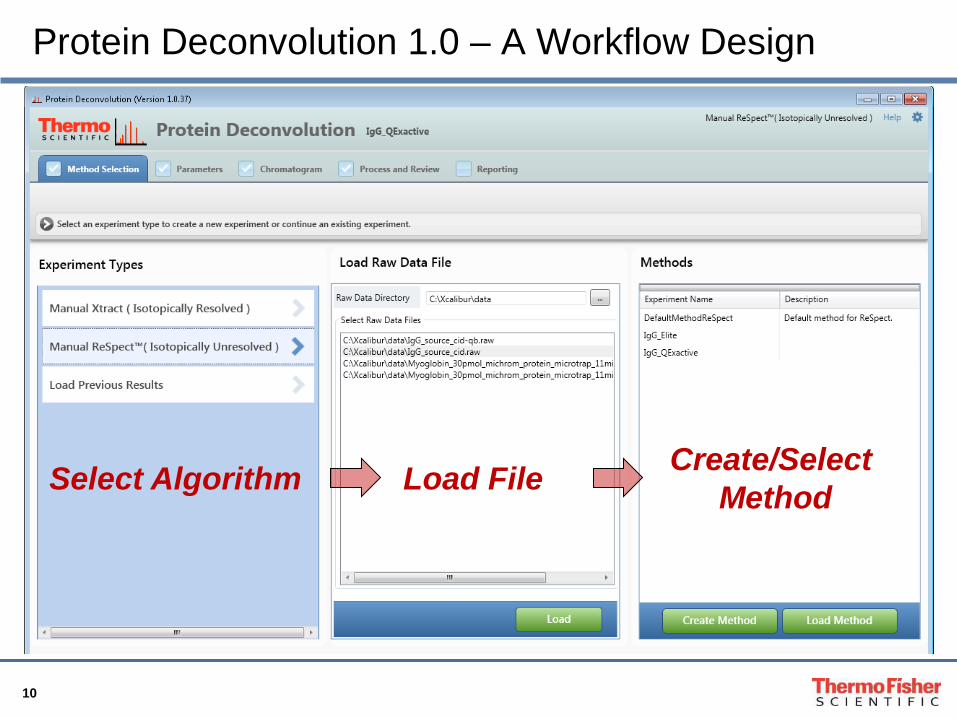
Protein Deconvolution 1.0 – A Workflow Design
Select Algorithm Load File Create/Select Method
11
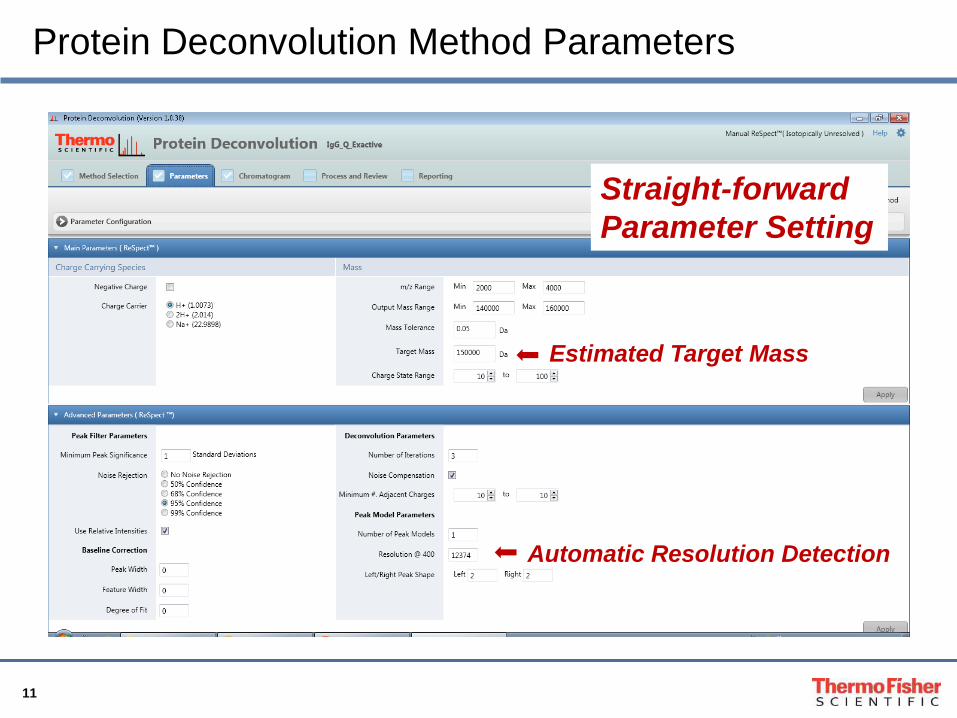
Protein Deconvolution Method Parameters
Straight-forward Parameter Setting
Automatic Resolution Detection
Estimated Target Mass
12
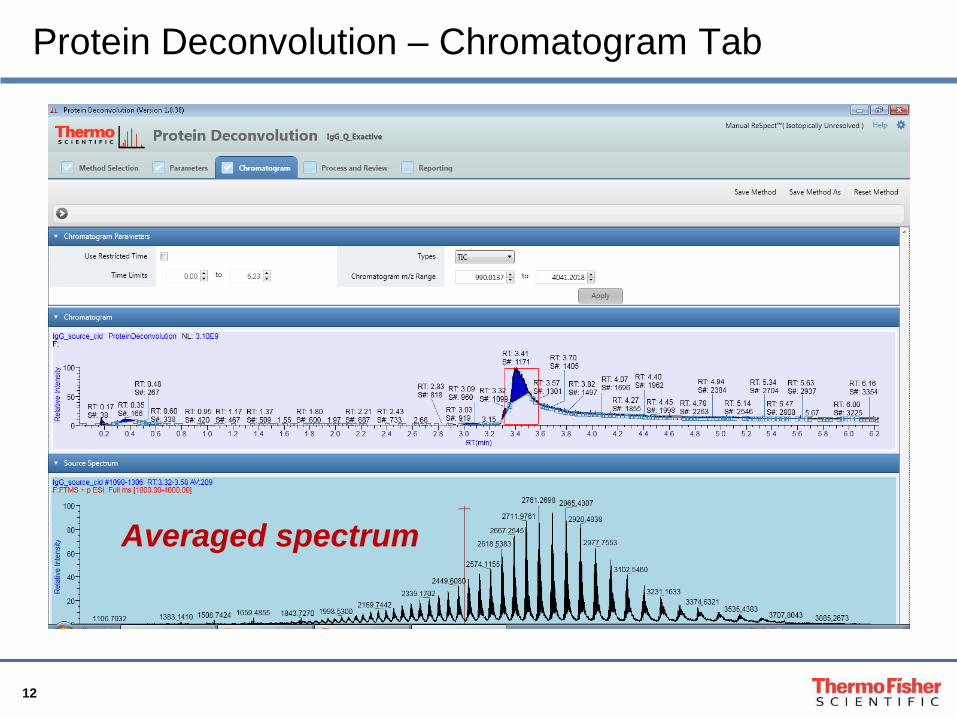
Protein Deconvolution – Chromatogram Tab
Averaged spectrum
13
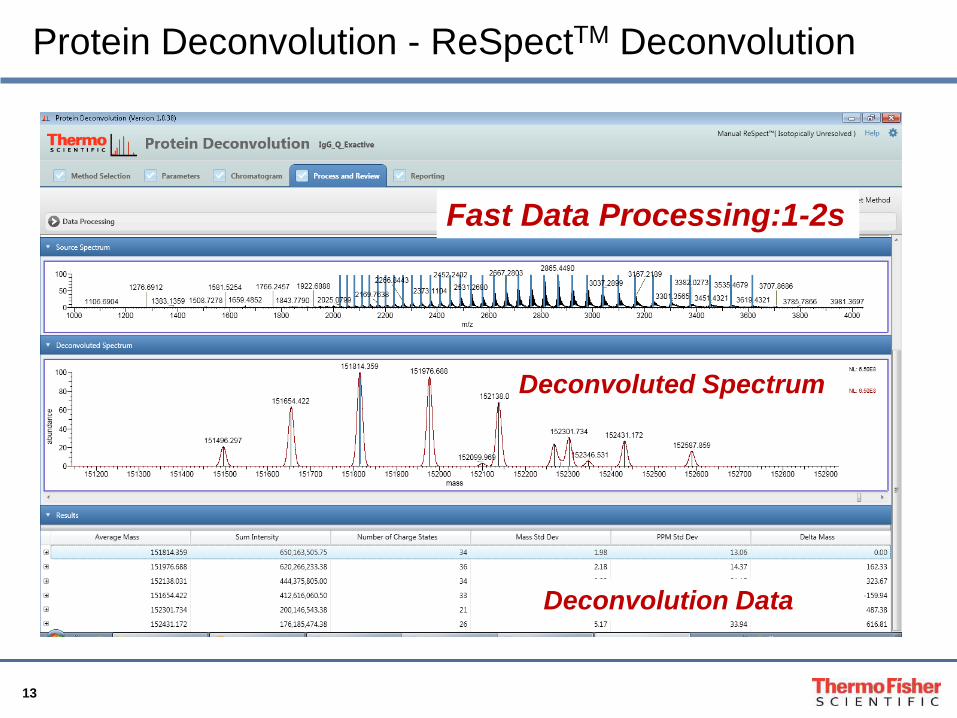
Protein Deconvolution - ReSpectTM Deconvolution
Fast Data Processing:1-2s
Deconvoluted Spectrum
Deconvolution Data
14
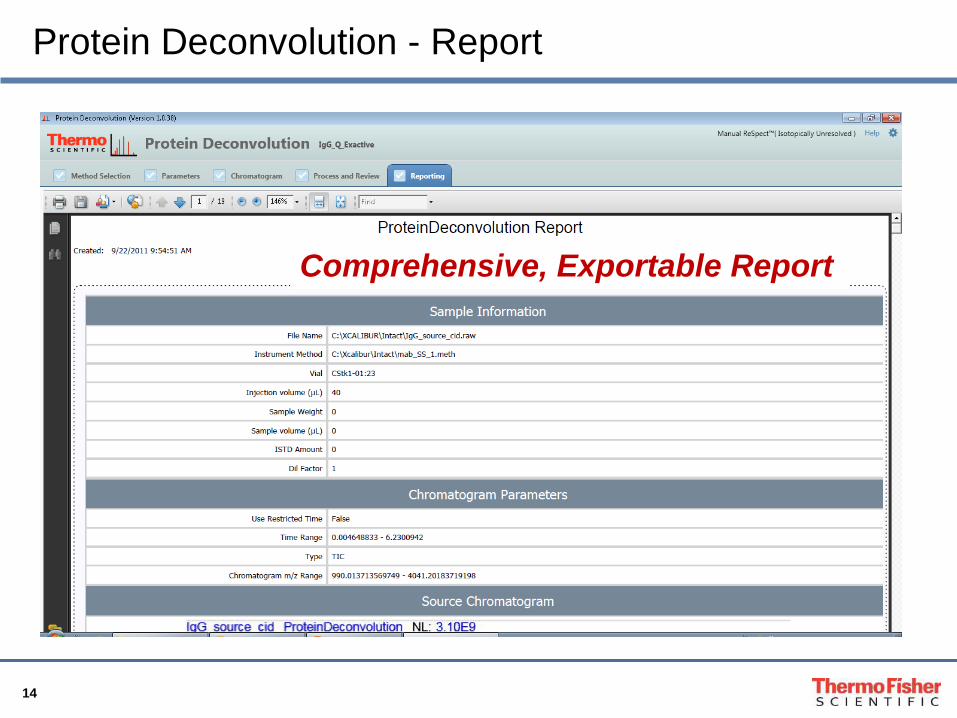
Protein Deconvolution - Report
Comprehensive, Exportable Report
15
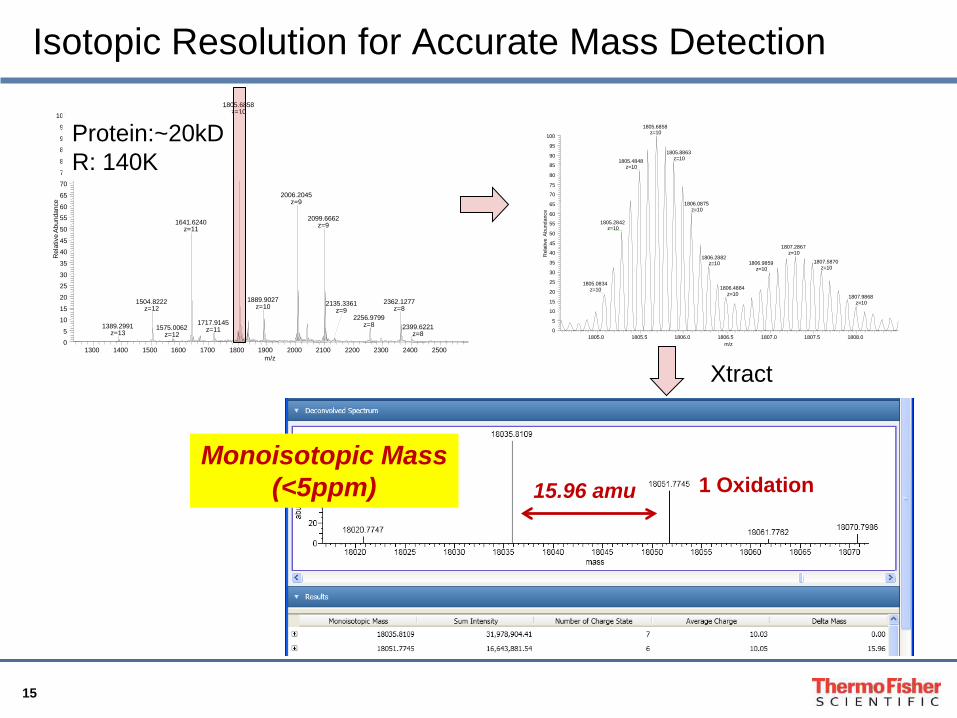
Isotopic Resolution for Accurate Mass Detection
1300 1400 1500 1600 1700 1800 1900 2000 2100 2200 2300 2400 2500 m/z
0 5
10 15
20
25 30
35
40 45
50
55 60
65
70 75
80
85 90
95
100
Rel
ativ
e A
bund
ance
1805.6858 z=10
2006.2045 z=9
2099.6662 z=9 1641.6240
z=11
1889.9027 z=10
1504.8222 z=12
2362.1277 z=8
2256.9799 z=8 1717.9145
z=11 1389.2991 z=13
2399.6221 z=8
2135.3361 z=9
1575.0062 z=12
1805.0 1805.5 1806.0 1806.5 1807.0 1807.5 1808.0 m/z
0
5
10
15
20
25
30
35
40
45
50
55
60
65
70
75
80
85
90
95
100
Rel
ativ
e A
bund
ance
1805.6858 z=10
1805.8863 z=10 1805.4848
z=10
1806.0875 z=10
1805.2842 z=10
1807.2867 z=10
1806.2882 z=10 1807.5870
z=10 1806.9859
z=10
1805.0834 z=10 1806.4884
z=10 1807.9868 z=10
Protein:~20kD R: 140K
Xtract
1 Oxidation Monoisotopic Mass
(<5ppm) 15.96 amu
16
1600 1800 2000 2200 2400 2600 2800 3000 3200 3400 3600 3800 4000 m/z
0 5
10 15 20 25 30 35 40 45 50 55 60 65 70 75 80 85 90 95
100
Rel
ativ
e Ab
unda
nce
2745.7720
2851.3544
2907.2595 2556.4844
2965.3764 2471.3405
3025.8632 2391.6288
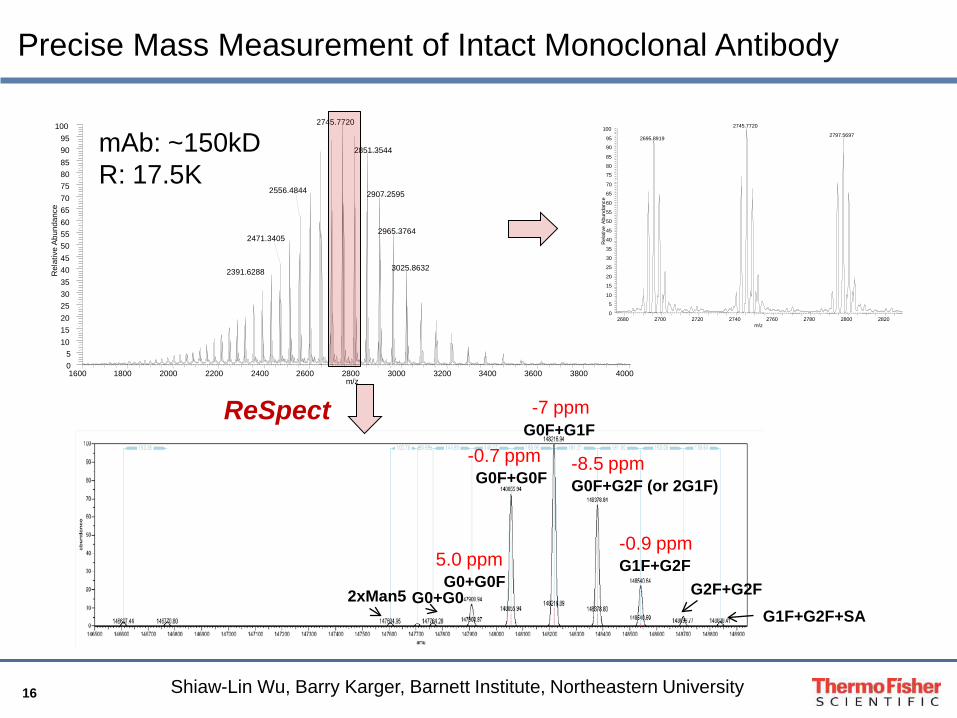
-7 ppm G0F+G1F
G0F+G0F G0F+G2F (or 2G1F)
G1F+G2F G2F+G2F G0+G0F
G0+G0 2xMan5 G1F+G2F+SA
5.0 ppm
-0.7 ppm -8.5 ppm
-0.9 ppm
2680 2700 2720 2740 2760 2780 2800 2820 m/z
0
5
10
15
20
25
30
35
40
45
50
55
60
65
70
75
80
85
90
95
100
Rel
ativ
e A
bund
ance
2745.7720
2797.5697 2695.8919
Precise Mass Measurement of Intact Monoclonal Antibody
mAb: ~150kD R: 17.5K
ReSpect
Shiaw-Lin Wu, Barry Karger, Barnett Institute, Northeastern University

17
Accurate Mass Measurement from a Single Charge State
2835 2840 2845 2850 2855 2860 2865 2870 m/z
G0F/G1F Δ= 7.0 ppm
G0F/G0F Δ= 0.1 ppm
G0/G0F Δ= 10 ppm
G1F/G1F or G0F/G2F Δ = 10 ppm
G1F/G2F Δ = 8 ppm
52+
18
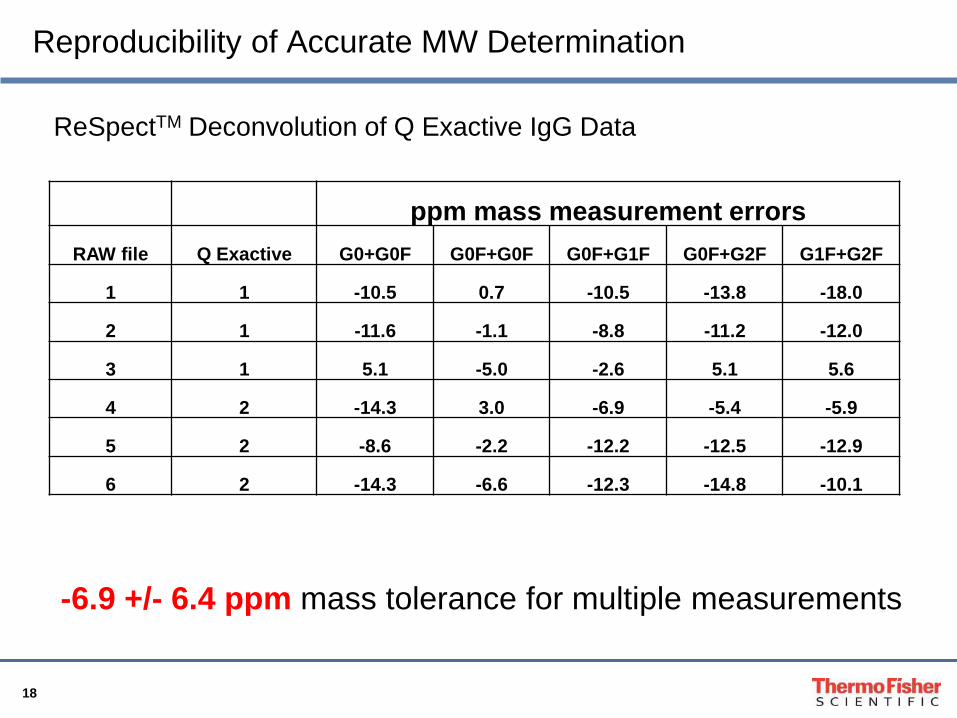
Reproducibility of Accurate MW Determination
ppm mass measurement errors RAW file Q Exactive G0+G0F G0F+G0F G0F+G1F G0F+G2F G1F+G2F
1 1 -10.5 0.7 -10.5 -13.8 -18.0
2 1 -11.6 -1.1 -8.8 -11.2 -12.0
3 1 5.1 -5.0 -2.6 5.1 5.6
4 2 -14.3 3.0 -6.9 -5.4 -5.9
5 2 -8.6 -2.2 -12.2 -12.5 -12.9
6 2 -14.3 -6.6 -12.3 -14.8 -10.1
-6.9 +/- 6.4 ppm mass tolerance for multiple measurements
ReSpectTM Deconvolution of Q Exactive IgG Data
19
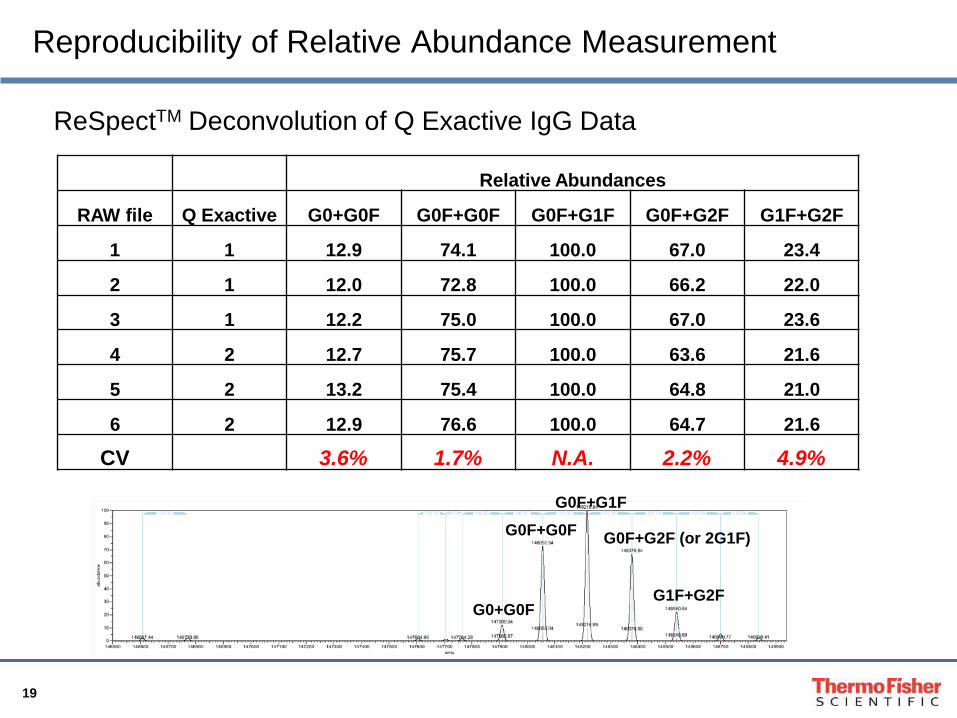
Reproducibility of Relative Abundance Measurement
ReSpectTM Deconvolution of Q Exactive IgG Data
Relative Abundances
RAW file Q Exactive G0+G0F G0F+G0F G0F+G1F G0F+G2F G1F+G2F
1 1 12.9 74.1 100.0 67.0 23.4
2 1 12.0 72.8 100.0 66.2 22.0
3 1 12.2 75.0 100.0 67.0 23.6
4 2 12.7 75.7 100.0 63.6 21.6
5 2 13.2 75.4 100.0 64.8 21.0
6 2 12.9 76.6 100.0 64.7 21.6
CV 3.6% 1.7% N.A. 2.2% 4.9%
G0F+G1F G0F+G0F G0F+G2F (or 2G1F)
G1F+G2F G0+G0F
20
Summary of Q Exactive and Protein Deconvolution 1.0
• Q Exactive accurately and reproducibly measures the mass of intact antibody to ~7ppm.
• The new Protein Deconvolution software enables fast and accurate calculation of the intact mass of mAbs.
• Q Exactive is also a powerful HR/AM mass spectrometer for routine peptide identification and peptide mapping.
• This LC/MS-based workflow solution provides a robust QC solution for biopharmaceutical products.
21
Outline
• Orbitrap Mass Spectrometer in mAb Characterization
• Intact Protein Analysis on Q Exactive Using Protein Deconvolution
• Top-Down Analysis of mAb Light Chain on Orbitrap Elite
• Conclusion

22
Orbitrap Elite: Velos Pro Iontrap + High Field Orbitrap
Key Features for Intact Protein Analysis:
• Higher Resolution (240,000 at 1Hz)
• Faster Scan Speed • 4X more scans at same resolution
• Multiple Fragmentation Mechanism • CID • HCD • ETD
Case Study: Top-Down Analysis of mAb Light Chain
23
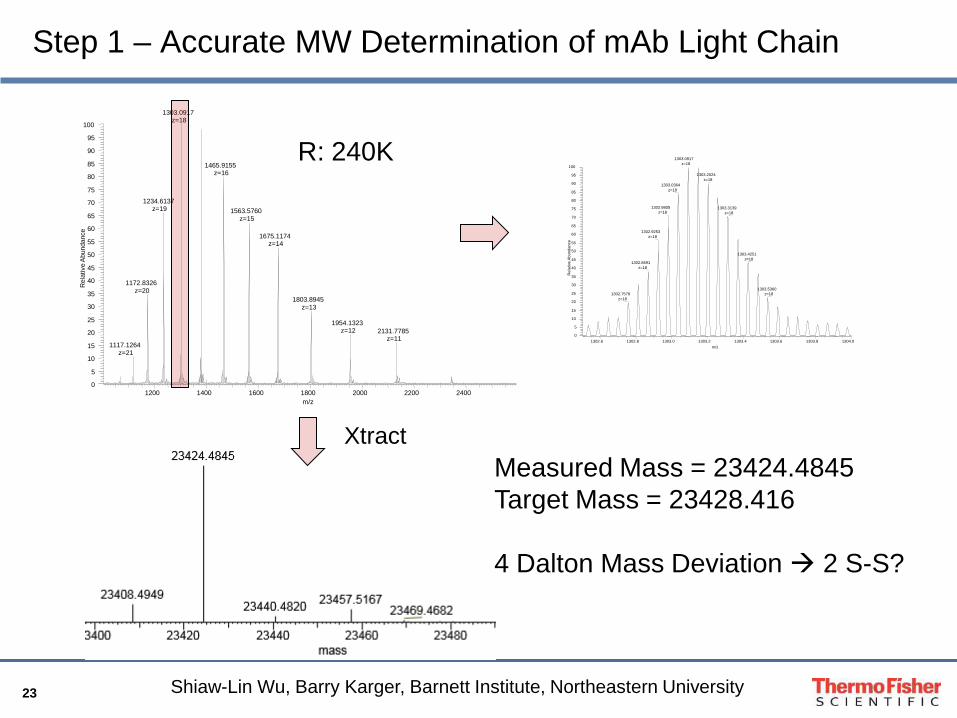
Step 1 – Accurate MW Determination of mAb Light Chain
1200 1400 1600 1800 2000 2200 2400 m/z
0
5
10
15
20
25
30
35
40
45
50
55
60
65
70
75
80
85
90
95
100
Rel
ativ
e A
bund
ance
1303.0917 z=18
1465.9155 z=16
1234.6137 z=19 1563.5760
z=15
1675.1174 z=14
1172.8326 z=20
1803.8945 z=13
1954.1323 z=12 2131.7785
z=11 1117.1264
z=21
1302.6 1302.8 1303.0 1303.2 1303.4 1303.6 1303.8 1304.0 m/z
0
5
10
15
20
25
30
35
40
45
50
55
60
65
70
75
80
85
90
95
100
Rel
ativ
e A
bund
ance
1303.0917 z=18
1303.2024 z=18
1303.0364 z=18
1303.3139 z=18
1302.9805 z=18
1302.9253 z=18
1303.4251 z=18
1302.8691 z=18
1303.5360 z=18 1302.7578
z=18
Xtract Measured Mass = 23424.4845 Target Mass = 23428.416 4 Dalton Mass Deviation 2 S-S?
R: 240K
Shiaw-Lin Wu, Barry Karger, Barnett Institute, Northeastern University
24
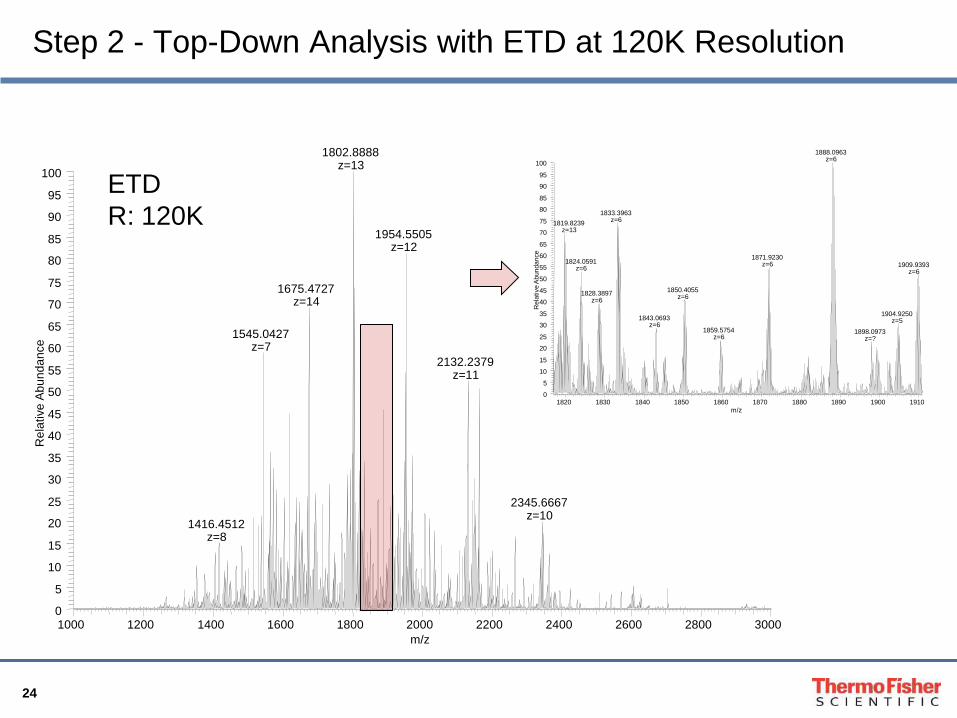
Step 2 - Top-Down Analysis with ETD at 120K Resolution
1000 1200 1400 1600 1800 2000 2200 2400 2600 2800 3000 m/z
0
5
10
15
20
25
30
35
40
45
50
55
60
65
70
75
80
85
90
95
100
Rel
ativ
e A
bund
ance
1802.8888 z=13
1954.5505 z=12
1675.4727 z=14
1545.0427 z=7
2132.2379 z=11
2345.6667 z=10
1416.4512 z=8
ETD R: 120K
1820 1830 1840 1850 1860 1870 1880 1890 1900 1910 m/z
0
5
10
15
20
25
30
35
40
45
50
55
60
65
70
75
80
85
90
95
100
Rel
ativ
e A
bund
ance
1888.0963 z=6
1833.3963 z=6 1819.8239
z=13
1871.9230 z=6 1824.0591
z=6 1909.9393 z=6
1850.4055 z=6 1828.3897
z=6
1904.9250 z=5 1843.0693
z=6 1859.5754
z=6 1898.0973
z=?
25
p @ [ ]
500 1000 1500 2000 2500 3000m/z
0
5
10
15
20
25
30
35
40
45
50
55
60
65
70
75
80
85
90
95
100
Rel
ativ
e A
bund
ance
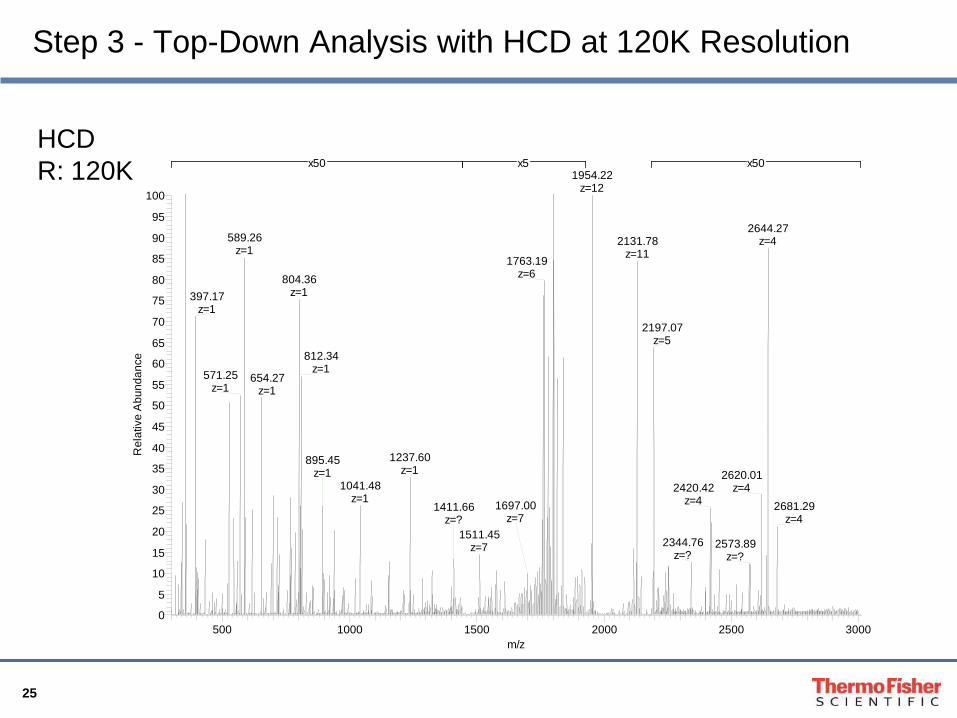
1954.22z=12
2131.78z=111763.19
z=6
1511.45z=7
1697.00z=7
589.26z=1
2644.27z=4
804.36z=1397.17
z=12197.07
z=5812.34
z=1571.25z=1
654.27z=1
1237.60z=1 2620.01
z=41041.48z=1
2420.42z=4
895.45z=1
2681.29z=4
1411.66z=?
2344.76z=?
2573.89z=?
x50 x5 x50
Step 3 - Top-Down Analysis with HCD at 120K Resolution
HCD R: 120K
26
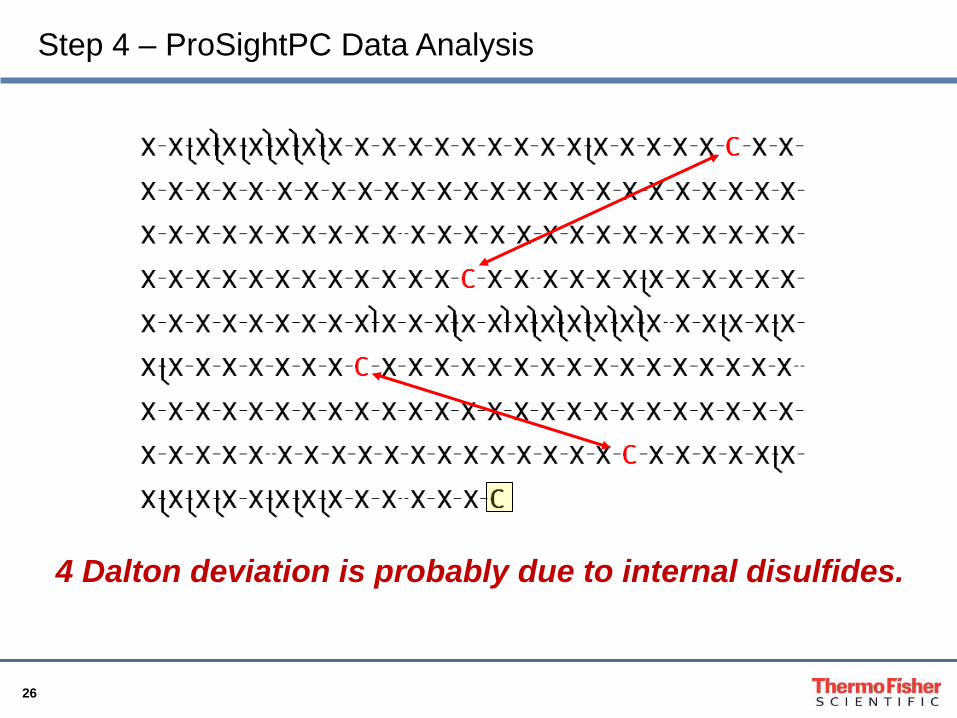
4 Dalton deviation is probably due to internal disulfides.
Step 4 – ProSightPC Data Analysis
27
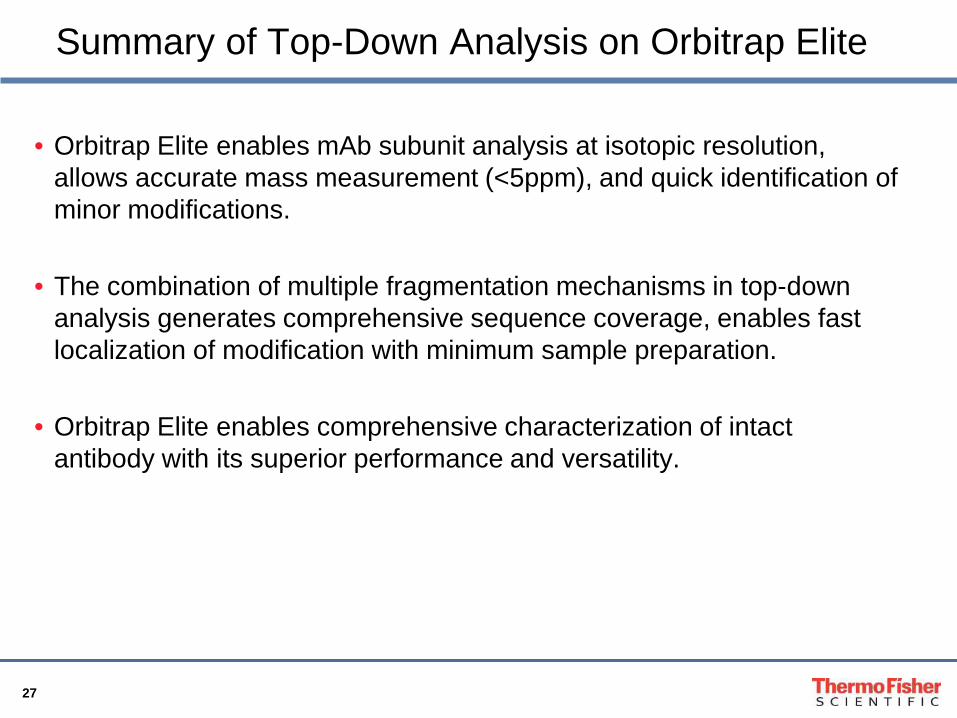
Summary of Top-Down Analysis on Orbitrap Elite
• Orbitrap Elite enables mAb subunit analysis at isotopic resolution, allows accurate mass measurement (<5ppm), and quick identification of minor modifications.
• The combination of multiple fragmentation mechanisms in top-down analysis generates comprehensive sequence coverage, enables fast localization of modification with minimum sample preparation.
• Orbitrap Elite enables comprehensive characterization of intact antibody with its superior performance and versatility.

28
HR/AM Intact Mass Measurement Workflow
On-line Desalting: HPLC Separation
Data Analysis: Protein Deconvolution 1.0 with ReSpector Xtract to zero charge accurate mass
Sample Analysis: Orbitrap Elite or Q Exactive High RP for resolution of proteins ~50k low RP for larger proteins
1311.0 1311.5 1312.0 1312.5m/z
0
10
20
30
40
50
60
70
80
90
100
Rel
ativ
e A
bund
ance
z=?
1311.87212R=70792
z=?1311.54737
R=68130z=?
1311.98174R=69867
z=?
1311.43967R=58977
z=? 1312.09147R=67084
z=?
1312.20087R=56981
z=?1311.31799
R=88597z=?
1310.98824R=45346
z=?
1312.42258R=47666
z=?
1312.64646R=43558
z=?
23565 23570 23575 23580 23585 23590m/z
0
10
20
30
40
50
60
70
80
90
100
Rel
ativ
e A
bund
ance
23578.58636
23580.66451
2000 2500 3000 3500m/z
0
10
20
30
40
50
60
70
80
90
100
Rel
ativ
e A
bund
ance
2997.31777
2920.44812
2664.49830
2178.40685
3535.704273619.47065
Solutions RSLC nano/cap ProSwift RP columns
Solutions Orbitrap hybrid family Q Exactive
Solutions ReSpect(unresolved spectra) Xtract (resolved spectra)
Exact Mass Determination Solutions

29
Conclusion
Thermo Fisher provides
complete LC/MS-based workflow solutions
for intact protein analysis
and comprehensive protein characterization.

30
Acknowledgement
• Q Exactive R&D Team • Orbitrap Elite R&D Team • San Jose Proteomics Marketing Team • San Jose Demo Lab
• Barnett Institute, Northeastern University
• Shiaw-Lin Wu • Barry Karger
31
Thank You!
Recommended