1
Monthly Climate Review
• Once a month• April 2013 (FMA maps, a few)• Climate, CO2, MSU, OCN-updates, ENSO
forecast (many tools)• Soil Moisture, CA-SST• Why –ve (N)AO? Quiz
Presenter: Huug van den Dool, May, 8, 2013
2
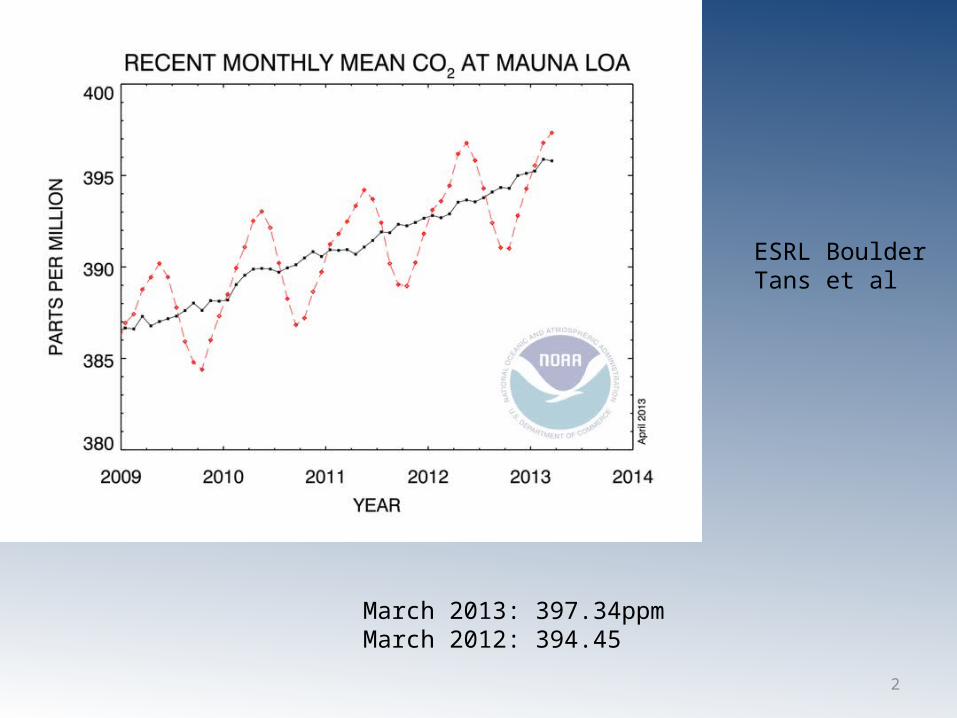
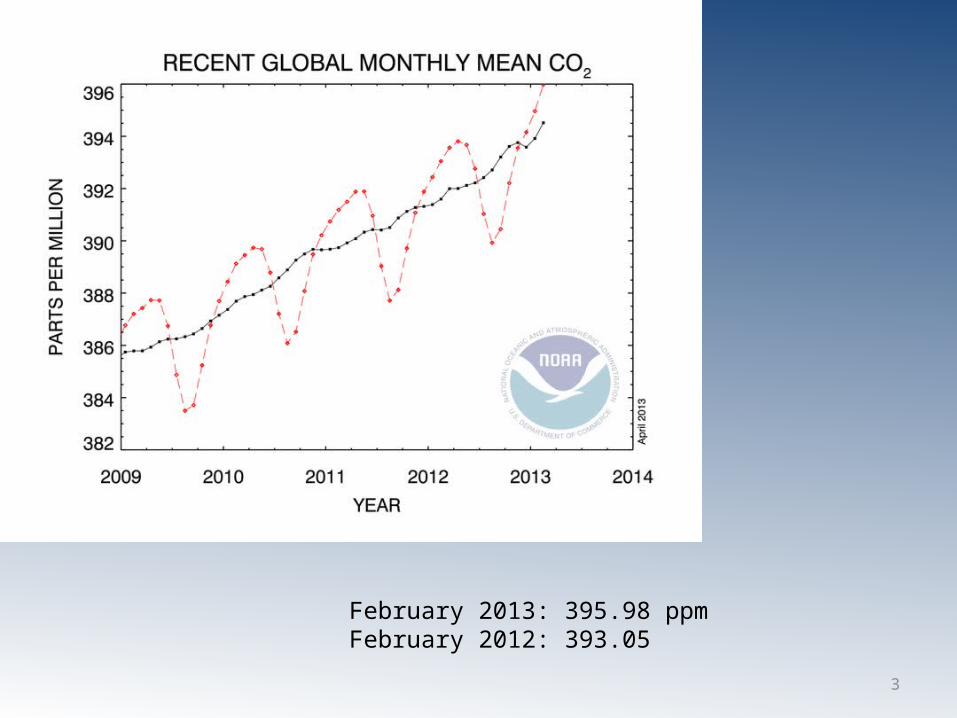
March 2013: 397.34ppmMarch 2012: 394.45
ESRL BoulderTans et al
3
February 2013: 395.98 ppmFebruary 2012: 393.05
4
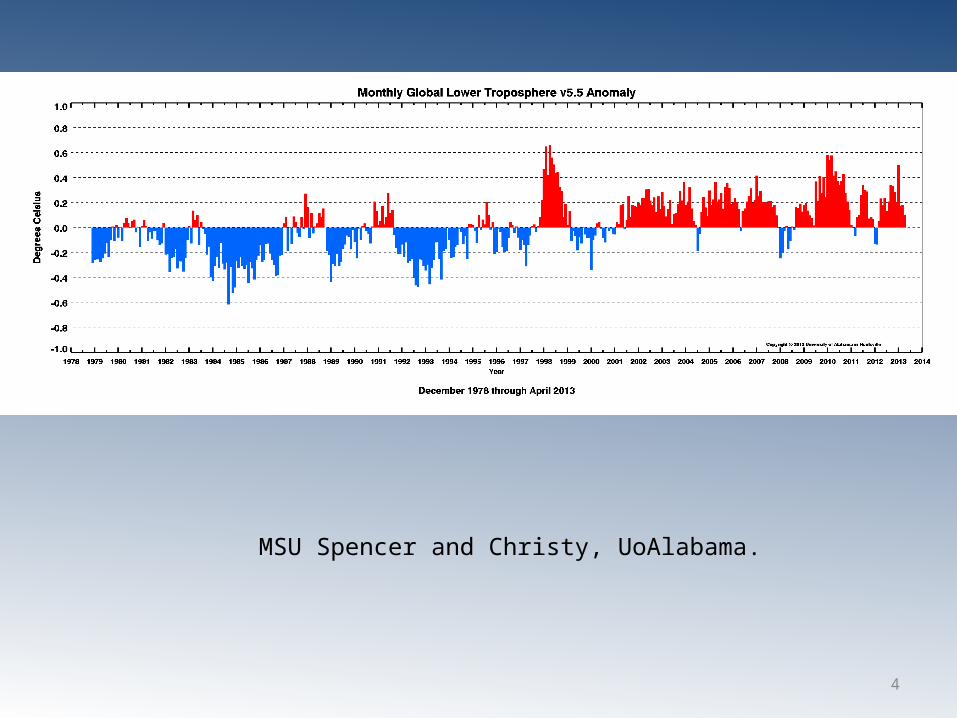
MSU Spencer and Christy, UoAlabama.
5
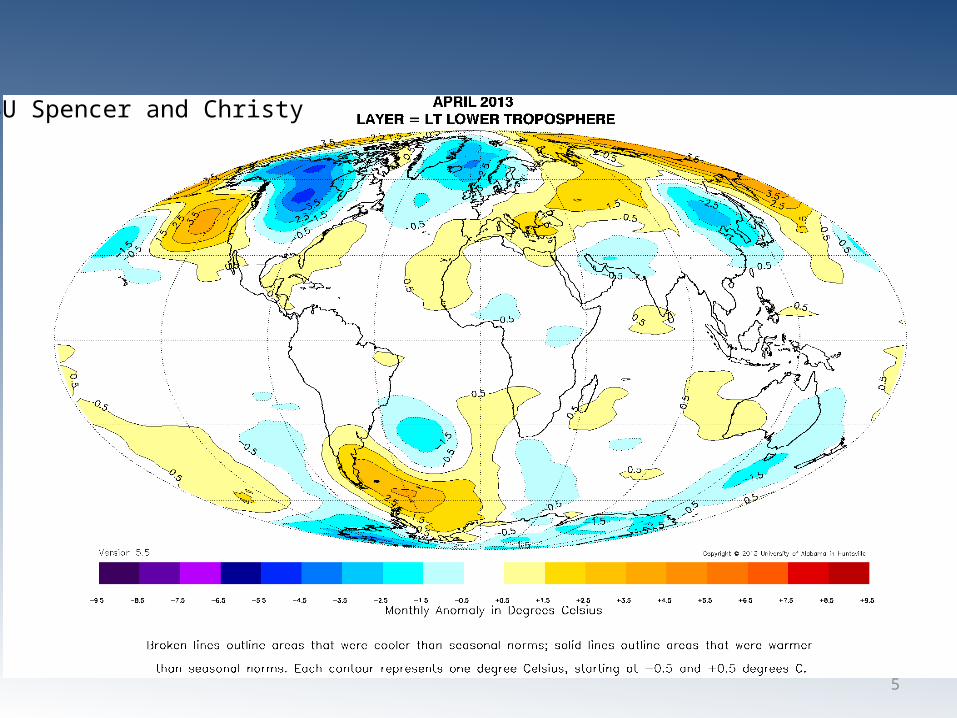
MSU Spencer and Christy
6
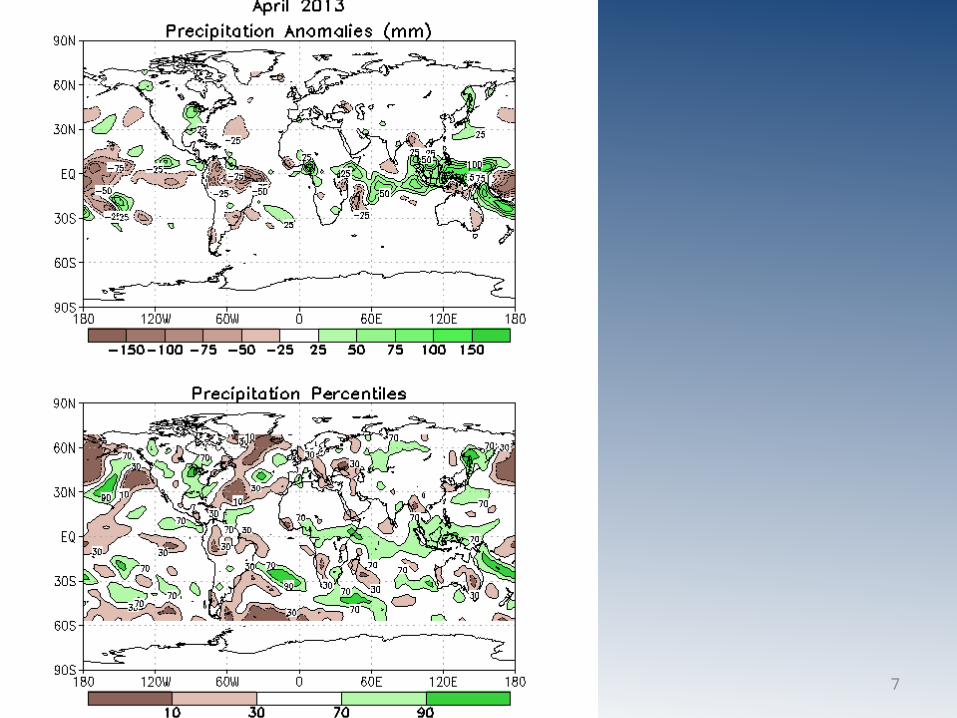
7
8
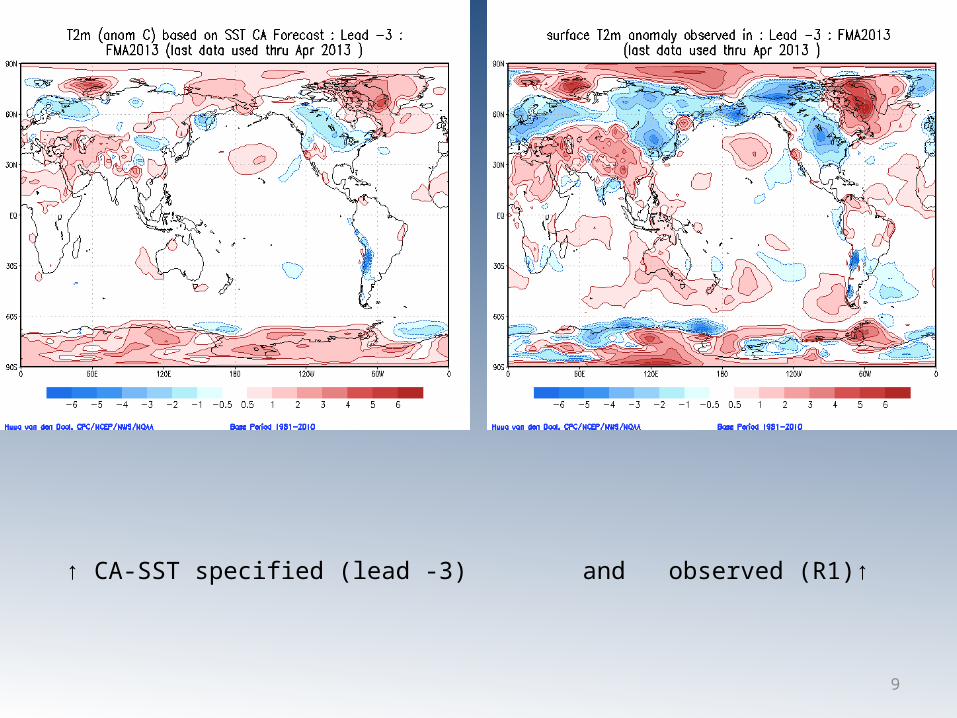
9
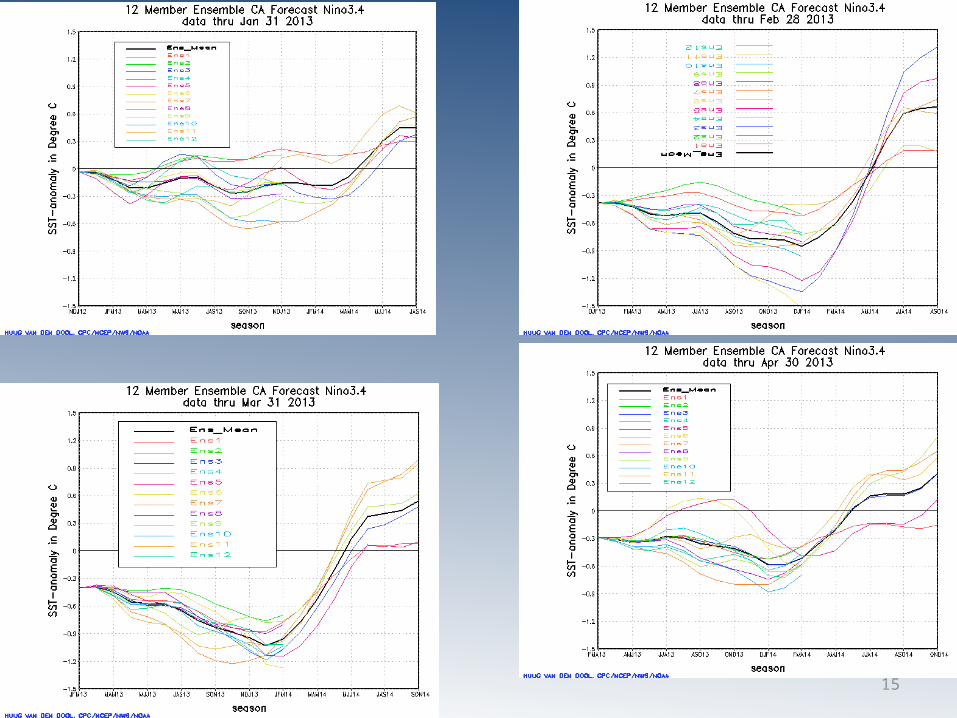
↑ CA-SST specified (lead -3) and observed (R1)↑
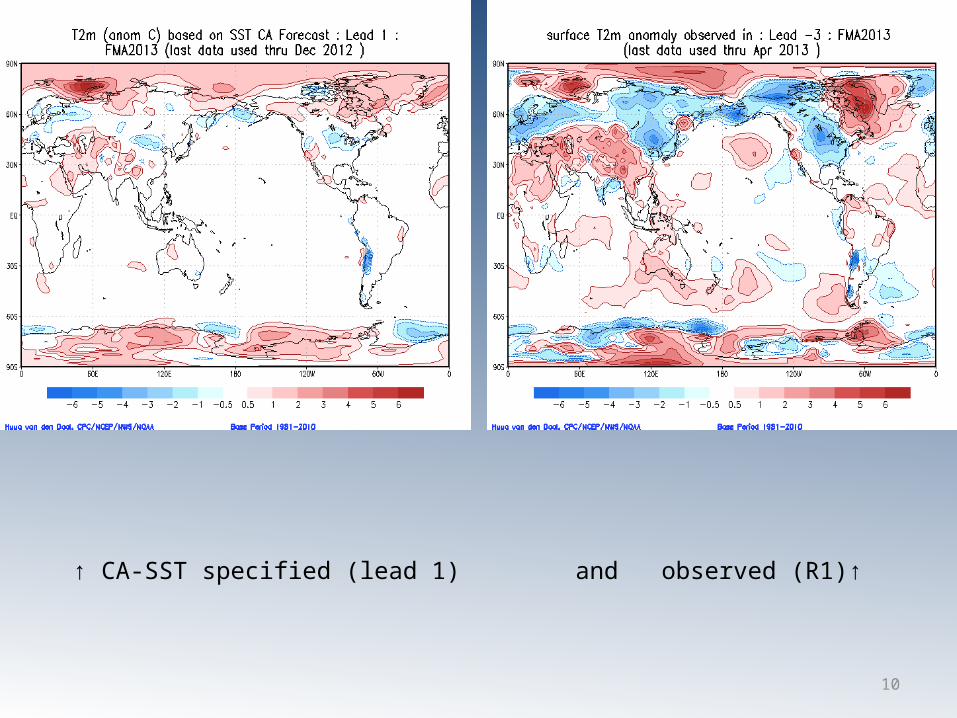
10
↑ CA-SST specified (lead 1) and observed (R1)↑
11
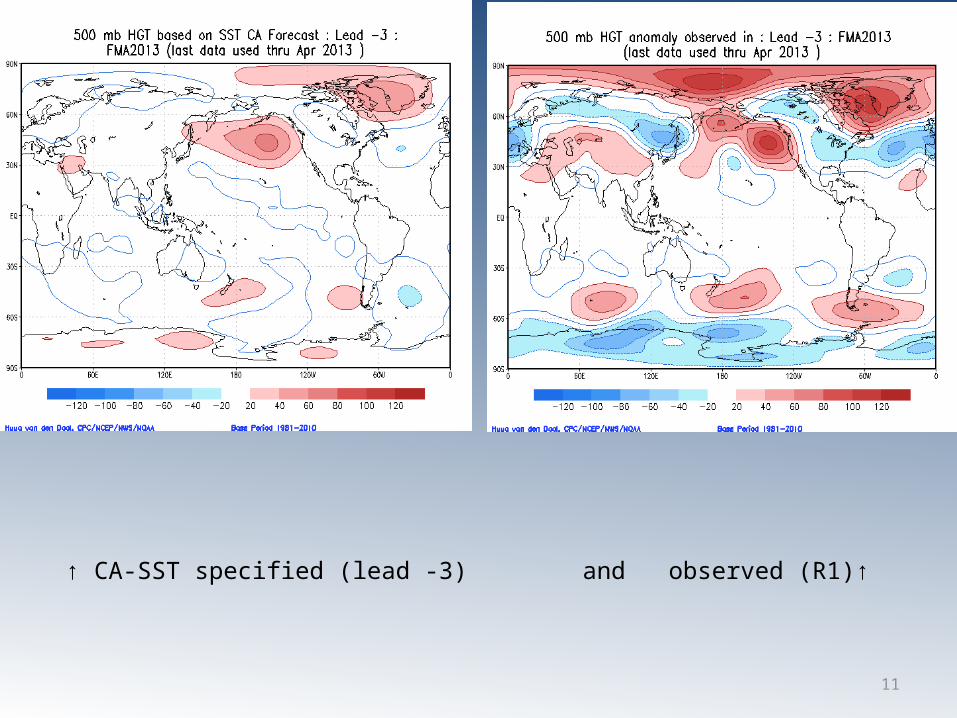
↑ CA-SST specified (lead -3) and observed (R1)↑
12
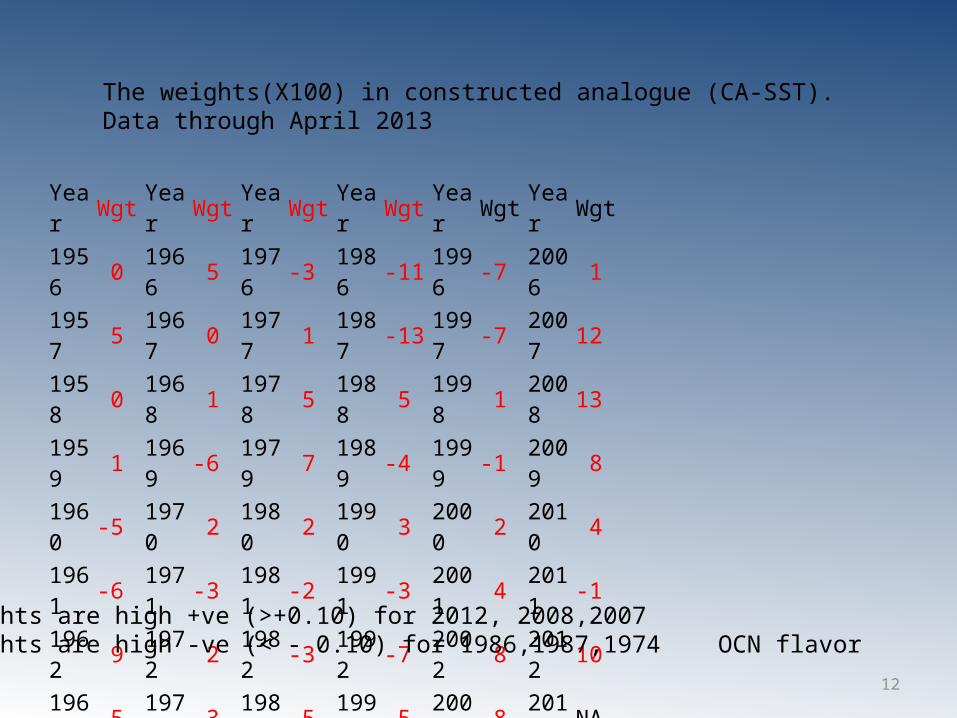
Year Wgt Year Wgt Year Wgt Year Wgt Year Wgt Year Wgt
1956 0 1966 5 1976-3 1986-11 1996-7 2006 11957 5 1967 0 1977 1 1987-13 1997-7 2007121958 0 1968 1 1978 5 1988 5 1998 1 2008131959 1 1969-6 1979 7 1989-4 1999-1 2009 81960-5 1970 2 1980 2 1990 3 2000 2 2010 41961-6 1971-3 1981-2 1991-3 2001 4 2011-11962 9 1972 2 1982-3 1992-7 2002 8 2012101963 5 1973-3 1983-5 1993-5 2003 8 2013NA1964 4 1974-12 1984 5 1994-4 2004-41965 2 1975-5 1985 2 1995-2 2005 1
Weights are high +ve (>+0.10) for 2012, 2008,2007Weights are high -ve (< - 0.10) for 1986,1987,1974 OCN flavor
The weights(X100) in constructed analogue (CA-SST).Data through April 2013
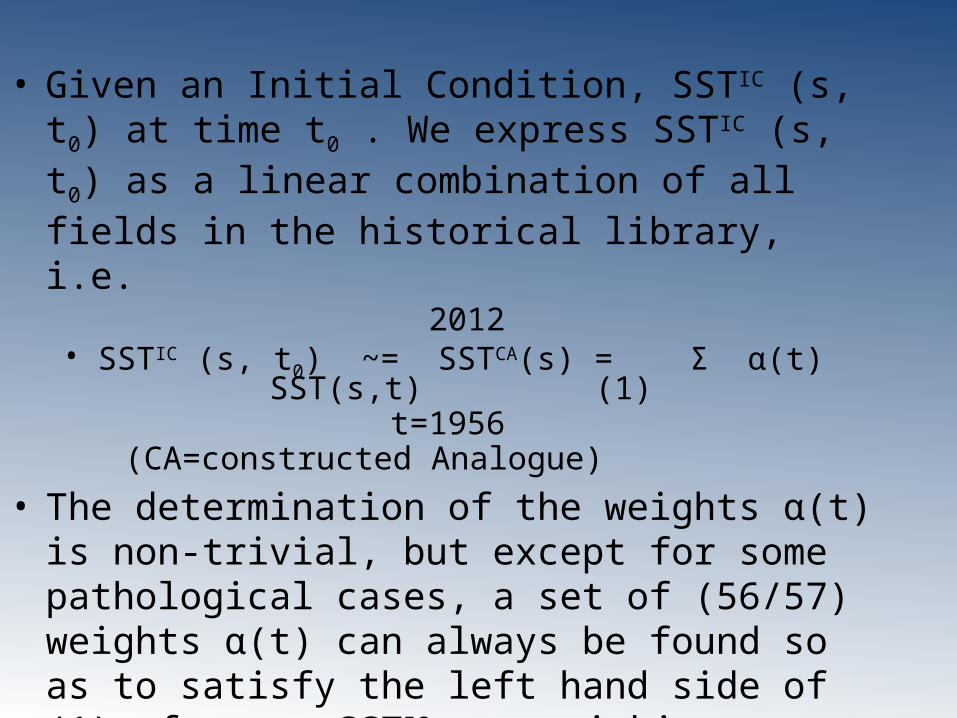
• Given an Initial Condition, SSTIC (s, t0) at time t0 . We express SSTIC (s, t0) as a linear combination of all fields in the historical library, i.e.
2012• SSTIC (s, t0) ~= SSTCA(s) = Σ α(t) SST(s,t) (1)
t=1956 (CA=constructed Analogue)• The determination of the weights α(t) is non-trivial,
but except for some pathological cases, a set of (56/57) weights α(t) can always be found so as to satisfy the left hand side of (1), for any SSTIC , to within a tolerance ε.
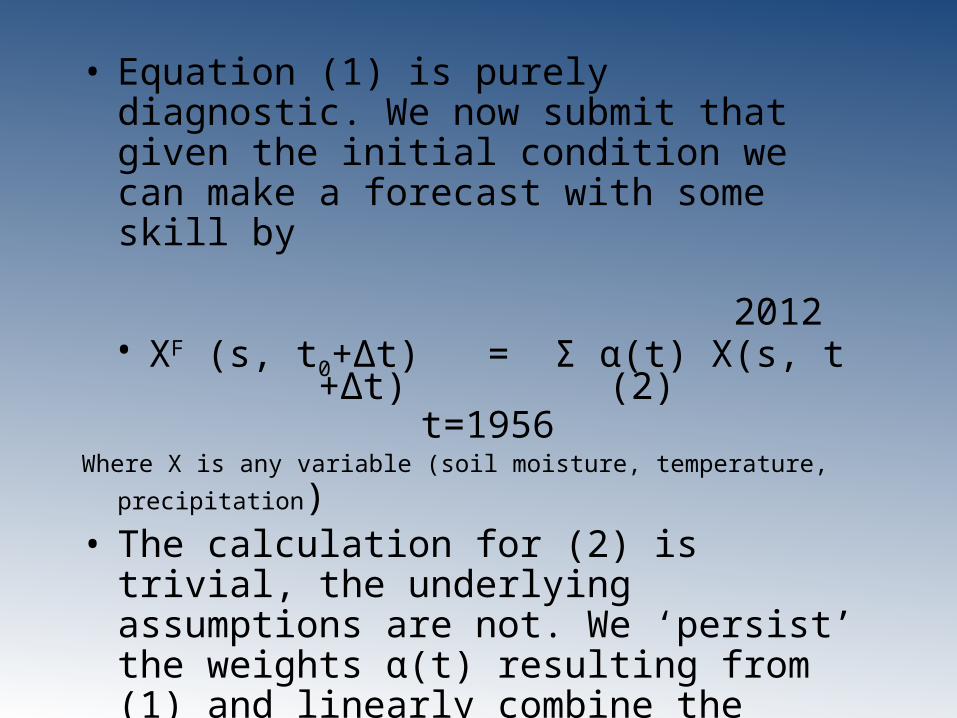
• Equation (1) is purely diagnostic. We now submit that given the initial condition we can make a forecast with some skill by
2012• XF (s, t0+Δt) = Σ α(t) X(s, t +Δt) (2)
t=1956Where X is any variable (soil moisture, temperature, precipitation)• The calculation for (2) is trivial, the underlying
assumptions are not. We ‘persist’ the weights α(t) resulting from (1) and linearly combine the X(s,t+Δt) so as to arrive at a forecast to which XIC (s, t0) will evolve over Δt.
15
16
17
18
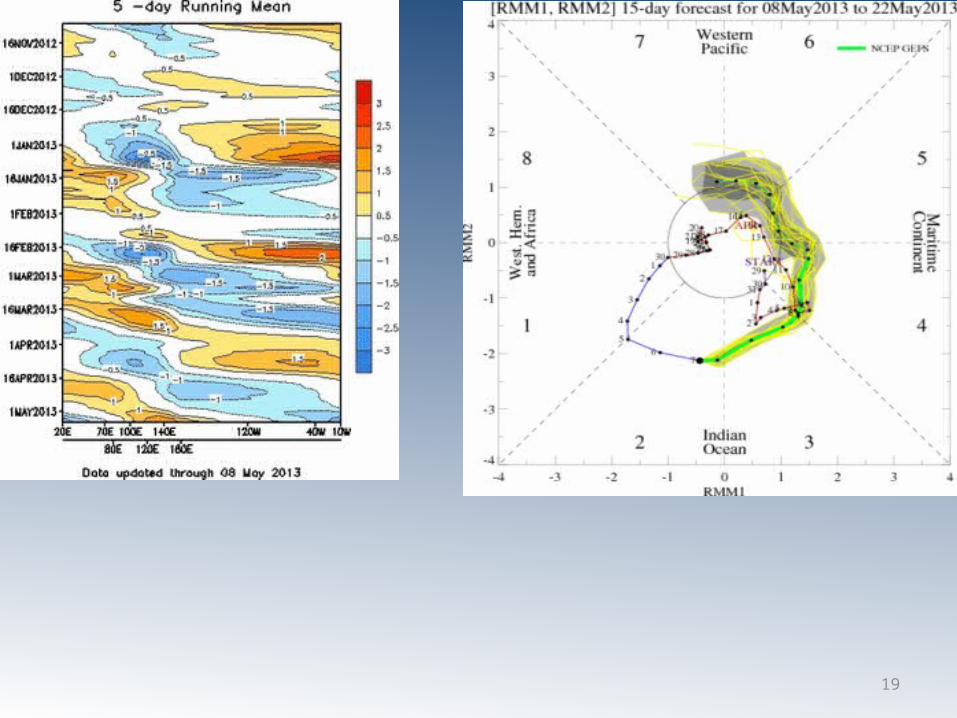
19
20
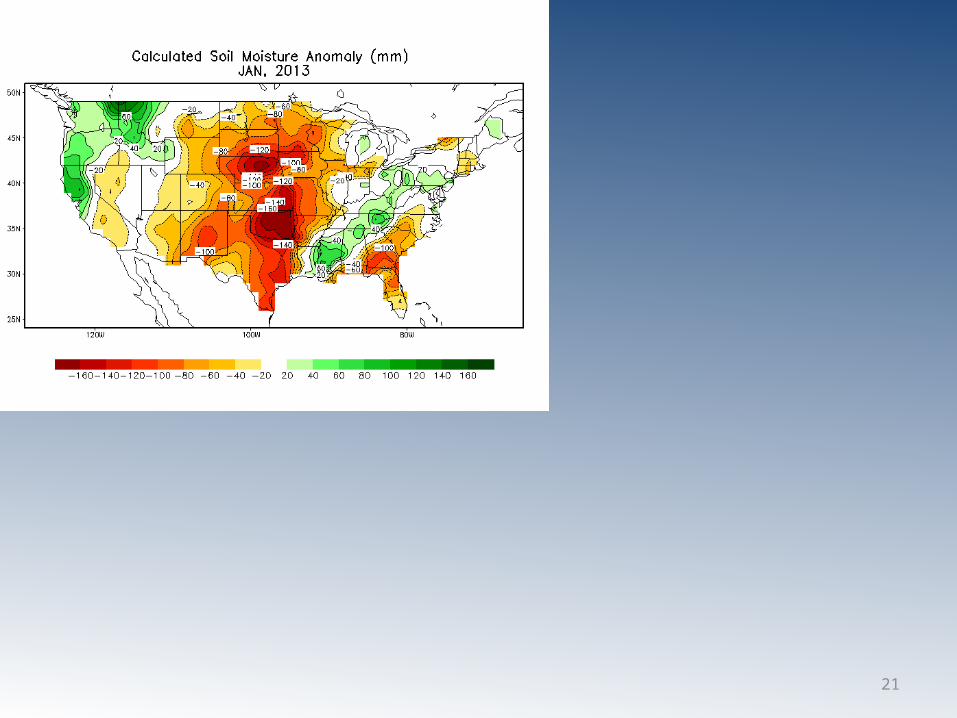
21
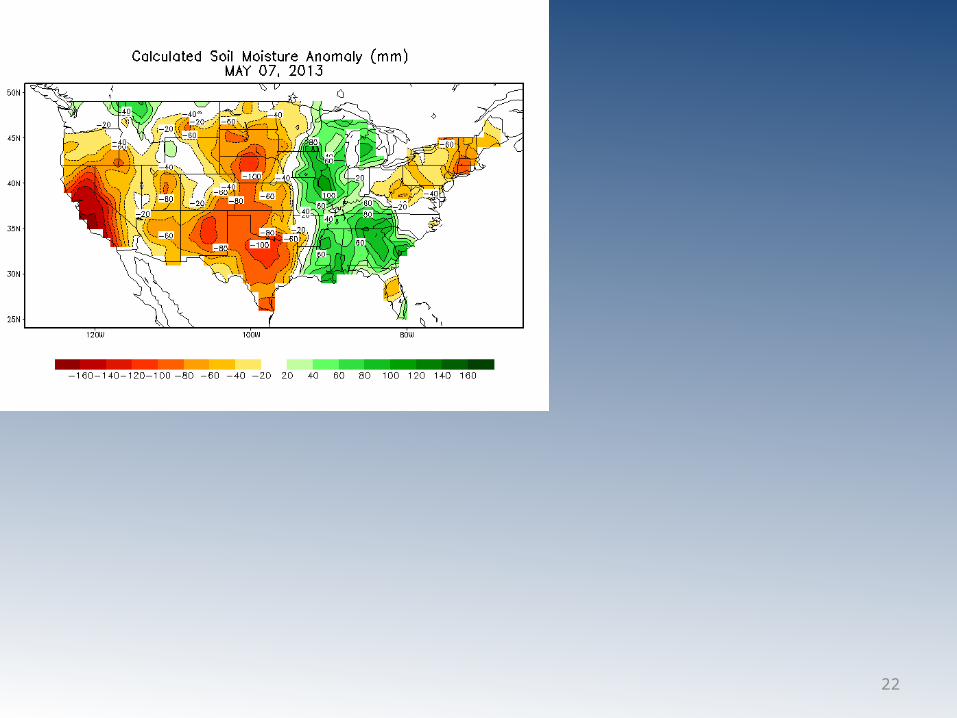
22
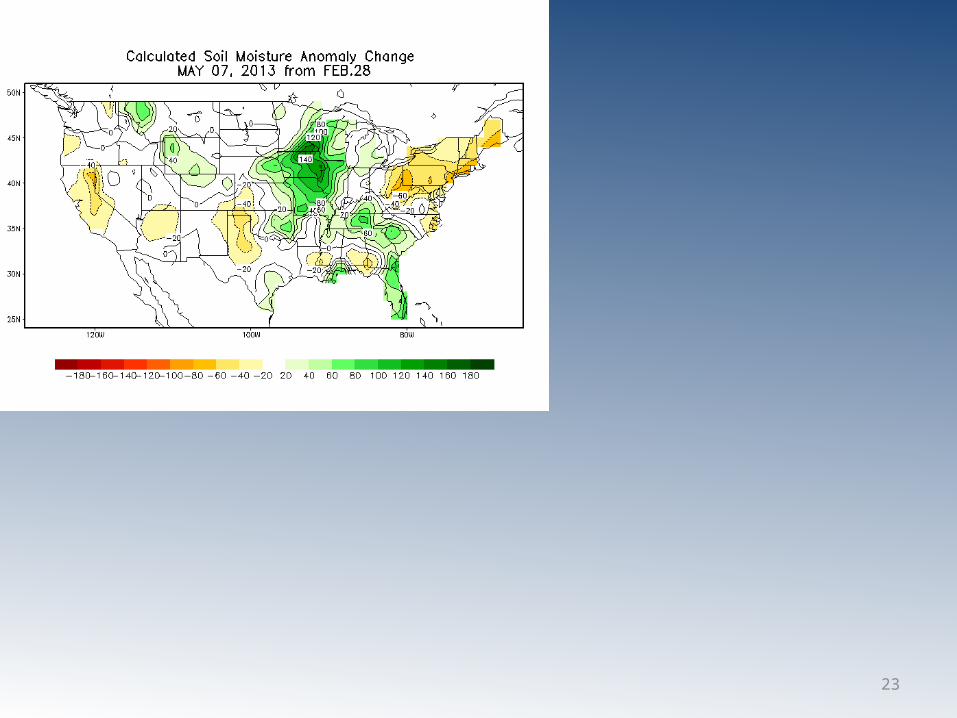
23
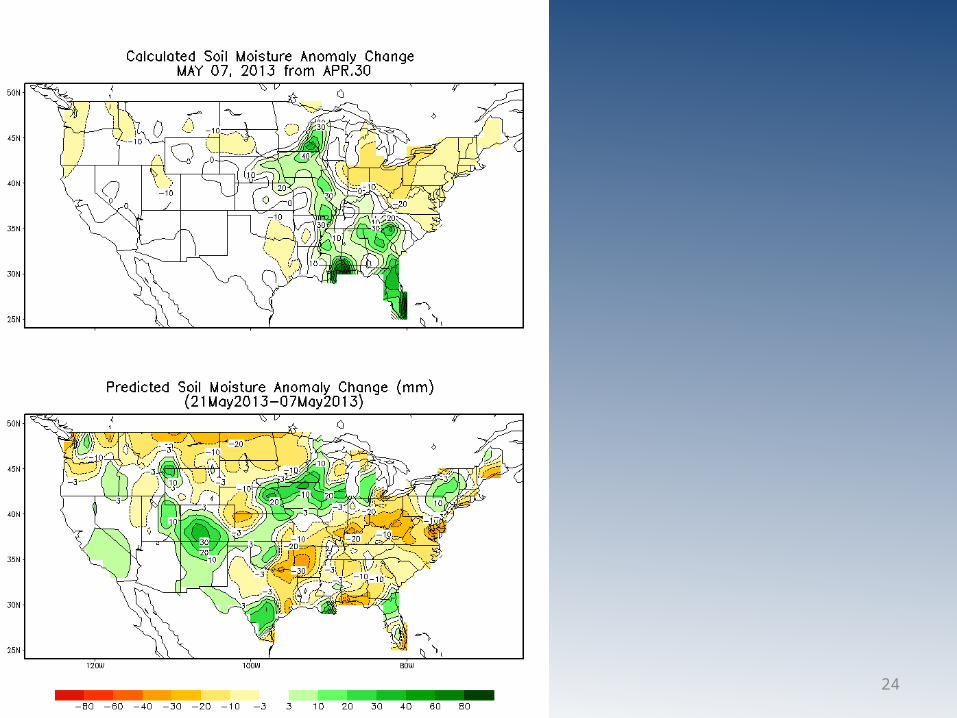
24
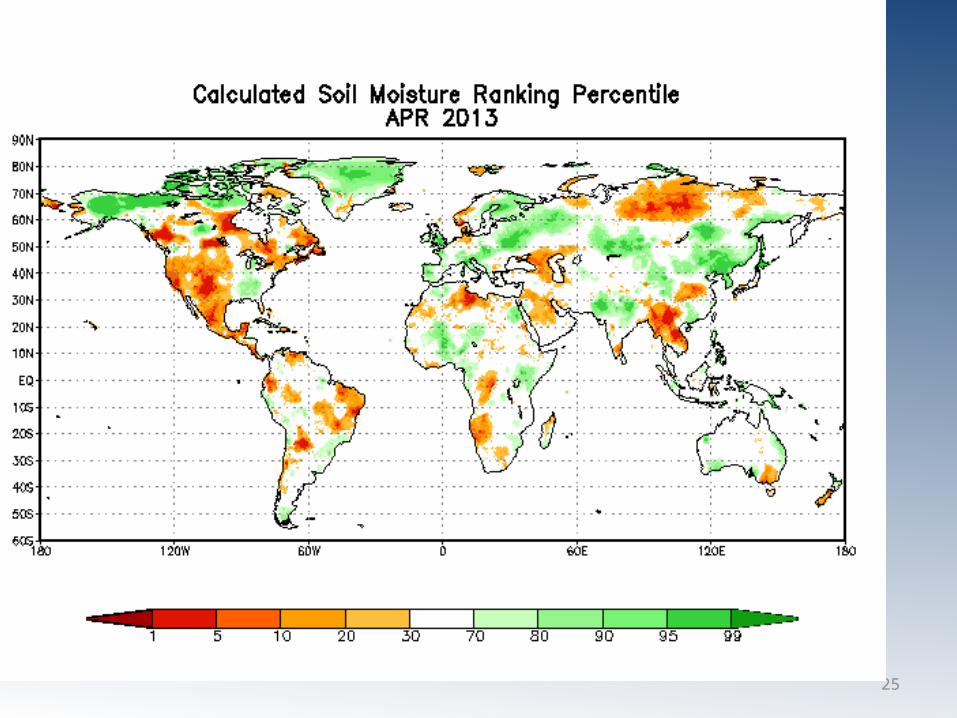
25
26
Potentially Big Changes in OCN
• Regular annual update• Change-over to homogenized Climate Division
Data (Vose et al 2013/14). (Not a small change)
• OCN(K=10)OCN(K=15), Wilks(2013)

27
Data thru early 2012
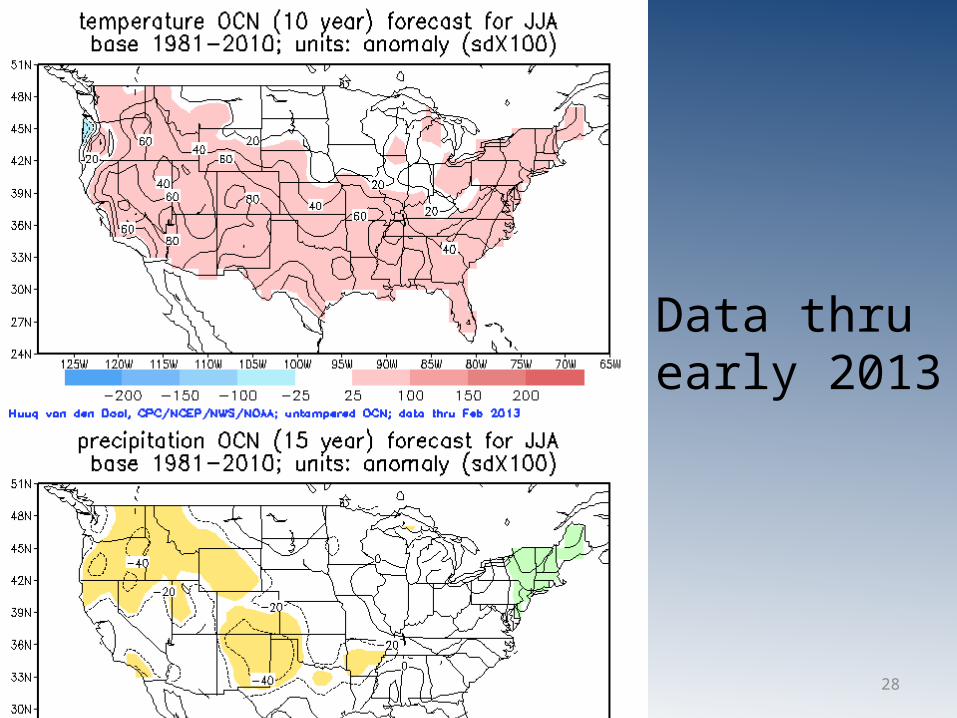
28
Data thru early 2013
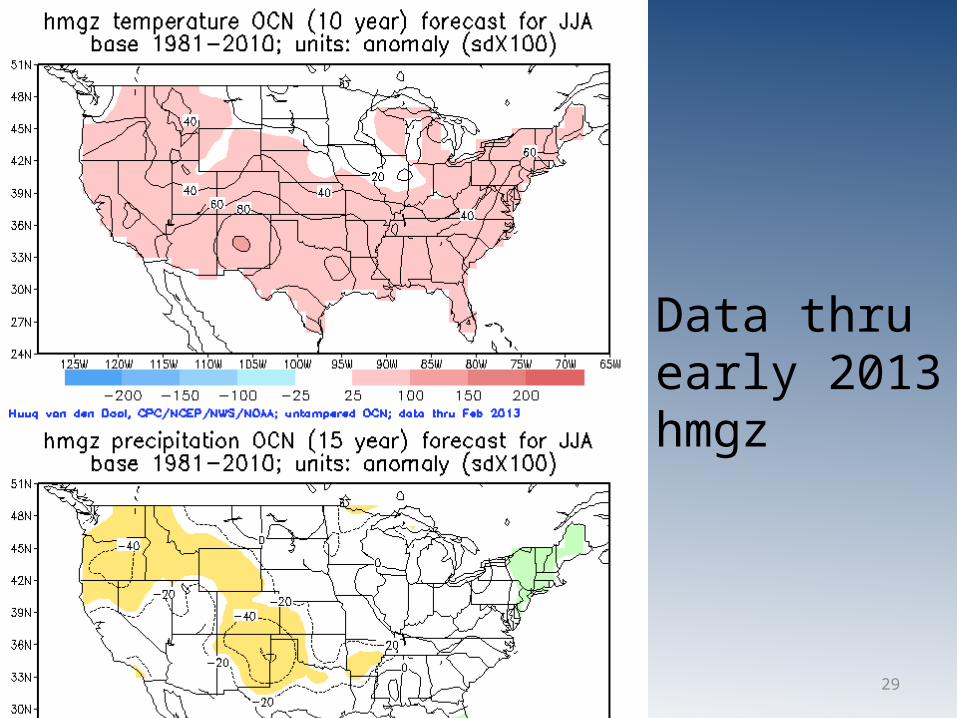
29
Data thru early 2013hmgz
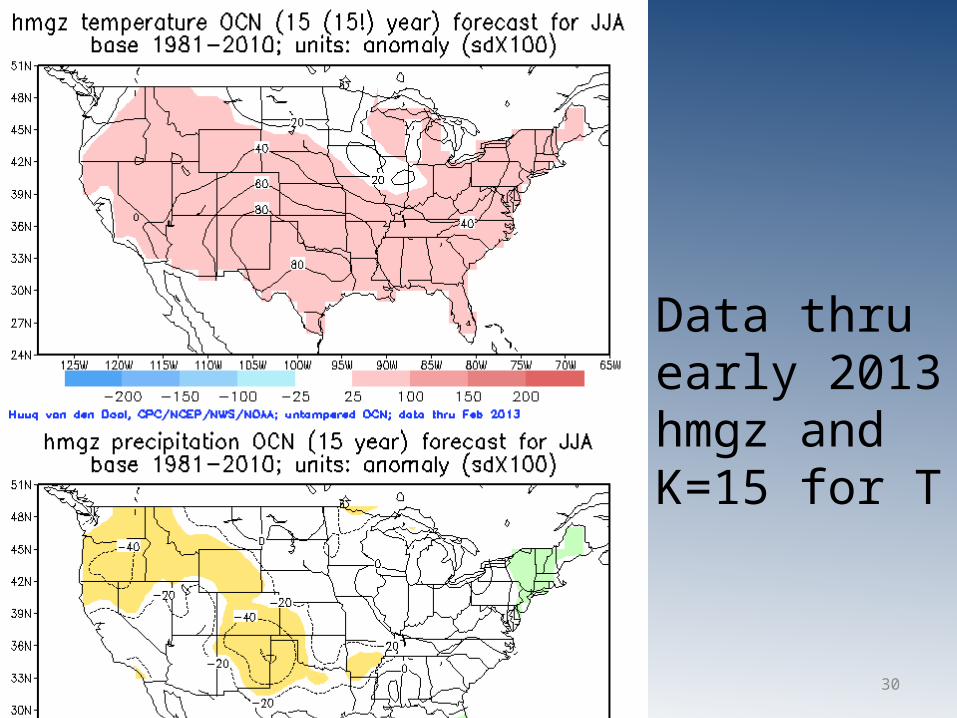
30
Data thru early 2013hmgz andK=15 for T
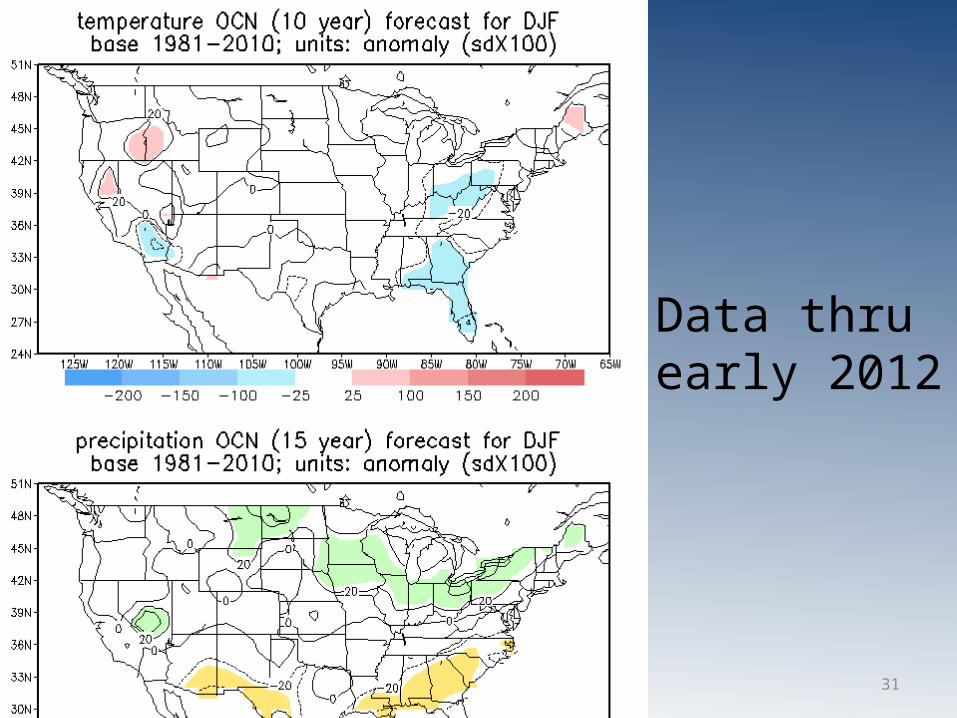
31
Data thru early 2012
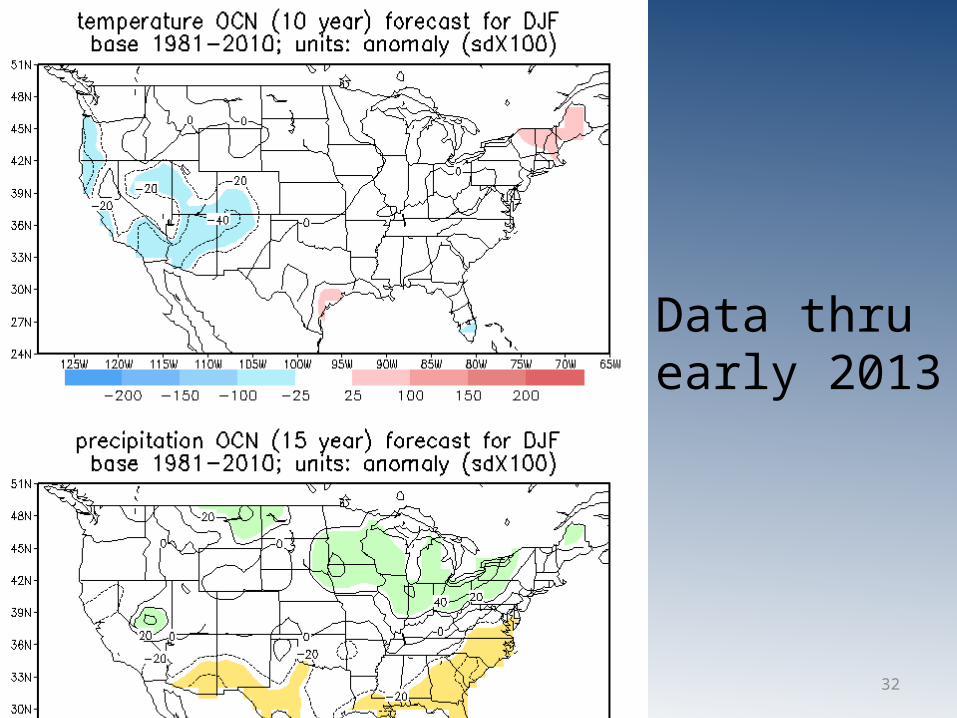
32
Data thru early 2013
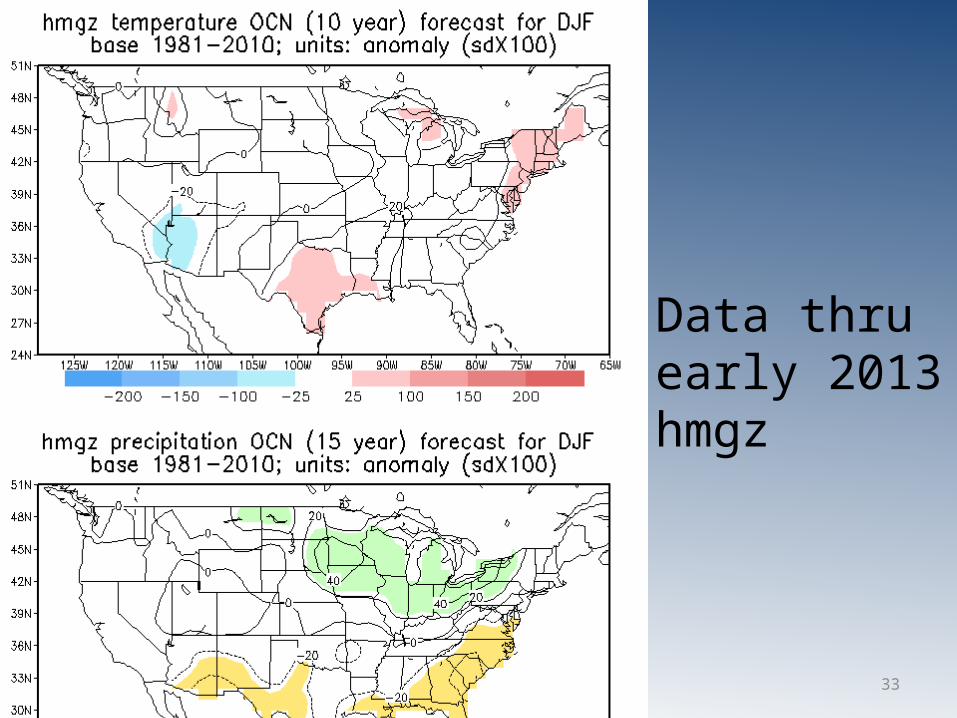
33
Data thru early 2013hmgz
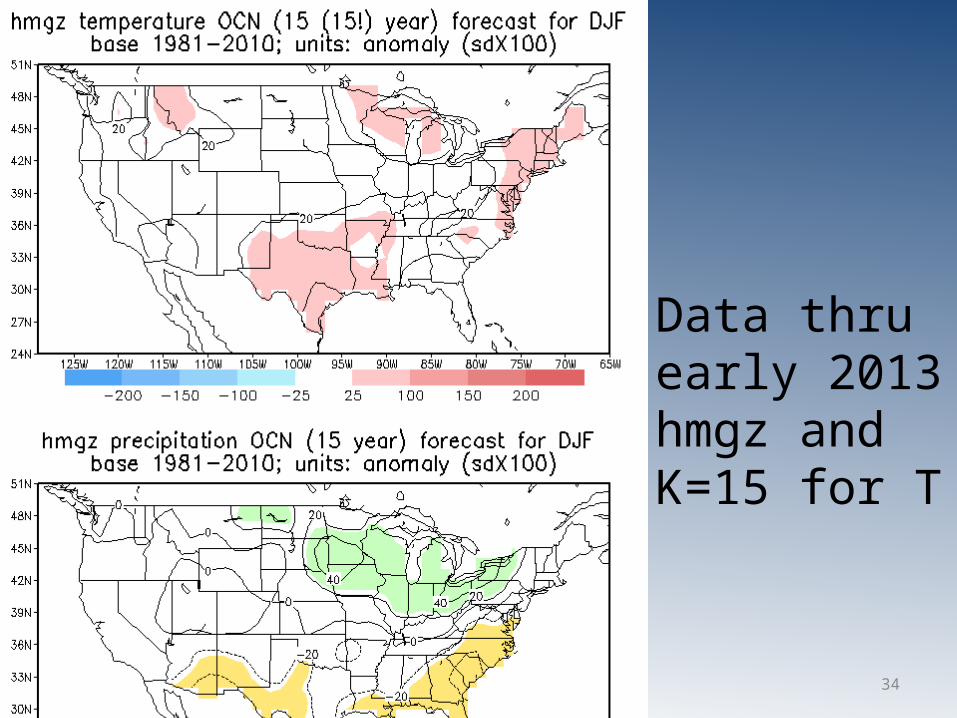
34
Data thru early 2013hmgz andK=15 for T

35
NMME? Wait one more day

36
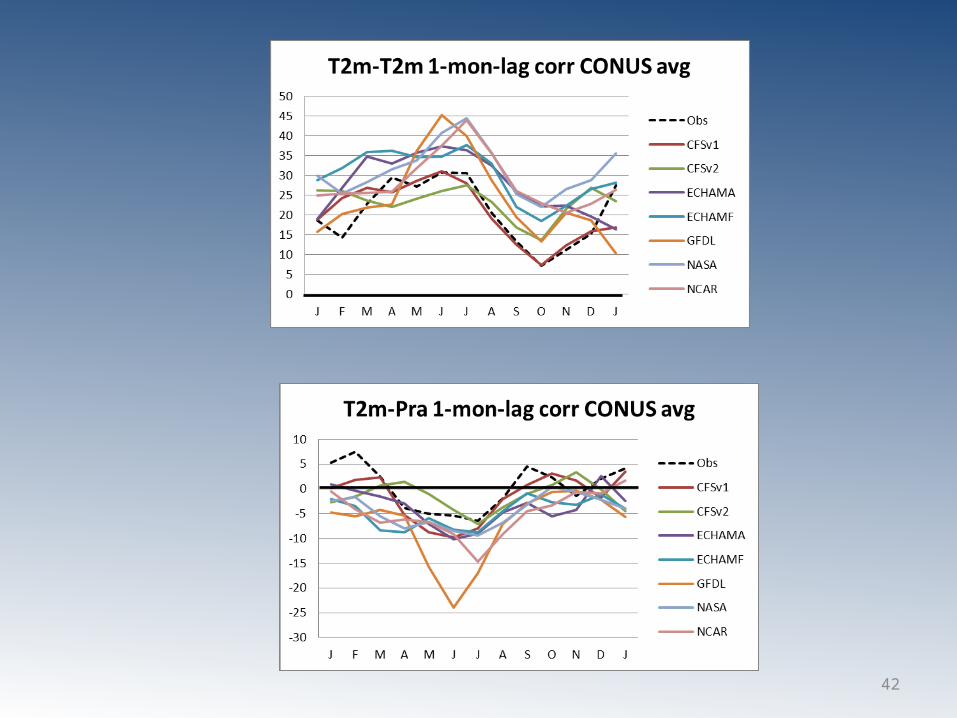
Monthly lagged precip-temperature relationship in NMME
Emily Becker & Huug van den DoolNMME telecon, May 2
37
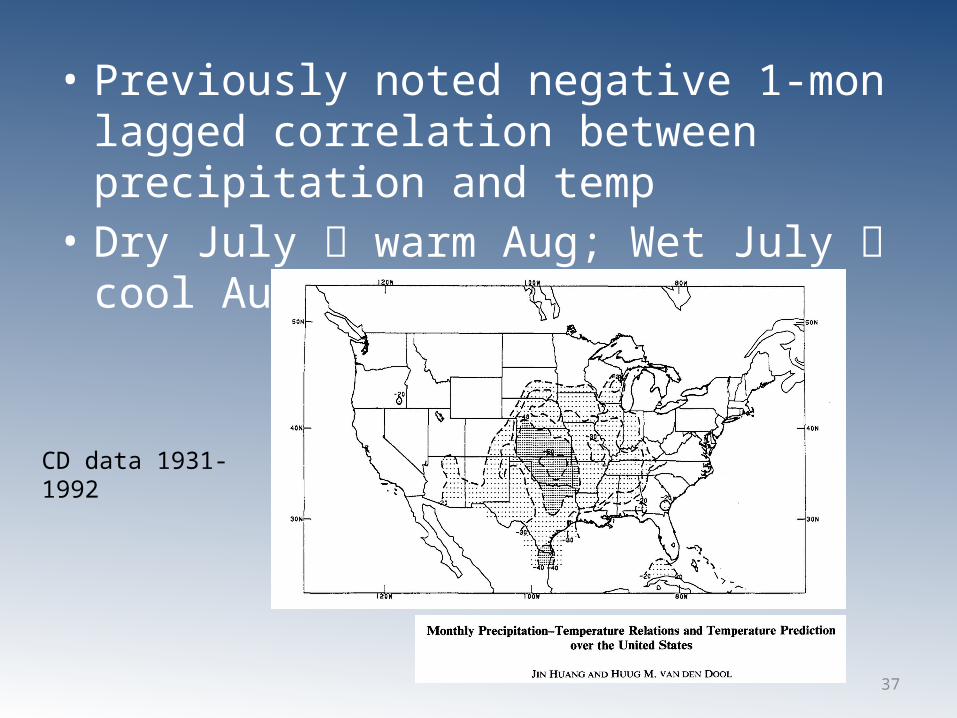
• Previously noted negative 1-mon lagged correlation between precipitation and temp
• Dry July warm Aug; Wet July cool Aug
CD data 1931-1992
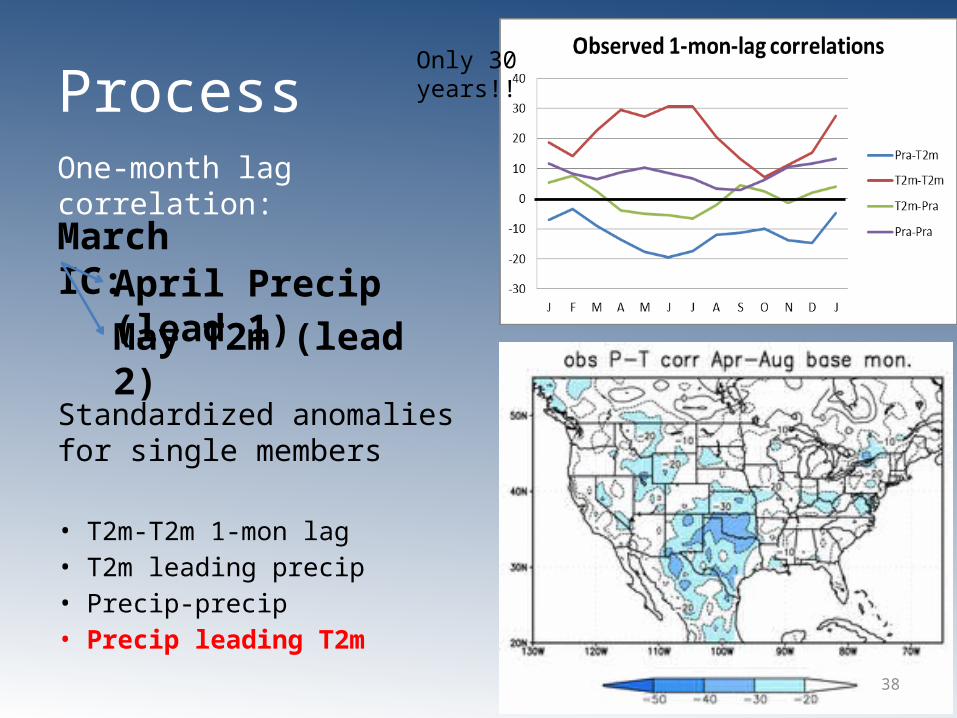
38
ProcessOne-month lag correlation:
Standardized anomalies for single members
• T2m-T2m 1-mon lag• T2m leading precip• Precip-precip• Precip leading T2m
March IC:April Precip (lead 1)May T2m (lead 2)
Only 30 years!!
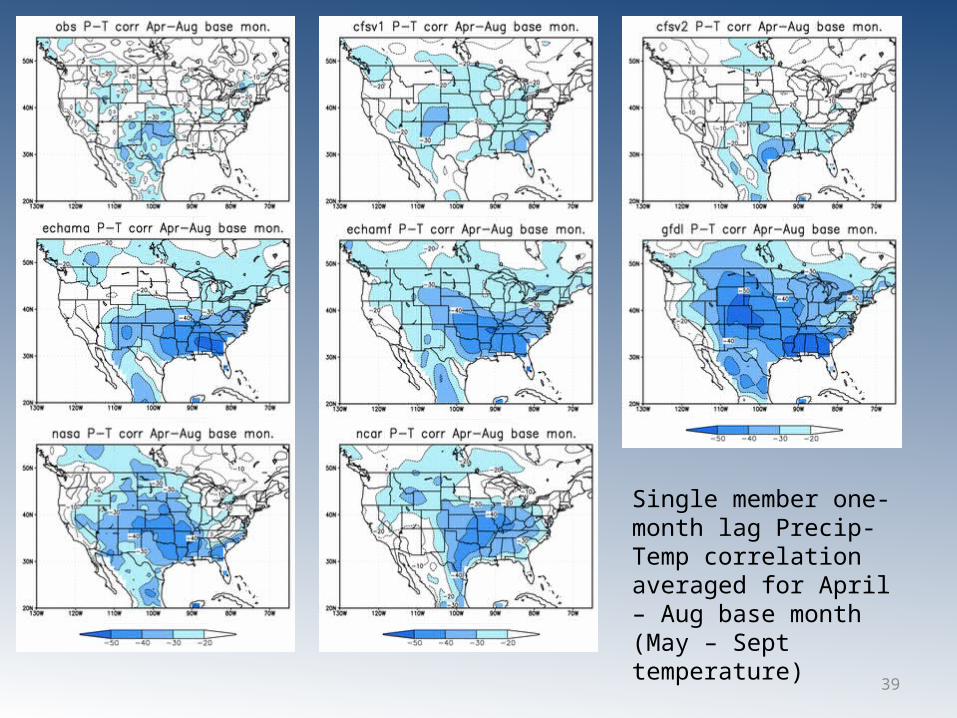
39
Single member one-month lag Precip-Temp correlation averaged for April – Aug base month (May – Sept temperature)
40
41
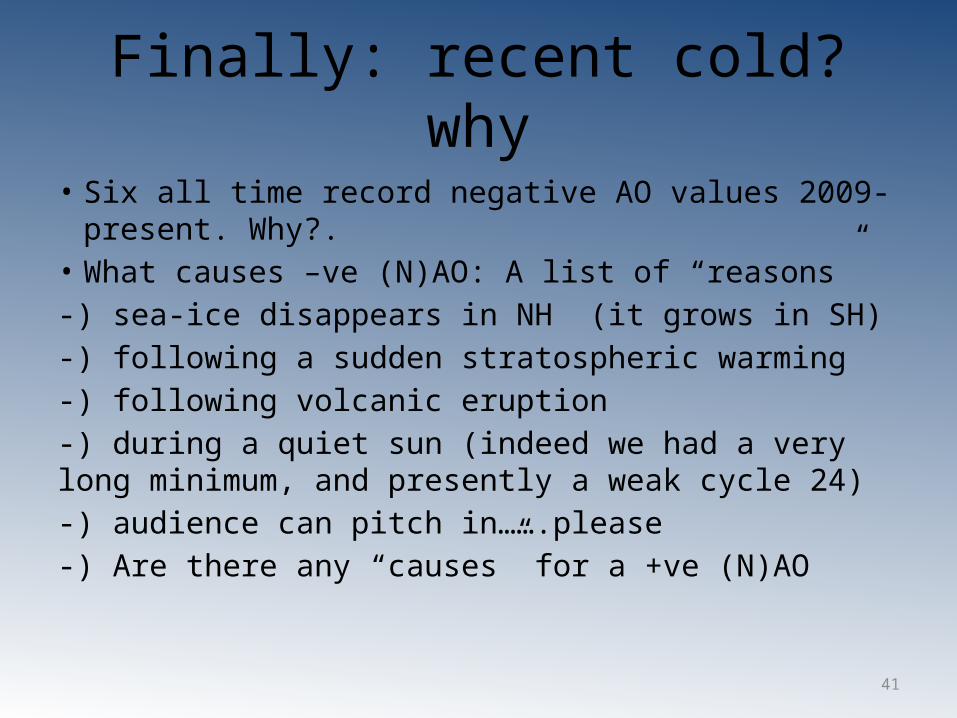
Finally: recent cold? why
• Six all time record negative AO values 2009-present. Why?.
• What causes –ve (N)AO: A list of “reasons”-) sea-ice disappears in NH (it grows in SH)-) following a sudden stratospheric warming-) following volcanic eruption-) during a quiet sun (indeed we had a very long minimum, and presently a weak cycle 24)-) audience can pitch in…….please-) Are there any “causes” for a +ve (N)AO
42
Recommended