Contents
Turkish Economy 2
Banking Sector 9
Concluding Remarks 10
Graphs 11
Tables 14
Monthly Economic Review
March 2016
Türkiye İş Bankası A.Ş. - Economic Research Division
OECD expected the world economy to expand at a slower
pace in 2016 compared to 2015 and record the weakest
growth performance of the last five years. The
Organization’s global growth forecast for 2016 stood at
3%, down from the previously announced figure of
3.3%.
The US economic growth rate was revised upward for
the last quarter of 2015. Personal consumption
expenditures inflation, one of the prominent indicators
that shape the Fed’s monetary policy, reached 1.3% in
January.
Recently, both the better-than-expected US GDP
growth and improved inflation expectations caused the
possibility of a rate hike by the Fed to increase
somewhat.
Consumer prices in the Euro Area dropped by 0.2% yoy
in February contrary to the expectations that implied a
flat course. ECB is expected to cut the deposit rate
further and expand the size of the bond purchase
program at its next monetary policy meeting to be held
in March.
The possibility of the UK leaving the European Union
(Brexit) has been high on the agenda. The prevailing
uncertainty about the outcome of the referendum to
take place in June 23 put pressure on sterling.
As hopes for a production freeze increased in February,
oil prices have rebounded to some extent.
Calendar adjusted industrial production surged by 4.5%
yoy in December. Thus, in the last quarter of 2015, the
annual expansion in industrial production became 4.2%,
the largest since the first quarter of 2014. Against this
backdrop, we expect that the 2015 GDP growth has been
realized around 4%.
Foreign trade deficit has kept its downward trend in the
first month of 2016 as it had been throughout 2015.
Despite of the low base-year effect, export volume
decreased by 22% yoy. Import volume also plunged by
19.7% yoy in January. Hence, trade deficit narrowed by
13.4% yoy in this period. It was noteworthy that
monthly export volume fell below 10 billion USD in
January for the first time in the last 5 years.
Current account deficit came in at 32.2 billion USD in
2015, the lowest level since 2009. The decline in foreign
trade deficit has played a significant role in this
development. Current account deficit excluding energy
trade gave a surplus of 1.1 billion USD in 2015.
Central government budget gave a surplus of 4.2 billion
TRY in January, better than the last year's performance .
The rise in privatization revenues was noteworthy
while the minimum wage hike appeared to have had an
impact on budget expenditures.
Seasonal factors put a downward pressure on monthly
inflation in February. CPI posted a monthly decline of
0.02% in this period. Having been on an upward trend
since October, annual CPI inflation rate edged back down
to 8.78% in February.
Global Economy Turkish Economy
İzlem Erdem - Division Head
Alper Gürler - Unit Manager
Hatice Erkiletlioğlu - Asst. Manager
Ilker Şahin—Economist
Eren Demir - Asst. Economist
M. Kemal Gündoğdu - Asst. Economist
Gamze Can - Asst. Economist

March 2016
2
Turkish Economy - Demand and Supply Conditions
Unemployment rate stood at 10.5%.
Unemployment rate declined by 0.2 point and became
10.5% in November. This fall took place despite the increase
registered in labor force participation ratio and is therefore
regarded as a favorable development for the labor market.
Relative recovery in economic activity in the last quarter of
2015 was confirmed as both non-agricultural and youth
unemployment rates decreased during this period.
Rise in industrial production came in above the
expectations.
Calendar adjusted industrial production surged by 4.5% yoy
in December. Thus, in the last quarter of 2015 the annual
expansion in industrial production became 4.2%, the largest
since the first quarter of 2014. The two fastest annual
increases in the main industrial sectors were recorded in the
manufacture of coke and refined petroleum products in
which new production facilities were put into service in
December and in the manufacture of electronic products .
These two sectors posted annual rises of 46% and 24%,
respectively. The basic metals sector, which contracted
through the last year showed some signs of improvement.
Production in the leather industry, which depends heavily
on Russian market, fell by 11.5% yoy in December.
GDP growth estimates for 2015 were revised upwards
thanks to the better-than-expected industrial production
data. We think that the contribution of net exports might
increase in the last quarter due to the favorable basis effect.
Hence, the growth rate might surpass 5% in this period. In
2015 as a whole, the GDP growth might converge to 4%, the
target of the Medium Term Programme.
PMI signals expansion in the manufacturing sector.
The manufacturing PMI receded by 0.6 point mom to 50.3 in
February. Therefore, the index indicated that the sector
continued to grow for the fourth consecutive months
remaining above the 50 threshold level. While output and
new orders pushed up the overall index, new export orders
kept declining due to the growing geopolitical risks. It was
also noteworthy that the input prices reached a four-month
high during this period.
Capacity utilization ratio...
Capacity utilization ratio (CUR) increased by 0.7 point yoy
and came in at 73.5% in February. CUR in the manufacture
of coke and refined petroleum products sustained its strong
outlook during this period. Also, the surge of CUR in the
manufacture of motor vehicles persisted in February.
However, CUR in the manufacture of chemical, rubber and
plastic and leather products fell in this period.
Source: Datastream, Turkstat, CBRT, Markit
0
2
4
6
8
10
12
14
16
18
201 0 201 1 201 2 201 3 201 4 201 5
CAJ Industrial Production and GDP
(annual % change)
Industrial Production Index GDP
12.0
12.5
13.0
13.5
14.0
18.0
18.5
19.0
19.5
Ja n-15 Mar-15 May-1 5 Jul-15 Sep-15 Nov-15
Non-agricultural and Youth Unemployment
(sa, %)
Youth Unemployment
Non-agricultural Unemployment (right axis)
50.3
47
48
49
50
51
52
53
Ja n-15 Mar-15 May-1 5 Jul-15 Sep-15 Nov-15 Ja n-16
Manufacturing PMI
(diffusion index, 50=breakeven)

March 2016
3
Turkish Economy - Foreign Trade Balance
In January, foreign trade deficit narrowed by 13.4%.
Foreign trade deficit has kept its downward trend in the first
month of 2016 as it had been throughout 2015. Despite of
the low base-year effect, export volume decreased by 22%
yoy, import volume also plunged by 19.7% yoy in January.
Hence, trade deficit narrowed by 13.4% yoy in this period. It
was noteworthy that monthly export volume fell below 10
billion USD in January for the first time in the last 5 years.
Exports displayed a weak performance.
The sharpest annual decline registered in exports since the
global crisis was mainly led by the drop in gold exports in
January. During this period, 40% of the contraction in total
exports (2.7 billion USD) stemmed from the decline in gold
trade. Accordingly, exports to Switzerland and England fell
by 81.9% and 31% yoy, respectively.
Narrowing exports to Iraq, Russia, Iran and UAE due to the
recent geopolitical developments also played a part in the
weak performance of exports. Indeed, the fall in exports to
these countries accounted for one-third of the annual
decline recorded in total exports. Analyses of exports by sub
-items revealed that the vegetables, fruits, motor vehicles
and machinery exports to Russia contracted in January while
raw leather and wearing apparel exports posted a slight
increase. For Iraq, on the other hand, exports of the iron-
steel, motor vehicles as well as food product exports such as
vegetable oils and meat decreased. Fall in precious stones
and metals exports was largely responsible for the
contraction of exports to Iran and UAE.
In January, exports of Turkey recorded a decline for all
country groups. Exports to EU countries, Turkey's largest
export market, fell by 9.7% yoy (509 million USD) in this
period. Low level of EUR/USD parity continued to have
impact on this development, albeit to a limited extent.
Moreover, exports to the other European countries dropped
by 65% yoy (1.1 billion USD) in January.
The impact of falling oil prices on imports has
persisted.
The lower oil prices continued to be instrumental in the
decline of energy imports. Indeed, quantity of Turkey’s oil
imports increased by 19.6% yoy while value of energy
imports (classified as Chapter-27, mineral fuels and mineral
oil) dropped by 39.2% yoy.
The fall in imports was broad-based in the first month of the
year due to the mild course of domestic demand conditions.
Boilers-machineries and iron-steel, two of the first five
most imported items, contracted by 8.2% yoy and 30% yoy,
respectively.
Expectations…
Exports exhibited a weak performance during the first
month of the year whereas sliding imports on the back of
the lower oil prices gave way to a smaller foreign trade
deficit. However, we anticipate that the fall in imports might
decelerate in the upcoming period along with the
diminishing basis effect of low oil prices. On the exports
front, the significance of the diversification of markets
grows as geopolitical risks continue to pile up. Meanwhile,
the lack of a sustainable growth performance in European
Union countries constitutes another concern for Turkey’s
export outlook.
According to the provisional data, exports rose by 3.3% yoy
while imports fell by 7.7% yoy in February. As a result,
foreign trade deficit contracted by 34.7% yoy in this period.
Source: Datastream, Turkstat
(USD thousand) 2015-01 2016-01 (% change)
Switzerland 1,044,440 189,562 -81.9
Iraq 834,204 468,821 -43.8
England 941,629 650,193 -31.0
Russia 315,427 107,749 -65.8
UAE 455,894 287,505 -36.9
Iran 411,510 263,719 -35.9
Azerbaijan 187,513 45,017 -76.0
France 474,490 417,448 -12.0
Syria 135,575 86,954 -35.9
Turkmenistan 137,040 90,775 -33.8
Other 7,364,662 6,989,020 -5.1
Total 12,302,384 9,596,764 -22.0
Major Export Losses by Destination
Change
2015 2016 (%)
Exports 12.3 9.6 -22.0
Imports 16.6 13.4 -19.7
Foreign Trade Balance -4.3 -3.8 -13.4
Import Coverage Ratio (%) 73.9 71.8 -
Foreign Trade Balance (USD billion)
January
0.0
0.5
1.0
1.5
2.0
Jan-15 Mar-15 May-15 Jul-15 Sep-15 Nov-15 Jan-16
Gold Trade
(USD billion)
Gold Exports
Gold Imports

March 2016
4
Turkish Economy - Balance of Payments
Current account deficit became 5.1 billion USD in
December.
Current account deficit came in at 5.1 billion USD, slightly
above expectations in December. For the full year, the
deficit decreased by 11.4 billion USD compared to 2014 to
32.2 billion USD, the lowest level since 2009. The decline in
foreign trade deficit, which amounted to 15.8 billion USD,
has played a significant role in this development. Current
account deficit excluding energy trade gave a surplus of 1.1
billion USD in 2015.
Narrowing foreign trade deficit…
According to the balance of payments figures, exports
recorded a fall of 10% yoy in 2015 due to the geopolitical
developments and weak economic outlook in the major
export markets. Nonetheless, the improvement in foreign
trade deficit thanks to the decline in imports (14% yoy),
which mostly stemmed from the falling energy prices, has
supported the current account balance.
On the other hand, the decline in tourism and shuttle trade
revenues limited the recovery in current account balance.
The contraction in the Russian economy played a significant
role in the fall of 3.1 billion USD in shuttle trade revenues
and 3.2 billion USD in net tourism revenues in 2015. The
number of Russian tourists visited Turkey decreased by
19% yoy in this period.
Capital outflows from portfolio investments
persisted.
Portfolio investments recorded an outflow of 15.4 billion
USD in 2015 due to the domestic political developments and
volatile conditions in global markets. Almost half of this
amount stemmed from the sales of the government
domestic debt securities of non-residents. Equity securities
also witnessed outflows during this period. It was
noteworthy that portfolio investments recorded a net
capital outflow for the first time on annual basis since the
2008 global crises.
Favorable outlook in foreign direct investments…
Foreign direct investments exhibited a strong performance
during 2015. Net foreign direct investments rose by 6 billion
USD compared to 2014 and came in at 11.5 billion USD.
Banking and manufacture of coke, refined petroleum
products attracted the highest amount of FDI during the
year.
Private sector continued to raise funds from abroad.
Both banks and non-bank sectors continued to obtain funds
from abroad in 2015. Further improving financing quality,
banking sector was a net credit re-payer in short term loans
with 21.4 billion USD while it became a net credit borrower
in long-term loans with 26.2 billion USD. Banks’ long-term
debt roll-over ratio stood at 327% as of the end of 2015.
Source: Datastream, CBRT
Breakdown of Net Capital Inflows (12-month cumulative, USD million)
Dec. 2014 Dec. 2015 Dec. 2014 Dec. 2015
Current Account Balance -43,552 -32,192 - -
Total Net Foreign Capital Inflows 43,084 20,361 100.0 100.0 -Direct Investments 5,476 11,495 12.7 56.5
-Portfolio Investments 20,104 -15,411 46.7 -75.7
-Other Investments 16,014 14,640 37.2 71.9
-Net Errors and Omissions 1,560 9,658 3.6 47.4
-Other -70 -21 -0.2 -0.1
Reserves(1) 468 11,831 - -
Note: The numbers may not add up to total due to rounding.
(1) (-) sign indicates an increase in reserves while (+) sign indicates a decrease.
Breakdown of Net Capital Inflows
(%)
-32.2
1.1
-100
-80
-60
-40
-20
0
20
2010 2010 2011 2012 2013 2014 2015 2015
Current Account Balance
(12-month cumulative, USD billion)
Current Account Balance
CAD (Excluding Net Energy Trade)
3.5
6.46.0 6.2
4.8 5.04.4
6.3
7.4
8.6
5.5
0
2
4
6
8
10
2005 2006 2007 2008 2009 2010 2011 2012 2013 2014 2015
Shuttle Trade
(billion USD)

March 2016
5
Turkish Economy - Balance of Payments
Non-bank sectors were net borrowers both in short-term
and long-term loans. They raised credits amounting to a net
figure of 10.7 billion USD in long-term while they used a lot
lesser amount of short-term loans during this period.
Having fallen since August, reserve assets posted a record
monthly fall of 6.6 billion USD in December. Consequently,
reserve assets became a focus of attention registering a
decline of 11.8 billion USD in 2015 as a whole. Net errors and
omissions account also recorded an outflow of 1.1 billion
USD in December while it contributed significantly to the
financing of the current account deficit by 9.7 billion USD
during 2015.
Expectations
The current trajectory of energy prices presents a favorable
outlook for Turkey’s current account balance. However, the
latest data on leading indicators in Euro Area have signaled
that the economy has recently lost some steam.
Furthermore, the rising geopolitical risks are expected to
weigh on tourism and shuttle trade revenues as well as
exports in the upcoming period. The signs of recovery in
domestic demand may also limit the improvement in current
account balance via import channel. Against this backdrop,
the upward pressures on current account deficit are
expected to intensify in 2016 compared to 2015.
The figures used in the table are according to the Sixth Edition of the Balance of Payments Manual. You can find the details here.
Source: CBRT, Datastream
Balance of Payments (USD million)
December %
2015 2014 2015 Change
Current Account Balance -5,073 -43,552 -32,192 -26.1 Foreign Trade Balance -4,972 -63,597 -47,820 -24.8
Services Balance 611 26,768 23,959 -10.5
Travel (net) 690 24,480 21,248 -13.2
Primary Income -839 -8,130 -9,523 17.1
Secondary Income 127 1,407 1,192 -15.3
Capital Account -15 -70 -21 -70.0
Financial Account -6,207 -42,062 -22,555 -46.4 Direct Investments (net) -1,245 -5,476 -11,495 109.9
Portfolio Investments (net) 957 -20,104 15,411 -
Net Acquisition of Financial Assets -895 746 6,041 709.8
Net Incurrence of Liabilities -1,852 20,850 -9,370 -
Equity Securities -417 2,559 -2,395 -
Debt Securities -1,435 18,291 -6,975 -
Other Investments (net) 728 -16,014 -14,640 -8.6
Currency and Deposits 1,868 437 2,122 385.6
Net Acquisition of Financial Assets 1,961 283 15,009 5,203.5
Net Incurrence of Liabilities 93 -154 12,887 -
Central Bank -39 -2,333 -916 -60.7
Banks 132 2,179 13,803 533.5
Foreign Banks 157 -954 9,942 -
Foreign Exchange -419 -3,904 4,708 -
Turkish Lira 576 2,950 5,234 77.4
Non-residents -25 3,133 3,861 23.2
Loans 539 -15,173 -13,592 -10.4
Net Acquisition of Financial Assets 267 1,863 792 -57.5
Net Incurrence of Liabilities -272 17,036 14,384 -15.6
Banking Sector -164 11,837 4,866 -58.9
Non-bank Sectors 353 6,086 10,756 76.7
Trade Credit and Advances -1,676 -807 -2,908 260.3
Other Assets and Liabilities -3 -471 -262 -44.4
Reserve Assets (net) -6,647 -468 -11,831 2,428.0
Net Errors and Omissions -1,119 1,560 9,658 519.1
Jan. - Dec.
-15
-10
-5
0
5
10
15
2010 2011 2012 2013 2014 2015
Net Errors and Omissions
(12-month cumulative, billion USD)
March 2016
6
Turkish Economy - Budget Balance
Central government budget gave a surplus of 4.2
billion TRY.
Central government budget surplus, which became 3.8
billion TRY in the first month of the previous year, rose by
11.4% yoy to 4.2 billion TRY in January 2016. In this period,
primary surplus also surged by 11.7% and was realized as
9.8 billion TRY. In January, budget balance pointed to a
better outlook than the same month of the previous year.
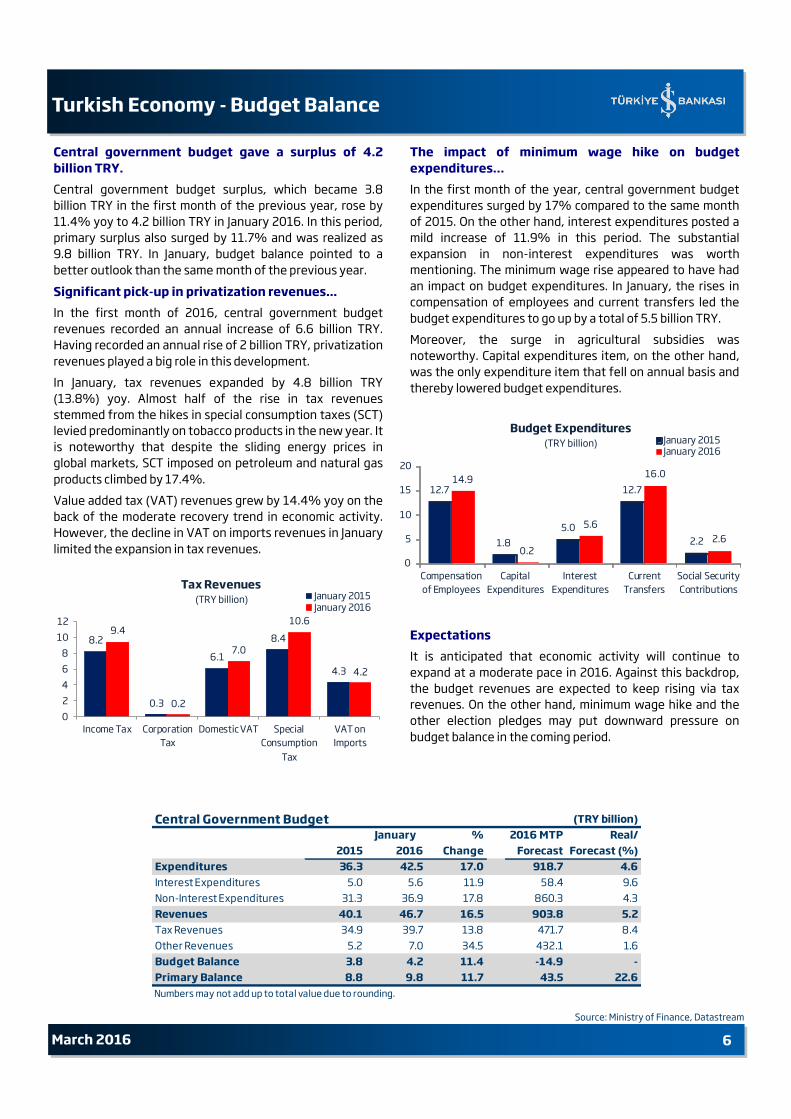
Significant pick-up in privatization revenues...
In the first month of 2016, central government budget
revenues recorded an annual increase of 6.6 billion TRY.
Having recorded an annual rise of 2 billion TRY, privatization
revenues played a big role in this development.
In January, tax revenues expanded by 4.8 billion TRY
(13.8%) yoy. Almost half of the rise in tax revenues
stemmed from the hikes in special consumption taxes (SCT)
levied predominantly on tobacco products in the new year. It
is noteworthy that despite the sliding energy prices in
global markets, SCT imposed on petroleum and natural gas
products climbed by 17.4%.
Value added tax (VAT) revenues grew by 14.4% yoy on the
back of the moderate recovery trend in economic activity.
However, the decline in VAT on imports revenues in January
limited the expansion in tax revenues.
The impact of minimum wage hike on budget
expenditures…
In the first month of the year, central government budget
expenditures surged by 17% compared to the same month
of 2015. On the other hand, interest expenditures posted a
mild increase of 11.9% in this period. The substantial
expansion in non-interest expenditures was worth
mentioning. The minimum wage rise appeared to have had
an impact on budget expenditures. In January, the rises in
compensation of employees and current transfers led the
budget expenditures to go up by a total of 5.5 billion TRY.
Moreover, the surge in agricultural subsidies was
noteworthy. Capital expenditures item, on the other hand,
was the only expenditure item that fell on annual basis and
thereby lowered budget expenditures.
Expectations
It is anticipated that economic activity will continue to
expand at a moderate pace in 2016. Against this backdrop,
the budget revenues are expected to keep rising via tax
revenues. On the other hand, minimum wage hike and the
other election pledges may put downward pressure on
budget balance in the coming period.
Source: Ministry of Finance, Datastream
Central Government Budget (TRY billion)
% 2016 MTP Real/
2015 2016 Change Forecast Forecast (%)
Expenditures 36.3 42.5 17.0 918.7 4.6
Interest Expenditures 5.0 5.6 11.9 58.4 9.6
Non-Interest Expenditures 31.3 36.9 17.8 860.3 4.3
Revenues 40.1 46.7 16.5 903.8 5.2
Tax Revenues 34.9 39.7 13.8 471.7 8.4
Other Revenues 5.2 7.0 34.5 432.1 1.6
Budget Balance 3.8 4.2 11.4 -14.9 -
Primary Balance 8.8 9.8 11.7 43.5 22.6
Numbers may not add up to total value due to rounding.
January
8.2
0.3
6.1
8.4
4.3
9.4
0.2
7.0
10.6
4.2
0
2
4
6
8
10
12
Income Tax Corporation
Tax
Domestic VAT Special
Consumption
Tax
VAT on
Imports
Tax Revenues
(TRY billion) January 2015January 2016
12.7
1.8
5.0
12.7
2.2
14.9
0.2
5.6
16.0
2.6
0
5
10
15
20
Compensation
of Employees
Capital
Expenditures
Interest
Expenditures
Current
Transfers
Social Security
Contributions
Budget Expenditures
(TRY billion) January 2015January 2016

March 2016
7
Turkish Economy - Inflation
CPI posted an unexpected monthly decline.
In February, CPI and D-PPI decreased by 0.02% mom and
0.2% mom, respectively. Markets expected a 0.3% monthly
CPI rise in this period. According to the CBRT’s Survey of
Expectations, CPI was anticipated to increase by 0.68%.
CPI registered an annual rise of 8.78%.
Having been on an upward trend since October, annual CPI
inflation rate edged back down to 8.78% in February.
Annual increase in D-PPI also lost momentum rapidly
compared to the previous month and was realized as 4.47%
in this period. Thus, annual D-PPI inflation fell to the lowest
level of the last eleven months.
Clothing and footwear prices declined by 6.2% mom.
Seasonal factors put a downward pressure on monthly
inflation in February. Having decreased by 6.2% on monthly
basis, clothing and footwear group made the biggest
contribution to the drop registered in CPI.
It was worth mentioning that food and nonalcoholic
beverages prices, which generally exert significant upward
pressure on inflation, recorded a monthly decline albeit to a
limited extent. Having the second biggest weight in CPI
basket (15.9%) following the food group, the surge in
housing prices limited the fall in CPI. On the other hand,
increase in the prices of vehicles under the transportation
group, whose prices are highly sensitive to the
developments in foreign exchange rates, made the highest
positive contribution to the CPI during this period.
Surge in the core inflation indicators...
Despite the decrease in CPI in February, the core inflation
indices kept their rising trends. H and I indices, followed by
CBRT closely, recorded annual increases of 9.49% and
9.72%, respectively in this period. Hence, these indices
reached their highest readings for more than a year.
Low energy prices had substantial impact on D-PPI.
Analysis of the main industrial groups revealed that the
prices of energy sector fell by 3% on a monthly basis and by
7.6% on annual basis in February. This development played
a significant role in decreasing D-PPI. On the other hand, the
downward price movements in domestic energy prices
remained limited compared to the global prices owing to the
rise in foreign exchange rates.
Expectations…
We expect that the annual inflation will continue to decline
thanks to the favorable base effect in March. Moreover, the
performance of TRY as well as the possible impact of
minimum wage hike on services inflation will be the key
factors regarding the inflation outlook in the upcoming
months.
Source: Datastream, Turkstat
February
Change (%) 2015 2016 2015 2016
Monthly 0.71 -0.02 1.20 -0.20
Year-to-Date 1.82 1.80 1.53 0.34
Annual 7.55 8.78 3.10 4.47
Annual Average 8.77 7.97 8.79 5.61
D-PPICPI
8.78
4.47
2
4
6
8
10
Feb-15 Apr-15 Jun-15 Aug-15 Oct-15 Dec-15 Feb-16
Annual Inflation
(%)
CPI
D-PPI
-1.0
-0.5
0.0
0.5
1.0
1.5
Feb-14 Aug-14 Feb-15 Aug-15 Feb-16
Contribution of Seasonal Factors to Monthly
CPI Inflation
(% point)
9.49
9.72
6
7
8
9
10
11
Feb-15 Apr-15 Jun-15 Aug-15 Oct-15 Dec-15 Feb-16
Special CPI Aggregates
(annual % change)
H
I

March 2016
8
Turkish Economy - Financial Markets & Monetary Policy
Downward movement in the risk premiums…
Having started the year with a quite weak performance,
global markets recovered somewhat in February. The risk
premiums followed a downward trend on a global scale
particularly during the second half of the month as it was
considered that the risks facing the global economy were
not as high as previously anticipated and as the
expectations that the leading central banks may come up
with new stimulus measures grew. The bouncing oil prices,
trimming its losses for 2016 to a large extent, also
supported the global markets during this period.
CBRT held the policy rate intact.
CBRT kept the interest rates on hold in February. Without
changing its assessments on economic situation, CBRT, in
practice, continued to implement a tighter monetary policy
stance via the liquidity policy. The weighted average cost of
funding (WACF) reached 9.14% on February 9, the highest
level since June 2014. The WACF became 9.09% as of
February 29.
Upward trend in BIST-100 index…
BIST-100 index performed better than its emerging market
peers in the first two months of the year. BIST-100 index
rose by an almost 6% as of February 29 compared to the
end of 2015 despite the rising geopolitical risks.
Large fluctuations in USD/TRY…
Having declined to a two-month low of 2.8853 on February
4, USD/TRY fluctuated in a wide band in the following
period especially due to the geopolitical developments.
USD/TRY jumped as high as 2.9990 on February 26 and
closed out the month at 2.9644.
A moderate fall in 2-year benchmark bond yield…
Having hovered around 11% since the mid-December,
2-year benchmark bond yield retreated slightly in the recent
period. The yield was realized as 10.97% on February 29.
Source: CBRT, Reuters, Datastream, BIST
-3.0
1.2
1.9
1.9
2.7
3.4
Indonesia
Turkey
South Africa
Bra zil
Russia
India
The Performances of USD/Local Currency
(% change compared to the year-end, as of Feb. 29)
depreciation in local currency
210
260
310
360
410
460
51 0
560
Nov-15 Dec-15 Ja n-16 Feb-16
Eurobond Risk Premiums
(basis points)EMBI+
Turkey
Bra zil
South Africa
Russia
80
85
90
95
100
105
110
Ja n-16 Feb-16
BIST-100 and MSCI Emerging Market Index
BIST-100 MSCI-EM
(12/31/15=100)
8.5
8.8
9.1
9.4
9.5
10.0
10.5
11.0
11.5
12.0
Aug-15 Sep-15 Oct-1 5 Nov-15 Dec-15 Ja n-16 Feb-16
2-Year Benchmark Bond Yield and CBRT WACF
(%)
Benchmark BondCBRT WACF (right axis)

March 2016
9
Banking Sector
Deposit volume rose by 17.7% yoy.
According to BRSA’s Weekly Bulletin, deposit volume
expanded by 17.7% yoy and reached 1,345 billion TRY as of
February 19. According to exchange rate adjusted figures,
on the other hand, annual increase in total deposits was
realized as 8.7%. In this period, TRY deposit volume surged
by 9.6% yoy while FX deposit volume rose by 29.8% yoy
due to the rise in FX rates. Indeed, FX deposits in USD terms
recorded a limited annual increase of 7.3%.
Loan volume…
The annual growth in total loan volume was 19.1% as of
February 19. TRY loans posted an annual rise of 14%, the
slowest rate in 6 years. In this period, FX loans grew by
31.3% yoy whereas FX loans in USD terms increased by only
8.6% yoy.
Non-performing loans (NPL) ratio in the banking sector was
realized as 3.22% as of February 19. Analysis by types of
loans revealed that NPL ratio for consumer loans surged by
100 basis points compared to the same period of the
previous year and reached 4.58%. It was noteworthy that
gross NPL value for consumer loans picked up by 36.4%
while consumer loans increased by 6.9% in this period. NPL
ratio for commercial loans, on the other hand, remained
relatively flat in this period and stood at 2.76%.
The rise in securities portfolio continued.
Securities portfolio of banking sector rose by 8.1% yoy and
was realized as 333 billion TRY as of February 19. Securities
subject to repo transactions, which have the highest share
in securities portfolio by %50, increased by 12% in this
period.
Net FX position...
Banks’ on-balance sheet FX position was (-)24,476 million
USD while off-balance sheet FX position stood at (+)24,856
million USD as of February 19. Hence, banks’ net FX position
became (+)380 million USD in this period.
Source: BRSA Weekly Bulletin
0.0
5.0
10.0
15.0
20.0
25.0
30.0
35.0
Jan.13 Jul.13 Jan.14 Jul.14 Jan.15 Jul.15 Jan.16
Loan Volume
(annual % change)
TRY Loans
FX Loans (in USD terms)
-10.0
-5.0
0.0
5.0
10.0
15.0
20.0
25.0
30.0
Jan.13 Jul.13 Jan.14 Jul.14 Jan.15 Jul.15 Jan.16
Deposit Volume
(annual % change)
TRY Deposits
FX Deposits (in USD terms)
-3
-2
-1
0
1
2
Feb-15 Apr-15 Jun-15 Aug-15 Oct-15 Dec-15 Feb-16
Net FX Position
(USD billion)
2.0
2.5
3.0
3.5
4.0
4.5
5.0
Dec-14 Feb-15 Apr-15 Jun-15 Aug-15 Oct-15 Dec-15 Feb-16
NPL Ratios by Loan Type
(%)
Sector
Consumer Loans
Commercial+Corporate

March 2016
10
Concluding Remarks
Global markets suffered a bad start to 2016. On the other
hand, risk perception showed signs of improvement since
the mid-February as the expectations that the major central
banks would intensify efforts to support the economies via
expansionary monetary policies grew. In light of this
situation, global markets witnessed upward movements
during this period. Nonetheless, it is hard to guess how long
this optimistic mood will last in such an environment that
markets change direction so abruptly.
Since the beginning of the year, volatility in domestic
markets remained relatively limited compared to its
emerging peers. Nevertheless, geopolitical risks have
caused the uncertainties regarding the outlook of the
Turkish economy. What the current conjuncture suggests is
that structural reforms have gained further significance for
Turkey to attain a higher and more sustainable growth
performance.
Our reports are available on our website https://research.isbank.com.tr
Forecasts (%) 2015 2016
Growth 4.0 3.5
CA Deficit/GDP 4.5 5.5
Inflation 8.8 (R) 7.5
(R) Realization
Year-end forecast for inflation

Turkish Economy at a Glance
March 2016 11
Growth
Industrial Production and Capacity Utilization Ratio
Foreign Trade and Current Account Balance
Inflation
(*) Calendar adjusted figures
Source: CBRT, Datastream,Turkstat
-10
-5
0
5
10
15
20
201 1 201 2 201 3 201 4 201 5
Expenditure Approach - Contributions to GDP
Growth (% point)Net Exports
Stock Cha nge
Investment
Consumption
-5
0
5
10
15
201 1 201 2 201 3 201 4 201 5
Production Approach - Contributions to GDP
Growth (% point) Services
Construction
Agriculture
Industry
2.5
4.5
-4
-2
0
2
4
6
8
10
J F M A M J J A S O N D
Industrial Production*
(annual % change) 201 4
201 5
72.8
73.5
71
72
73
74
75
76
77
J F M A M J J A S O N D
Capacity Utilization Ratio
(%)201 5
201 6
-22.0
-19.7
-30
-20
-10
0
10
20
F-1
5
M-1
5
A-1
5
M-1
5
J-1
5
J-1
5
A-1
5
S-1
5
O-1
5
N-1
5
D-1
5
J-1
6
Foreign Trade
(annual % change)ExportsImports
30
32
34
36
38
40
42
44
-1
0
1
2
3
4
5
6
J-1
5
F-1
5
M-1
5
A-1
5
M-1
5
J-1
5
J-1
5
A-1
5
S-1
5
O-1
5
N-1
5
D-1
5
(12-month)(monthly)
Bin
ler
Current Account Deficit
(billion USD)
Monthly
12-month
-0.02
-0.20
-2.0
-1.0
0.0
1.0
2.0
M-1
5
A-1
5
M-1
5
J-1
5
J-1
5
A-1
5
S-1
5
O-1
5
N-1
5
D-1
5
J-1
6
F-1
6
Monthly Inflation
(%)
CPID-PPI
8.78
4.47
0
2
4
6
8
10
12
M-1
5
A-1
5
M-1
5
J-1
5
J-1
5
A-1
5
S-1
5
O-1
5
N-1
5
D-1
5
J-1
6
F-1
6
Annual Inflation
(%)
CPID-PPI

Turkish Economy at a Glance
12
Labor Market
FX Market
Risk Indicators
Interest Rates
Source: BIST, CBRT, Datastream, JP Morgan, Reuters,Turkstat
10.4
51.5
47
48
49
50
51
52
9
10
11
12
D-1
4
J-1
5
F-1
5
M-1
5
A-1
5
M-1
5
J-1
5
J-1
5
A-1
5
S-1
5
O-1
5
N-1
5
Seasonally Adjusted Labour Force Indicators
(%)
Unemployment Rate
Labour Force Participation Rate (right axis)25.8
26.0
26.2
26.4
26.6
26.8
27.0
D-1
4
J-1
5
F-1
5
M-1
5
A-1
5
M-1
5
J-1
5
J-1
5
A-1
5
S-1
5
O-1
5
N-1
5
Bin
ler
Seasonally Adjusted Employment
(million persons)
2.3
2.5
2.7
2.9
3.1
3.3
M-1
5
A-1
5
M-1
5
J-1
5
J-1
5
A-1
5
S-1
5
O-1
5
N-1
5
D-1
5
J-1
6
F-1
6
Currency Basket
0.5*EUR+0.5*USD
99.3
69.6
115.2
60
70
80
90
100
110
120
130
140
F-1
5
M-1
5
A-1
5
M-1
5
J-1
5
J-1
5
A-1
5
S-1
5
O-1
5
N-1
5
D-1
5
J-1
6
CPI Based Real Effective Exchange Rate
REERDeveloping C ountries Ba sed (right axis)Developed Countries Based
150
250
350
450
550
F-1
5
M-1
5
A-1
5
M-1
5
J-1
5
J-1
5
A-1
5
S-1
5
O-1
5
N-1
5
D-1
5
J-1
6
F-1
6
Risk Premiums
(basis point)EMBI+
EMBI+(TR)
10
15
20
25
30
35
40
M-1
5
A-1
5
M-1
5
J-1
5
J-1
5
A-1
5
S-1
5
O-1
5
N-1
5
D-1
5
J-1
6
F-1
6
VIX
7.5
8.0
8.5
9.0
9.5
M-1
5
A-1
5
M-1
5
J-1
5
J-1
5
A-1
5
S-1
5
O-1
5
N-1
5
D-1
5
J-1
6
F-1
6
Weighted Average Cost of CBRT Funding
(%)
6
7
8
9
10
11
12
M-1
5
A-1
5
M-1
5
J-1
5
J-1
5
A-1
5
S-1
5
O-1
5
N-1
5
D-1
5
J-1
6
F-1
6
Compound Yield of 2-Year Benchmark Bond
(%)
March 2016

Turkish Economy at a Glance
13
Bond-Bill Market
Survey of Expectations and Other Leading Indicators
(R) Realization Source: BIST, CBRT, Datastream, Economic Research Division, Treasury
11.0
7
8
9
10
11
12
M-1
5
A-1
5
M-1
5
J-1
5
J-1
5
A-1
5
S-1
5
O-1
5
N-1
5
D-1
5
J-1
6
F-1
6
Average Compound Yields in Treasury
Auctions (%)
2.8
0
1
2
3
4
M-1
5
A-1
5
M-1
5
J-1
5
J-1
5
A-1
5
S-1
5
O-1
5
N-1
5
D-1
5
J-1
6
F-1
6
Expected Real Yield of TRY GDDIs
(%)
3.6
2.5
3.0
3.5
4.0
4.5
5.0
201 3 201 4 201 5 201 6
Expected GDP Growth for the Current Year (%)
2013 (R): 4.2 2014 (R): 2.9
-33.8
-70
-60
-50
-40
-30
201 3 201 4 201 5 201 6
Expected CAD for the Current Year
(billion USD)
2013 (R): -63.6 2014 (R): -43.6 2015 (R): -32.2
8.48
4
5
6
7
8
9
10
201 3 201 4 201 5 201 6
Expected CPI Inflation by the End of the Year
(annual, %)
2013 (R): 7.40 2014 (R): 8.17 2015 (R): 8.813.1469
1.50
1.75
2.00
2.25
2.50
2.75
3.00
3.25
3.50
201 3 201 4 201 5 201 6
Expected Level of USD/TRY by the End of the
Year
2013 (R): 2.1343 2014 (R): 2.3189 2015 (R): 2.9076
7.96
7.29
5.0
5.5
6.0
6.5
7.0
7.5
8.0
201 3 201 4 201 5 201 6
Expected CPI Inflation for the next 12 and 24
Months (annual, % )
12 Months
24 Months
66.6
104.5
50
60
70
80
90
100
110
120
M-1
5
A-1
5
M-1
5
J-1
5
J-1
5
A-1
5
S-1
5
O-1
5
N-1
5
D-1
5
J-1
6
F-1
6
Confidence Indicators
Consumer Confidence Index
Real Sector C onfidence Index
March 2016

Growth 2010 2011 2012 2013 2014 15-Q1 15-Q2 15-Q3
GDP (USD billion) 731.6 774.0 786.3 823.0 799.0 181.1 180.7 184.2
GDP (TRY billion) 1,099 1,298 1,417 1,567 1,747 444.6 482.4 518.6
GDP Growth Rate (%) 9.2 8.8 2.1 4.2 2.9 2.5 3.8 4.0
Inflation (%) Dec-15 Jan-16 Feb-16
CPI (annual) 6.40 10.45 6.16 7.40 8.17 8.81 9.58 8.78
Domestic PPI (annual) 8.87 13.33 2.45 6.97 6.36 5.71 5.94 4.47
Sep-15 Oct-15 Nov-15
Unemployment Rate (%) 10.0 8.5 8.8 9.1 10.4 10.4 10.6 10.4
Labor Force Participation Rate (%) 47.1 47.2 48.5 48.5 50.9 51.6 51.6 51.5
Dec-15 Jan-16 Feb-16
CPI Based Real Effective Exchange Rate 119.1 102.7 110.2 100.9 105.5 98.4 99.3
USD/TRY 1.5413 1.8934 1.7819 2.1323 2.3290 2.9207 2.9635 2.9638
EUR/TRY 2.0600 2.4497 2.3508 2.9370 2.8297 3.1867 3.2321 3.2334
Currency Basket (0.5*EUR+0.5*USD) 1.8007 2.1716 2.0664 2.5347 2.5794 3.0537 3.0978 3.0986
Nov-15 Dec-15 Jan-16
Exports 113.9 134.9 152.5 151.8 157.6 145.4 143.9 141.2
Imports 185.5 240.8 236.5 251.7 242.2 211.0 207.2 203.9
Foreign Trade Balance -71.7 -105.9 -84.1 -99.9 -84.6 -65.6 -63.3 -62.7
Import Coverage Ratio (%) 61.4 56.0 64.5 60.3 65.1 68.9 69.4 69.2
Oct-15 Nov-15 Dec-15
Current Account Balance -44.6 -74.4 -48.0 -63.6 -43.6 -37.1 -33.8 -32.2
Capital and Financial Accounts -45.1 -66.1 -48.9 -62.3 -42.1 -30.0 -23.3 -22.6
Direct Investments (net) -7.6 -13.8 -9.2 -8.8 -5.5 -10.1 -11.2 -11.5
Portfolio Investments (net) -16.1 -22.2 -41.0 -24.0 -20.1 7.0 13.3 15.4
Other Investments (net) -34.2 -28.3 -19.6 -39.5 -16.0 -17.0 -14.6 -14.6
Reserve Assets (net) 12.8 -1.8 20.8 9.9 -0.5 -9.8 -10.8 -11.8
Net Errors and Omissions -0.5 8.3 -0.9 1.4 1.6 7.1 10.5 9.7
Current Account Balance/GDP (%) -6.1 -9.6 -6.1 -7.7 -5.5 - - -
Nov-15 Dec-15 Jan-16
Expenditures 294.4 314.6 361.9 408.2 448.8 447.2 506.0 42.5
Interest Expenditures 48.3 42.2 48.4 50.0 49.9 51.3 53.0 5.6
Non-interest Expenditures 246.1 272.4 313.5 358.2 398.8 396.0 453.0 36.9
Revenues 254.3 296.8 332.5 389.7 425.4 441.8 483.4 46.7
Tax Revenues 210.6 253.8 278.8 326.2 352.5 372.7 407.5 39.7
Budget Balance -40.1 -17.8 -29.4 -18.5 -23.4 -5.4 -22.6 4.2
Primary Balance 8.2 24.4 19.0 31.4 26.5 45.8 30.4 9.8
Budget Balance/GDP (%) -3.6 -1.4 -2.1 -1.2 -1.3 - - -
Nov-15 Dec-15 Jan-16
Domestic Debt Stock 352.8 368.8 386.5 403.0 414.6 439.5 440.1 443.1
External Debt Stock 120.7 149.6 145.7 182.8 197.5 236.8 237.5 242.8
Total Debt Stock 473.6 518.4 532.2 585.8 612.1 676.2 677.6 685.8
(1) 12-month cumulative
(2) Year-to-date cumulative
(3) According to Central Government Budget
Central Government Debt Stock (TRY billion)
Seasonally Adjusted Labor Market Figures
FX Rates
Foreign Trade Balance(1) (USD billion)
Balance of Payments(1) (USD billion)
Budget(2)(3) (TRY billion)
Turkish Economy at a Glance
14
Source: CBRT, Datastream, Ministry of Finance, Reuters,Treasury, Turkstat
March 2016

Banking Sector Outlook
15
(TRY billion) 2010 2011 2012 2013 2014 Dec.15 Jan.16 Change(1)
TOTAL ASSETS 1,006.7 1,217.7 1,370.7 1,732.4 1,994.3 2,357.5 2,375.4 19.1
Loans 525.9 682.9 794.8 1,047.4 1,240.7 1,485.0 1,498.0 20.7
TRY Loans 383.8 484.8 588.4 752.7 881.0 1,013.4 1,017.0 15.4
Share (%) 73.0 71.0 74.0 71.9 71.0 68.2 67.9 -
FX Loans 142.1 198.1 206.4 294.7 359.7 471.5 481.0 33.7
Share (%) 27.0 29.0 26.0 28.1 29.0 31.8 32.1 -
Non-performing Loans 20.0 19.0 23.4 29.6 36.4 47.5 49.3 35.3
Non-performing Loan Rate (%) 3.7 2.7 2.9 2.8 2.9 3.1 3.2 -
Securities 287.9 285.0 270.0 286.7 302.3 329.7 334.8 10.8
TOTAL LIABILITIES 1,006.7 1,217.7 1,370.7 1,732.4 1,994.3 2,357.5 2,375.4 19.1
Deposits 617.0 695.5 772.2 945.8 1,052.7 1,245.4 1,249.8 18.7
TRY Deposits 433.5 460.0 520.4 594.1 661.3 715.4 722.0 9.2
Share (%) 70.3 66.1 67.4 62.8 62.8 57.4 57.8 -
FX Deposits 183.5 235.5 251.8 351.7 391.4 530.0 527.8 34.9
Share (%) 29.7 33.9 32.6 37.2 37.2 42.6 42.2 -
Securities Issued 3.1 18.4 37.9 60.6 89.3 97.8 98.1 9.9
Payables to Banks 122.4 167.4 173.4 254.2 293.2 361.3 366.6 25.0
Funds from Repo Transactions 57.5 97.0 79.9 119.1 137.4 156.7 163.7 19.1
SHAREHOLDERS' EQUITY 134.5 144.6 181.9 193.7 232.0 262.3 264.3 13.9
Profit (Loss) of the Period 22.1 19.8 23.5 24.7 24.6 26.1 2.5 -
RATIOS (%)
Loans/GDP 47.9 52.6 56.1 66.8 71.0 - - -
Loans/Assets 52.2 56.1 58.0 60.5 62.2 63.0 63.1 -
Securities/Assets 28.6 23.4 19.7 16.6 15.2 14.0 14.1 -
Deposits/Liabilities 61.3 57.1 56.3 54.6 52.8 52.8 52.6 -
Loans/Deposits 85.2 98.2 102.9 110.7 117.9 119.2 119.9 -
Capital Adequacy (%) 19.0 16.6 17.9 15.3 16.3 15.6 15.2 -
(1) Year-to-date % change
BANKING SECTOR ACCORDING TO BRSA's MONTHLY BULLETIN FIGURES
Source: BRSA
March 2016

LEGAL NOTICE
This report has been prepared by Türkiye İş Bankası A.Ş. economists and analysts by using the
information from publicly available sources believed to be reliable, solely for information
purposes; and they are not intended to be construed as an offer or solicitation for the purchase
or sale of any financial instrument or the provision of an offer to provide investment services.
The views, opinions and analyses expressed do not represent the official standing of Türkiye İş
Bankası A.Ş. and are personal views and opinions of the analysts and economists who prepare
the report. No representation or warranty, express or implied, is made as to the accuracy or
completeness of the information contained in this report. All information contained in this report
is subject to change without notice, Türkiye İş Bankası A,Ş, accepts no liability whatsoever for
any direct or consequential loss arising from any use of this report or its contents.
This report is copyright-protected. Reproducing, publishing and/or distributing this report in
whole or in part is therefore prohibited. All rights reserved.
Recommended