January 2013 Quick Facts
A RESEARCH TOOL PROVIDED BY METROLIST® SINGLE FAMILY LISTINGS ONLY – RESIDENTIAL AND CONDO
Market Overview 2Active Listings 3Pending Listings 4Under Contract Listings 5New Listings 6Sold Listings 7Total Days on Market 8Median Sold Price 9Average Sold Price 10
11Annual Review 12
Click on desired metric to jump to that page.
All data from Metrolist®. Metrolist® is a registered trademark of Metrolist, Inc. © 2012 Metrolist, Inc. All rights reserved. | 1
Monthly Indicators
Percent of Sold Price to List Price
+ 19.3%
Change inSold Listings
+ 15.0%
Change inMedian Sold Price
- 1.4%
Change inNew Listings
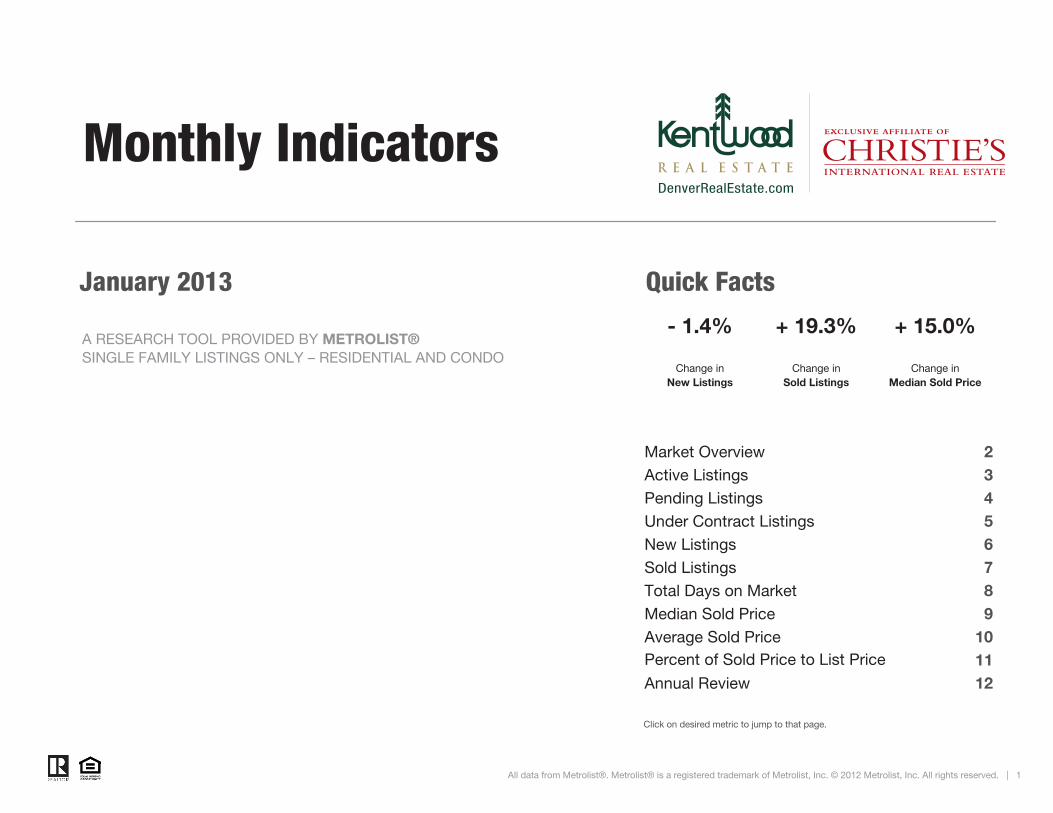
Market Overview Key market metrics for the current month and year-to-date. Single-Family Listings Only – Residential and Condo.
Key Metrics Historical Sparklines 1-2012 1-2013 + / –Last Year
YTDThis Year
YTD+ / –
* Pending Listings is a count of the number of homes that were in "pending" status at the end of the month. This information was not available prior to January 2010. ** Does not account for seller concessions and/or down payment assistance.
Active Listings 11,453 8,059 - 29.6% -- -- --
- 25.6%
1,673 1,513 - 9.6%
+ 27.7%
- 1.4%
4,470
4,581
3,501
4,644
102
97.4%
3,042 + 19.3%
102 76
$251,032 $275,196 + 9.6%
$200,000 $229,900
2,550 3,042 + 19.3% 2,550
76
Average Sold Price**
+ 15.0%
All data from Metrolist®. Powered by 10K Research and Marketing. Due to differences in statistical methodologies, figures may vary from other market reports provided by Metrolist®. | Click for Cover | 2
+ 15.0% $200,000 $229,900
+ 2.3%+ 2.3% 97.4% 99.7%
$275,196 + 9.6%
99.7%Percent of Sold Priceto List Price**
$251,032
Median Sold Price**
Pending Listings* 1,673 1,513 - 9.6%
Total Days on Market
Under Contract Listings
New Listings
Sold Listings
3,501 4,470 + 27.7%
4,644 4,581 - 1.4%
- 25.6%
1-2010 1-2011 1-2012 1-2013
1-2010 1-2011 1-2012 1-2013
1-2010 1-2011 1-2012 1-2013
1-2010 1-2011 1-2012 1-2013
1-2010 1-2011 1-2012 1-2013
1-2010 1-2011 1-2012 1-2013
1-2010 1-2011 1-2012 1-2013
1-2010 1-2011 1-2012 1-2013
1-2011 1-2012 1-2013
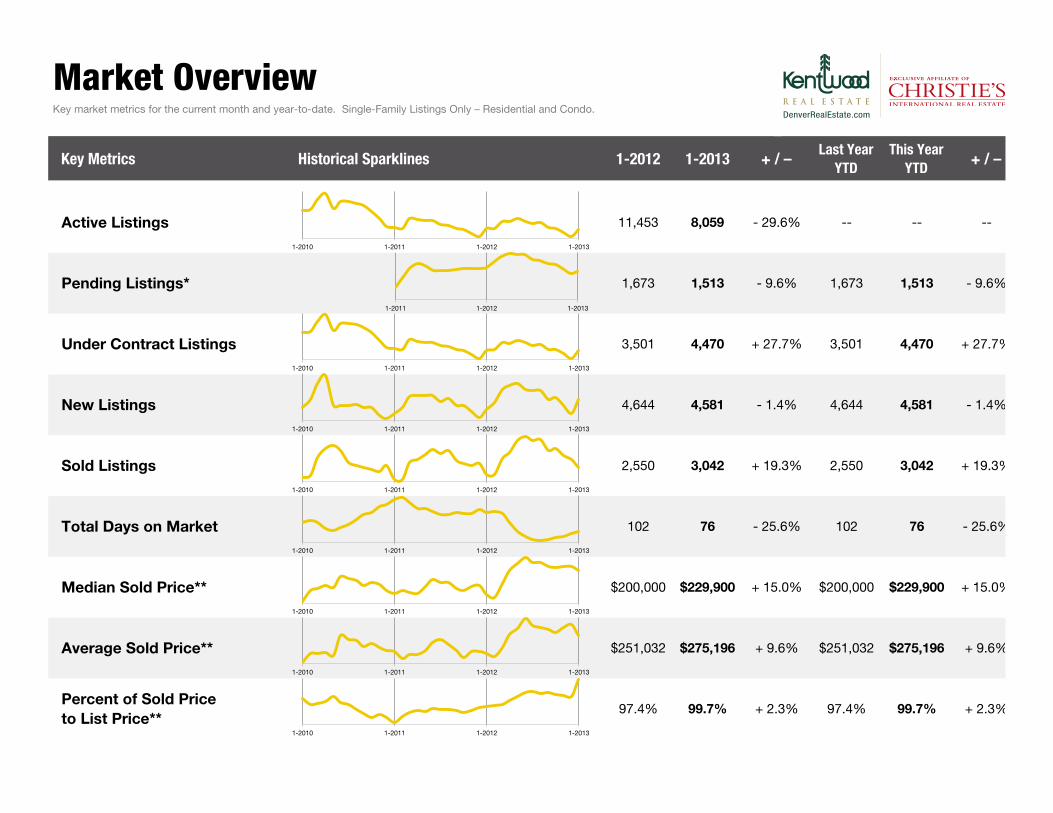
Active Listings The number of homes that were in "active" status at the end of the month.
All data from Metrolist®. Powered by 10K Research and Marketing. Due to differences in statistical methodologies, figures may vary from other market reports provided by Metrolist®. | Click for Cover | 3
19,304
11,453
8,059
2011 2012 2013
January
6,000
8,000
10,000
12,000
14,000
16,000
18,000
20,000
22,000
24,000
26,000
1-2009 1-2010 1-2011 1-2012 1-2013
Historical Active Listing Activity
-29.6% -40.7%
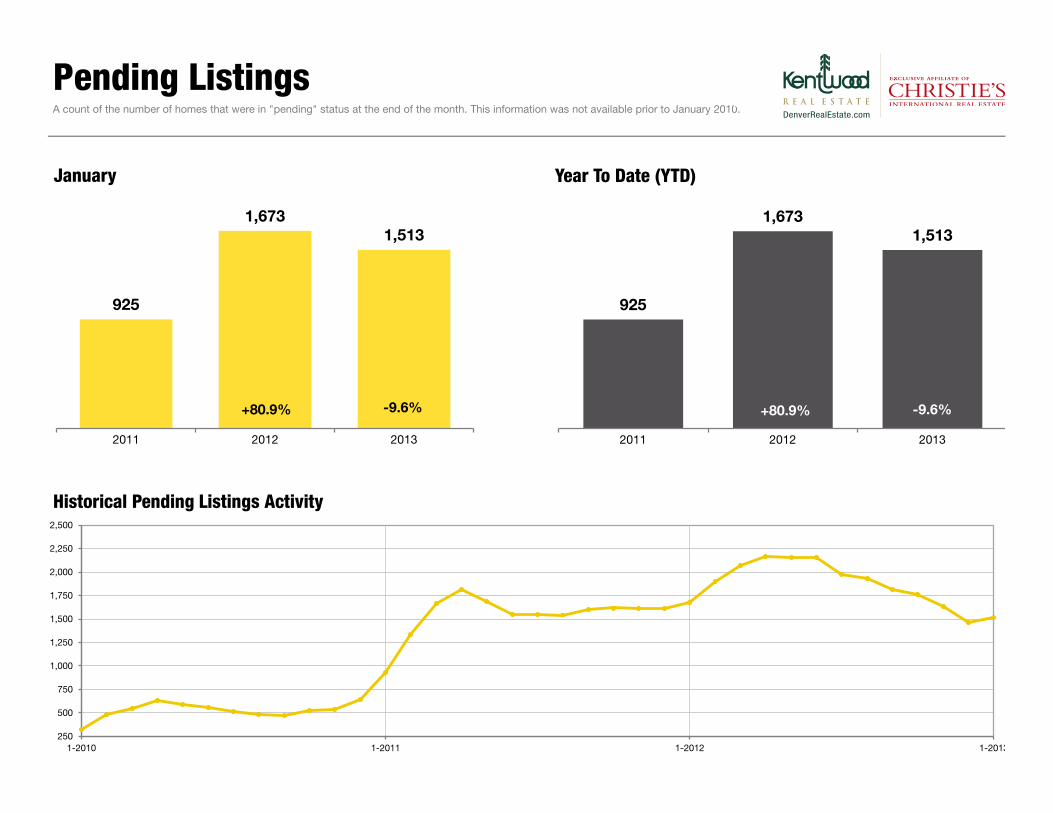
Pending Listings A count of the number of homes that were in "pending" status at the end of the month. This information was not available prior to January 2010.
All data from Metrolist®. Powered by 10K Research and Marketing. Due to differences in statistical methodologies, figures may vary from other market reports provided by Metrolist®. | Click for Cover | 4
925
1,673 1,513
2011 2012 2013
January
250
500
750
1,000
1,250
1,500
1,750
2,000
2,250
2,500
1-2010 1-2011 1-2012 1-2013
Historical Pending Listings Activity
925
1,673 1,513
2011 2012 2013
Year To Date (YTD)
-9.6% +80.9% -9.6% +80.9%
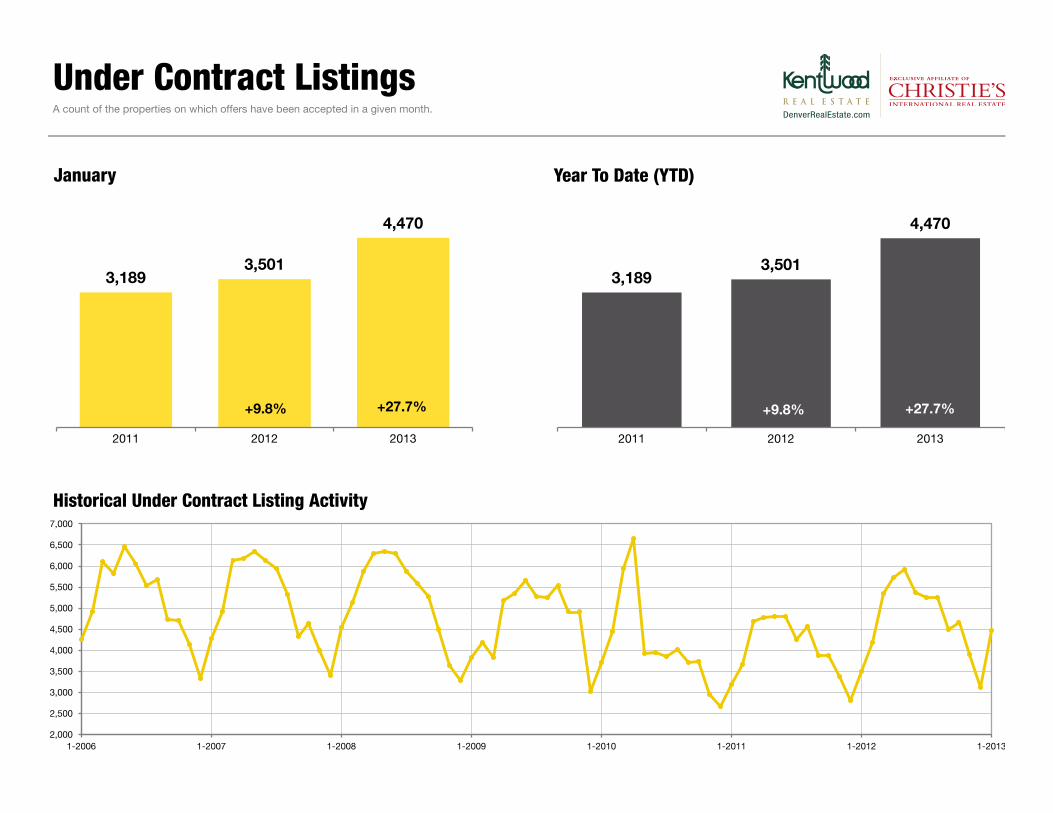
Under Contract Listings A count of the properties on which offers have been accepted in a given month.
Note: The method used to calculate the "Under Contract" metric was updated in August 2012 so comparisons to previously reported figures may differ.All data from Metrolist®. Powered by 10K Research and Marketing. Due to differences in statistical methodologies, figures may vary from other market reports provided by Metrolist®. | Click for Cover | 5
3,189 3,501
4,470
2011 2012 2013
January
2,000
2,500
3,000
3,500
4,000
4,500
5,000
5,500
6,000
6,500
7,000
1-2006 1-2007 1-2008 1-2009 1-2010 1-2011 1-2012 1-2013
Historical Under Contract Listing Activity
3,189 3,501
4,470
2011 2012 2013
Year To Date (YTD)
+27.7% +9.8% +27.7% +9.8%
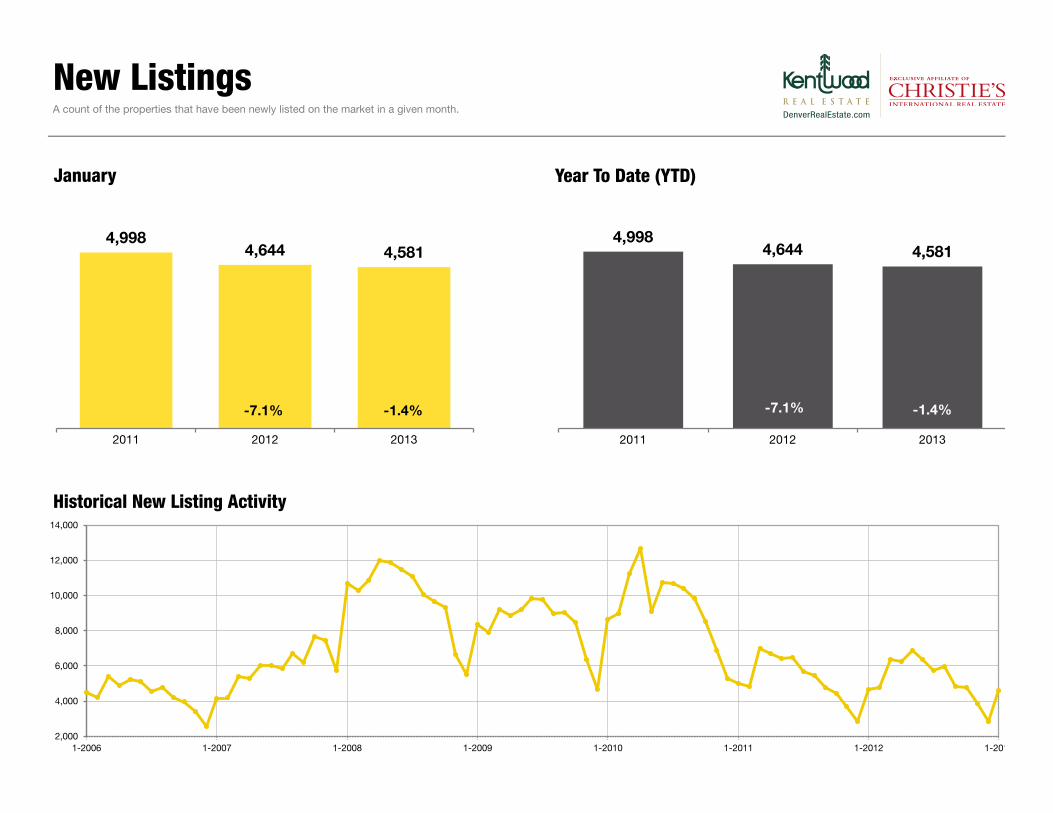
New Listings A count of the properties that have been newly listed on the market in a given month.
All data from Metrolist®. Powered by 10K Research and Marketing. Due to differences in statistical methodologies, figures may vary from other market reports provided by Metrolist®. | Click for Cover | 6
4,998 4,644 4,581
2011 2012 2013
January
2,000
4,000
6,000
8,000
10,000
12,000
14,000
1-2006 1-2007 1-2008 1-2009 1-2010 1-2011 1-2012 1-2013
Historical New Listing Activity
4,998 4,644 4,581
2011 2012 2013
Year To Date (YTD)
-1.4% -7.1% -1.4% -7.1%
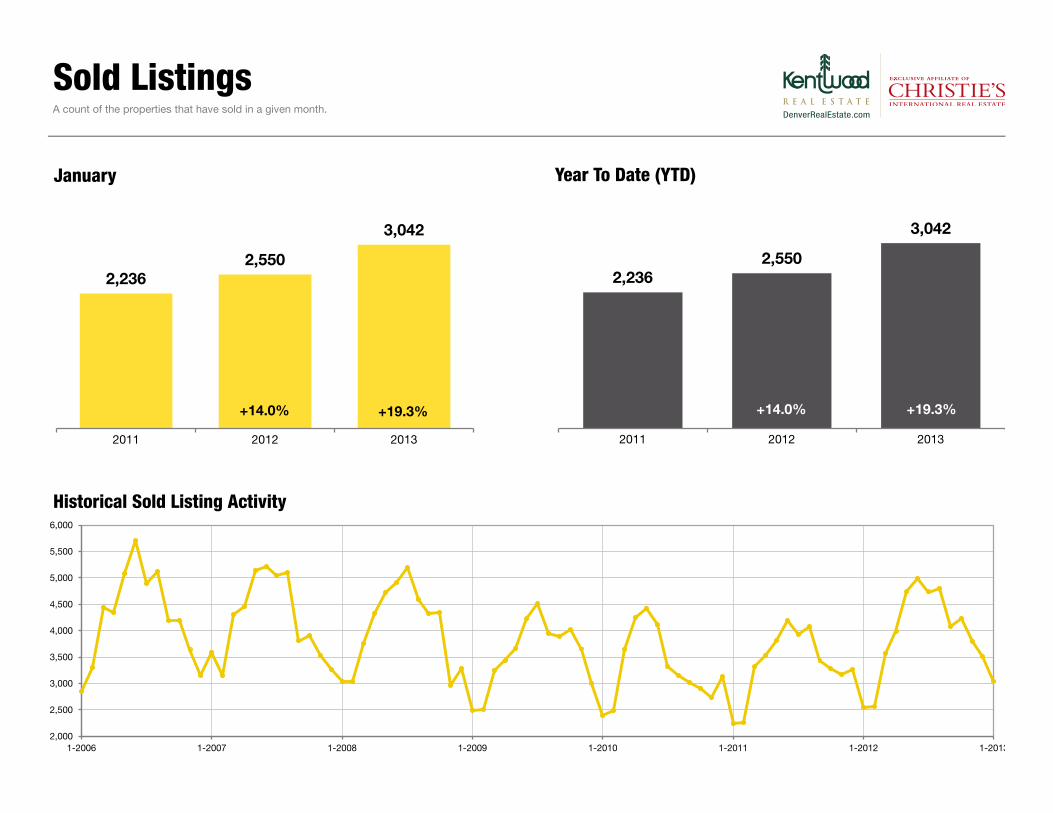
Sold Listings A count of the properties that have sold in a given month.
All data from Metrolist®. Powered by 10K Research and Marketing. Due to differences in statistical methodologies, figures may vary from other market reports provided by Metrolist®. | Click for Cover | 7
2,236 2,550
3,042
2011 2012 2013
January
2,000
2,500
3,000
3,500
4,000
4,500
5,000
5,500
6,000
1-2006 1-2007 1-2008 1-2009 1-2010 1-2011 1-2012 1-2013
Historical Sold Listing Activity
2,236 2,550
3,042
2011 2012 2013
Year To Date (YTD)
+19.3% +14.0% +19.3% +14.0%
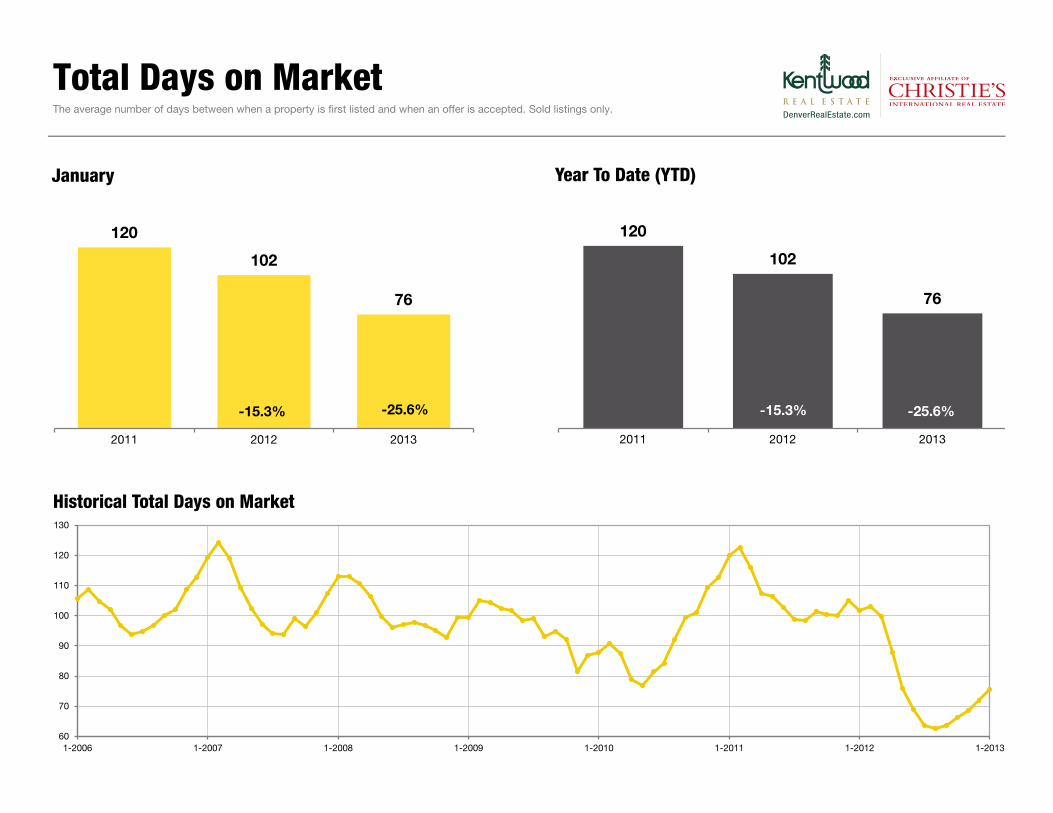
Total Days on Market The average number of days between when a property is first listed and when an offer is accepted. Sold listings only.
All data from Metrolist®. Powered by 10K Research and Marketing. Due to differences in statistical methodologies, figures may vary from other market reports provided by Metrolist®. | Click for Cover | 8
120
102
76
2011 2012 2013
January
60
70
80
90
100
110
120
130
1-2006 1-2007 1-2008 1-2009 1-2010 1-2011 1-2012 1-2013
Historical Total Days on Market
120
102
76
2011 2012 2013
Year To Date (YTD)
-25.6% -15.3% -25.6% -15.3%
Median Sold Price
All data from Metrolist®. Powered by 10K Research and Marketing. Due to differences in statistical methodologies, figures may vary from other market reports provided by Metrolist®. | Click for Cover | 9
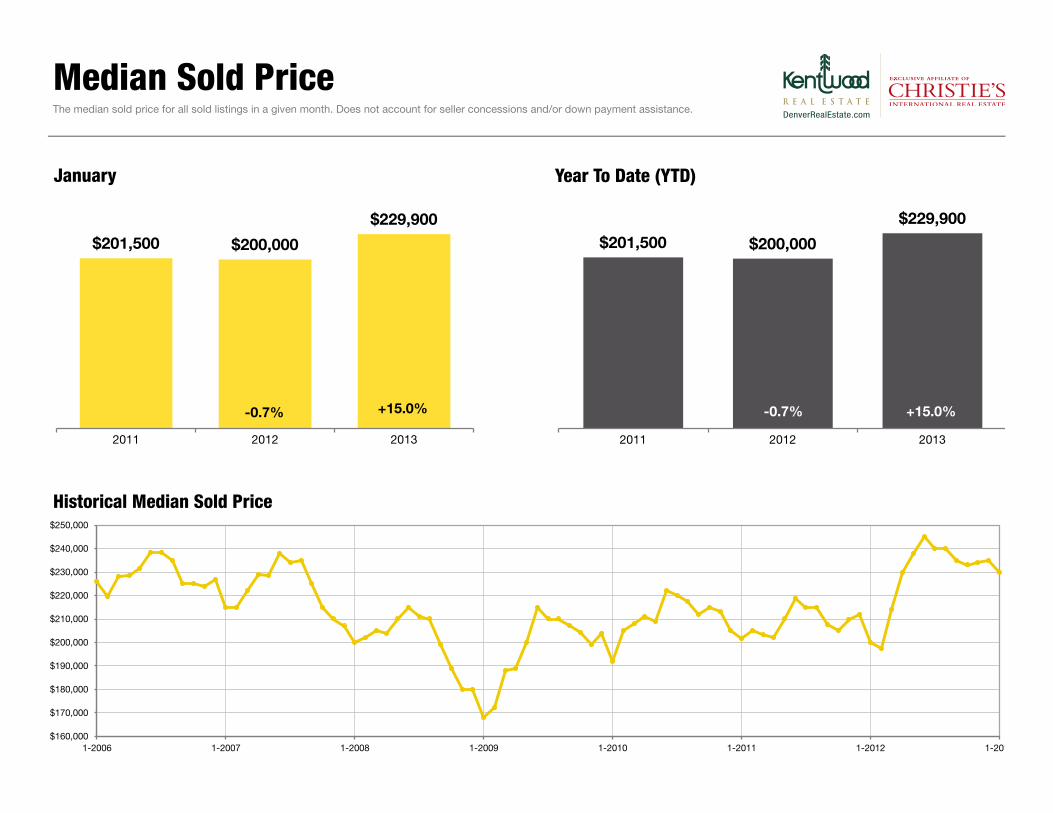
The median sold price for all sold listings in a given month. Does not account for seller concessions and/or down payment assistance.
$201,500 $200,000
$229,900
2011 2012 2013
January
$160,000
$170,000
$180,000
$190,000
$200,000
$210,000
$220,000
$230,000
$240,000
$250,000
1-2006 1-2007 1-2008 1-2009 1-2010 1-2011 1-2012 1-2013
Historical Median Sold Price
$201,500 $200,000
$229,900
2011 2012 2013
Year To Date (YTD)
+15.0% -0.7% +15.0% -0.7%
Average Sold Price
All data from Metrolist®. Powered by 10K Research and Marketing. Due to differences in statistical methodologies, figures may vary from other market reports provided by Metrolist®. | Click for Cover | 10
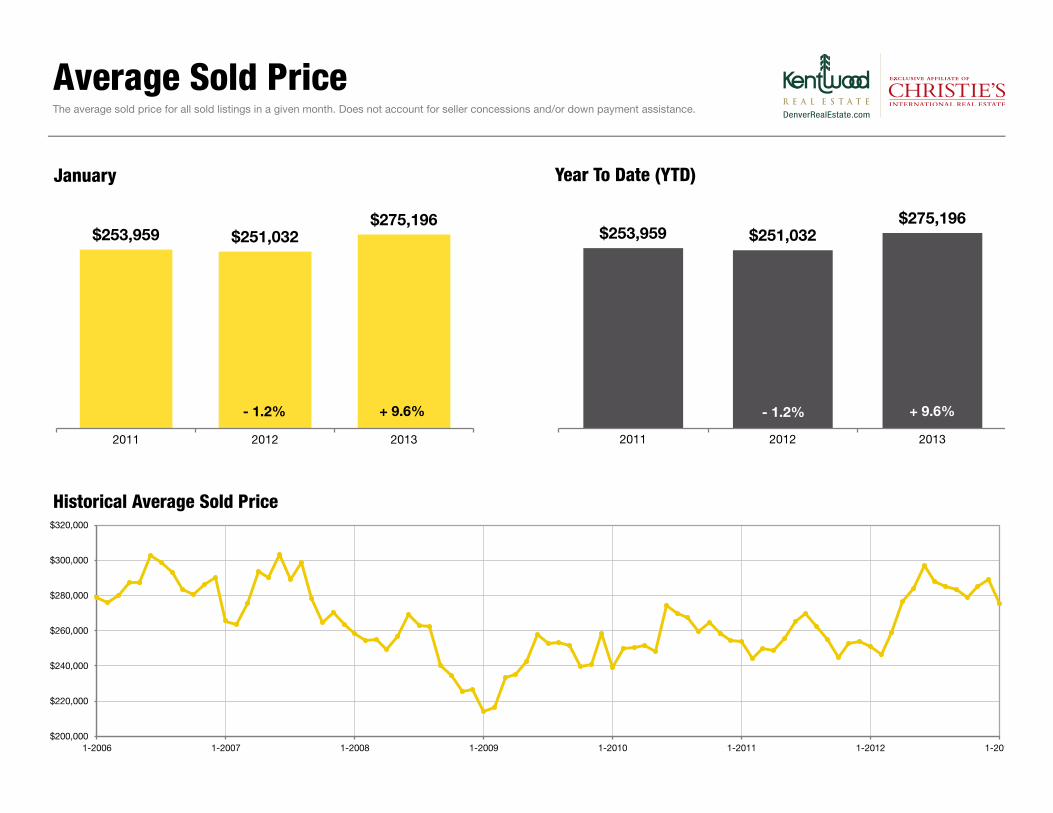
The average sold price for all sold listings in a given month. Does not account for seller concessions and/or down payment assistance.
$253,959 $251,032 $275,196
2011 2012 2013
January
$200,000
$220,000
$240,000
$260,000
$280,000
$300,000
$320,000
1-2006 1-2007 1-2008 1-2009 1-2010 1-2011 1-2012 1-2013
Historical Average Sold Price
$253,959 $251,032 $275,196
2011 2012 2013
Year To Date (YTD)
+ 9.6% - 1.2% - 1.2% + 9.6%
Percent of Sold Price to List Price
All data from Metrolist®. Powered by 10K Research and Marketing. Due to differences in statistical methodologies, figures may vary from other market reports provided by Metrolist®. | Click for Cover | 11
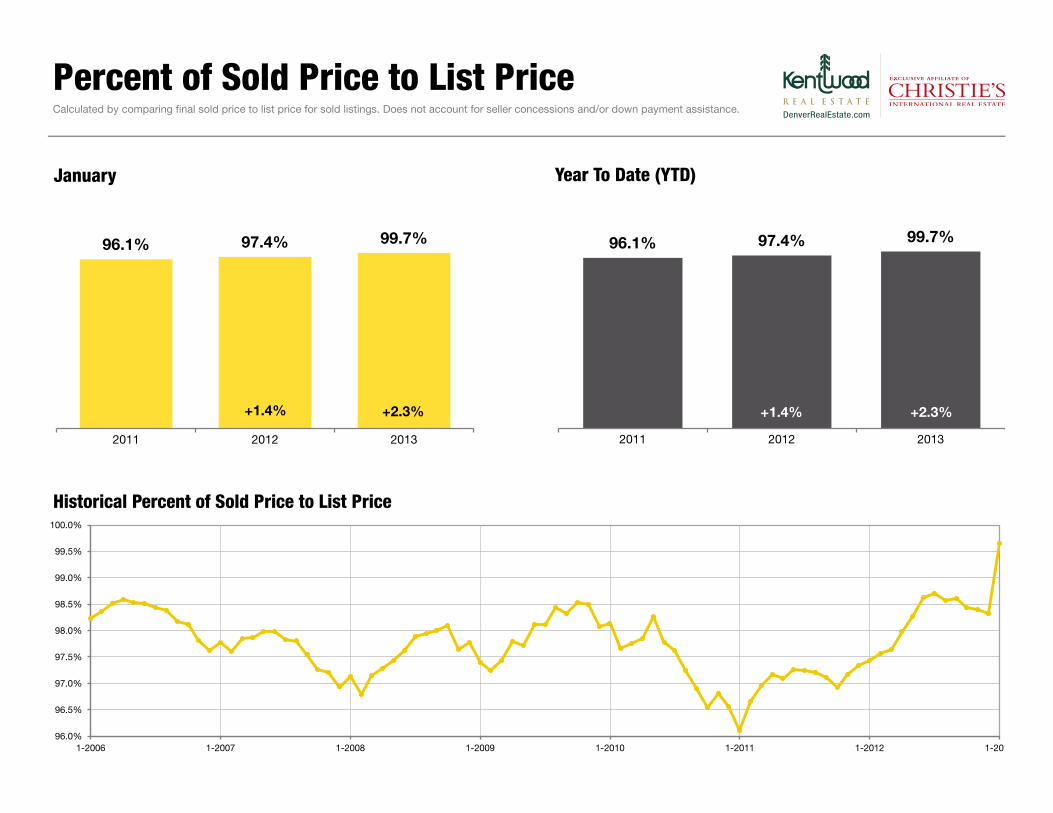
Calculated by comparing final sold price to list price for sold listings. Does not account for seller concessions and/or down payment assistance.
96.1% 97.4% 99.7%
2011 2012 2013
January
96.0%
96.5%
97.0%
97.5%
98.0%
98.5%
99.0%
99.5%
100.0%
1-2006 1-2007 1-2008 1-2009 1-2010 1-2011 1-2012 1-2013
Historical Percent of Sold Price to List Price
96.1% 97.4% 99.7%
2011 2012 2013
Year To Date (YTD)
+2.3% +1.4% +2.3% +1.4%
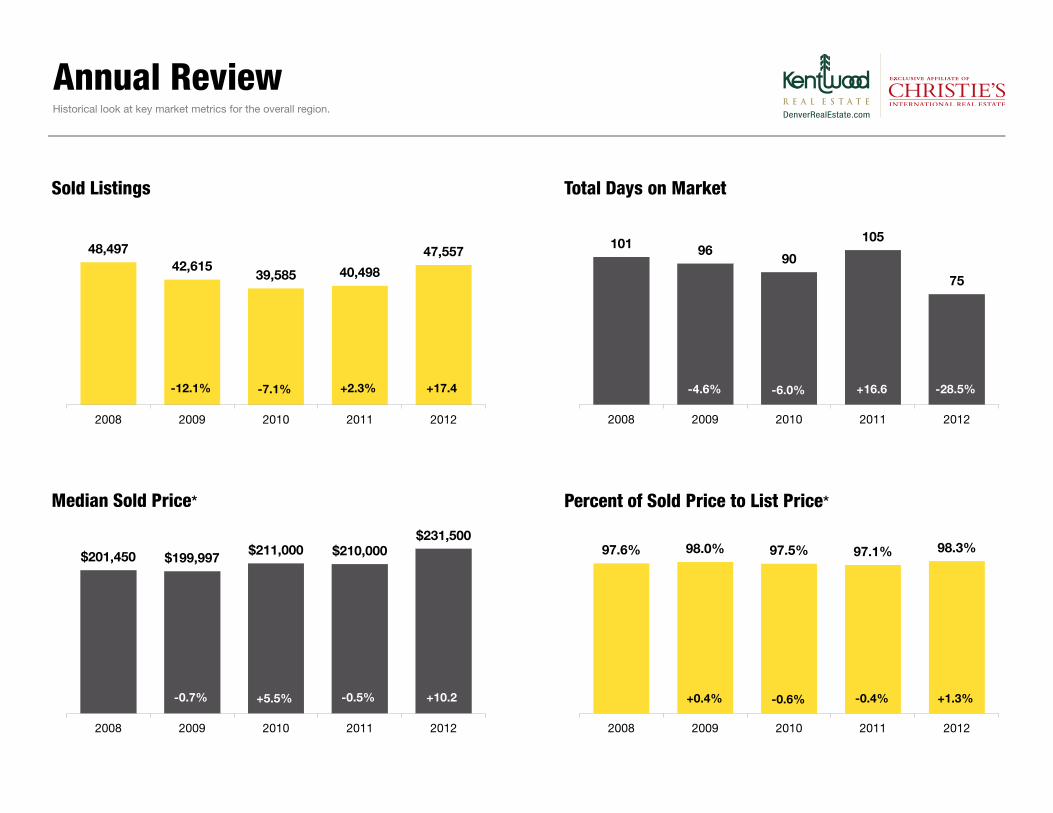
Annual Review Historical look at key market metrics for the overall region.
* Does not account for seller concessions and/or down payment assistance.All data from Metrolist®. Powered by 10K Research and Marketing. Due to differences in statistical methodologies, figures may vary from other market reports provided by Metrolist®. | Click for Cover | 12
48,497 42,615
39,585 40,498
47,557
2008 2009 2010 2011 2012
Sold Listings
101 96 90
105
75
2008 2009 2010 2011 2012
Total Days on Market
$201,450 $199,997 $211,000 $210,000 $231,500
2008 2009 2010 2011 2012
Median Sold Price*
97.6% 98.0% 97.5% 97.1% 98.3%
2008 2009 2010 2011 2012
Percent of Sold Price to List Price*
-12.1% -7.1% +2.3% +17.4 -4.6% -6.0% +16.6 -28.5%
-0.7% +5.5% -0.5% +10.2 +0.4% -0.6% -0.4% +1.3%
Recommended