© H
ou
gh
ton
Mif
flin
Ha
rco
urt
Pu
blis
hin
g C
om
pa
ny
Chapter 10 two hundred twenty-one P221
Dear Family,My class started Chapter 10 this week. In this chapter, I will learn about collecting data, making graphs, and interpreting the data. Love,
Vocabularypicture graph A graph that uses
pictures to show data
bar graph A graph that uses bars to
show data
Home Activity
Take your child on a walk in your
neighborhood. Help your child make a
tally chart to record how many people
you see driving, walking, and biking.
Then talk with your child about the
information that is in your tally chart.
LiteratureReading math stories
reinforces learning.
Look for these books
at the library.
Tables and Graphs of
Healthy Things
by Joan Freese. Gareth
Stevens Publishing, 2008.
Chapter
10
Lemonade for Sale
by Stuart J. Murphy.
Harper Collins, 1998.

© H
ou
gh
ton
Mif
flin
Ha
rco
urt
Pu
blis
hin
g C
om
pa
ny
P222 two hundred twenty-two
© H
ou
gh
ton
Mif
flin
Ha
rco
u
wenty two
Querida familia:Mi clase comenzó el Capítulo 10 esta semana. En este capítulo, aprenderé a recolectar datos, hacer gráficas e interpretar datos.
Con cariño,
Vocabulariopictografía una gráfica que usa
ilustraciones para mostrar datos
gráfica de barras una gráfica que usa
barras para mostrar datos
Actividad para la casa
Lleve a pasear a su hijo por el vecindario.
Ayúdelo a crear una tabla de conteo para
anotar cuántas personas ven manejando,
caminando y montando en bicicleta. Luego,
conversen sobre la información que hay en
la tabla de conteo.
LiteraturaLeer cuentos de matemáticas
refuerza los conceptos. Busque
estos libros en la biblioteca.
Table and Graphs of Healthy Thingspor Joan Freese.Gareth Stevens Publishing, 2008.
Lemonade for Salepor Stuart J. Murphy.Harper Collins, 1998.
Capítulo
10

© H
ou
gh
ton
Mif
flin
Ha
rco
urt
Pu
blis
hin
g C
om
pa
ny
Name
Chapter 10 two hundred twenty-three P223
Lesson 10.1COMMON CORE STANDARD MACC.2.MD.4.10
Represent and interpret data.Collect Data
1. Take a survey. Ask 10 classmates
how they got to school. Use tally
marks to show their choices.
5. In which way did the most classmates
get to school?
________________________
6. Did more classmates get to school
by walking or by riding in a car?
________________________
How many more? ______ more classmates
2. How many classmates rode in a
bus to school?
______ classmates
3. How many classmates rode in
a car to school?
______ classmates
4. In which way did the fewest
classmates get to school?
________________________

© H
ou
gh
ton
Mif
flin
Ha
rco
urt
Pu
blis
hin
g C
om
pa
ny
P224 two hundred twenty-four
1. Use the tally chart. Which color
did the fewest children choose?
blue
green
red
yellow
Spiral Review (MACC.2.MD.2.5, MACC.2.MD.2.6, MACC.2.MD.3.7, MACC.2.MD.3.8)
2. Which group of coins has a value
of $1.00? (Lesson 7.5)
10 pennies
10 nickels
10 dimes
10 quarters
3. Jared has two ropes. Each
rope is 9 inches long. How
many inches of rope does he
have in all? (Lesson 8.5)
10 inches 18 inches
16 inches 21 inches
4. The clock shows the time Lee
got to school. At what time did
she get to school? (Lesson 7.11)
3:40 A.M. 3:40 P.M.
8:15 A.M. 8:15 P.M.
5. Liza finished studying at
half past 3. What time did
Liza finish studying? (Lesson 7.10)
3:30
3:15
2:45
2:15
Lesson Check (MACC.2.MD.4.10)

© H
ou
gh
ton
Mif
flin
Ha
rco
urt
Pu
blis
hin
g C
om
pa
ny
Name
Use the picture graph above. Write or draw to explain.
5. Carlos read 4 books. How many children
read fewer books than Carlos?
______ children
Chapter 10 two hundred twenty-five P225
Lesson 10.2COMMON CORE STANDARD MACC.2.MD.4.10
Represent and interpret data.Read Picture Graphs
Use the picture graph to answer the questions.
1. How many books in all did Henry and Anna read? ______ books
2. How many more books did Ryan read than Gwen? ______ more books
3. How many fewer books did Gwen read than Anna? ______ fewer books
4. How many books did the four children read in all? ______ books

© H
ou
gh
ton
Mif
flin
Ha
rco
urt
Pu
blis
hin
g C
om
pa
ny
P226 two hundred twenty-six
1. Use the picture graph. Who has
the most fish?
Jane
Will
Gina
Evan
Spiral Review (MACC.2.MD.1.1, MACC.2.MD.3.7, MACC.2.MD.3.8)
2. What is the time on this clock?
(Lesson 7.9)
1:55 3:05
2:55 11:15
3. Each unit cube is about
1 centimeter long. Which is
the best estimate for the
length of the paper clip? (Lesson 9.1)
1 centimeter
3 centimeters
4 centimeters
8 centimeters
4. What is the total value of this group of coins? (Lesson 7.2)
61¢ 60¢ 56¢ 52¢
Lesson Check (MACC.2.MD.4.10)

© H
ou
gh
ton
Mif
flin
Ha
rco
urt
Pu
blis
hin
g C
om
pa
ny
Name
Chapter 10 two hundred twenty-seven P227
Lesson 10.3COMMON CORE STANDARD MACC.2.MD.4.10
Represent and interpret data.
1. Use the tally chart to complete the picture graph.
Draw a for each child.
2. How many children chose chocolate? ____ children
3. How many fewer children chose oatmeal than
peanut butter? ____ fewer children
4. Which cookie did the most children choose?
__________
5. How many children in all chose a favorite cookie? ____ children
6. How many children chose oatmeal or shortbread? ____ children
Make Picture Graphs

© H
ou
gh
ton
Mif
flin
Ha
rco
urt
Pu
blis
hin
g C
om
pa
ny
P228 two hundred twenty-eight
Lesson Check (MACC.2.MD.4.10)
1. Use the picture graph.
How many more rainy
days were there in April
than in May?
2
4
6
12
2. Rita has one $1bill, 2 quarters,
and 3 dimes. What is the total
value of Rita’s money? (Lesson 7.7)
$1.23 $1.42
$1.35 $1.80
3. Lucas put 4 quarters and
3 nickels into his coin bank.
How much money did Lucas
put into his coin bank? (Lesson 7.6)
$1.15 $1.30
$1.25 $1.75
4. Use a centimeter ruler. Which
is the best choice for the
length of this string? (Lesson 9.3)
2 centimeters
4 centimeters
6 centimeters
10 centimeters
5. What is the total value of this
group of coins? (Lesson 7.1)
8¢
17¢
21¢
26¢
Spiral Review (MACC.2.MD.1.1, MACC.2.MD.3.8)
© H
ou
gh
ton
Mif
flin
Ha
rco
urt
Pu
blis
hin
g C
om
pa
ny
Name
Chapter 10 two hundred twenty-nine P229
Lesson 10.4
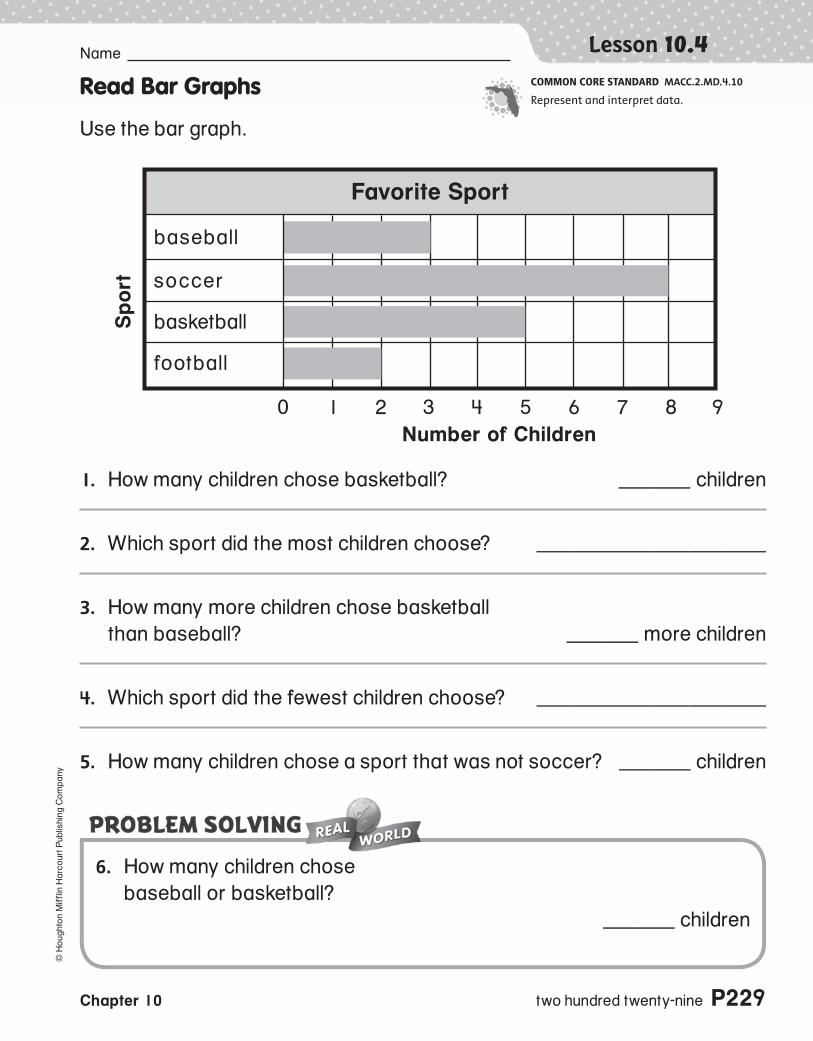
6. How many children chose
baseball or basketball?
__ children
COMMON CORE STANDARD MACC.2.MD.4.10
Represent and interpret data.Read Bar Graphs
Use the bar graph.
1. How many children chose basketball? __ children
2. Which sport did the most children choose? ______
3. How many more children chose basketball
than baseball? __ more children
4. Which sport did the fewest children choose? ______
5. How many children chose a sport that was not soccer? __ children

© H
ou
gh
ton
Mif
flin
Ha
rco
urt
Pu
blis
hin
g C
om
pa
ny
P230 two hundred thirty
Lesson Check (MACC.2.MD.4.10)
1. Use the bar graph. How many
shells do the children have in all?
10
12
14
16
Spiral Review (MACC.2.MD.1.1, MACC.2.MD.3.8, MACC.2.MD.4.9)
2. Use the line plot. How many
twigs are 3 inches long? (Lesson 8.9)
8
5
4
3
3. Use a centimeter ruler. Which
is the best choice for the
length of the yarn? (Lesson 9.3)
7 centimeters
4 centimeters
2 centimeters
1 centimeter
4. Noah buys a pencil. He uses
1 quarter and 2 nickels to pay.
How much money does the
pencil cost? (Lesson 7.4)
45¢
35¢
30¢
27¢

© H
ou
gh
ton
Mif
flin
Ha
rco
urt
Pu
blis
hin
g C
om
pa
ny
Name
Chapter 10 two hundred thirty-one P231
Lesson 10.5
4. Which friends practice soccer for
fewer than 4 hours each week?
COMMON CORE STANDARD MACC.2.MD.4.10
Represent and interpret data.Make Bar Graphs
Maria asked her friends how many hours they practice soccer each week.
Jessie practices for 3 hours. Samantha practices for 5 hours.
Victor practices for 2 hours. David practices for 6 hours.
1. Write a title and labels for the bar graph.
2. Draw bars in the graph to show the data.
3. Which friend practices soccer for the most
hours each week?

© H
ou
gh
ton
Mif
flin
Ha
rco
urt
Pu
blis
hin
g C
om
pa
ny
P232 two hundred thirty-two
Spiral Review (MACC.2.MD.1.1, MACC.2.MD.2.5, MACC.2.MD.2.6, MACC.2.MD.3.7, MACC.2.MD.3.8)
2. Rachel’s chain is 22 centimeters
long. She takes 9 centimeters off
the chain. How long is Rachel’s
chain now? (Lesson 9.4)
31 centimeters
29 centimeters
17 centimeters
13 centimeters
3. Use an inch ruler. What is
the length of the string to
the nearest inch? (Lesson 8.4)
1 inch 4 inches
2 inches 6 inches
4. Gail finished studying at
quarter past 1. What time did
Gail finish studying? (Lesson 7.10)
1:15
3:50
4:30
5:45
5. Jill has two $1 bills, 1 quarter,
and 1 nickel. How much money
does Jill have? (Lesson 7.7)
$2.35
$2.30
$2.05
$1.30
1. Use the bar graph.
How many more
children chose
summer than spring?
2
3
5
8
Lesson Check (MACC.2.MD.4.10)

© H
ou
gh
ton
Mif
flin
Ha
rco
urt
Pu
blis
hin
g C
om
pa
ny
NameLesson 10.6
Chapter 10 two hundred thirty-three P233
PROBLEM SOLVING
3. How many fewer books did Abby read
in April than in February? __ fewer books
4. In which months did Abby read fewer
than 7 books? __________
Make a bar graph to solve the problem.
1. The list shows the number of books that
Abby read each month. Describe how
the number of books she read changed
from February to May.
COMMON CORE STANDARD MACC.2.MD.4.10
Represent and interpret data.
February 8 booksMarch 7 booksApril 6 booksMay 4 books
The number of books
2. How many books in all did Abby read
in February and March? __ books

© H
ou
gh
ton
Mif
flin
Ha
rco
urt
Pu
blis
hin
g C
om
pa
ny
P234 two hundred thirty-four
Lesson Check (MACC.2.MD.4.10)
2. The string is about 10 centimeters long. Which is the
best estimate for the length of the feather? (Lesson 9.2)
2 centimeters 10 centimeters
5 centimeters 20 centimeters
3. What is the total value of this
group of coins? (Lesson 7.3)
55¢ 40¢
50¢ 28¢
4. Rick has one $1 bill, 2 dimes,
and 3 pennies. How much
money does Rick have? (Lesson 7.6)
$1.72
$1.53
$1.40
$1.23
1. Use the bar graph. Which of the
following describes how the
number of hours changed from
Week 1 to Week 4?
The number of hours decreased.
The number of hours increased
and then decreased.
The number of hours increased.
The number of hours stayed
the same.
Spiral Review (MACC.2.MD.1.3, MACC.2.MD.3.8)

Name©
Ho
ug
hto
n M
iffl
in H
arc
ou
rt P
ub
lish
ing
Co
mp
an
y
COMMON CORE STANDARD MACC.2.MD.4.10
Chapter 10 two hundred thirty-five P235
Chapter 10 Extra Practice
Lesson 10.2 (pp. 473–476)
Use the picture graph.
Lesson 10.3 (pp. 477–479)
1. Use the tally chart to complete the picture graph.
Draw a for each book.
2. Who read more than 4 books? __________________
1. How many children chose chocolate? ___ children
2. Which flavor did the most children choose? __________________
3. How many children in all chose a favorite flavor? ___ children

© H
ou
gh
ton
Mif
flin
Ha
rco
urt
Pu
blis
hin
g C
om
pa
ny
P236 two hundred thirty-six
Lesson 10.4 (pp. 481–484)
Use the bar graph.
Lesson 10.5 (pp. 485–488)
Robin has 5 red beads, 7 blue beads, 8 yellow beads, and 5 green beads.
1. Write a title and labels.
Draw bars to show the data.
1. Which kind of book did the
fewest children choose? _________________
2. How many children in all chose
a favorite kind of book? ______ children
Recommended