Cost Benefit Analysis (CBA) and portfolio development for adaptation options
Dr. Tran Dai NghiaIPSARD
1. Costs of climate change
2. Cost-benefit analysis
3. Valuing the Environment bebefits and costs
4. Problems of measurement of environmental
costs/benefits
5. CBA for Evaluating Proposed CAMs
6. Some example
Contents
3
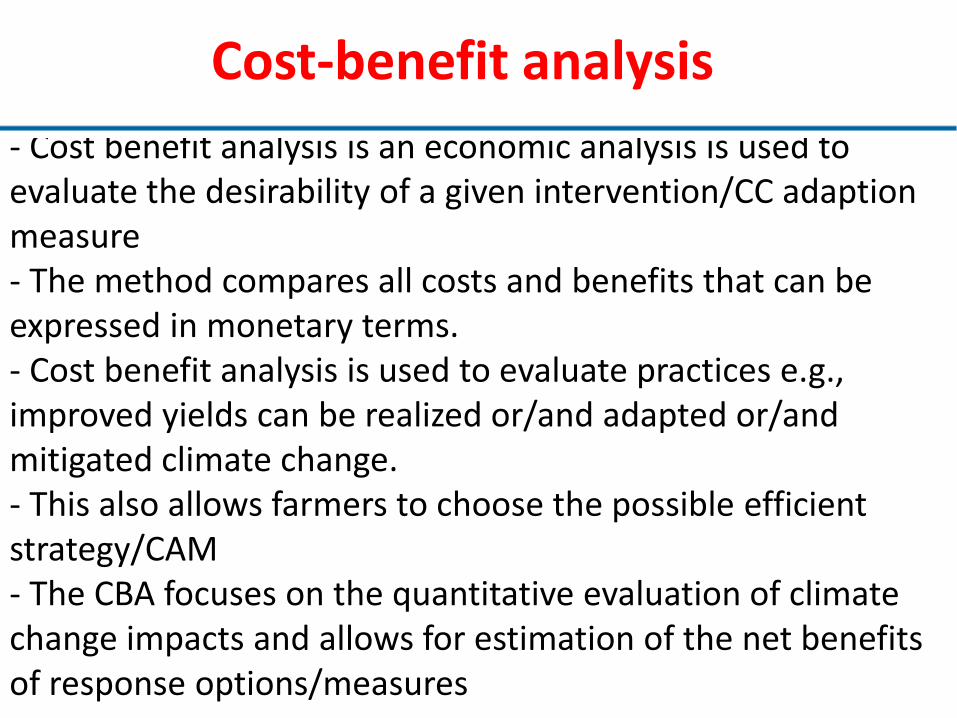
- Cost benefit analysis is an economic analysis is used to evaluate the desirability of a given intervention/CC adaption measure- The method compares all costs and benefits that can be expressed in monetary terms.- Cost benefit analysis is used to evaluate practices e.g.,improved yields can be realized or/and adapted or/and mitigated climate change. - This also allows farmers to choose the possible efficient strategy/CAM- The CBA focuses on the quantitative evaluation of climate change impacts and allows for estimation of the net benefits of response options/measures
Cost-benefit analysis
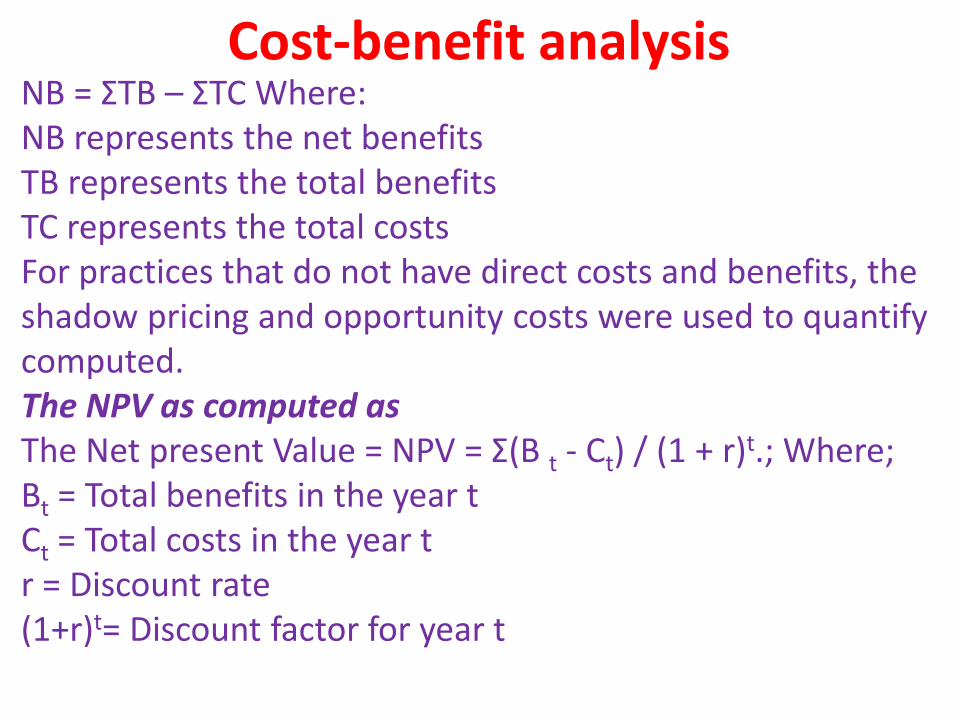
NB = ƩTB – ƩTC Where:NB represents the net benefits TB represents the total benefits TC represents the total costs For practices that do not have direct costs and benefits, the shadow pricing and opportunity costs were used to quantify computed.The NPV as computed asThe Net present Value = NPV = Ʃ(B t - Ct) / (1 + r)t.; Where;Bt = Total benefits in the year tCt = Total costs in the year tr = Discount rate(1+r)t= Discount factor for year t
Cost-benefit analysis
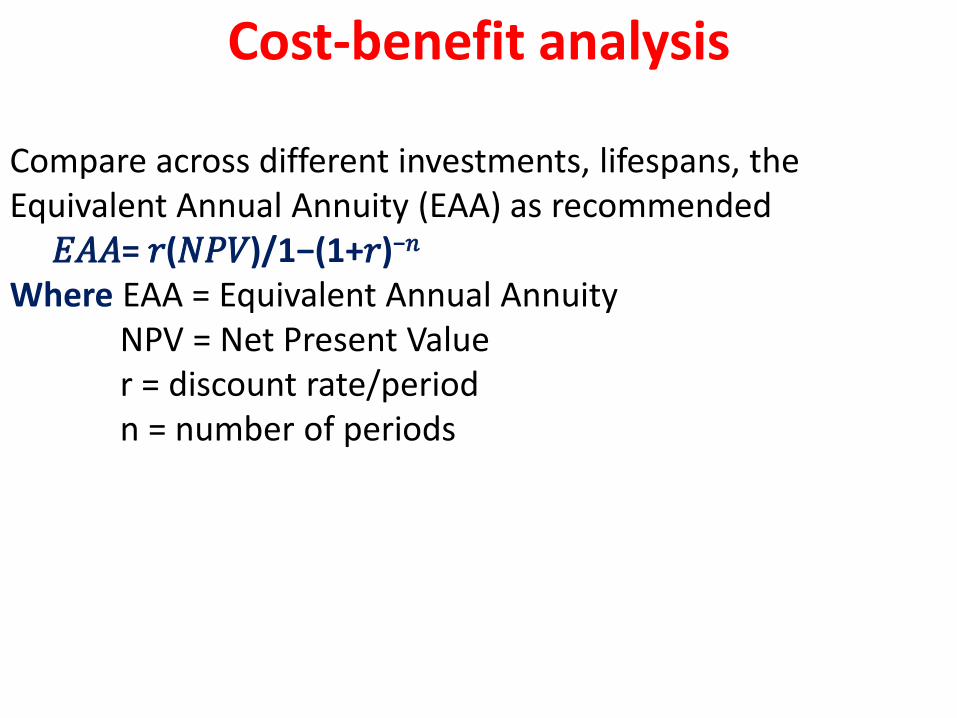
Compare across different investments, lifespans, the Equivalent Annual Annuity (EAA) as recommended𝐸𝐴𝐴= 𝑟(𝑁𝑃𝑉)/1−(1+𝑟)−𝑛
Where EAA = Equivalent Annual AnnuityNPV = Net Present Valuer = discount rate/periodn = number of periods
Cost-benefit analysis
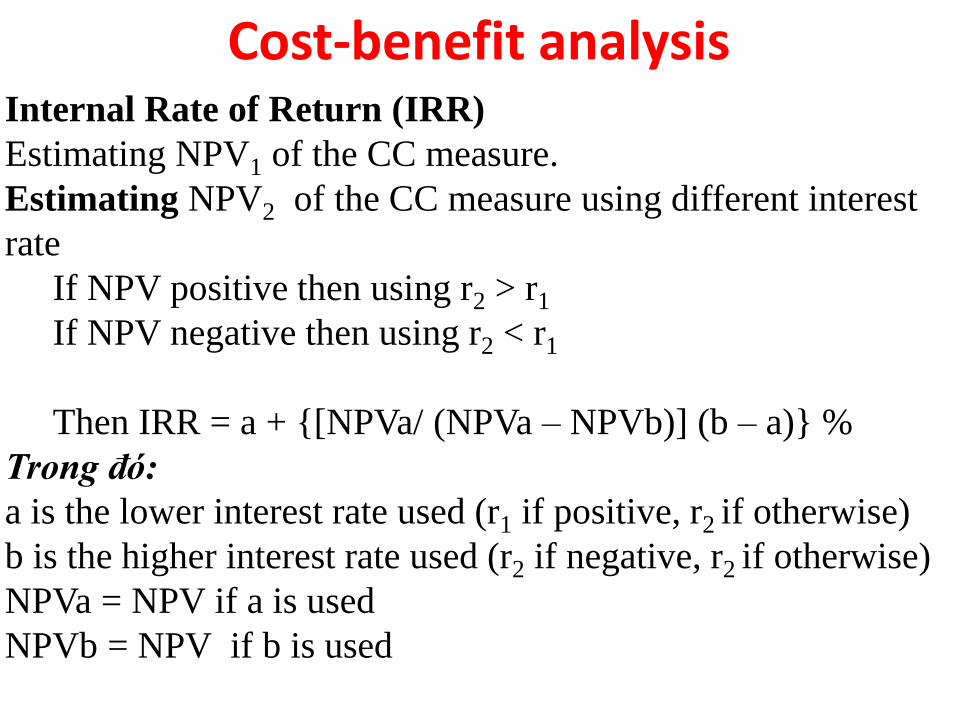
Internal Rate of Return (IRR)
Estimating NPV1 of the CC measure.
Estimating NPV2 of the CC measure using different interest
rate
If NPV positive then using r2 > r1
If NPV negative then using r2 < r1
Then IRR = a + {[NPVa/ (NPVa – NPVb)] (b – a)} %
Trong đó:
a is the lower interest rate used (r1 if positive, r2 if otherwise)
b is the higher interest rate used (r2 if negative, r2 if otherwise)
NPVa = NPV if a is used
NPVb = NPV if b is used
Cost-benefit analysis
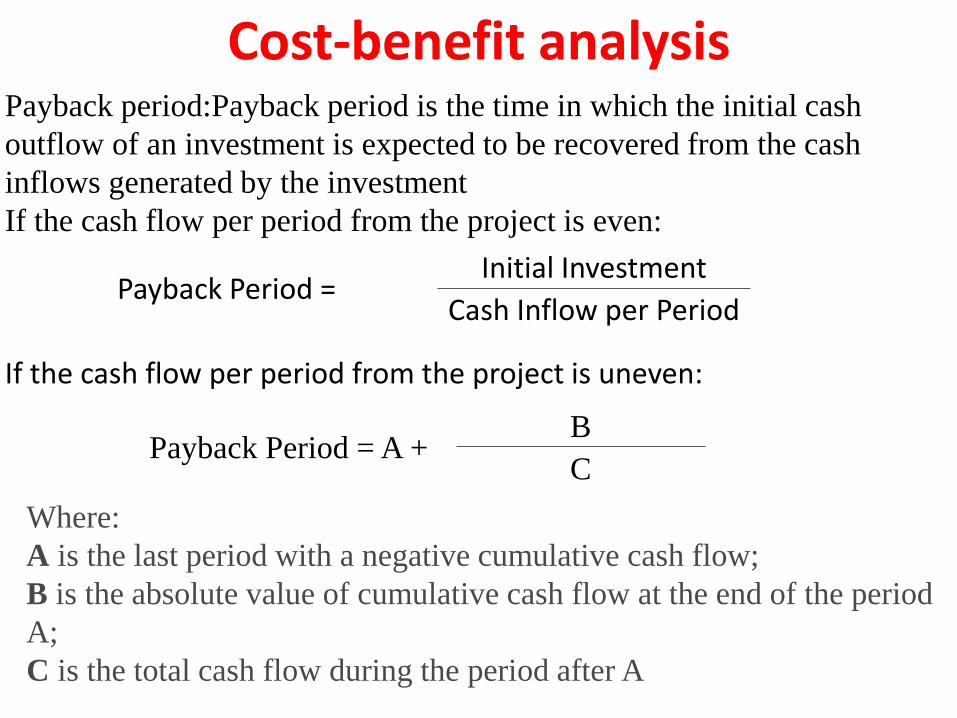
Payback period:Payback period is the time in which the initial cash
outflow of an investment is expected to be recovered from the cash
inflows generated by the investment
If the cash flow per period from the project is even:
If the cash flow per period from the project is uneven:
Cost-benefit analysis
Payback Period =Initial Investment
Cash Inflow per Period
Payback Period = A +B
C
Where:
A is the last period with a negative cumulative cash flow;
B is the absolute value of cumulative cash flow at the end of the period
A;
C is the total cash flow during the period after A
9
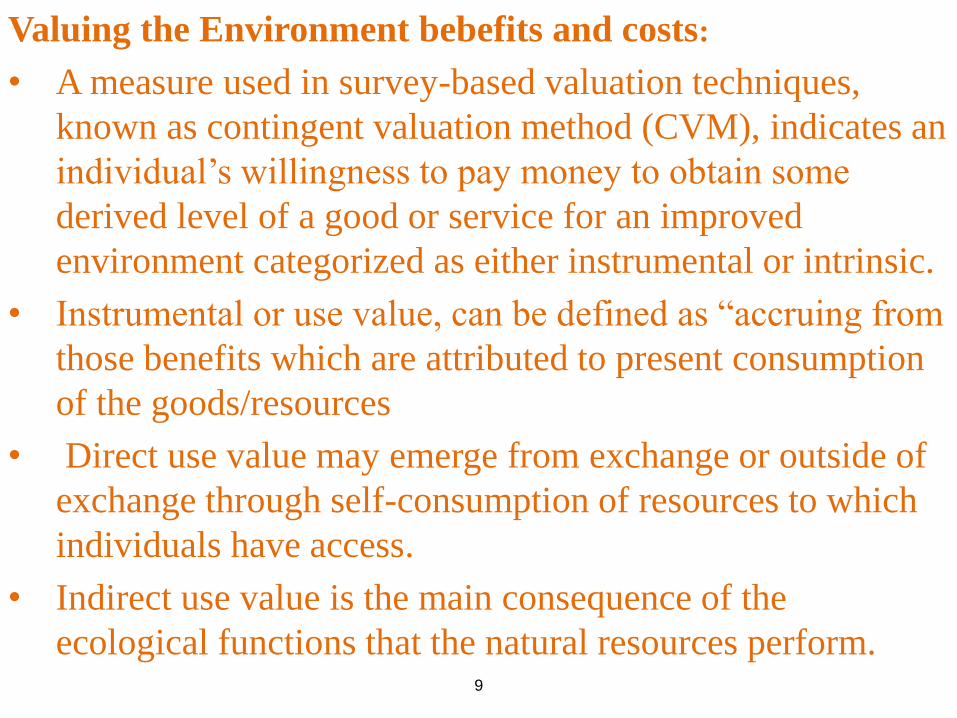
Valuing the Environment bebefits and costs:
• A measure used in survey-based valuation techniques,
known as contingent valuation method (CVM), indicates an
individual’s willingness to pay money to obtain some
derived level of a good or service for an improved
environment categorized as either instrumental or intrinsic.
• Instrumental or use value, can be defined as “accruing from
those benefits which are attributed to present consumption
of the goods/resources
• Direct use value may emerge from exchange or outside of
exchange through self-consumption of resources to which
individuals have access.
• Indirect use value is the main consequence of the
ecological functions that the natural resources perform.
10
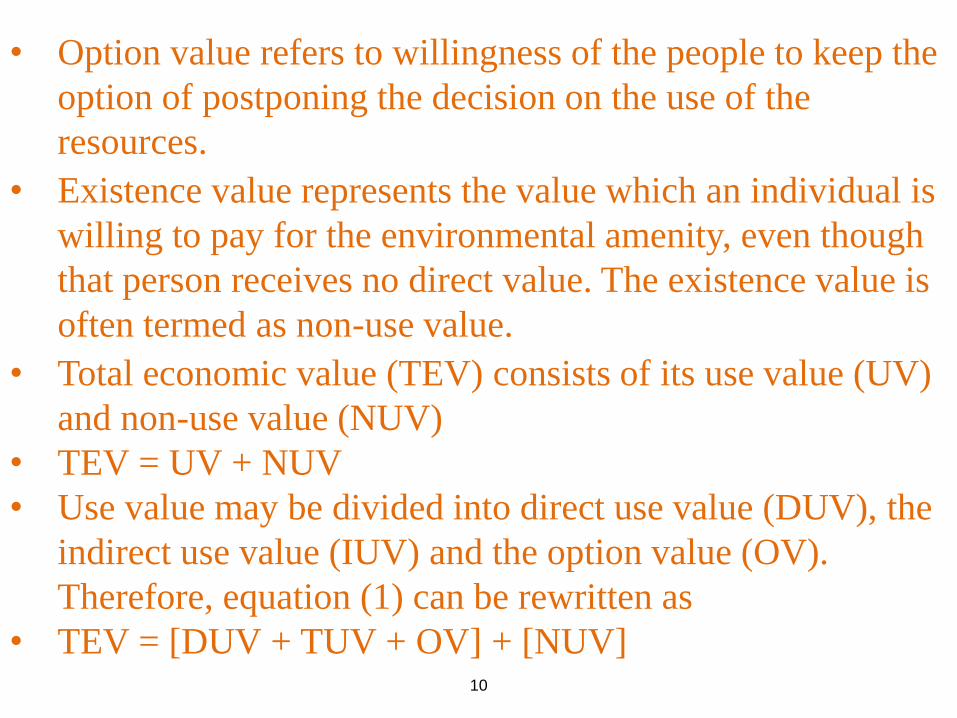
• Option value refers to willingness of the people to keep the
option of postponing the decision on the use of the
resources.
• Existence value represents the value which an individual is
willing to pay for the environmental amenity, even though
that person receives no direct value. The existence value is
often termed as non-use value.
• Total economic value (TEV) consists of its use value (UV)
and non-use value (NUV)
• TEV = UV + NUV
• Use value may be divided into direct use value (DUV), the
indirect use value (IUV) and the option value (OV).
Therefore, equation (1) can be rewritten as
• TEV = [DUV + TUV + OV] + [NUV]
11
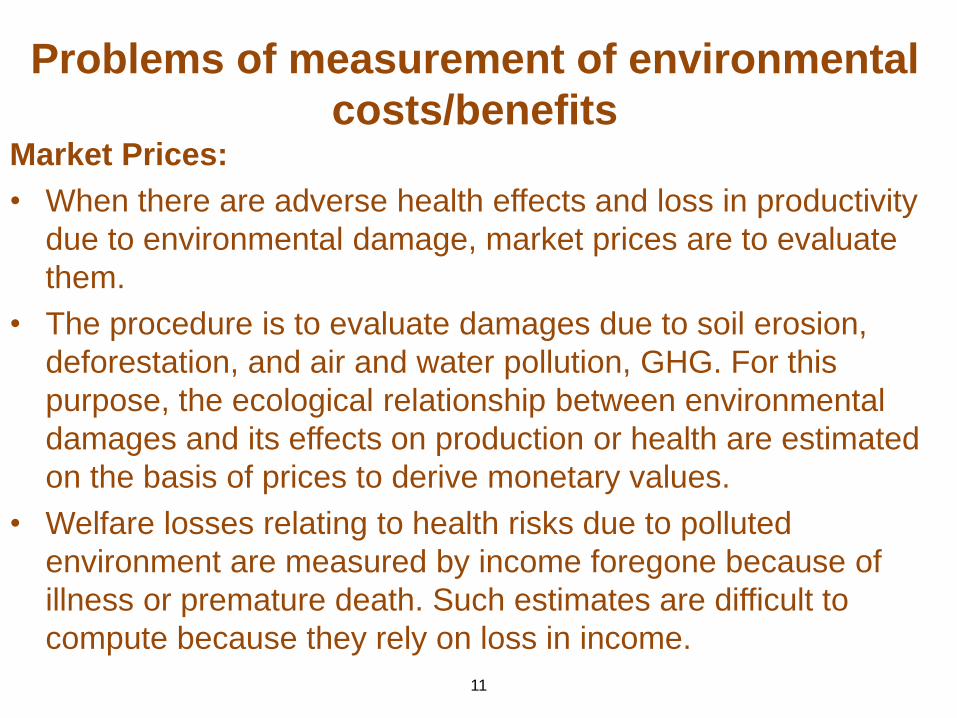
Problems of measurement of environmental
costs/benefitsMarket Prices:
• When there are adverse health effects and loss in productivity
due to environmental damage, market prices are to evaluate
them.
• The procedure is to evaluate damages due to soil erosion,
deforestation, and air and water pollution, GHG. For this
purpose, the ecological relationship between environmental
damages and its effects on production or health are estimated
on the basis of prices to derive monetary values.
• Welfare losses relating to health risks due to polluted
environment are measured by income foregone because of
illness or premature death. Such estimates are difficult to
compute because they rely on loss in income.
12
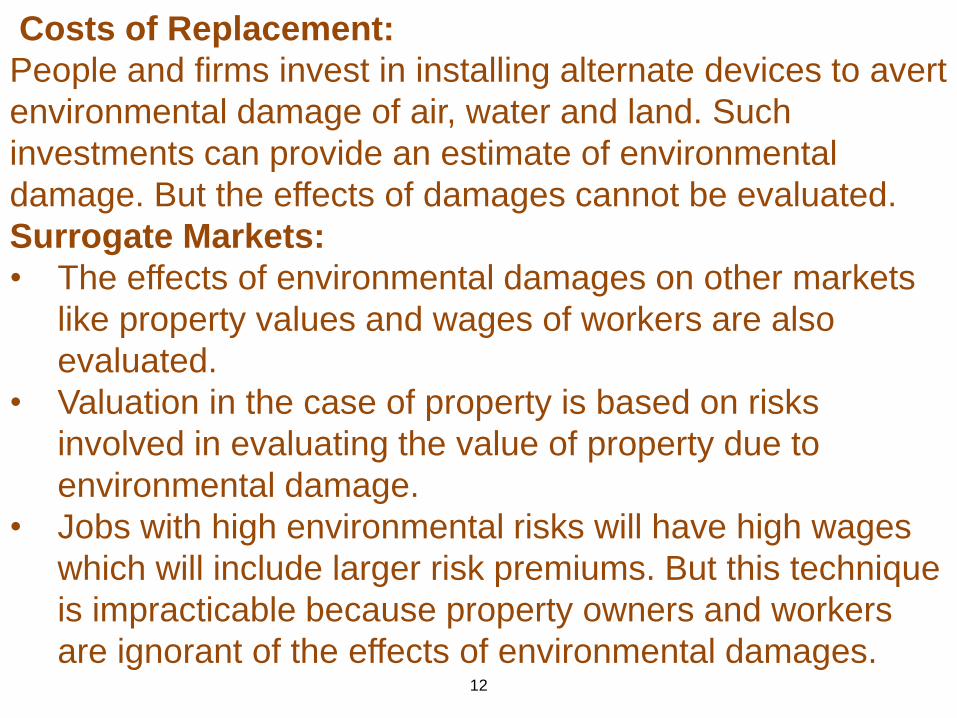
Costs of Replacement:
People and firms invest in installing alternate devices to avert
environmental damage of air, water and land. Such
investments can provide an estimate of environmental
damage. But the effects of damages cannot be evaluated.
Surrogate Markets:
• The effects of environmental damages on other markets
like property values and wages of workers are also
evaluated.
• Valuation in the case of property is based on risks
involved in evaluating the value of property due to
environmental damage.
• Jobs with high environmental risks will have high wages
which will include larger risk premiums. But this technique
is impracticable because property owners and workers
are ignorant of the effects of environmental damages.
13
Social Discount Rate
Environmental degradation leads to costs and environmental
improvements confer benefits on CAMs.
• The problem of measuring environmental damage is to
evaluate it and compare it with the cost of preventing it.
• The main problem is how to measure costs and benefits of
environmental effects on the present and future
generations. For this, a rate of discount is needed for
discounting all costs and benefits, but there is lot of
confusion.
14
• Discount rates are high, the level of investment falls which discourages development projects and slows down the pace of development, shifts the burden of high costs to future generations.
• The main problem is how to choose a social discount rate. This cannot be the market rate of interest because of uncertainties and imperfections of capital markets.
• Majority of economists measure the social rate of discount at government’s borrowing rates on long-term securities because they are riskless. But there are numerous borrowing rates on government securities relating to different time periods. The problem is which rate to choose as the social discount rate.
• Many economists favour social rate of time preference and opportunity cost of capital in measuring the cost and benefit of environmental degradation.
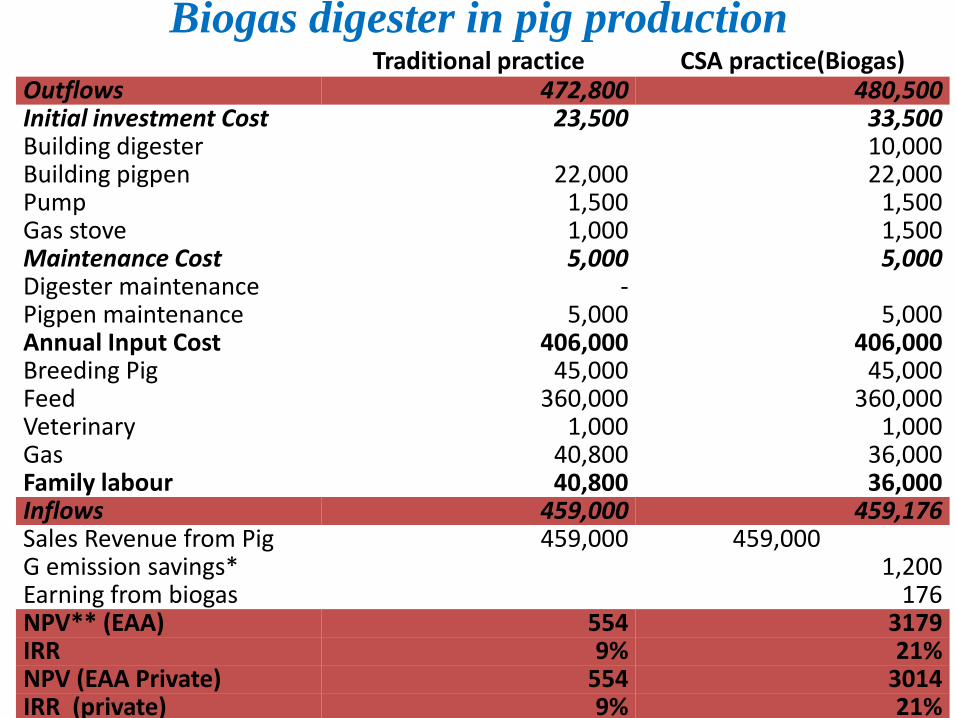
Biogas digester in pig production Traditional practice CSA practice(Biogas)
Outflows 472,800 480,500 Initial investment Cost 23,500 33,500 Building digester 10,000 Building pigpen 22,000 22,000 Pump 1,500 1,500 Gas stove 1,000 1,500 Maintenance Cost 5,000 5,000 Digester maintenance -Pigpen maintenance 5,000 5,000 Annual Input Cost 406,000 406,000 Breeding Pig 45,000 45,000 Feed 360,000 360,000 Veterinary 1,000 1,000 Gas 40,800 36,000 Family labour 40,800 36,000 Inflows 459,000 459,176 Sales Revenue from Pig 459,000 459,000 G emission savings* 1,200 Earning from biogas 176NPV** (EAA) 554 3179IRR 9% 21%NPV (EAA Private) 554 3014IRR (private) 9% 21%
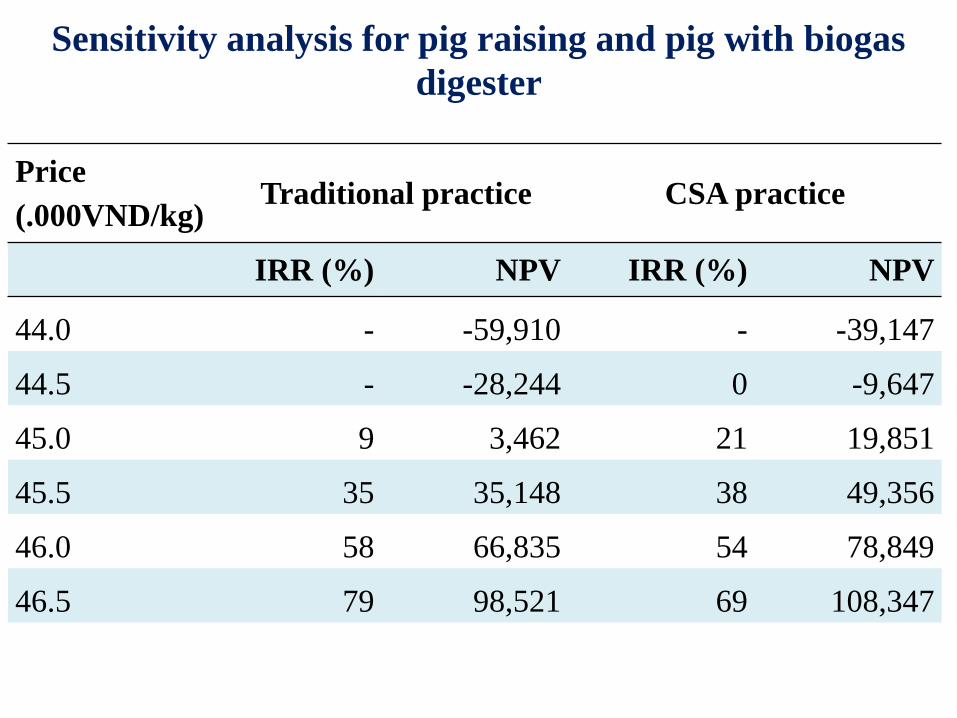
Sensitivity analysis for pig raising and pig with biogas
digester
Price
(.000VND/kg)Traditional practice CSA practice
IRR (%) NPV IRR (%) NPV
44.0 - -59,910 - -39,147
44.5 - -28,244 0 -9,647
45.0 9 3,462 21 19,851
45.5 35 35,148 38 49,356
46.0 58 66,835 54 78,849
46.5 79 98,521 69 108,347
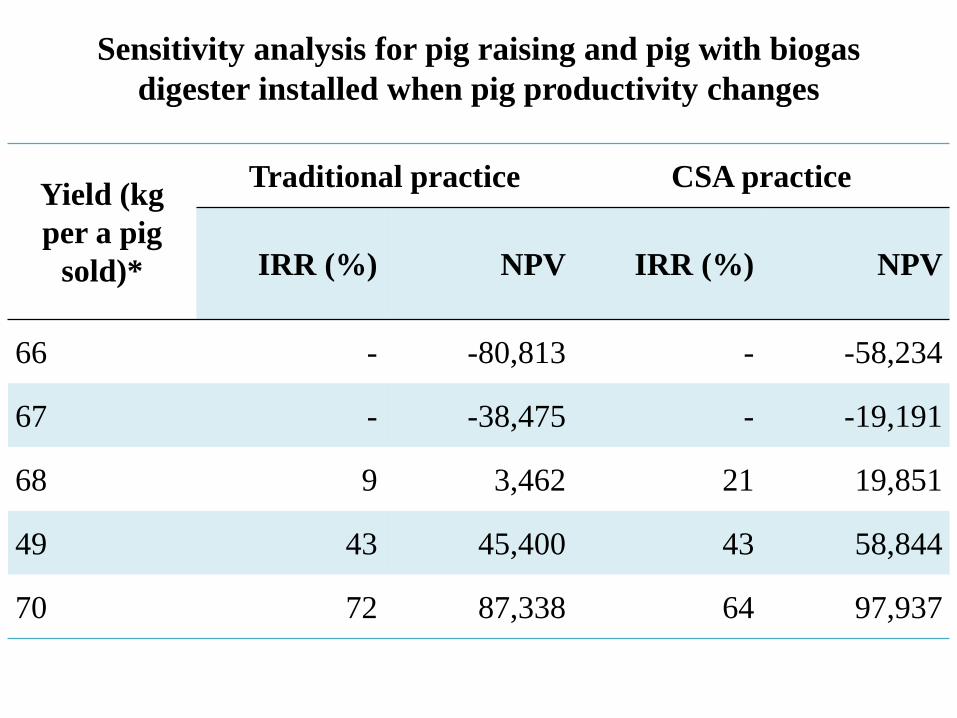
Sensitivity analysis for pig raising and pig with biogas
digester installed when pig productivity changes
Yield (kg
per a pig
sold)*
Traditional practice CSA practice
IRR (%) NPV IRR (%) NPV
66 - -80,813 - -58,234
67 - -38,475 - -19,191
68 9 3,462 21 19,851
49 43 45,400 43 58,844
70 72 87,338 64 97,937

2 rice seasons and rice- shrimp
Traditional practice (rice-rice) CSA practice (rice-shrimp)
Outflows 66876 104641
Rice 66876 39113
Variety 2156 1078
Tillage 6160 3080
Fertilizer 12560 6280
Pesticides 3080 1540
Irrigation 3850 1925
Harvesting 3080 1540
Land rent 11,350 11,350
Family labor 24640 12320
Shrimp
65528
Field digging
3000
Field cleaning
1000
Lime
3850
Variety
1078
Feed
30000
Veterinary
1500
Harvesting
23100
Family labor
2000
Inflows 66200 192764.5
Sales revenue from Rice* 64200 21000
Sales revenue from Straw 2000 1000
Sales revenue from shrimp* 170,000
HG emission savings 765
NPV** -2334 84021
IRR 0% 22%
NPV(family labors excluded) 20818 94359
IRR (family labors excluded) 9.3% 24.1%
NPV(no labor private) 20818 93652
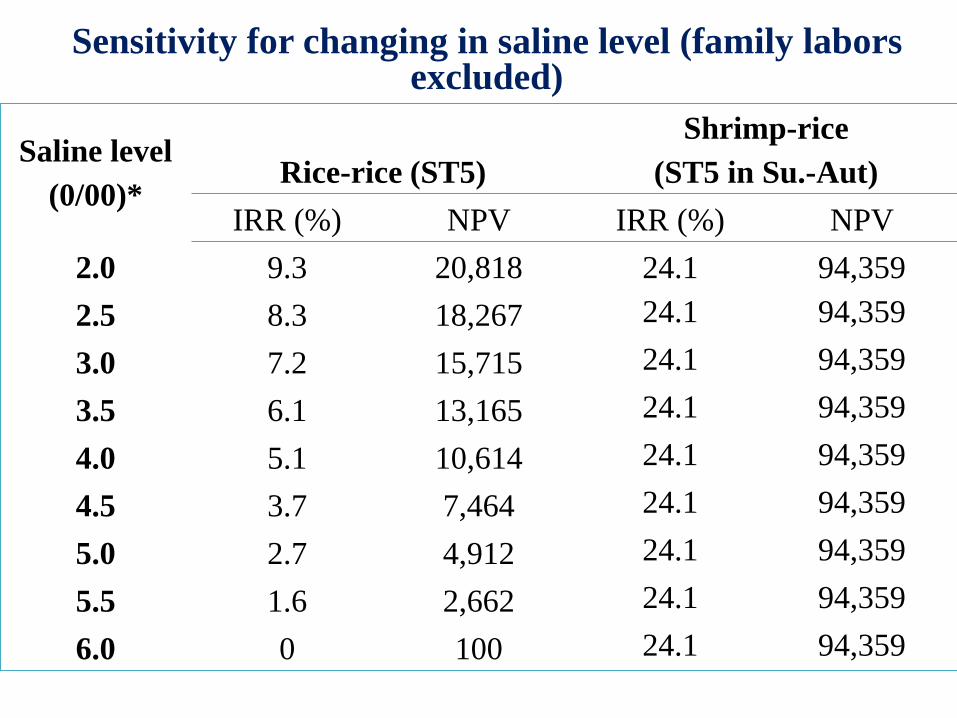
Sensitivity for changing in saline level (family labors excluded)
Saline level
(0/00)*Rice-rice (ST5)
Shrimp-rice
(ST5 in Su.-Aut)
IRR (%) NPV IRR (%) NPV
2.0 9.3 20,818 24.1 94,359
2.5 8.3 18,267 24.1 94,359
3.0 7.2 15,715 24.1 94,359
3.5 6.1 13,165 24.1 94,359
4.0 5.1 10,614 24.1 94,359
4.5 3.7 7,464 24.1 94,359
5.0 2.7 4,912 24.1 94,359
5.5 1.6 2,662 24.1 94,359
6.0 0 100 24.1 94,359
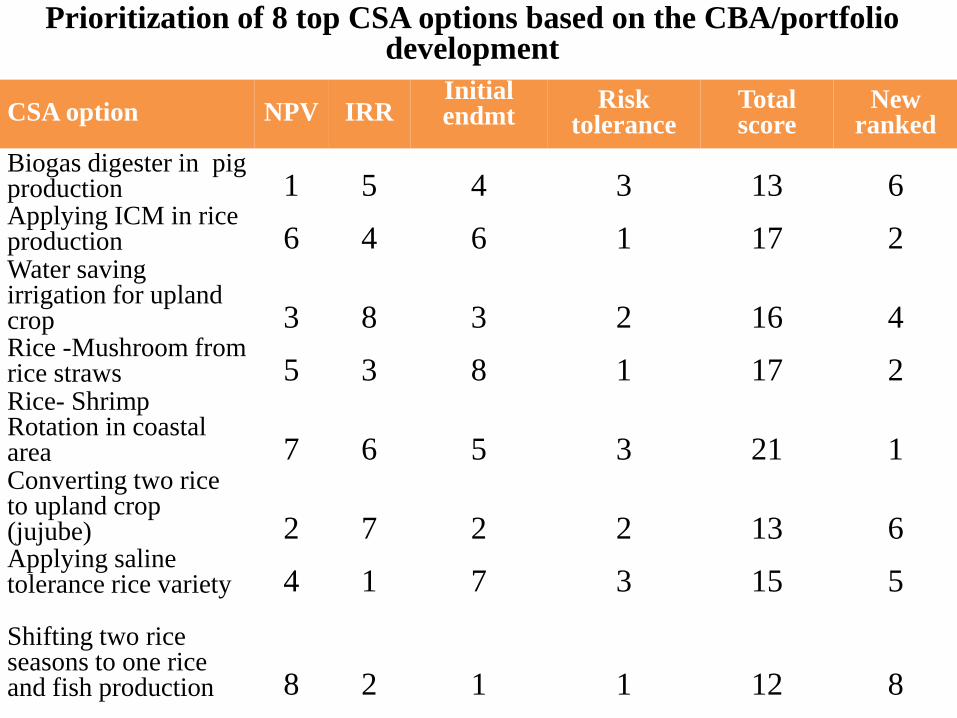
CSA option NPV IRRInitial endmt
Risk tolerance
Total score
New ranked
Biogas digester in pig production 1 5 4 3 13 6Applying ICM in rice production 6 4 6 1 17 2Water saving irrigation for upland crop 3 8 3 2 16 4Rice -Mushroom from rice straws 5 3 8 1 17 2Rice- Shrimp Rotation in coastal area 7 6 5 3 21 1Converting two rice to upland crop (jujube) 2 7 2 2 13 6Applying saline tolerance rice variety 4 1 7 3 15 5
Shifting two rice seasons to one rice and fish production 8 2 1 1 12 8
Prioritization of 8 top CSA options based on the CBA/portfolio development
21
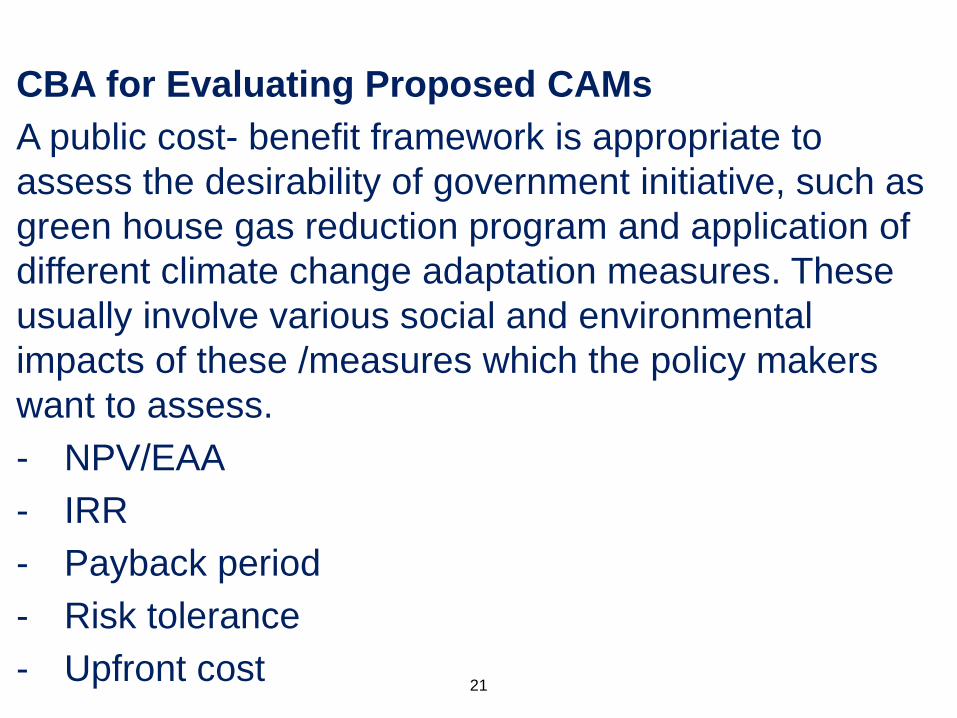
CBA for Evaluating Proposed CAMs
A public cost- benefit framework is appropriate to
assess the desirability of government initiative, such as
green house gas reduction program and application of
different climate change adaptation measures. These
usually involve various social and environmental
impacts of these /measures which the policy makers
want to assess.
- NPV/EAA
- IRR
- Payback period
- Risk tolerance
- Upfront cost
22

THANK YOU!
Recommended