Naresh NSpatial Modelling GroupRMS India Pvt. Ltd., Noida
February 8, 2012
Damage loss estimation of the 2011 Japan tsunami: A case study
Co-authors : Priya Logakrishnan, Avnish Varshney, Sreyasi Maiti, Edida Rajesh
© 2012 Risk Management Solutions, Inc.
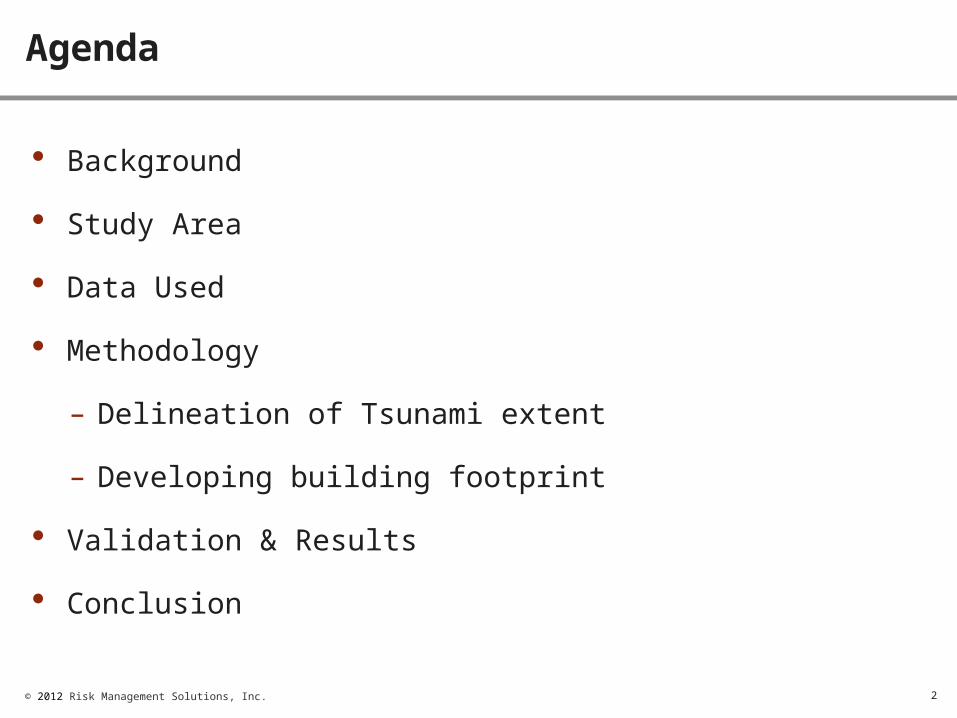
Agenda
2
Background
Study Area
Data Used
Methodology
– Delineation of Tsunami extent
– Developing building footprint
Validation & Results
Conclusion
© 2012 Risk Management Solutions, Inc.
Background
3

© 2012 Risk Management Solutions, Inc.
Background
4
Earthquake of 8.9 magnitude struck off the north coast of Tohoku, Japan (Mar’11)
Triggered Tsunami over entire east coast of ~20ft
– Huge losses in terms of human lives, built-up urban areas, agricultural fields, and forested areas
Scope of the study area
– To estimate the first cut losses and affected region which help modellers\scientist for further management
– Delineating the affected region
– High resolution data – building level information

© 2012 Risk Management Solutions, Inc.
Study Area
5

© 2012 Risk Management Solutions, Inc.
Study Area
6
Tohoku, Japan Tsunami
– Coastal stretch of Ishinomaki to Sendai of Miyagi prefecture
– Stretches about 70 Km from north to south of east coast of Japan with tsunami inundated region
Building
© 2012 Risk Management Solutions, Inc.
Data Used
7

© 2012 Risk Management Solutions, Inc.
Data Used
8
Tsunami delineation
– Remote sensing Images - MODIS Image (250m & 500m) Pre event image (dated 23rd Feb 2011)
Post event image (dated 12th Mar 2011)
Developing the building level inventory
– Using various open source data GSI (Geospatial Information Authority of Japan) for major city extent
Open street map (OSM)
Google Earth utilities and Emporis# website are used as references for estimating the quality of the available building footprints
# (http://www.emporis.com/country/japan)

© 2012 Risk Management Solutions, Inc.
MODIS Pre Tsunami image
9

© 2012 Risk Management Solutions, Inc.
MODIS Post Tsunami image
10

© 2012 Risk Management Solutions, Inc.
Methodology
11

© 2012 Risk Management Solutions, Inc.
Methodology
12
Delineating the Tsunami Area
– Change detection algorithm using multi-temporal data Image registration
Radiometric Normalization
– Histogram matching# algorithm is applied to normalize the radiometric affects
– Change Vector Analysis (CVA) method is applied

© 2012 Risk Management Solutions, Inc.
Methodology
13
Change Vector Analysis– Magnitude and direction - change algorithm is used to identify the
impacted region– Two time point images, with two bands only, pixel of time1 image
(pre) and time2 images (post) Magnitude of the change vector
�̶ Where date1 and date2 can be denoted by (a1, b1) and (a2, b2) respectively
Direction of change θ
�̶ 𝛼 is angle of change and ai and bi are the spectral response of pixels in band 1 & 2
Kernel based thresholding algorithm is used after computing the magnitude of the change vector to find change and no-change region
Cleaning and gap filling methods are applied to extract the Tsunami extents using ArcGIS
2 21 2 1 2( ) ( )M a a b b
1 2( )cos
a a
M

© 2012 Risk Management Solutions, Inc.
Methodology
14
Developing Building Footprint in the Impacted Region
– GSI building level data Region - Sendai and Ishinomaki
– OSM data For remaining region
– Building selected
– Noise correction

© 2012 Risk Management Solutions, Inc.
Methodology
15
Large amount of building footprints
– Assigning the building inventory (like number of floors and lines of business – Residential, Commercial & Industrial)
– 5 ×5 kilometre grid

© 2012 Risk Management Solutions, Inc.
Methodology
16
Building data from GSI & OSM Building data over GoogleEarth Road block data
Street View from GoogleEarth for validation
GSI
Defined Process• 0.17 million buildings
• 4 days with 5 resources
RS

© 2012 Risk Management Solutions, Inc.
Methodology
17
Each grid is further divided based on road block level
Commercial & Industrial are assigned to respective building
Tall rise building
Reference
– Google Earth
– Emporis website

© 2012 Risk Management Solutions, Inc.
Building 3D view based on number of floors
18

© 2012 Risk Management Solutions, Inc.
Methodology
19
Combined building footprint after cleaning and inventory assigning
– Area calculated for each footprint using ArcGIS
– Total building area Total Area = Area of building × Number of floors
– Total cost of the building Building Cost = Total area × Cost per square meter
– Total loss Aggregated Loss = ∑ Building Cost

© 2012 Risk Management Solutions, Inc.
Validation & Results
20
© 2012 Risk Management Solutions, Inc.
Validation & Results
21
Tsunami inundated region and building footprints are validated by over laying spatial layers on Google Earth
Building footprints and attribute information are almost matching with the reference images
Removed duplicate building (if any)

© 2012 Risk Management Solutions, Inc.
Validation & Results
22
LoB Bld Count Tot Area (Bld) Exposure Min Exposure Max $ vs Yen on Mar Exposure Min in dollor Exposure Max in dollor
COM 22,078 13,597,568 1,855,654,081,601 2,268,021,655,290 1$ = 82 yen 22,518,352,136 27,522,430,388
IND 5,260 5,307,204. 896,261,629,335 1,095,430,880,299 1$ = 82 yen 10,876,129,972 13,293,047,744
RES 106,160 25,261,863 223,196,736,4170 2,727,960,111,763 1$ = 82 yen 27,084,911,762 33,103,781,043
Using the above equations, aggregate losses were computed
$60 billion to $74 billion (based on min and max coast value)
Figures are representing the structure loss only
$60,479,393,870 $73,919,259,175
Source: http://www.mlit.go.jp/en/index.html

© 2012 Risk Management Solutions, Inc.
Conclusion
23
© 2012 Risk Management Solutions, Inc.
Conclusion
24
Losses computed using MODIS multi-temporal images and digital building footprints
Study helps to compute the first cut losses/damage for disaster management within a short time frame after event
If accurate building footprints are available for a region, one can compute damage/impact cost more accurately.

© 2012 Risk Management Solutions, Inc.
Questions ?
25

© 2012 Risk Management Solutions, Inc. 26
Recommended