transitioning unique NASA data and research technologies to operations
NASA Data and Products
National Space Science and Technology Center, Huntsville, AL
Sixth Meeting of the Science Advisory Committee28 February – 1 March 2012

transitioning unique NASA data and research technologies to operations
Relevance to SPoRTNASA had a strategic plan for SPoRT when begun in 2003• work with NASA data to provide NWS forecasters unique data that was
unavailable from NOAA
SPoRT showed that EOS data had weather applications other than climate• Situational Awareness for short-term forecasts• Forecasters have frequent issues for which we can provide help
Focused on Southern Region WFOs, creating partnerships with personnel providing feedback to us• SPoRT paradigm
With expansion since the 2009 SAC, NASA data are used at most of our 24 WFOs

transitioning unique NASA data and research technologies to operations
Products to End UsersINSTRUMENT / PRODUCT RESOLUTION END USER FORECAST PROBLEM
Combined Instrument products Multi-sensor SST composite 2 km (NA coastal regions) WFOs Short-term forecasts
Blended TPW (from CIRA)* 16 km (NH) WFOs Atmos. Rivers, precip.GOES NESDIS Aviation products* 4 km (CONUS) WFOs Situational awarenessGOES-R pGLM product suite 10 km / 2 minutes HWT Severe weather, lightning
GOES-MODIS hybrid 500 m, 1 km WFOs Situational awareness
GOES-MODIS RGB hybrid 500 m, 1 km WFOs Situational awareness
Proxy QPE (NESDIS) 4 km WFOs Precipitation RGB products – SEVIRI, MODIS,
GOES Sounder 1 – 10 km Nat. Ctrs. Situational awareness
UAH Convective Initiation 1 km WFOs / NC Convection, rainPassive MicrowaveTRMM 37 (V/H), 85 (V/H), comp. 12.5 – 25 km NC, WFOs Precip., atmos. dynamics
SSMI(S) 37 (V/H), 85 (V/H), 91V 12.5 – 25 km NC, WFOs Precip., atmos. dynamics
SSMI(S) RGBs – 37/85, 37PCT 12.5 – 25 km NC, WFOs Precip., atmos. dynamics
* NESDIS version of products now available in AWIPS via SBN. Red text indicates a future near-term product
new
newnew
new
NASAOTHER

transitioning unique NASA data and research technologies to operations
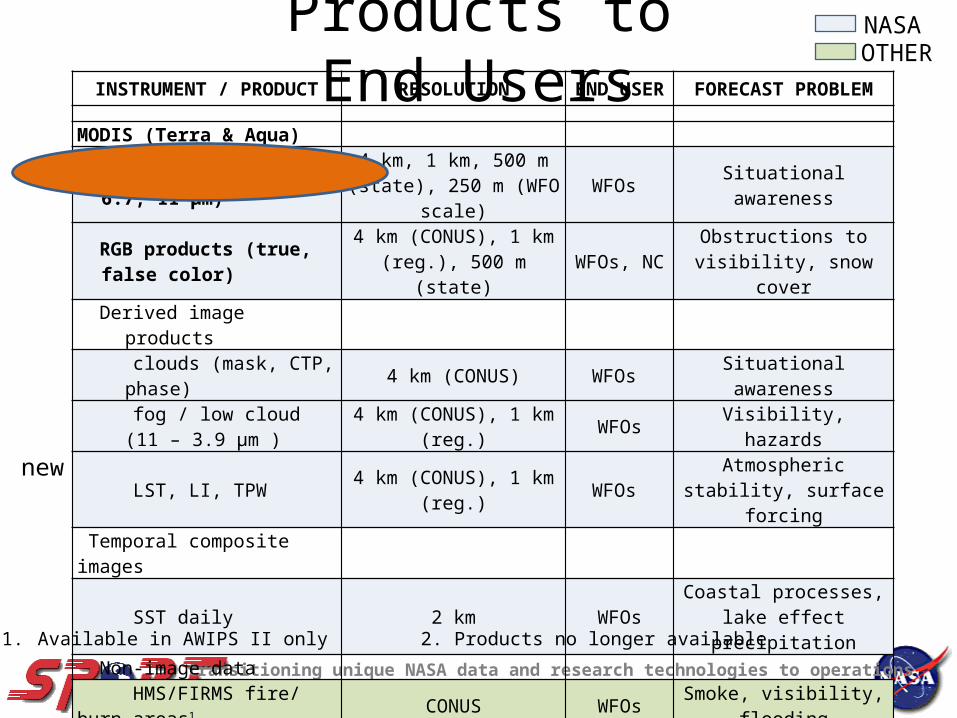
Products to End UsersINSTRUMENT / PRODUCT RESOLUTION END USER FORECAST PROBLEM
MODIS (Terra & Aqua)
Imagery (vis, 3.9, 6.7, 11 µm) 4 km, 1 km, 500 m (state), 250 m (WFO scale) WFOs Situational awareness
RGB products (true, false color) 4 km (CONUS), 1 km (reg.), 500 m (state) WFOs, NC Obstructions to visibility,
snow cover Derived image products clouds (mask, CTP, phase) 4 km (CONUS) WFOs Situational awareness
fog / low cloud (11 – 3.9 µm ) 4 km (CONUS), 1 km (reg.) WFOs Visibility, hazards
LST, LI, TPW 4 km (CONUS), 1 km (reg.) WFOs Atmospheric stability, surface forcing
Temporal composite images
SST daily 2 km WFOs Coastal processes, lake effect precipitation
Non-image data HMS/FIRMS fire/ burn areas1 CONUS WFOs Smoke, visibility, floodingAMSR-E2 (Aqua) Rain rate, cloud water 5 km (CONUS); 21 km WFOs Coastal weather, data voids
SSTs 38 km (CONUS) WFOs Coastal weatherTotal lightning data LMAs (4) – total lightning 2 km(2 min) / 1 km(1 min) WFOs Severe weather, safety
1. Available in AWIPS II only 2. Products no longer available
new
NASAOTHER

transitioning unique NASA data and research technologies to operations
Sea Surface Temperatures• 2 km resolution, weighted by source and age• 2x/day (AM/PM) to capture diurnal variation• Alaska Subset
• Ice Desk• GeoTIFF
• Great Lakes subset• Eastern Region• Ice mask from Great Lakes Env. Research Lab
transitioning unique NASA data and research technologies to operations
Products to End UsersINSTRUMENT / PRODUCT RESOLUTION END USER FORECAST PROBLEM
MODIS (Terra & Aqua)
Imagery (vis, 3.9, 6.7, 11 µm) 4 km, 1 km, 500 m (state), 250 m (WFO scale) WFOs Situational awareness
RGB products (true, false color) 4 km (CONUS), 1 km (reg.), 500 m (state) WFOs, NC Obstructions to visibility,
snow cover Derived image products clouds (mask, CTP, phase) 4 km (CONUS) WFOs Situational awareness
fog / low cloud (11 – 3.9 µm ) 4 km (CONUS), 1 km (reg.) WFOs Visibility, hazards
LST, LI, TPW 4 km (CONUS), 1 km (reg.) WFOs Atmospheric stability, surface forcing
Temporal composite images
SST daily 2 km WFOs Coastal processes, lake effect precipitation
Non-image data HMS/FIRMS fire/ burn areas1 CONUS WFOs Smoke, visibility, floodingAMSR-E2 (Aqua) Rain rate, cloud water 5 km (CONUS); 21 km WFOs Coastal weather, data voids
SSTs 38 km (CONUS) WFOs Coastal weatherTotal lightning data LMAs (4) – total lightning 2 km(2 min) / 1 km(1 min) WFOs Severe weather, safety
1. Available in AWIPS II only 2. Products no longer available
new
NASAOTHER
transitioning unique NASA data and research technologies to operations
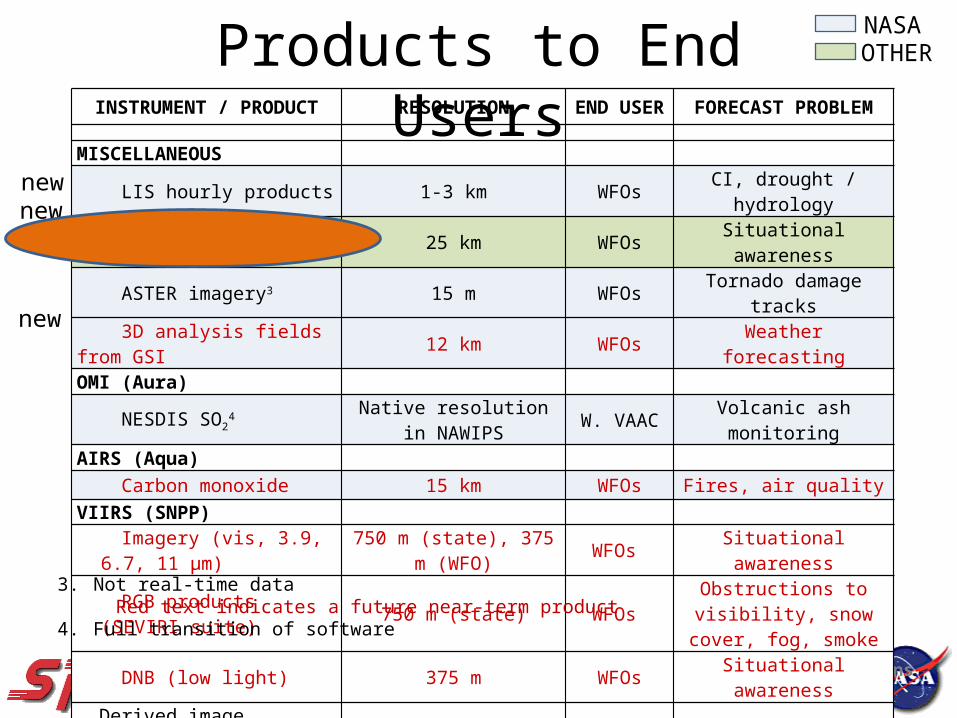
Products to End UsersINSTRUMENT / PRODUCT RESOLUTION END USER FORECAST PROBLEM
MISCELLANEOUS LIS hourly products 1-3 km WFOs CI, drought / hydrology
WindSat OSWV 25 km WFOs Situational awareness
ASTER imagery3 15 m WFOs Tornado damage tracks
3D analysis fields from GSI 12 km WFOs Weather forecastingOMI (Aura) NESDIS SO2
4 Native resolution in NAWIPS W. VAAC Volcanic ash monitoringAIRS (Aqua) Carbon monoxide 15 km WFOs Fires, air qualityVIIRS (SNPP) Imagery (vis, 3.9, 6.7, 11 µm) 750 m (state), 375 m (WFO) WFOs Situational awareness
RGB products (SEVIRI suite) 750 m (state) WFOs Obstructions to visibility, snow cover, fog, smoke
DNB (low light) 375 m WFOs Situational awareness Derived image products EDRs various WFOs Situational awareness
3. Not real-time data Red text indicates a future near-term product
4. Full transition of software
newnew
new
new
NASAOTHER
transitioning unique NASA data and research technologies to operations
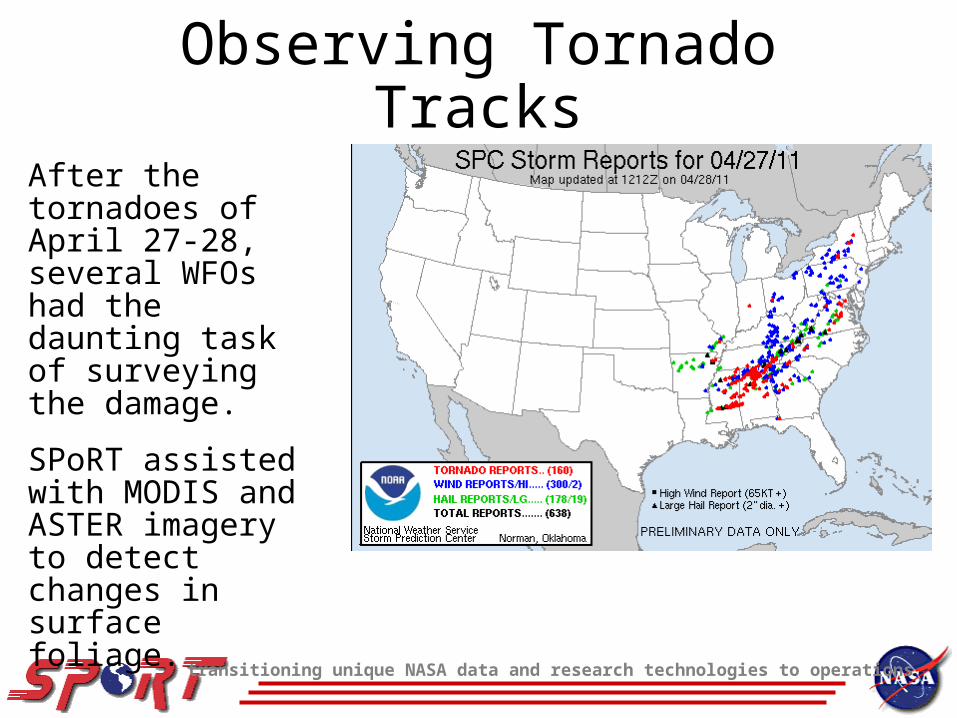
After the tornadoes of April 27-28, several WFOs had the daunting task of surveying the damage.
SPoRT assisted with MODIS and ASTER imagery to detect changes in surface foliage.
Observing Tornado Tracks

transitioning unique NASA data and research technologies to operations
MODIS single channel (green) at 250mMODIS image from April 17 (Aqua) and May 4 (Terra) • geo-locate • rectify to same coordinate
system• take temporal difference
at each point in space
Most tornado tracks become very easy to see.
NWS forecasters used this image to help identify and assess track location for 21 out of 22 tornados that produced EF2 or greater damage.
MODIS Before & After Difference Images

transitioning unique NASA data and research technologies to operations
ASTER imageryAboard TerraVis 15 m resolutionIR 60/90 m resolutionOn-demand instrument
• Pointable• View is requested
SPoRT requested acquisition of several swaths after the April 27th events. BHM and HUN offices used the data to check completeness of assessments.
Jasper EF-3
Tuscaloosa EF-4
Demopolis EF-3
B’ham
Tuscaloosa

transitioning unique NASA data and research technologies to operations
ASTER imagery

transitioning unique NASA data and research technologies to operations
Future WorkContinue transition of current NASA products to AWIPS IIExpand dissemination to AK & Pac Regions
• Hybrids, products, KML
Develop new Hybrid products• VIIRS, RGBs
Continue activities with ASTER, MODIS, and VIIRS for significant tornado eventsIntegrate RGB productsIncrease use of NASA/LANCE and satellite Direct BroadcastProvide CO and O3 (AIRS) to National Centers
Consider new satellite data that addresses forecast issues• SMAP, GPM, SNPP(ATMS, CrIS)

transitioning unique NASA data and research technologies to operations
Questions ?

transitioning unique NASA data and research technologies to operations
Background
• Earth Observing System (EOS) sensors – MODIS (VIIRS)
• Terra/1999 and Aqua/2002• Various products (True color, Fog detection, SST, Tornado tracks, etc.)
– ASTER• Terra/1999• Tornado tracks
– AIRS (CrIS)• Aqua/2002• Regional forecasting model (WRF)
– AMSR-E (AMSR2)• Aqua/2002 – spun down October 2011• [Sea Surface Temperature, Passive Microwave]
Recommended