20
17 NATIONAL PROGRESS REPORT

Last year marked another chapter of growth and change in the story of the Surescripts Network Alliance™. Together, we expanded the strength
and number of our connections and continued to lead the industry in driving changes that improve patient safety, lower costs and ensure quality care. The following data tracks exactly how far we advanced healthcare in 2017.
02 | 2017 NATIONAL PROGRESS REPORT

IN 2017, WE WORKED TOGETHER TO
MAKE MORE CONNECTIONS & EXPAND INTEROPERABILITY
Today, the Surescripts Network Alliance connects virtually all electronic health records (EHR) vendors, pharmacy benefit managers (PBMs), pharmacies and clinicians, plus an increasing number of health plans, long-term and post-acute care organizations and specialty pharmacy organizations.
1.47 MILLIONconnected healthcare professionals 13% increase since 2016
233 MILLIONpatients in our master patient index representing 71% of the U.S. population
NETWORK CONNECTIONS
We convene the Surescripts Network Alliance to provide actionable intelligence that increases patient safety, lowers costs and ensures quality care.
2017 NATIONAL PROGRESS REPORT | 03

NETWORK TRANSACTIONS
20142013 20162015 2017
13.7 BILLION
10.9 BILLION
9.7 BILLION
6.5 BILLION
26% INCREASE
6 BILLION
The Surescripts network delivered 26% more transactions in 2017 compared to 2016. That’s a lot more actionable intelligence transmitted to healthcare professionals nationwide to enhance prescribing and inform care decisions.
TRANSACTION SPOTLIGHT: CANCELRxClinicians and pharmacists are implementing workflow and technology changes to improve prescription accuracy and patient safety, including the ability to cancel a prescription electronically.
3.8 MILLION CancelRx transactions processed in 2017 555,000 prescribers and 31,000 pharmacies using certified software
1.74 BILLIONE-Prescriptions
3.1 MILLIONReal-Time Prescription Benefit transactions
1.46 BILLIONMedication Histories
25.9 MILLIONClinical Direct Messages
04 | 2017 NATIONAL PROGRESS REPORT

CRITICAL PERFORMANCE IMPROVEMENT
Surescripts Sentinel™ monitors the accuracy of the prescriptions sent across the Surescripts network to pinpoint opportunities for quality improvement. In 2017, the Surescripts Network Alliance convened the industry through its Critical Performance Improvement program with a common goal: to increase prescription accuracy.
26% GREATER ACCURACY SINCE 2016PERCENT OF E-PRESCRIPTIONS THAT MET QUALITY STANDARDS
DRUG DESCRIPTION
STRUCTURED & CODIFIED SIG
POTENCY UNIT CODE
REPRESENTATIVE NATIONAL DRUG CODE (NDC)
RXNORM
Thanks to these accuracy increases, as of December 2017 we eliminated 50 million opportunities for error or confusion per month where a pharmacist would have otherwise had to leave their workflow to clarify prescriber intent.
2%1%
95%94%
43%
28%
56%
39%
2016 2017 2016 2017 2016 2017
32%
49%
2016 2017 2016 2017
Clinicians and pharmacists are implementing workflow and technology changes to improve prescription accuracy and patient safety, including the ability to cancel a prescription electronically.
2017 NATIONAL PROGRESS REPORT | 05

E-PRESCRIBING GAINING GROUND ACROSS PRESCRIPTION TYPES
E-Prescribing lets healthcare professionals in all care settings handle prescriptions safely and efficiently, while E-Prescribing for Controlled Substances (EPCS) integrates into existing workflows to offer new dimensions of safety and security for controlled substance prescriptions.
E-PRESCRIPTIONS:
20142013 20162015 2017
1.74 BILLION
1.6 BILLION
1.4 BILLION
1.2 BILLION
1.04 BILLION
CONTROLLED SUBSTANCES:
340,000 1.67 MILLION 12.81 MILLION 45.34 MILLION
*Including buprenorphine, codeine, fentanyl, hydrocodone, oxycodone, hydromorphone, and morphine** Calculations do not account for unfilled prescriptions.
ALL PRESCRIPTIONS73%2016
2017 77%
NON-CONTROLLED SUBSTANCES 87%2016
2017 90%
CONTROLLED SUBSTANCES 11%2016
2017 21%
IN 2017, WE WORKED TOGETHER TO
ENHANCE PRESCRIBING
PERCENT OF PRESCRIPTIONS DELIVERED ELECTRONICALLY**
77.33 MILLION (26.6 MILLION
FOR OPIOIDS)*
06 | 2017 NATIONAL PROGRESS REPORT
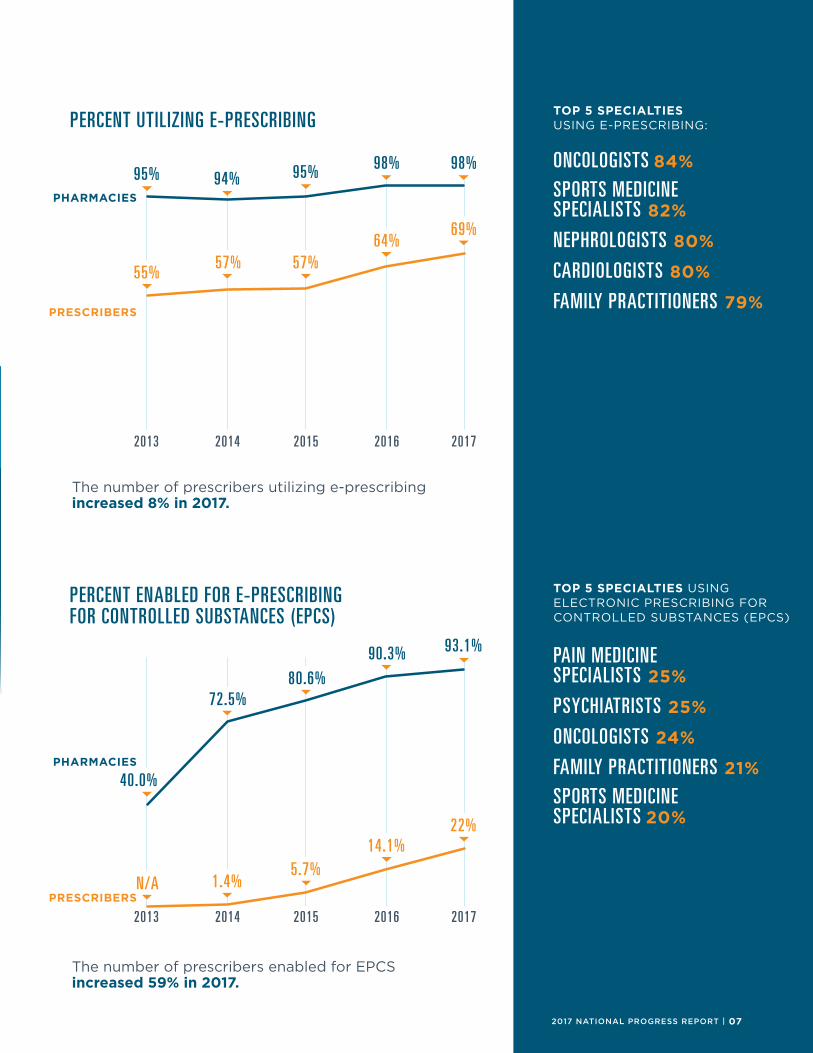
TOP 5 SPECIALTIES USING E-PRESCRIBING:
ONCOLOGISTS 84%
SPORTS MEDICINE SPECIALISTS 82%
NEPHROLOGISTS 80%
CARDIOLOGISTS 80%
FAMILY PRACTITIONERS 79%
TOP 5 SPECIALTIES USING ELECTRONIC PRESCRIBING FOR CONTROLLED SUBSTANCES (EPCS)
PAIN MEDICINE SPECIALISTS 25%
PSYCHIATRISTS 25%
ONCOLOGISTS 24%
FAMILY PRACTITIONERS 21%
SPORTS MEDICINE SPECIALISTS 20%
PERCENT UTILIZING E-PRESCRIBING
PERCENT ENABLED FOR E-PRESCRIBING FOR CONTROLLED SUBSTANCES (EPCS)
20142013 20162015 2017
PHARMACIES
PRESCRIBERS
95% 94% 95% 98% 98%
55%57% 57%
64%69%
20142013 20162015 2017
PHARMACIES
40.0%
93.1%
N/A 1.4%5.7%
14.1%22%
72.5%80.6%
90.3%
PRESCRIBERS
77.33 MILLION (26.6 MILLION
FOR OPIOIDS)*
The number of prescribers utilizing e-prescribing increased 8% in 2017.
The number of prescribers enabled for EPCS increased 59% in 2017.
2017 NATIONAL PROGRESS REPORT | 07
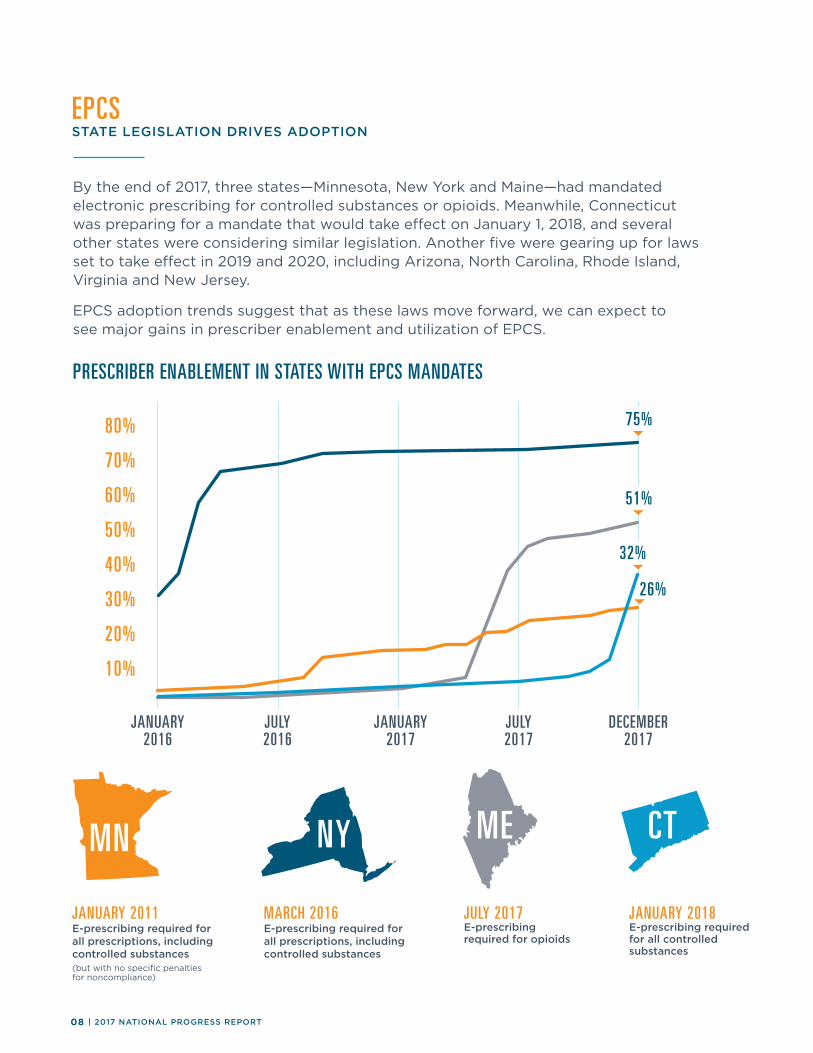
EPCSSTATE LEGISLATION DRIVES ADOPTION
By the end of 2017, three states—Minnesota, New York and Maine—had mandated electronic prescribing for controlled substances or opioids. Meanwhile, Connecticut was preparing for a mandate that would take effect on January 1, 2018, and several other states were considering similar legislation. Another five were gearing up for laws set to take effect in 2019 and 2020, including Arizona, North Carolina, Rhode Island, Virginia and New Jersey.
EPCS adoption trends suggest that as these laws move forward, we can expect to see major gains in prescriber enablement and utilization of EPCS.
JULY 2017E-prescribing required for opioids
MN
JANUARY 2011E-prescribing required for all prescriptions, including controlled substances (but with no specific penalties for noncompliance)
MARCH 2016E-prescribing required for all prescriptions, including controlled substances
MENY
PRESCRIBER ENABLEMENT IN STATES WITH EPCS MANDATES
CT
80%
70%
60%
50%
40%
30%
20%
10%
JANUARY 2018E-prescribing required for all controlled substances
JANUARY2016
JULY2016
JANUARY2017
JULY2017
DECEMBER2017
75%
51%
32%
26%
08 | 2017 NATIONAL PROGRESS REPORT

EPCS STATE RANKINGS2017 Rank
2016 Rank
State Pharmacy Enablement
Prescriber Enablement
Controlled Substances Prescribed Electronically
1 1 New York 97.8% 74.8% 93.8%2 2 North Dakota 98.2% 40.9% 57.0%3 25 Maine 99.3% 51.0% 41.2%4 3 South Dakota 96.2% 30.2% 37.3%5 7 Minnesota 95.9% 26.4% 34.2%6 4 Nebraska 91.1% 29.4% 30.8%7 14 Wisconsin 95.4% 29.2% 25.5%8 11 Utah 96.2% 34.1% 16.7%9 20 New Hampshire 99.2% 25.4% 20.9%10 10 North Carolina 96.8% 26.7% 21.4%11 30 Connecticut 99.4% 31.8% 10.7%12 5 Rhode Island 99.4% 25.7% 17.0%13 6 Delaware 97.5% 15.1% 31.9%14 9 Michigan 96.5% 21.1% 21.3%15 8 Texas 93.9% 19.9% 24.4%16 13 Indiana 96.8% 19.3% 16.6%17 16 California 91.7% 17.9% 19.2%18 12 Oregon 96.2% 19.0% 13.4%19 15 Vermont 93.1% 14.0% 19.7%20 17 Massachusetts 96.2% 11.8% 16.9%21 19 Ohio 95.2% 13.8% 15.0%22 18 Arizona 96.9% 12.4% 14.2%23 23 Maryland 95.5% 10.9% 16.5%24 32 Missouri 95.4% 12.9% 13.1%25 24 Colorado 97.2% 12.7% 11.4%26 29 Louisiana 93.8% 15.4% 10.8%27 22 Wyoming 94.9% 11.2% 15.0%28 34 Pennsylvania 95.2% 12.6% 11.6%29 28 Arkansas 97.9% 10.8% 11.3%30 33 Idaho 96.2% 12.2% 10.7%31 21 Oklahoma 96.7% 9.4% 12.7%32 26 Kansas 96.0% 10.7% 11.3%33 38 Tennessee 91.0% 16.4% 8.6%34 47 District of Columbia 91.0% 15.9% 8.8%35 40 Kentucky 94.3% 10.1% 12.9%36 27 New Jersey 95.7% 8.9% 12.2%37 41 South Carolina 93.8% 12.1% 9.9%38 36 New Mexico 95.9% 9.1% 10.0%39 35 Illinois 92.9% 10.1% 11.2%40 31 Iowa 94.8% 9.5% 10.1%41 39 Alaska 92.4% 10.8% 10.7%42 46 Montana 91.9% 12.0% 6.2%43 44 Virginia 93.2% 9.7% 7.5%44 37 Washington 92.4% 7.2% 10.2%45 43 Nevada 93.6% 8.5% 5.8%46 42 Georgia 94.5% 5.8% 8.3%47 48 Florida 88.5% 8.2% 7.8%48 45 West Virginia 91.7% 7.1% 6.1%49 49 Alabama 90.5% 6.1% 5.9%50 50 Mississippi 88.4% 5.7% 6.0%51 51 Hawaii 89.3% 3.8% 6.3%52 U.S. Virgin Islands 30.4% 7.0% 0.0%53 Puerto Rico 29.6% 0.9% 0.0%Nationwide 93.1% 22.0% 18.8%
STATE HIGHLIGHTS
Maine: Thanks in part to a July 2017 mandate, Maine advanced 22 spots to claim the third-highest rate of EPCS adoption in the nation—the largest jump we saw in 2017. Now more than half of all prescribers are enabled and 41% of controlled substances are prescribed electronically.
Connecticut: Connecticut also made impressive progress in 2017, rising 19 spots higher than in 2016.
New York: EPCS is nearly ubiquitous in New York, which maintained the nation's highest rate of e-prescribing of controlled substances for the third year running.
2017 NATIONAL PROGRESS REPORT | 09
We heard over and over in 2017 that today's prescribers consider price and benefit information essential to a fully informed medication decision—and with good reason. Considering that a $10 copay increase makes a prescription 10% more likely to be abandoned, prescribing without the certainty that a patient can afford and access their medication is a big risk to adherence.1
U.S. physicians understand the stakes are high: In October, a Surescripts survey performed in partnership with ORC International found that 56 percent of physicians highly value electronic access to out-of-pocket costs, 74 percent think it's important to consider patients' benefit information before prescribing and 59 percent want to review the cost of similar medications.2
In 2017, we introduced our Real-Time Prescription Benefit and expanded Electronic Prior Authorization solutions, revolutionizing the e-prescribing process. Thanks to strong partnerships with PBMs, EHR vendors and others across the Surescripts Network Alliance, both solutions saw rapid expansion and adoption. And that means more and more prescribers are getting the insight they need to create a shorter, clearer path to treatment success.
"It's a much better experience for the patient, much more efficient for the physician and, most importantly, gets that patient on a therapy that they know they can afford and is aligned with their benefit right from the start." —Dr. Lynne Nowak, Chief Physician Experience Officer at Express Scripts, on providing price transparency at the point of care
PRICE TRANSPARENCY REDUCING FRICTION FOR PRESCRIBERS, PHARMACISTS AND PATIENTS
1. Louise Pilote et al., “The Effects of Cost-Sharing on Essential Drug Prescriptions, Utilization of Medical Care and Outcomes After Acute Myocardial Infarction in Elderly Patients,” Canadian Medical Association Journal, no. 167(3) (August 2002): 246–252.2. Surescripts, “Data Brief: Physician Perspectives on Access to Patient Data,” April 2018, http://surescripts.com/docs/default-source/intelligence-in-action/1785_databrief_providersurvey_graphics_final3_web.pdf.
10 | 2017 NATIONAL PROGRESS REPORT
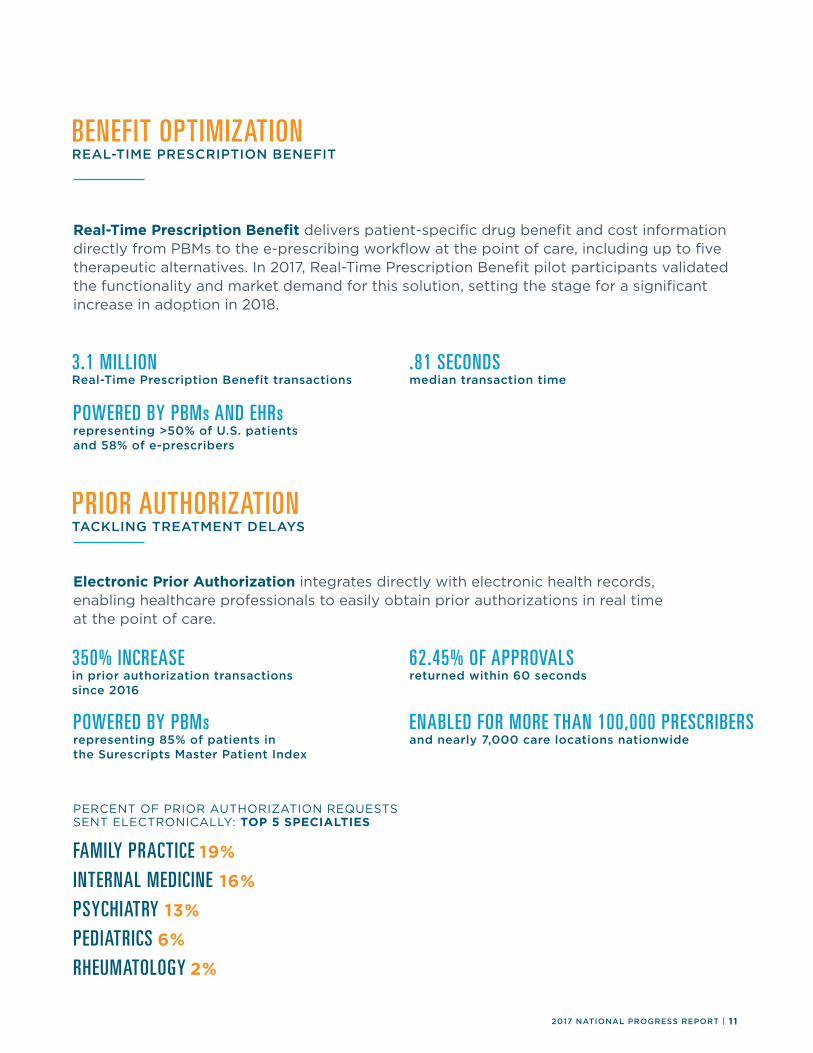
BENEFIT OPTIMIZATION REAL-TIME PRESCRIPTION BENEFIT
Real-Time Prescription Benefit delivers patient-specific drug benefit and cost information directly from PBMs to the e-prescribing workflow at the point of care, including up to five therapeutic alternatives. In 2017, Real-Time Prescription Benefit pilot participants validated the functionality and market demand for this solution, setting the stage for a significant increase in adoption in 2018.
3.1 MILLION Real-Time Prescription Benefit transactions
POWERED BY PBMs AND EHRs representing >50% of U.S. patients and 58% of e-prescribers
.81 SECONDS median transaction time
PRIOR AUTHORIZATIONTACKLING TREATMENT DELAYS
Electronic Prior Authorization integrates directly with electronic health records, enabling healthcare professionals to easily obtain prior authorizations in real time at the point of care.
350% INCREASE in prior authorization transactions since 2016
POWERED BY PBMs representing 85% of patients in the Surescripts Master Patient Index
62.45% OF APPROVALS returned within 60 seconds
ENABLED FOR MORE THAN 100,000 PRESCRIBERS and nearly 7,000 care locations nationwide
PERCENT OF PRIOR AUTHORIZATION REQUESTS SENT ELECTRONICALLY: TOP 5 SPECIALTIES
FAMILY PRACTICE 19%
INTERNAL MEDICINE 16%
PSYCHIATRY 13%
PEDIATRICS 6%
RHEUMATOLOGY 2%
2017 NATIONAL PROGRESS REPORT | 11

MEDICATION HISTORY TELLING THE FULL STORY OF PATIENTS’ PRESCRIPTIONS
Surescripts Medication History solutions for ambulatory care, reconciliation and population health give a more complete and accurate picture of a patient’s medication history by providing access to PBM claims and pharmacy fill data.
MEDICATION HISTORIES DELIVERED PER YEAR*
20142013 20162015 2017
1.46 BILLION
1.08 BILLION
1.05 BILLION
848 MILLION
747 MILLION
35% INCREASE
355,000 MEDICATION HISTORIES delivered for populations
IN 2017, WE WORKED TOGETHER TO
INFORM CARE DECISIONS
Including approximately 1 million delivered to long-term and
post-acute care facilities
*Only includes medication history data supplied by PBMs12 | 2017 NATIONAL PROGRESS REPORT

CLINICAL HISTORY RECORD LOCATOR & EXCHANGE
Record Locator & Exchange allows healthcare providers to quickly see where patients have received care and locate and exchange records from across all 50 states and Washington, D.C., regardless of care setting or EHR.
WHERE ARE CLINICIANS USING RECORD LOCATOR & EXCHANGE?
DECEMBER 2016 DECEMBER 2017
*Annualized rate as of December 2017 2017 NATIONAL PROGRESS REPORT | 13
USED BY 51,888 CLINICIANS representing 3,130 organizations across 48 states and Washington, D.C.
16 MILLION clinical documents exchanged annually*
65 MILLION documents listing patients’ previous care locations exchanged annually*

CLINICAL DIRECT MESSAGING MAKING CARE COORDINATION SWIFTER AND SIMPLER
Clinical Direct Messaging lets pharmacists and clinicians seamlessly send and receive information across multiple care collaboration scenarios.
20142013 20162015 2017
25.9 MILLION
19.6 MILLION
15.28 MILLION
7.4 MILLION
509,000
32% INCREASE
messages sent among 529,000 individual and organization users nationwide,
including 22,000 pharmacies
INSIGHTS & ALERTS INSIGHTS FOR MEDICATION ADHERENCE
Insights for Medication Adherence highlights adherence issues and gaps in care with medication summaries and real-time messages, sent straight from PBMs and health plans to the point of care.
197,000 INSIGHTS FOR MEDICATION ADHERENCE alerts sent to the point of care
CLINICAL DIRECT MESSAGES PER YEAR
14 | 2017 NATIONAL PROGRESS REPORT

INSIGHTS & ALERTS INSIGHTS FOR MEDICATION ADHERENCE
197,000 INSIGHTS FOR MEDICATION ADHERENCE alerts sent to the point of care
IN 2017, WE WORKED TOGETHER TO
CONVENE THE INDUSTRY AND ADVANCE HEALTHCARE
Year after year, we continue to make progress with the help of every participant in the Surescripts Network Alliance. In 2017, we convened experts and workgroups from across the alliance and partnered with leading industry organizations and standards bodies to advance healthcare through research, analysis, education and advocacy.
Together, we applied our experience and energy to some of the biggest challenges facing healthcare on the national level. We gathered top healthcare leaders to help make price transparency a reality for prescribers and their patients. We collaborated on interoperability standards and initiatives with organizations including HL7, Carequality and DirectTrust.
We continued to work with our Critical Performance Improvement program to improve prescription accuracy by addressing e-prescribing’s pain points. And we took action against the opioid epidemic on many fronts, wielding a combination of technology, education and public policy.
These issues are complex, and none will be solved overnight. But our results from 2017 show that together, we’re making advances that matter to the lives of patients and healthcare professionals nationwide.
2017 NATIONAL PROGRESS REPORT | 15

Our purpose is to serve the nation with the single most trusted and capable health information network, built to increase patient safety, lower costs and ensure quality care. Since 2001, Surescripts has led the movement to turn data into actionable intelligence and convened network participants to enhance e-prescribing, inform care decisions and advance healthcare. Visit us at surescripts.com and follow us at twitter.com/surescripts.
Copyright ©2018 by Surescripts, LLC. All rights reserved.
Recommended