NBER WORKING PAPER SERIES
HEALTH PLAN CONVERSIONS:ARE THEY IN THE PUBLIC INTEREST?
Nancy Dean Beaulieu
Working Paper 10127http://www.nber.org/papers/w10127
NATIONAL BUREAU OF ECONOMIC RESEARCH1050 Massachusetts Avenue
Cambridge, MA 02138December 2003
An earlier version of this paper was presented at the NBER 2003 Frontiers in Health Policy ResearchConference that took place in Washington D.C. in June 2003. The research for this paper was funded in partby the D.C. Appleseed Center for Law and Justice, a public advocacy organization that became a formal partyto the official conversion proceedings of the Blue Cross and Blue Shield plan, CareFirst Inc. I am gratefulto Richard Herzog, Walter Smith, Richard Meyer, Jack Needleman, and participants in the NBER 2003Frontiers in Health Policy Research Conference for helpful comments and conversations. The viewsexpressed herein are those of the authors and not necessarily those of the National Bureau of EconomicResearch.
©2003 by Nancy Dean Beaulieu. All rights reserved. Short sections of text, not to exceed two paragraphs,may be quoted without explicit permission provided that full credit, including © notice, is given to the source.

Health Plan Conversions: Are They in the Public Interest?Nancy Dean BeaulieuNBER Working Paper No. 10127December 2003JEL No. I1, L3
ABSTRACT
Recently, not-for-profit health plans have been converting to for-profit status and these conversions
have frequently occurred as steps to facilitate merger or acquisition with a for-profit company.
Some industry observers attribute these managed care market place trends to an industry shake out
resulting from increased competition in the sector. At the same time, the perceived competitive
pressures have led to questions about the long run viability of non-profit health plans. Furthermore,
some industry and government leaders believe that some non-profits are already conducting
themselves like for-profit health plans and question the state premium tax exemption ordinarily
accorded to such plans. This paper develops a framework for evaluating health plan conversions
and examines related health policy issues through the lens of a case study of the proposed
conversion of the CareFirst Blue Cross Blue Shield Company. Analyses demonstrate that CareFirst
wields substantial market power in some segments of its local market, that it is unlikely to realize
cost savings through expanded economies of scale, and that quality of care appears to be lower in
the plans typically acquiring converting health plans.
Nancy Dean BeaulieuMellon Hall A4-5Harvard Business School Soldiers Field RoadBoston, MA 02163and [email protected]

3
1. Introduction
In 1994, the Blue Cross and Blue Shield (BCBS) Association changed its by-laws to
allow members to convert to public stock companies. This touched off a streak of
conversions and health plan combinations. To date, 14 BCBS plans have converted to for-
profit plans and a few more have conversions pending. There has also been consolidation
among BCBS plans; in 1996 there were 63 BCBS plans in operation, in 2003 there are 41. In
many instances BCBS plans have converted with the explicit intention of being acquired or
merging with another firm; hence conversions and consolidation are intertwined. This has
certainly been the case for two BCBS plans that have led the consolidation. Anthem, Inc. is a
publicly-traded BCBS plan that was built up through the acquisition of exclusive BCBS
licenses in 9 states. WellPoint, Inc. began with the conversion of the California Blue Cross
Association and has grown to the largest BCBS company with operations in California,
Georgia, and Missouri.1 There has been regional consolidation among non-profit BCBS
plans as well (e.g. the Regence Group with operations in Washington, Oregon, Utah and
Idaho).
These changes among BCBS Association members have occurred against a backdrop
of the growing presence of national managed care companies and for-profit health plans in
the HMO industry. As shown in Figures 1 and 2, HMO enrollment increased 173% over the
time period 1987 to 2001. Nearly three quarters of the increase is attributable to enrollment
growth in for-profit health plans; 50% of the enrollment growth occurred in for-profit
national managed care plans. Some industry analysts have argued that the rise of national
managed care companies has precipitated conversion and consolidation among BCBS plans. 1 Standard & Poor’s, Ratings Direct, Research Report: Blues Convert to For-Profits to Compete, November 12, 2002.
4
Each of the conversion cases is unique. Local health plan markets are unique, and so
the health plans that operate in them evolve with a unique history. Thus, the evaluations of
specific conversion petitions (and possible acquisitions and mergers) must take into account
factors unique to each market. However, there are policy issues common to all conversions
and in this chapter I develop a framework for analyzing these issues and clarifying the trade-
offs faced by policymakers.
Following a general discussion of the policy issues and the development of an
analytic framework, I present a case study analysis of a particular conversion petition. In
January of 2002, the CareFirst Corporation filed applications to convert to public stock
ownership with insurance commissioners in the states of Delaware and Maryland, and in the
District of Columbia. CareFirst’s conversion application was explicitly linked to subsequent
acquisition by Wellpoint Inc. I present analyses that were conducted for the public advocacy
organization, D.C. Appleseeds, to support its participation in the formal proceedings in
Washington D.C. At the end of this paper, I will discuss the information gaps that plague
research and policy analysis on this topic, opportunities for health economists to contribute to
policy in this arena, and the limitations and generalizability of my case study research.
2. Policy Issues in Health Plan Conversions
Blue Cross and Blue Shield plans are not the only health plans to convert to public
stock ownership. However, the BCBS conversion petitions have sparked the most public
debate in part because of the special circumstances in which they were created and because
their conversion typically requires a formal determination by a regulatory official; some
conversions even require legislation. This chapter deals specifically with BCBS conversions;

5
however, several of the health policy issues are germane to other health plan conversions and
more generally to the role of not-for-profit organizations in health care.
Origins of the Blue Cross and Blue Shield Plans
Many of the health policy issues that arise in connection with the conversion to for-
profit status of BCBS plans relate in some way to the original creation of the Blue Cross
companies. As detailed in Blackstone and Fuhr (1998), most of the Blue Cross plans were
initiated by the hospital industry in the 1920s and 1930s to provide hospital insurance at a
time when hospitals had declining occupancy rates and escalating operating costs. Typically,
these plans were established through state legislation as public benefit organizations and
intended to serve as insurers of last resort. In enacting legislation to establish the
Pennsylvania BC plan in 1937, Representative Herbert Cohen remarked:
“The Legislature of Pennsylvania in approving this law was attempting to meet a severe need of providing citizens of Pennsylvania with hospital care at a cost within their means and also of providing hospitals with a source of financial support which would place them in a more stable financial position and therefore less dependent upon state and local tax funds. The Legislature therefore was attempting to fill a gap created by commercial insurance companies’ underwriting policies which left the mass of Pennsylvania citizens unprotected from hospitalization expenses and hospital bills in many instances unpaid.”2
The plans were exempted from state income taxes on premiums and in return were
subject to various regulations and charged with a public service commitment. Blue Shield
plans were created to provide insurance for physician services. The two insurance
associations merged into the BCBS Association in 1982.3
Non-profit BCBS Plans and the Public Interest
2 Quoted in Blackstone, Erwin A. and Joseph P. Fuhr, 1998. “Blue Cross: Health Insurance,” in Market Dominance, edited by David I. Rosenbaum, Westport, CT: Praeger Publishers, pp. 179-180. 3 Blackstone and Fuhr, 1998. “Blue Cross: Health Insurance”

6
Because these plans were chartered as tax-exempt organizations for public benefit,
state insurance commissioners are obligated to assess whether conversion to a public stock
company is in the public’s interest. In addition, in the case in which conversion precedes the
sale of a BCBS plan,4 the insurance commissioner must ascertain that the public receives fair
value for the plan from the acquirer. 5 In some instances, the proceeds of the sale are placed
in a foundation; these funds are often used to meet the original objectives of the BCBS plans
– to provide access to health care services for those in need.6
In reaching a judgment on whether conversion advances the public interest, state
insurance commissioners are likely to take into account the potential effects of conversion on
multiple stakeholders. For example, the insurance commission will want to know how
conversion will affect insurance coverage for vulnerable populations and reimbursement to
providers. This analysis of the effects of conversion will require an understanding of how, if
at all, the behavior or conduct of the health plan might change as a result of the conversion
and potential sale or merger. There are at least six dimensions of health plan conduct that the
insurance commissioner may consider:
Products Offered and Markets Served. Most health plans offer a number of different
health insurance products and some of these products are tailored for particular
subpopulations. Products may differ on several dimensions (e.g. the provider network,
reimbursement for care provided by providers not in the network, coinsurance and
4 Most BCBS plans convert to a public stock company as a step toward merging with or being acquired by another BCBS plan; the existence of publicly traded stock facilitates the ownership transfer and combination. 5 One of the Association’s by-laws requires that the use of the BCBS trademark can only be acquired by another BCBS plan. 6 The financial proceeds from the conversion and sale or initial public offering of a BCBS plan do not always endow a public trust or charitable foundation. Jamie Robinson describes the factors that led the state government to benefit financially from the conversion of Empire, Blue Cross and Blue Shield of New York (“The Curious Conversion of Empire Blue Cross,” Health Affairs, vol. 22(4):100-118, July/August 2003).

7
copayment rates, services covered (i.e. benefit design), and maximum payments under the
policy). In some states, not-for-profit health plans are required to offer plans in which any
person may enroll without regard to the individual’s age, employment status, health status, or
any other factor which might otherwise cause the individual to be denied health insurance.
These plans are sometimes referred to as open enrollment plans. In deciding on the set of
health insurance products to offer, health plans make implicit choices about whether to serve
certain subpopulations. For example, not all health plans choose to offer a Medicaid or
Medicare product; other noteworthy subpopulations include the small business segment, the
individual policy segment, and the Federal Employees Health Benefits Program (FEHBP).
Quality of Care. There are a number of ways in which health plans can influence the
quality of health care services delivered to enrollees. Many of these levers require financial
outlays by the health plan for patient and physician education, information systems, and
program design and administration. For example, health plans may design and implement
chronic disease management programs.
Quality of Service. Health plans have frequent interactions with enrollees about
coverage issues, the status of particular claims, and the plan’s provider network. The manner
in which these inquiries are resolved may not directly affect quality of care but may
indirectly affect access to care.
Pricing and Underwriting Practices. In some states, health insurance premiums for
particular managed care products are community rated; this means that the insurance
regulator has eliminated the health plan’s pricing decision and requires all plans serving a
specific population to charge the same premium. In other states, premiums (and benefit
design) for some products are subject to review by the insurance regulator. In yet other

8
states, there is no regulatory oversight of health plan pricing policies. Depending on the
regulatory regime of the state in which the health plan is operating, there may be additional
scope for the health plan to adjust premiums based on the risk factors of the group (or
individual) to be insured. These are the firms underwriting policies.
Provider Networks and Reimbursement. In most states and for most products, health
plans have a free hand in deciding which providers to include in their networks and in
negotiating the level and the form of reimbursement for services delivered to enrollees.7
Anecdotally, it is frequently noted that some health plans reimburse at levels substantially
above or below other health plans in the same market. Health plans may institute other
policies that make it more or less difficult for the physician to be reimbursed for health care
services. For example, some providers criticize utilization review and pre-certification as
burdensome interventions that increase physicians’ costs of delivering care and decrease
patients’ access to care.
Public and Community Health Efforts. Most health plans earmark some resources for
outreach efforts intended to improve the health of community members irrespective of
enrollment in the health plan. These efforts include such measures as free screening for
certain diseases and public health education.
Changes in the conduct of the health plan in any of the above mentioned areas could
influence access to health care, insurance coverage, the quality of health care services provided,
health status in the population, the financial health of providers, and the costs of health insurance
to individuals and employers.
7 A recent Supreme Court ruling upheld so-called “any willing provider” laws enacted at the state level which require health maintenance organizations to accept any qualified doctors who wants to join the HMO’s provider network (“Justices: States can force HMOs to open networks,” by Bill Mears, CNN.com, April 2, 2003)

9
Necessary Conditions for Changes in Health Plan Conduct
Whether the conversion or conversion/sale of a health plan is likely to alter the health
plan’s conduct on any of the above dimensions hinges on two conditions. First, depending on
the regulatory environment and the nature of the market in which the health plan operates, there
may or may not be scope for the plan to change its conduct on some of these dimensions. For
example, it may be that all health plans operating in a particular state, regardless of their tax
status, must reimburse hospitals according to the same mandated fee schedule. An alternative
potential constraint on health plan conduct may be present in the level of market competition.
Consultants to one health plan applying for conversion have argued that the market in which the
health plan was operating was so competitive as to effectively limit the prices the health plan
could charge and still attract enrollees.8
The second condition necessary for a conversion or a conversion/sale to result in a
change of conduct is that such change must be expected to increase the (short or long term)
profitability of the health plan. Conceptually, a converting health plan could increase
profitability in three ways. First, it could terminate the practice of cross-subsidizing premiums
on unprofitable insurance products or subsidizing care delivery by certain providers. Eliminating
a subsidy or cross-subsidy could increase profits but only at the expense of one of the
stakeholders (i.e. some population of consumers or providers); thus this type of change in
conduct would amount to a value transfer from consumers and/or providers to shareholders.
The second mechanism through which a converting health plan may increase profits is
through investment in new products and technologies. There are two examples in this category
that come to mind. Some market observers and participants allege that not-for-profit health
8 “Community Impact Analysis of the Proposed Conversion of CareFirst, Inc.,” a report produced by Accenture for CareFirst BlueCross BlueShield, January 2002.

10
plans have limited access to capital and therefore may be unable to make the necessary
investments that would lead to new products or lower costs. It may also be that non-profit health
plans are subject to some organizational inertia and that, while they possess the necessary
resources and capabilities, they do not feel compelled to innovate. This organizational inertia
could be attributable to insulation from competitive pressure afforded by the state tax exemption
on premiums. A change in conduct of this nature could lead to value creation since consumers
would benefit from new products and reduced costs.
The third mechanism through which a converting health plan may increase profits is
through improved efficiency resulting from enhanced accountability and governance structures.
In non-profit organizations, the residual claimants to the surplus created by an organization are
unclear. Those who make decisions for the organization do not have a clear objective function;
consequently it is difficult to identify suitable performance measures, structure appropriate
incentives, and to hold decision-makers accountable. Reducing inefficiency through improved
accountability and governance structures is a value creating activity because it results in services
being delivered at the lowest cost to society overall.
Recall that the insurance commissioner must make a determination of whether a
conversion is likely to advance the public interest. If the expected changes in health plan
behavior do not have the potential to create additional value and are simply a transfer from
consumers and providers to prospective shareholders, it would seem difficult to argue that the
conversion is in the public interest. If on the other hand, the expected changes in health plan
behavior are likely to result in new and better products, conversion may indeed advance public
welfare. In all likelihood, a health plan conversion will have the potential for both value creation

11
and value transfer. In these cases, the insurance commissioner must in essence make a judgment
that involves tradeoffs between different stakeholders.
Other Considerations Beyond Changes in Health Plan Conduct
Changes in health plan conduct are only the most straightforward of considerations in
evaluating whether conversion is in the public interest. The simple alternatives of approving or
denying the conversion petition are more complicated than they might seem at first glance. The
consequences of approving the conversion are not simply the anticipated costs and benefits of
changes in health plan conduct; one must also consider the opportunities afforded by an endowed
foundation charged with the mission of serving the public interest. Similarly the consequences
of denying the conversion are not simply the preservation of the status quo. One must consider
the factors that prompted the conversion petition in the first place and what they signal about the
evolution of the local health care market and the viability of the health plan petitioning to
convert.
To assess whether a foundation could more efficiently execute the public service mission
of a non-profit health plan, it will be instructive to first evaluate the extent to which the
petitioning health plan is currently executing this mission and to approximate the resources it
requires (both financial and organizational) to do so. Only then can one make a determination
about whether a foundation could accomplish the same task at a lower cost or implement an
expanded mission with the funds available from the conversion.
Oversight of a not-for-profit health plan’s execution of its mission is not typically
considered to be in the purview of state insurance regulators and is largely delegated to board
members. There is some question as to whether these not-for-profit health plans are completely
fulfilling their missions as public benefit organizations. In written testimony submitted to the

12
Maryland Insurance administration in March 2002, William Jews, the CEO of the CareFirst Blue
Cross Blue Shield Company explains when and why the Blue Cross Blue Shield of Maryland
(BCBSMD) plan stopped filling the role of “insurer of last resort”:
“As with other Blues Plans being formed at about the same time, the [Blue Cross Blue Shield of Maryland plan] was conceived with the goal of providing affordable health care insurance using “community rating” principles. This worked effectively at a time when few, if any, commercial carriers were offering health coverage. In the 1960s, commercial insurance carriers began entering the health insurance market in earnest and introduced the concept of “experience rating”. As commercial carriers focused on providing coverage at lower premiums to the healthiest individuals and groups, Blues Plans like BCBSMD continued to extend coverage to all comers, including high risk customers through its community rating mechanism. As a result, many Blues Plans became known as “insurers of last resort” in their service areas …” That role of insurer of last resort changed in the 1960s when the federal government – in essence – assumed the mantle of insurer of last resort by establishing the Medicare and Medicaid programs to guarantee health covered to the aged and disabled and to provide coverage to the poor. From that point forward, Blues Plans began to compete with commercial insurance carriers and the longstanding expectation that “Blues” would act as the insurer of last resort was greatly minimized. In addition, the continued use by our competitors of experience rating, which gave them an unfair advantage, forced most Blue Plans to abandon community rating in order to survive.”
Jews contends that the creation of public insurance programs by the federal government relieved
the Blues plans of fulfilling their role as insurers of last resort. If the public service mission of
BCBS plans is limited to the narrow interpretation of providing affordable health insurance using
community rating, and if this mission has been abandoned by BCBS plans seeking to convert,
then the insurance commissioner’s decision of whether to approve a conversion petition is
somewhat simplified. Under the current organization and governance structure, the not-for-
profit plan is receiving a tax exemption while operating in a manner closely resembling that of a
for-profit health plan; the foregone tax receipts and the alternative uses of the plan’s assets are
the opportunity costs of disallowing the conversion and requiring the health plan to continue in

13
the status quo. In these circumstances, this line of reasoning should eliminate the alternative of
denying the conversion petition and maintaining the status quo.
However, the insurance commissioner may decide that the public interest would be better
served by going beyond denial of the petition and instituting reform of the health plan
governance structures and accountability systems to ensure that it pursues its original mission.
Whether or not this is the best course of action hinges on two additional analyses: 1) an
assessment of whether the mission will be executed more efficiently by a suitably reformed non-
profit health plan or a newly created foundation, and 2) whether either institution is viable in the
long run.
In the above statements, Jews asserts that the BCBSMD plan was compelled to abandon
its original mission in order to survive competition from commercial insurance carriers. These
views are echoed in a recent account of the conversion of the Blue Cross and Blue Shield plan of
New York.9 Jamie Robinson recounts how state regulators destroyed the delicate balancing act
of cross-subsidization achieved by Empire BCBS when the regulators allowed commercial
insurers to enter the market and attract the healthy low-cost enrollees with lower premiums.
These actions precipitated an adverse selection spiral that left Empire with the sickest enrollees
and the highest costs. In general, the long-term financial viability of an efficient non-profit is
unknown. There is also limited research on the regulatory structures that might support a non-
profit health plan and the social efficiency of such regimes.
The foregoing analysis suggests a framework to guide research and decision-making on
health plan conversions (see Figure 3). Prior to evaluating the potential changes in health plan
conduct and the effects of these changes on public welfare, the insurance commissioner might
first want to consider: 9 Robinson, James, “The Curious Conversion of Empire Blue Cross,” Health Affairs.

14
1. Whether the public interest mission of the not-for-profit can be achieved more
efficiently through a foundation or a health insurance plan; and
2. Whether any organization can faithfully execute this mission and remain financially viable.
After making these assessments, the insurance commissioner must then weigh the costs and
benefits to different constituencies of likely changes in health plan conduct.
3. Case Study
In the previous section of this paper, I have described, in a generic sense, some of the
health policy issues that arise when a not-for-profit health plan petitions a state insurance
regulator to convert to a public stock company and potentially to be acquired by another
company. In this section, I present some case study research conducted when the CareFirst Blue
Cross and Blue Shield Company (with licenses in Delaware, Maryland, and Washington D.C)
petitioned to convert to a public stock company and to be acquired by Wellpoint Health
Networks, Inc. I will provide a brief description of the CareFirst organization and the events
leading up to the conversion petition. I will then summarize the main arguments both for and
against the conversion as they have been presented in oral and written testimony, in publicly
available reports, and in the public press. Next, I will present the results of analyses of market
structure, economies of scale, and quality of care. Finally, I will report on the outcome of the
petition and the research challenges remaining.
Background on Carefirst
CareFirst, Inc. is a holding company with BCBS licenses for Delaware, the District of
Columbia, and Maryland. The company was formed in 1998 with the merger of BCBS of

15
Maryland and BCBS of the National Capital Area (District of Columbia). In 2000, BCBS of
Delaware became part of CareFirst.
CareFirst is overseen by a central board of directors; William Jews is the CEO of
CareFirst and CEO of each of the three subsidiaries that make up Carefirst: Group Health and
Medical Services Inc. - GHMSI (the D.C. Blues), CareFirst of Maryland (the Maryland Blues)
and BCBSD (the Delaware Blues). The CareFirst corporation offers a wide variety of insurance
products in these three jurisdictions.
In November of 2001, CareFirst entered into a merger agreement with Wellpoint Health
Networks, Inc. of California. To consummate this merger agreement, CareFirst needed to
convert to a for-profit public stock company. The insurance commissioners in all three
jurisdictions in which CareFirst operates needed to approve the conversion petition; however,
Maryland was the first jurisdiction to initiate formal proceedings to evaluate the merits of
conversion. As part of the proceedings in Maryland and in the District of Columbia, public
hearings and discovery were held to generate information to inform the public interest
determination. Valuation studies of CareFirst were also initiated.
Summary of arguments for and against conversion
The CareFirst management team and its consultants advanced three primary reasons in
support the conversion petition. First, they cited an inability to access sufficient capital to fund
investments that would enhance efficiency, improve customer service, and facilitate the
development of new and better products. However, in the consultant’s report and in CareFirst’s
strategic plan it appeared that the need for capital was largely driven by plans for acquiring other
health plans. The need to achieve economies of scale was cited as the primary reason for this
acquisition strategy. Second, without these improvements (and larger scale), they contended that

16
CareFirst’s long run viability is uncertain. Approving the conversion would therefore “help to
secure the long-term future of the “Blue” brand in local markets”.10 Third, approving the
conversion and merger with Wellpoint would benefit the public because it would result in
additional tax receipts (estimated to be $20 million annually) and the creation of a foundation
with an endowment of $1.3 billion that would be apportioned to the three jurisdictions.
Those opposing the conversion cited a variety of concerns, many of which related to the
future conduct of a for-profit BCBS plan. Concerns about access to care stemmed from the
expectation that after conversion, CareFirst would discontinue offering insurance products that
served vulnerable populations and that were relatively unprofitable. Some people feared that
CareFirst would raise premiums, tighten underwriting practices (abandon guaranteed issue), and
narrow the coverage of the insurance policies it continued to offer. Another policy concern
related to the potential for skimping on quality. Some providers were not supportive of the
conversion petition because they feared reductions in payment rates, increased administrative
burden, and a more adversarial relationship. Both providers and consumers feared the loss of a
local institution led by members of the community with long run interests of the community in
mind. Two objections to the conversion were unrelated to anticipated changes in health plan
conduct. Some people felt that Wellpoint’s offer of $1.3 billion to acquire CareFirst was less
than the fair value of CareFirst as an ongoing concern.11 Finally, many consumers were outraged
at bonuses CareFirst executives were scheduled to receive if the deal went through.
10 Testimony of William L. Jews to the Maryland Insurance Administration, March 11, 2002. 11 Independent valuations of CareFirst by … found Wellpoint’s offer to fall below their assessments of fair market valuation.

17
Economic Analyses Market Structure
CareFirst executives and consultants have suggested in their filings that the markets in
which the CareFirst plans operate are so competitive as to constrain their ability to raise
premiums or lower quality without losing enrollees to other local health plans. They imply that
CareFirst, if it were allowed to convert to for-profit status, would not take such actions (raising
premiums or lowering quality) because the loss of enrollment would decrease profits.
Traditionally, economists have used market share summary measures as proxies for market
competitiveness. The belief is that greater concentration of market share among a smaller
number of firms is likely to result in higher prices.
Computing market shares in practice requires definition of the market and detailed data
for each firm. Market definitions can have large effects on both measures of concentration and
market shares for individual firms. In this section, I examine the extent of market concentration
in the District of Columbia (DC) using data on HMO and managed care enrollment. 12 I am able
to obtain relatively complete enrollment data for health plans licensed to do business in DC;
these detailed data facilitate analyses of market share by consumer segment and product type.
However, CareFirst sells policies in Maryland, Virginia, and Delaware. A complete analysis of
the market power possessed by CareFirst would require comparable analyses in these other
geographical markets.
12 These enrollment data are drawn the mandatory reports filed with the Insurance Commissioner’s Office by health plans licensed to do business in the District of Columbia and from the national databases assembled by InterStudy. The InterStudy data are limited for the purpose of examining total health plan enrollment (HMO and non-HMO) in the following manner. While InterStudy is recognized as the leading source of data on health plans offering HMO products, the universe of plans in these data excludes health plans that do not offer an HMO product, but includes data on non-HMO products for health plans that also offer an HMO. Hence, the sample of health plans in InterStudy is incomplete in its inclusion of purely non-HMO plans.

18
DC Health Plan Enrollment
Table 1 reports the health plan enrollment and market share for each health plan licensed
to sell health insurance policies in the District for the years 2000 and 2001.13 In 2001, there were
a total of 14 health plans most of which fall into one of three categories. Four national for-profit
companies (Aetna U.S. Healthcare, AMERIGROUP, Cigna, and United Healthcare) did a small
amount of business in DC (combined market share of roughly 10.1%). Three other health plans
could be characterized as relatively small regional plans (George Washington University Health
Plan, Optimum Choice, and MD-Individual Practice Association) because they operate in a small
number of adjacent states. In 2001, these regional plans account for 15.6% of the market. Four
health plans offered products only in the District (Health Right Inc, DC Chartered Health Plan,
Advantage Health Plan, and Capital Community Health Plan); together these plans accounted for
3.5% of the market.
Omitted from this categorization are two CareFirst plans and the Kaiser plan. CareFirst
operates two health plans in the District: CareFirst BlueChoice (hereafter BlueChoice) and
Group Hospitalization and Medical Services, Inc. (GHMSI). Together these plans represent
50.9% of the market, however GHMSI with 48.5% share dominates in this market. Kaiser
Foundation Health Plan has the second largest share of the DC market (19.8%) and does not fit
13 These enrollment and market share data were obtained from the health plan filings with the DC Insurance Commissioners Office except for the enrollment data for the Federal Employees Health Benefits Program (FEHBP). The form filed with the Insurance Commissioners office does not list FEHBP enrollment, but does list the total premiums collected by the plan for this product. The InterStudy database contains data on FEHBP enrollment for nearly all of the health plans operating in the District. The CareFirst plan operating under the name of Group Medical and Hospitalization Services, Inc. (GHMSI) does not offer an HMO product and is therefore not included in the InterStudy database. FEHBP enrollment for GHMSI was imputed in the following manner. Using the premium data from the DC Insurance Commission filings and enrollment data from InterStudy, I computed the average FEHBP premium for all health plans offering an FEHBP plan in the District except for GHMSI. I then imputed FEHBP enrollment for GHMSI by dividing its total FEHBP premiums by the average FEHBP premium in the District.

19
neatly into any of the above three categories. It is affiliated with the only national not-for-profit
health plan in the U.S.
Total health plan enrollment in DC grew 2.9% from 2000 to 2001. All national for-profit
plans lost market share over this time period with the exception of AMERIGROUP (which
gained 200 enrollees). Prudential Health Care operated a plan in 2000, but terminated this local
plan in 2001 following its acquisition by Aetna Health Plans. Two regional plans experienced
substantial increases in enrollment (MD-IPA +41,000; Optimum Choice +18,600); the third
regional health plan, George Washington University Health Plan lost roughly 18,000 enrollees.
GHMSI experienced the largest absolute enrollment gains during this period (> 45,000
enrollees).
DC Enrollment by Consumer Segment
As shown in Table 2, health plans operating in the District sell policies to a number of
different consumer segments; however, enrollment in two of these segments (the commercial
group and FEHBP segments) constitutes 91.5% of all health insurance policies sold in DC. The
largest market segment is the commercial group market which accounts for 47% of all health
insurance policies; GHMSI and BlueChoice together hold a 51% share of this segment.
Commercial group products are typically sold to employers (large and small) who in turn offer
these health plans as a benefit to their employees at some fraction of the per enrollee cost to the
employer.
The second largest segment is the Federal Employees Health Benefits Program (FEHBP);
the FEHBP segment is very similar to the commercial group segment in that the Federal
government essentially acts as a large employer. One difference between these two segments is
that any health plan meeting a minimum set of criteria may participate in the FEHBP program

20
(i.e. offer a health plan to federal employees); private-sector employers typically selectively
contract with a very small number of health plans. The FEHBP market segment is nearly as
large as the commercial group segment (44% of policies). Six health plans in the District offer a
policy designed specifically for federal employees, but GHMSI alone holds 51.7% of the market.
Health Plan Enrollment by Product Type
Managed care companies typically offer a variety of health insurance products in the
commercial group segment of the market. These products vary in terms of the health care
providers that members may receive care from and who bears the risk that total premiums may
not equal total expenses during the time the policy is in effect. At one end of the spectrum is the
HMO product; for HMO policies, the managed care company bears all the risk14 and members
are restricted to a pre-specified provider network. At the other end of the spectrum is the
indemnity product; for indemnity policies (which are very rare today), the policyholder and the
managed care company jointly share risk up to some maximum benefit. Policyholders may
receive care from any licensed provider.
In between these two extremes are Preferred Provider Organization (PPO) products and
Point of Service (POS) products. In both PPO and POS plans, the sponsoring managed care
company identifies a preferred list of providers. In the case of a POS, this preferred list of
providers is usually the provider network for an HMO product; in the case of a PPO, the
preferred providers have entered into contracts with the managed care organization in which they
have discounted the fees they charge. When a member of a PPO or a POS seeks care from a
provider not included on the preferred provider list, the member will be responsible for a
coinsurance payment – a fixed percentage of the total amount the non-preferred provider charges
14 Managed care companies may transfer some of this risk to health care providers through contracts that involve prospective payment (i.e. capitation).

21
the health plan for his or her services. When a member of a POS plan receives care from a
preferred provider, there will typically be no coinsurance payment. When a member of a PPO
receives care from a preferred provider, there will typically be a smaller coinsurance payment
compared to when services are obtained from a non-preferred provider. Because of differences
in their provider networks and their benefit design, PPO products are imperfect substitutes for
HMO products.
Table 3 presents statistics on total health plan enrollment by product type in 2001 for
health plans operating in the District.15 Approximately 71% of all health insurance products
marketed by these health plans in the DC-MD-VA region are HMO products. The next largest
category is the PPO product; this product represents 21% of all health insurance products sold in
this region by health plans that participate in the DC market. Note that all health plans offer an
HMO product except for GHMSI, and that only GHMSI offers a PPO product or an indemnity
product; GHMSI does not compete with any other managed care firm in these two product
markets and has the largest market share (~45%) in the POS product market. CareFirst
BlueChoice membership represents a further 24% market share in the POS product market.
Market Concentration
Economists frequently employ the Herfindahl measure to quantify the extent to which
market share is concentrated in a small number of firms. The Herfindahl concentration measure
is computed as the sum of squared market shares for all firms in the market. If there is only one
firm in the market (i.e. monopoly), the Herfindahl equals one. If there are two equally sized
firms in the market, the Herfindahl equals 0.5. Economists are interested in market
15 The data on health plan enrollment by product type was taken from health plan filings with the DC Insurance Commission. These data are aggregated at the health plan level and geographical breakdowns were not available (e.g. the number of GHMSI PPO enrollees in the District of Columbia). Furthermore, FEHBP enrollment was not included in these data. With the exception of GHMSI, it appears that all of the FEHBP health plans offered in the District are HMO plans.

22
concentration because they believe it is related to a firm’s bargaining power with suppliers and
the ability of individual firms to affect the price at which the market clears.
The Herfindahl statistic for the entire District of Columbia health insurance market is
0.29; this is roughly equivalent to having three to four equally sized firms in the market. In some
more narrowly defined market segments, the Herfindahl statistics are substantially higher. For
example, the Herfindahl statistic in the individual market (policies sold to individual consumers
and not through group purchaser) is 0.54; GHMSI’s share of this market is 72%. The Herfindahl
in the FEHBP segment is 0.34 and GHMSI’s market share is 52%. In the District, GHMSI is the
only managed care firm in the PPO and Indemnity market segments (Herfindahl=1.0). Table 4
presents the Herfindahl statistic and GHMSI’s market share for each market segment in which it
participates.
Market Dynamics
Point in time statistics on enrollment and market share provide an incomplete picture of
the competitive nature of a market. One might like to know which products, if any, have gained
popularity in recent years. Comparable historical data from health plan filings with the DC
Insurance Commission were not available to construct a longtitudinal version of Table 1.4.
However, enrollment by product type was available from the InterStudy database for the years
1999 and 2001 for any health plan offering an HMO.16
Table 5 reports changes in the sum total of enrollment by product type for health plans
that offer an HMO and whose primary service area is the District of Columbia, Maryland, or
Virginia. These enrollment changes are also broken down by plan ownership type: National For-
16 Recall that the sample of plans included in the InterStudy database is defined by any plan offering an HMO product (hence GHMSI is not included in the InterStudy database). However, once included in the sample, InterStudy reports enrollment in all types of products (not just HMO products). Because of the sample selection, InterStudy may underestimate enrollment in non-HMO products.

23
Profit, Virginia Blue Cross Blue Shield, Independent (includes for-profit and not-for-profit) and
CareFirst. A list of health plans in each ownership category is included as Exhibit 1.
Market-wide, the largest decreases in total enrollment occurred in the commercial group
HMO product line and in the open-panel HMO product line. The largest increases occurred in
PPO enrollment and enrollment in other non-HMO products. Data in this table suggest that the
national for profit firms decreased enrollment in commercial group HMO products and made up
for about 83% of this HMO enrollment decrease with enrollment increases in PPO and other
non-HMO products. Unlike other health plans in the DC-MD-VA market, CareFirst plans
increased their commercial group HMO enrollment but decreased enrollment in all other HMO
products. However, these decreases were more than offset by large increases in PPO enrollment
and enrollment in self-insured products.
Comparable nationwide enrollment changes between 1999 and 2001 are presented in
Table 6. Similarities between trends in the DC-MD-VA markets and nationwide include a
substantial increase in PPO enrollment, a substantial decrease in commercial group and POS
enrollment, and a decrease in non-group direct enrollment products. In contrast to nationwide
enrollment trends, total managed care enrollment, FEHBP enrollment, and public program
enrollment decreased in plans offering an HMO in the DC-MD-VA market while they increased
nationwide. Overall, however, it seems that enrollment trends in the DC-MD-VA market area
are very similar to enrollment trends nationwide.
In summary, the market share analysis indicates that the CareFirst plan, GHMSI,
dominates the DC health insurance market. GHMSI has very large market share in the largest
consumer segments. Furthermore, the markets in which GHMSI dominates are also very
concentrated. This combination suggests that GHMSI possesses market power in DC. The next
24
largest plan in the DC market is the Kaiser plan; it is noteworthy that the national for-profit
health plans that CareFirst managers perceive as their primary competitors hold relatively small
market shares in DC. Since the market structure analyses were limited to the DC market, it is not
possible to speculate whether other CareFirst plans possess similarly favorable positions in the
Maryland and Delaware markets.
National and local enrollment trends suggest a decline in traditional HMO and POS
products and increases in PPO and other non-HMO products. CareFirst plans are at the forefront
of this trend in the PPO market but lag behind the national for-profit firms in the market for other
non-HMO products.
Economies of scale
CareFirst executives and consultants have argued that the firm’s acquisition by Wellpoint
will lower CareFirst costs because of economies of scale. Strictly speaking, economies of scale
are present when average unit costs fall with increased output. Average unit costs may decrease
over some range of output for two reasons. First, large capital investments represent fixed costs
that lead naturally to declining average costs up to some capacity constraint. Second, marginal
costs may fall over some range of output because of learning curves, specialization, or volume
discounts from suppliers.
In the health insurance market, economies of scale would be present when the average
total cost of insuring an individual are lower with high levels of total health plan enrollment than
with low levels of total plan enrollment. There are a number of intuitive reasons why economies
of scale might be present in managed care operations. First, insurance is largely an information
business and requires substantial capital investment in computers and software to manage that
information. As long as the information systems are not at some capacity constraint, the IT costs

25
of processing information for an additional enrollee is essentially zero; hence health plans can
lower average costs by spreading these fixed costs of capital investment over a larger enrollment
base. In a similar vein, health plans with a larger enrollment base may be able to support a larger
R&D group and have more opportunities for lower cost experimentation with new products and
processes. There are also fixed costs associated with negotiating contracts with health care
providers and purchasers.
Second, greater health plan enrollment may increase the bargaining power that the health
plan can exercise in its negotiations over reimbursements with health care providers (e.g.
doctors, hospitals, pharmaceutical companies). The extent to which increased enrollment
translates into greater bargaining power and lower medical care costs (and hence lower average
total costs) will depend on local market characteristics. In markets where providers are
themselves consolidated into large bargaining units, or in which there is strong demand for
certain types of providers (e.g. a high quality teaching hospital), the health plan’s financial return
to greater enrollment that derives from increased bargaining power will be lower.
A third potential source of economies of scale in health insurance relates to the amount of
financial reserves that a health plan must hold to meet statutory requirements. For statistical
reasons, the per-enrollee amount of financial reserves that a health plan is required to hold will
be less for health plans with larger enrollment bases.
If we define economies of scale as average costs falling with increased enrollment, then it
is possible to test for the presence of economies of scale in health insurance using a dataset on
health plan costs, enrollment, and other characteristics. The following paragraphs report the
results of such an analysis.
26
Most states require health insurance plans to file quarterly and/or annual reports with the
state insurance commissioner using a common format created by the National Association of
Insurance Commissioners (NAIC). These data are publicly available. The Weiss Ratings
Company collects and compiles these data and sells reports based on these data. In the data
compiled by Weiss Ratings are reports of total health plan administrative expenditures, total
health plan medical expenditures, total health plan enrollment, and a number of characteristics on
the health plan and the insurance products it markets.
The sample for analysis was created by selecting all health plans classified as HMOs in
the Weiss data reporting positive enrollment in 2001. These selection criteria yielded a sample
size of 439 health plans. Health plans that exclusively enrolled Medicare beneficiaries (11 plans)
or Medicaid beneficiaries (60 plans) were dropped from the analysis. Health plans reporting
fewer than 5000 enrollees (27 plans, 5 of these plans were Medicaid only or Medicare only
plans) were also dropped from the sample. The remaining health plans were matched with the
InterStudy database to collect additional information about the plans (321 matches out of final
Weiss sample of 347). Missing data for variables used as regressors led to a final sample size of
299 plans.
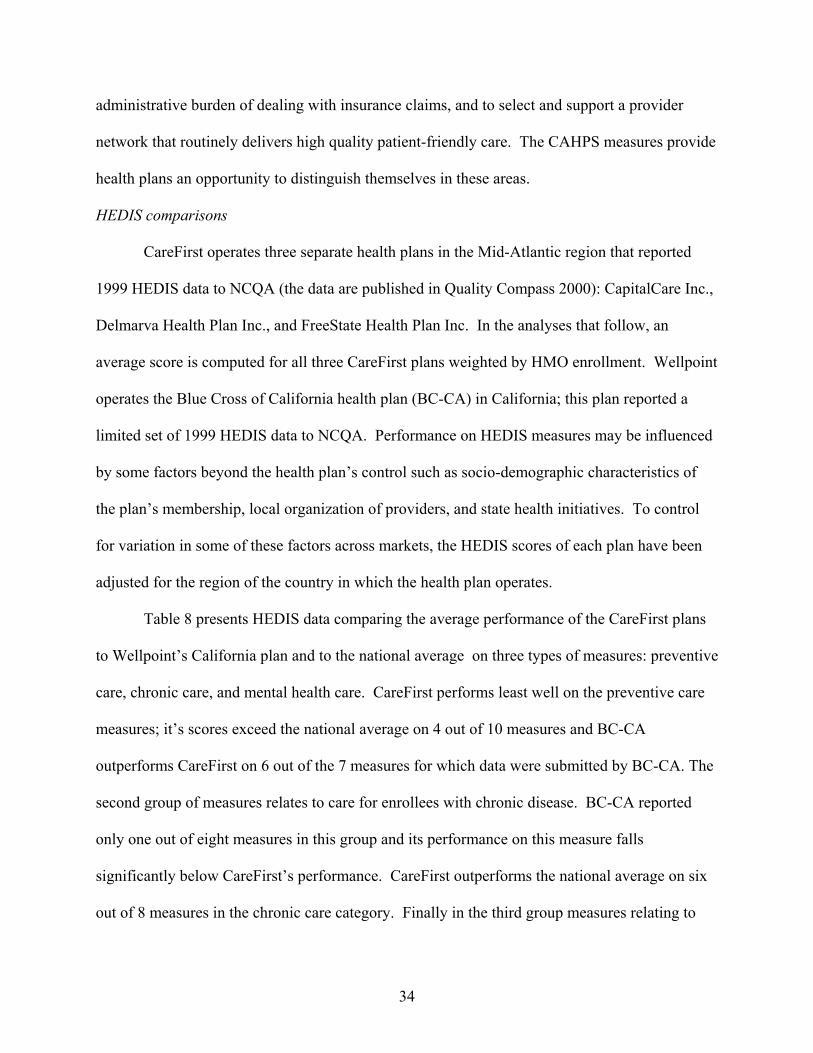
Figures 4 and 5 show substantial variation in the measure of administrative and medical
expenses per member. The correlation between administrative and medical expenses is positive
but not very large (correlation coefficient = 0.55). There is no reason to expect that scale
economies in administrative expenses would be the same as scale economies in medical
expenses. In fact, the earlier discussion suggests different sources of scale economies in the two
types of expenditures. For this reason, separate analyses were conducted to test for scale
economies in medical expenses and administrative expenses.

27
Figure 6 is a frequency distribution of health plan enrollment. This distribution is heavily
skewed to the left; there are a relatively small number of plans with very large enrollment (i.e.
>500,000). On the lower end of the plan size distribution, note that 56% of health plans in this
sample have HMO enrollment under 100,000 members. One indication of the presence of scale
economies is the distribution of medical and administrative expenses for health plans in the top
enrollment decile. If scale economies were present, one would expect to see an over-
representation of these high-enrollment plans in the lowest deciles for average per member
medical and administrative expenses. Figures 7 suggest that this is not the case; the high
enrollment plans are evenly represented in the administrative expense deciles and overly-
represented in the higher medical expense deciles.
Figure 8 is a scatterplot of administrative expenses per member against health plan
enrollment. Though many health plans are clustered in the low enrollment / low administrative
expense quadrant of the graph, there does appear to be a negative relationship between average
administrative expense and enrollment. In contrast, there appears to be no relationship
discernible from the scatterplot of per member medical expenses and enrollment (Figure 9).
A number of health plan characteristics could influence average administrative and
medical expenses independent of scale. Accounting practices in non-profit health plans tend to
result in a larger number of expenses classified as administrative compared to for-profit health
plans. There are also reasons to suspect that the average administrative and medical
expenditures may differ by product line because of the variation in costs of delivering care to
enrollees in different market segments. The InterStudy data records enrollment in several
different product lines including commercial HMO, FEHBP, Medicare Risk HMO, Medicare
supplemental, Medicaid Risk HMO, POS, PPO, and FFS. Not all plans offer all of these

28
products. In addition to the types of products offered by health plans, the total number of
products may be positively related to average administrative costs. Since different product lines
will require product-specific investments in marketing, regulatory compliance, and provider
networks, health plans concentrating their enrollment in fewer products would be more likely to
experience lower administrative expenses and possibly greater economies of scale.
Administrative and medical expenses per member may also be related to the health plan’s
provider network organization. There are four basic types of provider networks: (1) the staff
model in which physicians are employed by the health plan and located in a small number of
clinics, (2) the group model in which health plans contract with physicians practicing in medical
groups that may also contract with other health plans, (3) the Independent Physician Association
(IPA) model in which physicians in solo and group practice contract with an intermediary (the
IPA) which in turn contracts with the health plan, and (4) the network model in which health
plans contract directly (not through an IPA) with a mix of solo-practice and group-practice
physicians. Today, the provider networks of most health plans are a mix of these four model
types. The organization of the health plan’s provider network is related, but not identical to, the
breadth of the network (measured as the number of physicians per member). Health plans with
predominantly IPA-based networks tend also to have larger networks.
Health plans contracting with a large number of providers for a given membership size
will likely have larger administrative costs per member due to the additional transaction costs
involved in negotiating and executing a larger number of contracts. It is also plausible that
health plans with larger provider networks (controlling for membership size) will have higher
medical expenses per member for three reasons: (1) adverse selection, (2) the health plan will
find it more difficult to control utilization with a larger network and a smaller number of

29
enrollees per provider, and (3) the health plan will be less able to negotiate lower provider
reimbursement rates when providers see few of the plan’s enrollees.
In addition to the network characteristics discussed in previous paragraphs, the method of
provider payment may influence average administrative and medical costs. Consider two
primary reimbursement methods: fee for service and capitation. Fee for service reimbursement
requires the processing and payment on a claim to an individual physician every time a service is
delivered. In contrast, capitation reimbursement sometimes involves no filing and processing of
individual claims and only a monthly per member payment to the physician or the practice. In
some cases, health plans employing capitation will require providers to submit dummy claims
that the health plan will then process, but the health plan will still make payments less frequently.
It is also likely that capitation would reduce per member medical costs.
In the last decade there has been substantial consolidation of enrollment into a relatively
small number of national and regional health plans. This trend might be explained by either a
scale economies or a market power argument and has important implications for the empirical
estimation of scale economies. Consider a local health plan that is owned by a managed care
company with a national presence (i.e. one of the local Aetna Health plans). A statistical
analysis of the relationship between local health plan enrollment and local health plan
expenditures (both medical and administrative) that failed to account for affiliation with a
national managed care company would underestimate the true extent of scale economies.17
Affiliation with a national or regional managed care company should convey economies of scale
to a local plan to the extent that the cost of centralized services (i.e. claims processing) can be
spread over a national or regional enrollment base.
17 This is true only to the extent that local health plan enrollment is independent from (not correlated with) total regional or national enrollment.

30
Finally, a health plan’s medical and administrative expenses may depend on
characteristics of the local health care markets in which it operates. There is substantial
geographical variation in the organization of the provider sector, regulatory environment, and the
extent of mandated benefits that could lead to differences in health plan cost structures.
Any one of these health plan or market characteristics could have an impact on average
health plan administrative and medical expenditures. To empirically assess whether there are
economies of scale in health plan enrollment it is necessary to statistically control for these other
factors. Consequently a regression analysis was undertaken to assess the relationship between
health plan enrollment and average per-member administrative and medical expenses.
Table 8 presents the results of two regression analyses. In column two, the dependent
variable is administrative costs per member; in column three, the dependent variable is average
medical costs per member. A fixed effect for the health plan’s primary state of operation (the
state in which the health plan had the greatest enrollment) was included in each regression to
control for regional variation in expenses. The estimated coefficients presented in columns two
and three indicate small but significant economies of scale are present in both administrative
expenses and medical expenses. Because both the dependent variable and the enrollment
variables are measured in natural logs, the coefficients on the enrollment variables in the
regression may be interpreted as elasticities (e.g. the percentage change in administrative
expenses associated with a one percentage change in enrollment). The estimated coefficient on
“within-plan” enrollment is -0.05 for administrative expenses and –0.06 for medical expenses
indicating that a one percentage increase in the health plan’s enrollment is associated with a .05
to .06 percentage point decrease in average administrative and medical costs, respectively.
These estimated relationships are graphically depicted in Figures 10 and 11.

31
Recall that for plans affiliated with National or Regional Managed Care Companies, the
total national or regional enrollment was entered separately into the regression. The coefficients
on these variables indicate the extent to which the additional scale (enrollment) present in a
national or regional managed care company is associated with higher or lower administrative
expenses per member in the local plan. The point estimates on these enrollment variables in both
regressions are essentially zero and insignificant.
Given that the topic of this paper, it is perhaps worthwhile to note that this regression
analysis suggest that non-profit health plans have significantly higher per member administrative
costs but not significantly different average medical costs. However, as noted earlier, this
finding may be an artifact of non-profit accounting customs.
In summary, the regression analysis finds evidence of modest economies of scale in both
administrative and medical costs. The estimated scale economies are nearly exhausted at an
enrollment of roughly 800,000. Only 12 health plans in our sample have an enrollment greater
than this. In addition, it appears that there are no additional scale economies to be gained
through membership in a regional or national managed care company.
Quality of care
Consumers, providers, managers, and researchers all acknowledge that quality in health
care is multi-dimensional and difficult to measure. These characteristics of quality lead to
difficulties in contracting for a specified level of quality and challenges in holding individuals
and organizations accountable for the quality of health care services delivered. Quality of care
arises as an issue in health plan conversions because there is the potential opportunity and
financial incentive for a for-profit health plan to skimp on the aspects of quality that are difficult
consumers to observe and verify.

32
Differences in quality between health plans do exist and are sometimes large. For
example, the Centers for Disease Control estimates that nearly 16 million Americans have
diagnosed or undiagnosed diabetes. If not properly managed, diabetes can have devastating
health consequences and can consume lots of expensive health care resources. To manage their
disease, diabetics and their physicians must know the level of the patient’s Hemoglobin A1c
(HbA1c) and this information is obtained through a simple blood test. In the sample of plans
reporting data to the National Committee on Quality Assurance in 2000, the percentage of
diabetic plan members who had their HbA1c tested ranged from 24% to 97%. This range
suggests substantial variation in performance and ample room for improvement. Research has
shown that health plans that undertake diabetes disease management programs can effect
substantial improvements in care and short-term outcomes for diabetics.
Published health services research documents correlations between health plan
performance on some quality measures and a variety of health plan characteristics.18 Though the
root causes of these patterns are not well understood, local independent and non-profit health
plans frequently outperform for-profit publicly-traded national managed care plans. These
findings are important for public officials to consider as they determine whether particular
conversions are in the interest of health care consumers. In the following paragraphs, I compare
the performance of CareFirst, Wellpoint, and other health plans operating in their respective
markets on a variety of measures of health plan quality.
Measures of Health Plan Quality
In 1997, the National Committee on Quality Assurance (NCQA) began reporting the
performance of some health plans on a selected set of quality measures. This set of measures
(called HEDIS – the Health plan and Employers Data Information Set) was chosen by a group of 18 Woolhandler & Himmelstein, Landon et al.,

33
health care purchasers and medical professionals and has been expanded over the years. Health
plans voluntarily submit performance data (most is audited) to the NCQA who then publishes
these data in a product called Quality Compass. Consumers and employers have used these data
to help them make health care purchasing decisions; academic researchers have used these data
to study the causes of variation in health plan quality.
The HEDIS measures convey information about the extent to which the health plan’s
enrollees are obtaining preventive services and diagnostic tests necessary for managing certain
chronic diseases (see Exhibit 3 for a list of HEDIS measures used in the analyses presented in
this report). The HEDIS set also includes a few measures of health care outcomes for the health
plan’s enrolled population that signal, overall, how well the health plan is doing at helping its
members stay healthy.
The second set of measures used in this analysis of health plan quality is derived from a
survey instrument called the “Consumer Assessment of Health Plans Survey (CAHPS)”. The
survey is administered by an independent party to a random sample of the health plan’s enrollees
to collect data on consumers’ experiences in seeking and obtaining health care. Health plans
often submit their performance on CAHPS to organizations that publish comparative health plan
data (such as the federal government, the NCQA, and local health care purchasing groups). The
federal government has mandated the collection and reporting of these survey data for Medicare
beneficiaries enrolled in Medicare HMOs.
The CAHPS instrument generates hard to find data on the quality of enrollees
interactions with providers and health plans (see Exhibit 4 for a list of CAHPS measures used in
the analyses presented in this report). Health plans can take many actions to facilitate
consumers’ access to care, to educate and involve consumers in their own health care, to ease the
34
administrative burden of dealing with insurance claims, and to select and support a provider
network that routinely delivers high quality patient-friendly care. The CAHPS measures provide
health plans an opportunity to distinguish themselves in these areas.
HEDIS comparisons
CareFirst operates three separate health plans in the Mid-Atlantic region that reported
1999 HEDIS data to NCQA (the data are published in Quality Compass 2000): CapitalCare Inc.,
Delmarva Health Plan Inc., and FreeState Health Plan Inc. In the analyses that follow, an
average score is computed for all three CareFirst plans weighted by HMO enrollment. Wellpoint
operates the Blue Cross of California health plan (BC-CA) in California; this plan reported a
limited set of 1999 HEDIS data to NCQA. Performance on HEDIS measures may be influenced
by some factors beyond the health plan’s control such as socio-demographic characteristics of
the plan’s membership, local organization of providers, and state health initiatives. To control
for variation in some of these factors across markets, the HEDIS scores of each plan have been
adjusted for the region of the country in which the health plan operates.
Table 8 presents HEDIS data comparing the average performance of the CareFirst plans
to Wellpoint’s California plan and to the national average on three types of measures: preventive
care, chronic care, and mental health care. CareFirst performs least well on the preventive care
measures; it’s scores exceed the national average on 4 out of 10 measures and BC-CA
outperforms CareFirst on 6 out of the 7 measures for which data were submitted by BC-CA. The
second group of measures relates to care for enrollees with chronic disease. BC-CA reported
only one out of eight measures in this group and its performance on this measure falls
significantly below CareFirst’s performance. CareFirst outperforms the national average on six
out of 8 measures in the chronic care category. Finally in the third group measures relating to

35
mental health care, CareFirst outperforms BC-CA on the two measures for which Wellpoint
submitted data. CareFirst outperformed the national average on 3 out of 5 measures in this
category.
These comparisons between the CareFirst plans and the Wellpoint-CA plan suggest that
each of these plans has its strengths and weaknesses and that neither plan dominates the other on
HEDIS measures. It is noteworthy that at least one CareFirst plan reported data for every
HEDIS measure (23 measures in all), while the Wellpoint-CA plan reported data on just less than
half of the measures. The collection and public reporting of plan performance on HEDIS
measures signals a plan’s commitment to improving health care quality.
Table 9 facilitates a comparison of performance by CareFirst and Wellpoint-CA on
HEDIS measures to the Kaiser plans operating in the CareFirst and Wellpoint-CA markets. The
Kaiser Foundation is the holding company for the only truly national not-for-profit managed care
plan in the United States. Virtually all other not-for-profit managed care companies have only a
local or regional presence. The Kaiser Foundation plans in California and the mid-Atlantic
region reported a full set of 1999 HEDIS data to NCQA.
Comparing the second and third columns of the table in Table 9, one notes that Kaiser of
the Mid-Atlantic outperforms CareFirst on nearly every HEDIS measure (19 out of 23). Second,
comparing the second and third columns of the table, one notes that the Kaiser plans of
California outperform Wellpoint on nearly every measure for which Wellpoint reported data (10
out of 11). Finally, Kaiser mid-Atlantic outperforms Kaiser California on 16 out of the 23
measures. This comparison of the two Kaiser plans raises the concern that the method used for
controlling for systematic geographical variation was not completely successful. However, the

36
magnitude of the differences between the Kaiser plans and CareFirst and Wellpoint plans
suggests systematic differences even within region.
In summary, there are three major conclusions that emerge from these comparisons on
HEDIS measures. First, the CareFirst and the BC-CA plans each have strengths and weaknesses
on HEDIS measures and neither plan dominates the other; BC-CA compares favorably on
preventive care measures while the CareFirst plans compare favorably on chronic care and
mental health care measures. Second, both the BC–CA plan and the CareFirst plans are
outperformed by the Kaiser plans in their respective markets on HEDIS measures.
CAHPS comparisons
This section of the report presents comparisons of the performance of several health plans
on the set of CAHPS composite measures published in Quality Compass 2000. Examination of
Table 10 shows that the CareFirst plans outperform the BC-CA plan on 8 out of 10 CAHPS
measures (the plans are essentially equal on two measures). The largest differences between the
health plans’ performance relate to access to care – getting care quickly and getting needed care.
Table 10 also facilitates a comparison of the BC-CA and CareFirst plans to the national average.
BC-CA performs below the national average on 8 out of 10 CAHPs measures; CareFirst
performs better than the national average on 7 out of ten measures. It is also noteworthy that the
average for national publicly-traded for-profit health plans is below the average for all plans
nationally that submitted data on all ten measures.
The Kaiser mid-Atlantic plan outperforms the CareFirst plans on 2 out of the 10 CAHPs
measures; in contrast, the Kaiser California plan outperforms the BC-CA plan on 9 out of 10
measures (Table 11).

37
In summary, the analysis of CAHPs quality measures suggests that CareFirst members
have had more favorable experiences in obtaining health care services compared to the Wellpoint
plan in California. Comparisons to local Kaiser plans in each market reinforce the findings of
the head to head comparison of BC of California and the CareFirst plans.
Post-script in the CareFirst Conversion Case
The Maryland Insurance Commissioner, Stephen Larsen, initiated hearings on CareFirst’s
conversion petition prior to the insurance commissioners in the District of Columbia and
Delaware. As part of the Maryland hearings and in anticipation of formal hearings in DC, a
number of consultants were hired to value CareFirst; most of these valuations exceeded
Wellpoint’s offer of $1.3 billion. In the course of the hearings, there were also concerns raised
about the process used by the board of CareFirst to solicit bids and the board’s selection of the
Wellpoint offer. Finally, the terms of the deal appeared to personally enrich CareFirst
executives.
On March 5, 2003, Commissioner Larson denied the petition by CareFirst to convert and
to be acquired by Wellpoint. Both the District of Columbia and Delaware suspended their
conversion proceedings. In reviewing the research and evidence, Commissioner Larson found
three reasons to deny the conversion. First he found that CareFirst had been operating like a for-
profit company despite legal requirements to adhere to a non-profit, public-interest mission.
Second, he found that the CareFirst board failed to consider CareFirst’s obligations as a non-
profit entity and that the Board did not negotiate the best price for CareFirst and was offering to
sell at less than fair market value. Third, and finally, Commissioner Larson found that CareFirst
did not demonstrate a need to convert to for-profit status in order to remain viable.

38
On April 8, 2003, the Maryland legislature ratified Larsen’s decision and passed Senate
Bill 772. The bill is in essence, an attempt to restructure CareFirst as a well-functioning non-
profit health plan that will execute its mission. It calls for replacement of all Maryland-
appointed CareFirst board members, compensation paid to board members, officers and
employees to be consistent with similar non-profit organizations, establishes a Joint Nonprofit
Health Service Plan oversight Committee to oversee CareFirst operations in a manner consistent
with the interests of Maryland citizens, and prohibits the acquisition of CareFirst for 5 years. In
terms of health plan conduct, it requires that CareFirst to: 1) offer health care products in the
individual and small group markets, 2) administer and subsidize the Senior Prescription Drug
Program in Maryland, and 3) devote any remaining avoided taxes to a public interest project.
Far from closing the chapter on CareFirst’s petition to convert, the Maryland legislation
sparked controversy in the District of Columbia and action by some of the parties. The D.C.
Commissioner claimed that the Maryland legislation could render the CareFirst plan in D.C.
uncompetitive and not viable. The Blue Cross and Blue Shield Association revoked CareFirst’s
use of the BCBS brand. Finally, Wellpoint abandoned hopes of acquiring CareFirst and
announced a deal to acquire the publicly traded holding company of BCBS of Wisconsin.
4. Summary and Suggestions for Future Research
The health insurance industry has undergone substantial consolidation in recent years.
This consolidation has coincided with, and in part been caused by, the growth of for-profit,
publicly traded health insurance companies. These changes in health insurance markets have led
industry and government leaders to question the current and potential role of non-profit health
plans. Some of these leaders believe that many, if not all, non-profit health plans are already
conducting themselves like their for-profit competitors and hence question the value of giving a

39
tax exemption to these plans. However, among people holding this view, there is little
agreement about what should be done when these non-profit health plans apply to convert to for-
profit public stock companies. The lack of agreement derives from uncertainty about the
viability of non-profit health plans in a market dominated by for-profit plans and from ignorance
about governance structures that could hold non-profit health plans (or foundations) accountable
to a public interest mission.
The governance structures necessary to consistently implement a public interest mission,
and the viability of a non-profit health plan executing such a mission, form the foundation upon
which the welfare consequences of potential changes in conduct of a converting health plan
should be evaluated. The welfare consequences of conduct changes must be evaluated in
conjunction with the set of feasible alternative institutions for executing the public-interest
mission. For example, it may well be that a converting health plan would abandon unprofitable
markets and raise premiums in other markets. However, denying the petition to convert does not
ensure that unprofitable markets will be better served or that premium increases will be limited
to cost increases; furthermore, it does not ensure that the non-profit plan will survive or
otherwise be financially capable of these tasks.
Health policymakers are in need of economic research to answer a few basic questions.
First, how might unregulated market competition thwart a non-profit health plan in executing its
mission? In other words, what are the threats to viability? Second, what market interventions
might ensure viability of the mission? Only after these questions are answered can one then pose
the social value question: Is the mission worth it? To answer this question, economists and
others will have to assess the costs and benefits of alternative regulatory institutions. Finally,
creating a conducive environment for a non-profit health plan is not sufficient. Policymakers

40
need empirical and theoretical research on the types of governance structures that will guide
faithful execution of the non-profit health plan’s mission.
While research and experience have identified important gaps in our knowledge,
economic analyses have made valuable contributions to the evaluation of conversions. The case
study analysis of CareFirst confirms prior research findings that there are differences in health
plan quality related to ownership structure. To enhance the usefulness of these findings, we need
to understand the causal mechanisms underlying the correlation between quality and health plan
characteristics. We do not know for instance whether non-profit plans have higher quality on
average because they consider this part of their mission and allocate surplus to achieve this
higher quality, or because the organization of non-profit health plans differs from for-profit
health plans in ways that facilitate higher quality at the same cost. These are of course not the
only two possible explanations and further research is needed to identify and articulate the
mechanisms by which health plans influence quality.
The analyses of scale economies presented in this chapter have generated evidence of the
relationship between health plan size and average costs. In the case of CareFirst, with over 3.1
million members, there appears to be little or no cost-savings to be achieved through expanded
enrollment. This finding calls into question CareFirst’s claim that it needs greater access to
capital in order to finance future health plan acquisitions.
Finally, the market structure analyses demonstrate the importance of examining distinct
product and consumer market segments. Market share analyses for the District of Columbia
suggest that the CareFirst plan, GHMSI, possesses substantial market power in some segments.
Whether GHMSI was exercising self-restraint in pricing the policies it sold in this market was
not possible to determine from the available data. Note that health plan costs by product would

41
be necessary to assess price cost margins, and that cost data for every product would be
necessary to evaluate a health plan’s strategy to cross-subsidize.
The findings presented in this study are subject to a number of caveats and limitations.
First, because of its limited scope, there are several health policy issues not addressed by this
study. For example, this study did not address the participation by non-profit health plans in
traditionally underserved markets. In addition, lack of data prohibited a careful examination of
health plan underwriting practices and health plan – provider relationships. Second, it was
beyond the scope of the CareFirst case study to examine the extent to which CareFirst was
fulfilling its mission, the long-term viability of such a mission, and the governance structures that
would facilitate implementation of this mission.19 More generally, this case study analysis
highlights the need for research elucidating the characteristics of markets that influence the
viability of non-profit health plans and scope for welfare improving market interventions.
Finally, I began this chapter by noting that every conversion petition is unique; the analyses of
CareFirst, the mid-Atlantic markets in which it operates, and the arguments in support of against
conversion will not necessarily generalize to health plans petitioning conversion in other
markets. However, the framework exposited in this chapter is entirely general, and I hope, will
make a contribution to those charged with the challenging tasks of analyzing and evaluating the
complex public policy issues surrounding health plan conversions.
19 I was originally hired as a consultant by D.C. Appleseeds to examine the potential consequences of CareFirst converting to stock ownership and being acquired by Wellpoint. It was not until the formal conversion proceedings were well underway that it became clear to me that issues of viability and governance structures would play a central role in the decision calculus of policymakers and regulatory officials.

42
Figure 1: HMO Enrollment by Tax Status
0.00
10.00
20.00
30.00
40.00
50.00
60.00
70.00
80.00
90.00
1987 1989 1991 1993 1995 1997 1999 2001
Year
Enro
llmen
t (m
illio
ns)
Non-Profit Enr For-Profit Enr Total Enr
Figure 2: HMO Enrollment in National versus Local or Regional For-Profit Health Plans
0.00
10.00
20.00
30.00
40.00
50.00
60.00
1985 1990 1995 2000 2005
Year
Enro
llmen
t (m
illio
ns)
For-Profit Nat'l For-Profit Loc/Reg Total For-Profit Enr

43
Figure 3: Decision Calculus for Conversions
Is Plan Fulfilling Mission?
Yes
No
Is Plan Viable?
No
Yes
Is Conversion in Public Interest?
Convert
Deny
Convert
Is Restructured Plan Viable?
NoConvert
Yes Is Conversion in Public Interest?
Convert
No
Yes
Restructure
No
Yes
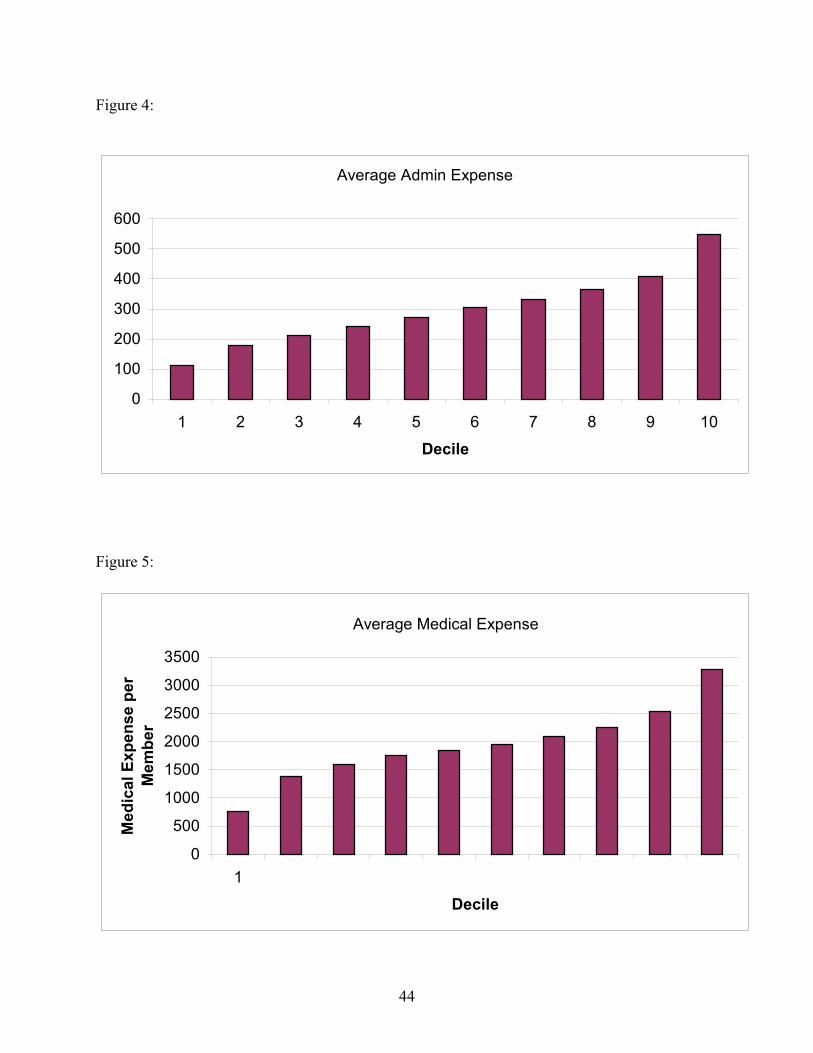
44
Figure 4:
Average Admin Expense
0
100
200
300
400
500
600
1 2 3 4 5 6 7 8 9 10
Decile
Figure 5:
Average Medical Expense
0
500
1000
1500
2000
2500
3000
3500
1
Decile
Med
ical
Exp
ense
per
M
embe
r

45
Figure 6: Frequency Distribution of Health Plan Enrollment
0
20
40
60
80
100
120
5 - 50 50-100 100-200
200-300
300-400
400-500
500-600
600-700
700-800
800-900
>1,000
Enrollment (thousands)
Num
ber o
f Hea
lth P
lans
Figure 7:
Expense Deciles for Plans in Top Enrollment Decile
0123456789
1 2 3 4 5 6 7 8 9 10
Expense Decile
Freq
uenc
y
Medical ExpensesAdmin Expenses

46
Figure 8:
Plot of Scale Economies in Admin Expenses
0
200
400
600
800
1000
0 200000 400000 600000 800000 1000000
Enrollment
Adm
in E
xpen
se p
erM
embe
r
Figure 9:
Plot of Scale Economies in Medical Expenses
0
1000
2000
3000
4000
5000
0 200000 400000 600000 800000 1000000
Enrollment
Ave
rage
Med
ical
Exp
ense
pe
r Mem
ber

47
Figure 10: Estimated Scale Economies in Administrative Expenditures
245
250
255
260
265
270
275
280
285
0 200000 400000 600000 800000 1000000
Enrollment
Adm
in E
xp p
er M
embe
r
Figure 11: Estimated Scale Economies in Medical Expenses
1700
1750
1800
1850
1900
1950
2000
2050
0 200000 400000 600000 800000 1000000
Enrollment
Med
ical
Exp
per
Mem
ber

48
Table 1: Health Plan Enrollment in the District of Columbia, 2000-2001 2001 2000 Enroll Share Enroll ShareAdvantage Healthplan 3194 0.00 3471 0.00Aetna U.S. Healthcare (a Maryland corporation) 177820 0.09 179469 0.10AMERIGROUP Maryland, Inc. 12876 0.01 12640 0.01Capital Community Health Plan 28851 0.02 25955 0.01CareFirst BlueChoice Inc. 46534 0.02 46525 0.03Cigna Healthcare Mid-Atlantic, Inc. 1655 0.00 2146 0.00DC Chartered Health Plan, Inc. 26877 0.01 27687 0.01GHMSI 924798 0.48 879338 0.47GW University Health Plan 82854 0.04 100980 0.05Health Right, Inc. 9168 0.00 4838 0.00Kaiser of the Mid-Atlantic 376877 0.20 389349 0.21MD - IPA, Inc. 171207 0.09 130064 0.07Optimum Choice 44233 0.02 25612 0.01Prudential Health Care Plan, Inc. 0 0.00 23918 0.01United Healthcare of the Mid-Atlantic, Inc. 1279 0.00 1648 0.00 TOTAL 1908223 1853640 Herfindahl 0.29 0.29

Preliminary Draft September 11, 2003
49
Table 2: Health Plan Enrollment in DC by Consumer Segment, 2001
group indiv medicare medicaidSupplemental Medicare other
FEHBPTOTAL
Advantage Healthplan 98 3096 3194Aetna U.S. Healthcare 36976 69 140775 177820AMERIGROUP Maryland, Inc. 12876 12876Capital Community Health Plan 28851 28851CareFirst BlueChoice Inc. 39708 417 6409 46534Cigna Healthcare Mid-Atlantic, Inc. 1654 1 1655DC Chartered Health Plan, Inc. 78 5 26794 26877GHMSI 422462 6804 2295 58519 434718 924798GW University Health Plan 49034 719 33101 82854Health Right, Inc. 9168 9168Kaiser of the Mid-Atlantic 218288 1388 7957 3106 146138 376877MD - IPA, Inc. 90975 80232 171207Optimum Choice 44233 44233Prudential Health Care Plan, Inc. 0United Healthcare of the Mid-Atlantic 1279 1279 TOTAL 904687 9501 7957 80785 2295 61625 841373 1908223
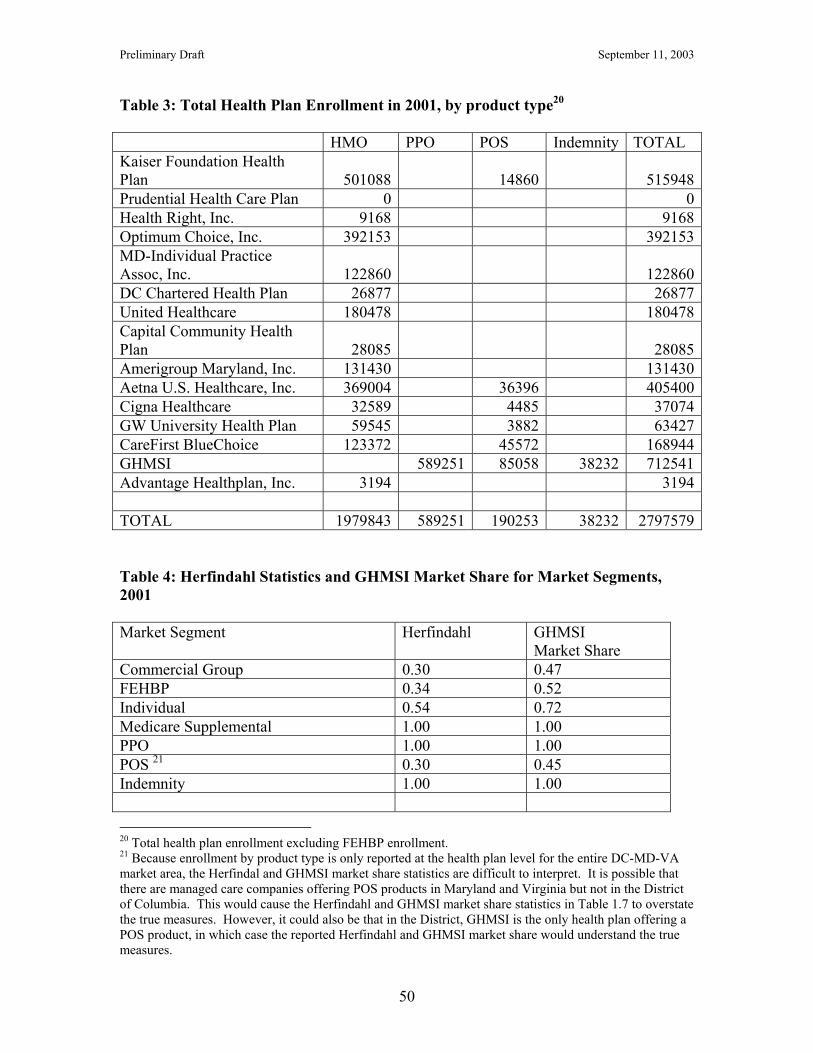
Preliminary Draft September 11, 2003
50
Table 3: Total Health Plan Enrollment in 2001, by product type20 HMO PPO POS Indemnity TOTAL Kaiser Foundation Health Plan 501088 14860 515948Prudential Health Care Plan 0 0Health Right, Inc. 9168 9168Optimum Choice, Inc. 392153 392153MD-Individual Practice Assoc, Inc. 122860 122860DC Chartered Health Plan 26877 26877United Healthcare 180478 180478Capital Community Health Plan 28085 28085Amerigroup Maryland, Inc. 131430 131430Aetna U.S. Healthcare, Inc. 369004 36396 405400Cigna Healthcare 32589 4485 37074GW University Health Plan 59545 3882 63427CareFirst BlueChoice 123372 45572 168944GHMSI 589251 85058 38232 712541Advantage Healthplan, Inc. 3194 3194 TOTAL 1979843 589251 190253 38232 2797579 Table 4: Herfindahl Statistics and GHMSI Market Share for Market Segments, 2001 Market Segment Herfindahl GHMSI
Market Share Commercial Group 0.30 0.47 FEHBP 0.34 0.52 Individual 0.54 0.72 Medicare Supplemental 1.00 1.00 PPO 1.00 1.00 POS 21 0.30 0.45 Indemnity 1.00 1.00 20 Total health plan enrollment excluding FEHBP enrollment. 21 Because enrollment by product type is only reported at the health plan level for the entire DC-MD-VA market area, the Herfindal and GHMSI market share statistics are difficult to interpret. It is possible that there are managed care companies offering POS products in Maryland and Virginia but not in the District of Columbia. This would cause the Herfindahl and GHMSI market share statistics in Table 1.7 to overstate the true measures. However, it could also be that in the District, GHMSI is the only health plan offering a POS product, in which case the reported Herfindahl and GHMSI market share would understand the true measures.

Preliminary Draft September 11, 2003
51
Table 5: 1999-2001 Changes in Enrollment by Product Type in the DC-MD-VA Region 2001 Enrollment Change: 1999-2001 TOTAL
Enrollment National
For-Profit
VA-BCBS
Independent CareFirst TOTAL
Commercial HMO 1759586 -419530
-28726 -58556 34899 -471913
PPO 645149 101435 0 -1011 355443 455867FEHBP 463346 -13142 1746 15714 -7055 -2737Public 455393 45075 27128 -3425 -125900 -57122Self 434079 -137959 0 -14897 202671 49815Open-Panel HMO 382013 -111823
-10017 -3728 -84608 -210176
Other non-HMO 275474 245378 0 26306 0 271684POS 146220 -45365 0 0 0 -45365Direct 62587 -9927 -3224 -2445 -750 -16346FFS 0 0 0 0 0 0Supplemental 0 0 0 0 0 0TOTAL Managed Care 4626062 -345887
-13093 -42759 374700 -27039

Preliminary Draft September 11, 2003
52
Table 6: Enrollment Changes Nationwide, 1999-2001 2001 Enrollment Change: 1999-2001
(000) TOTAL
Enrollment(000)
NationalManaged
Care
Not-For ProfitBCBS
For ProfitBCBS
Independent TOTAL
Commercial Group HMO 46722 -4429 73 1384 -1172 -4144PPO 36324 4376 817 6917 2289 14399FEHBP 2362 -114 128 20 63 97Public Programs 17746 -581 1295 -1002 1174 886Self-Insured 6759 -98 749 697 -280 1068Open-ended HMO 8563 -164 14 257 -381 -273Other non-HMO 6879 3108 575 115 427 4225POS 6637 -895 -423 -1640 111 -2848Direct Pay 1562 -256 114 -213 -121 -475Managed FFS 2334 -79 -107 900 309 1023Supplemental Medicare 1040 -21 305 445 73 803TOTAL Managed Care 137998 858 3631 7917 2619 15025

Preliminary Draft September 11, 2003
53
Table 7: Scale Economies - Regression Results Independent Variable (2)
Dep Var Log (Admin Exp per
Mem)
(3) Dep Var
Log (Med Exp per Mem)
% Enroll Share – Medicare Risk 1.54(0.22)
1.18(0.26)
% Enroll share –Medicaid Risk -0.28(0.16)
-0.27(0.18)
% Enroll share – Direct Pay 0.07(0.41)
-0.83(0.28)
% Enroll Share - FEHBP -0.25(0.45)
0.14(0.34)
% Enroll Share – Commercial HMO -0.16(0.14)
-0.30(0.20)
% Enroll Share – POS 0.74(0.21)
0.44(0.22)
% Enroll Share – PPO 0.04(0.14)
-0.56(0.29)
% Enroll Share – Supplemental Medicare
2.36(1.75)
0.85(0.97)
% Enroll share – FFS 0.65(0.55)
-0.29(0.41)
% Provider Payment - Capitation -0.12(0.14)
-0.12(0.12)
% Provider Payment – Fee For Service
0.05(0.09)
-0.03(0.13)
Provider Payment Imputation -0.31(0.19)
0.28(0.24)
Product Herfindahl 0.12(0.18)
0.31(0.20)
Age of Plan 0.00(0.00)
0.00(0.00)
Physicians per 1000 Enrollees 475.34(152.54)
-796.89(208.74)
Log of Enrollment -0.05(0.03)
-0.64(0.03)
Log of National Managed Care Enrollment
-0.00(0.01)
0.00(0.00)
Log of Regional Managed Care Enrollment
0.00(0.01)
-0.01(0.01)
For-Profit HMO 0.16(0.08)
-0.01(0.06)
% of enrollment in IPA or Mixed Model
0.14(0.06)
0.13(0.06)

Preliminary Draft September 11, 2003
54
Number of Products 0.00(0.02)
0.07(0.02)
Number of States 0.13(0.11)
0.15(0.14)
Constant 5.82(0.29)
7.85(0.29)
State Dummy Variables Included IncludedNumber of Observations 299 299R-Squared 0.50 0.54 *** P < 0.01 ** P < 0.05 * P < 0.10

Preliminary Draft September 11, 2003
55
Table 8: Comparison of CareFirst & Wellpoint Plans on HEDIS Measures HEDIS Measures Carefirs
tBC of
CA National National
Public FP National Std. Dev.
Preventive Care Child immunization 1 77.6 68.4 65.9 65.7 13.0Child immunization 2 65.6 48.7 47.6 11.7Adol immunization 1 24.7 27.4 33.2 28.7 17.7Adol immunization 2 16.7 15.6 12.4 11.9Advice to quit smoking 70.1 60.8 64.7 62.3 6.9Breast cancer screening 70.6 75.9 74.9 72.6 5.9Cervical cancer screening 68.4 70.1 73.7 71.8 7.7Prenatal care 85.1 87.3 86.4 86.8 11.1Check-up after delivery 69.3 79.1 74.6 73.7 11.8Beta blockers 85.5 86.9 86.5 87.2 9.7Chronic Care Cholesterol rate 18.8 47.8 45.1 15.0Cholesterol screening 70.7 70.2 67.8 11.1HbA1c test 79.1 77.3 76.3 8.9Diabetic eye exam 58.8 39.5 48.5 44.7 14.3Lipid profile 68.0 70.4 69.7 9.9Lipid control 44.8 38.6 35.8 9.6Nephropathy monitoring 38.1 37.3 35.7 14.4HbA1c control 79.7 58.0 55.3 14.3Mental Health Mental Illness – 7 days 60.6 45.0 49.2 49.6 14.7Mental Illness – 30 days 72.0 50.5 72.3 70.9 13.7Depression contact 8.7 21.3 19.9 10.3Depression acute 68.9 60.3 61.3 9.5Depression continuous 45.2 43.6 43.2 10.4

Preliminary Draft September 11, 2003
56
Table 9: Comparison of BCBS Plans to Kaiser Plans on HEDIS Measures
Carefirst KaiserMid-Atlantic
BC of CA KaiserCalifornia
Preventive Care Child immunization 1 77.6 88.6 68.4 76.2Child immunization 2 65.6 76.5 69.5Adol immunization 1 24.7 48.4 27.4 34.5Adol immunization 2 16.7 50.2 16.6Advice to quit smoking 70.1 67.6 60.8 68.0Breast cancer screening 70.6 79.4 75.9 75.8Cervical cancer screening 68.4 88.6 70.1 77.4Prenatal care 85.1 86.9 87.3 89.5Check-up after delivery 69.3 80.1 79.1 83.2Beta blockers 85.5 98.3 86.9 89.7Chronic Care Cholesterol rate 18.8 67.5 45.2Cholesterol screening 70.7 75.3 78.4HbA1c test 79.1 85.9 77.5Diabetic eye exam 58.8 87.7 39.5 64.0Lipid profile 68.0 69.2 70.5Lipid control 44.8 41.9 41.2Nephropathy monitoring 38.1 74.8 55.2HbA1c control 79.7 71.1 55.1Mental Health Care Mental Illness – 7 days 60.6 65.5 45.0 62.6Mental Illness – 30 days 72.0 79.2 50.5 83.3Depression contact 8.7 34.6 28.4Depression acute 68.9 63.8 68.6Depression continuous 45.2 46.1 58.2

Preliminary Draft September 11, 2003
57
Table 10: Comparison of CareFirst and Wellpoint Plans on CAHPS Measures
Carefirst BC of CA
National National Public FP
National Std. Dev.
Claims Processing 83.0 81.1 79.1 76.4 9.2Courteous Staff 90.7 88.8 91.6 90.7 2.7Customer Service 66.0 64.9 65.8 63.0 6.3Getting Care Quickly 78.1 67.6 79.2 77.8 5.4Getting Needed Care 77.2 70.6 75.4 72.7 6.8Communication with doctor 91.2 86.2
89.8 88.9 2.9
Overall Health Care Rating 68.5 68.4
71.1 68.8 6.1
Overall Health Plan Rating 59.2 56.0
58.0 53.5 8.4
Overall PCP Rating 74.0 74.2 73.5 73.2 4.4Overall Specialist Ratingt 75.5 67.4 75.3 74.6 4.8 Table 11: Comparison of CareFirst and Wellpoint Plans to Kaiser Plans on CAHPS Measures
Carefirst KaiserMid-Atlantic
BC of CA KaiserCalifornia
Claims Processing 83.0 66.0 81.1 79.1Courteous Staff 90.7 90.5 88.8 90.3Customer Service 66.0 77.4 64.9 73.0Getting Care Quickly 78.1 80.0 67.6 76.0Getting Needed Care 77.2 76.2 70.6 78.8Communication with doctor 91.2 82.2 86.2 87.0Overall Health Care Rating 68.5 65.2 68.4 70.3Overall Health Plan Rating 59.2 57.3 56.0 64.5Overall PCP Rating 74.0 72.4 74.2 75.0Overall Specialist Rating 75.5 71.3 67.4 75.3

Preliminary Draft September 11, 2003
58
Exhibit 1: Descriptions of Health Insurance Products as Defined by InterStudy Health Insurance Product Description Direct Pay Enrollment Enrollees are individuals who are not members of a contracting
group (i.e. they are enrolled under an individual coverage option).
FEHBP Enrollees are federal employees and participate in the Federal Employees Health Benefits Program
Commercial Group Includes individuals enrolled through employer-sponsored group HMO policies, as well as conversion members (persons who are no longer members of an employer group, but under COBRA regulations, are still eligible for HMO services at a group rate)
Public programs Recipients of Medicaid and Medicare who are enrolled in an HMO
Point of Service (POS) Enrollees have access to and financial incentives to use a managed care provider network, often the HMO’s provider panel, but in contrast to the open-panel HMO, POS enrollees are not prepaid enrollees of the HMO (they pay indemnity premiums)
Open-Ended HMO Enrollees are prepaid members of the HMO and may receive non-emergency services from providers outside the HMO’s network. There is usually a substantial deductible, co-payment or need for coinsurance for use of non-panel providers
Preferred Provider Organization (PPO)
A fee-for-service product where beneficiaries receive care from a selected panel of providers. Providers agree to a discounted fee schedule when contracting with the PPO. PPOs offer a wide variety of benefit plans, some including the option to use non-panel providers if beneficiaries pay out-of-pocket costs.
Managed Fee For Service (FFS)
The insurer pays the cost of covered services after services have been received and according to an agreed upon fee schedule. Various managed care tools such as pre-certification, second surgical opinion, and utilization review are used
Self-Insured The HMO providers deliver health services to an individual, but rather than being prepaid enrollees, or premium paying beneficiaries, services received are paid for directly by the enrollee’s employer.
Supplemental Medicare A Medicare wrap-around plan that covers some co-payments, deductibles, and services not covered under traditional Medicare. Beneficiaries are given financial incentives to use HMO providers but are not restricted to the HMO’s panel
Other Non-HMO Plans This category primarily includes enrollees in flexcare plans, self-insured Medicare plans, managed indemnity, indemnity, exclusive provider organizations (EPOs), and out-of-area plans

Preliminary Draft September 11, 2003
59
Exhibit 2: InterStudy Health Plans by Ownership Type in the DC-MD-VA Market, 2001 National For-Profit Plans
Virginia Blue Cross Blue Shield
Independent Plans CareFirst Plans
United Healthcare of Mid-Atlantic
Healthkeepers Kaiser of the Mid-Atlantic
FreeState HealthPlan
Aetna U.S. Healthcare (MD)
Peninsula Health Care
GW University Health Plan
Delmarva Health Plan
Prudential/Aetna (VA) Priority Health Care
M.D. - IPA CareFirst BlueChoice
CIGNA Healthcare of VA
OPTIMA Health Plan
PHN-HMO
Southern Health Services
QualChoice of Virginia
CIGNA Healthcare of Mid-Atlantic
Optimum Choice
Prudential/Aetna (MD) Carilion Health Plans United Healthcare of VA
D.C. Chartered Health Plans
AMERIGROUP (MD) Piedmont Community HealthCare
Advantage Healthplan
Capital Community Health Plan

Preliminary Draft September 11, 2003
60
Exhibit 3: National For-Profit Plans in the InterStudy Database Plan Name # plans
2001HMO
Enrollment1999
HMO Enrollment
2001 CIGNA 31 6920006 6562433 Maxicare* 2 517271 339455 Prudential** 0 5245116 - United 44 8496515 14888720 Aetna 57 6545789 8673581 Humana 9 2966927 2189000 Mutual of Omaha 2 230866 698522 Coventry 16 1435538 2313007 Amerihealth 4 377927 314006 Amerigroup 4 113814 418604 Foundation Health Plans 8 4187941 4572801 Pacificare 8 3942926 3591033 Great Western 15 1003952 1210757 * Maxicare terminated two health plans between 1999 and 2000 **Prudential Health was bought by Aetna Health Plans

Preliminary Draft September 11, 2003
61
Exhibit 4: Definitions of HEDIS Quality Measures Adolescent Immunization Rates
Estimates the percentage of adolescent health plan members that have been verified to have received all required doses of several vaccines by their 13th birthday.
Advising Smokers to Quit Rates
Measures the percentage of eligible health plan members who were advised to quit smoking during a visit with a physician during the measurement year.
Use of Appropriate Medications for People with Asthma
Evaluates whether health plan members who are suffering from persistent asthma are being prescribed medications deemed acceptable by the National Heart, Lung and Blood institute as primary therapy for long term control of asthma
Beta Blocker Treatment After a Heart Attack
Estimates the percentage of members’ age 35 and older hospitalized and discharged from the hospital after surviving a heart attack (defined as an acute myocardial infarction or AMI), who received a prescription for a beta blocker.
Breast Cancer Screening Rates
Estimates the percentage of women aged 52 through 69 years enrolled in a health plan who had a mammogram during the measurement year or the year prior to the measurement year.
Cervical Cancer Screening Rates
Estimates the percentage of women age 21 – 64 who were enrolled in a health plan and who had on Papanicolau (Pap) test during measurement year or the two years prior.
Childhood Immunization Rates
Estimates the percentage of children who were enrolled in managed care plans and turned two years old during the measurement year, who had received vaccinations: (1) four dosed of DTP or DtaP (diptheria-tetanus; (2) three doses of OPV or IPV (polio); (3) one dose of MMR (measles-mumps-rubella); (4) two doses of Hib (Haemophilus influenza), (5) three doses of Hepatitis B, (6) one dose of VZV (chicken pox).
Chlamydia Screening Rates
Estimates the percentage of sexually active female plan member who had ate least one test for chlamydia during the measurement year. The measure is collected separately for women aged 16 – 20 and 21 – 26.
Comprehensive Diabetes Care
Measure set includes several important features of effective, multphasic management of diabetes and it’s complications. The measure estimated the percentage of health plan member with Type 1 and Type 2 diabetes who were 18 – 75 years old and, during the measurement year: (1) had a Hemoglobin A1c (HbA1c) test; (2) had poorly controlled HbA1c (level greater that 9.5%); (3) had a serum cholesterol level (LDL-C) screening; (4) had their cholesterol level (LDL-C) controlled to less than 130 mg/dl; (5) had an eye exam; and (6) had a screening for kidney disease.
Follow-up After Mental Illness, 7-Day and 30-Day Rates
Indicates the percentage of health plan members age six and older who received inpatient treatment for a mental health disorder and had an ambulatory or day/night follow-up visit

Preliminary Draft September 11, 2003
62
after being discharged. Prenatal and Postpartum Care Rates
Measures timeliness of prenatal care and postpartum care.

Preliminary Draft September 11, 2003
63
Exhibit 4: Definitions of CAHPs Quality Measures Getting Care Quickly Measures timeliness of services received form health care
providers in the last 12 months. Claims Processing Measures managed care enrollees’ experiences with sending in
claims to their health plans in the last 12 months. Customer Service Measures how much of a problem it was for enrollees in
managed care plans to get information and to fill out paperwork in the last 12 months.
How Well Doctors Communicate
Measures the experiences consumers had while seeing a doctor or health care provider in the last 12 months.
Getting Needed Care Is a “composite” measure, made up of several questions related to consumers’ experiences in attempting to get care from doctors and specialists.
Courtesy of Office Staff
Measures managed care enrollees’ perception of quality of customer service when interacting with staff in their doctors’ offices and clinics in the last 12 months.
Overall Rating of Doctor
Respondents were asked to rate their personal doctor or nurse with ‘0’ equaling “worst personal doctor or nurse possible” and ‘10’ equaling “best personal doctor or nurse possible.
Overall Rating of Specialist
Respondents who had seen a specialist physician in the last 12months were asked to rate their specialist with ‘0’ equaling “worst specialist possible” and ‘10’ equaling “best specialist possible.
Overall Rating of Health Plan
Respondents were asked to rate their health plan with ‘0’ equaling “worst health plan possible” and ‘10’ equaling “best health plan possible.
Overall Rating of Health Care
Respondents were asked to rate the quality of the health care they received in the last 12 months, with ‘0’ equaling “worst health care possible” and ‘10’ equaling “best health care possible.
Recommended