Network Rail Monitor
Quarters 3-4 of Year 1 of CP5
12 October 2014 to 31 March 2015
12 June 2015
Contents
Office of Rail and Road June 2015 Network Rail Monitor Q3-4 2
Executive summary 3
Safety 3
Performance and punctuality 3
Train cancellations 3
Asset management 3
Enhancements 4
Expenditure and finance 4
Data quality 4
Overview 5
Health and safety 5
Train service performance 5
Asset management 6
Developing the network 7
Overrunning engineering works 7
Expenditure and finance 7
Business plan review 7
Information and data quality 8
Health and safety 9
Track quality 9
Electrification 10
SPADs 10
Level crossings 11
Infrastructure worker safety 11
Occupational health 12
Train service performance 14
National level performance 14
Performance at TOC level 16
Delay minutes 19
Freight performance 19
Customer service 21
Passenger satisfaction 21
Customer service maturity 21
Asset management 23
Maintenance and renewals volumes 23
Asset management excellence 26
Asset data quality 27
ORBIS milestones 27
Track 27
Civils 28
Developing the network 29
Expenditure and finance 31
Overall financial performance 31
Network Rail‟s borrowing 32
Network Rail‟s financial performance 32
Office of Rail and Road June 2015 Network Rail Monitor Q3-4 3
Executive summary
This is the second Network Rail Monitor of Control Period 5 (CP5) which runs from 1 April 2014 to 31 March 2019. It provides ORR‟s
assessment of Network Rail‟s performance over the second half of 2014-15, year one of CP5. Where appropriate it also provides an
overview of the company‟s performance over the whole year.
Safety
Network Rail has made good progress in reducing
safety risk at level crossings. However, in other areas
such as track worker safety there is significant scope for
improvement. Network Rail needs to maintain a focus on
wider risks including those arising from the failure to deliver
effective occupational health management on the ground.
Performance and punctuality
Network Rail entered CP5 at a lower performance
point than anticipated and it put in place a plan to
return performance to targeted levels by 1 April 2016. Although
it is largely delivering on the plan‟s milestones, these are not
improving train performance as much as predicted.
Train cancellations
East Coast Mainline performance has been
strong – the three long distance operators on this
route all exceeded their cancellation and severe
lateness (CaSL) targets. However, performance for many
operators on other routes is behind plan.
Asset management
Network Rail has reported delivering less renewals
work than it planned to do. We are reviewing the
company‟s plans for the remainder of the control
period to understand whether this under-delivery will be
recovered and whether there is any impact on the safety and
sustainability of the network.
Office of Rail and Road June 2015 Network Rail Monitor Q3-4 4
Enhancements
Network Rail is responsible for delivering over £12bn
of infrastructure enhancement expenditure over the
five years of CP5. Following a relatively successful
CP4, the company‟s performance on delivery of its
enhancement portfolio has worsened. At the end 2014-15
Network Rail had missed 30 out of its 84 planned milestones in
its Enhancements Delivery Plan.
Expenditure and finance
Network Rail overspent its budget by around £230m
and ORR expects the company to underperform the
regulatory financial performance measure by around
£430m in 2014-15. Operating, maintenance and renewals
(OMR) efficiency has reduced by 2.2% and the company is
now forecasting a cumulative efficiency gain of around 16% by
the end of CP5 compared to the 22% forecast alongside the
CP5 Delivery Plan.
Data quality
Our evidence shows that the quality of data that
Network Rail relies upon to plan and manage works
on Britain‟s railways is not acceptable in some areas.
ORR has written to Network Rail requiring a proposal from the
company to address this.
Office of Rail and Road June 2015 Network Rail Monitor Q3-4 5
Overview
Health and safety
While still in the early stages of implementation, Network Rail‟s
Business Critical Rules (BCR) programme demonstrates a
more innovative approach to risk control supported by better
analysis and understanding of the effectiveness of different risk
control measures. Although it is not in Network Rail‟s budget
and is therefore contributing to the forecast overspend, the
Tidy Railway programme is another positive development that
will support further safety improvements. We have also seen
evidence of further improvement in the management of risk at
level crossings, including the closure of 118 higher risk
crossings during the year.
We have not yet seen evidence that the Transforming Safety
and Wellbeing strategy is being delivered consistently. During
the year we served 12 improvement notices and two
prohibition notices. These notices covered a range of issues
including drainage, track quality, and vegetation management
as well as occupational health. We have seen positive
developments in the management of occupational health risks.
However, sustained effort will be needed over the coming
years to maintain this trajectory and deliver the sustained
improvements to which Network Rail and the industry have
committed.
We also need more robust assurance that the renewals
programme is delivering a safe and sustainable railway.
Our Railway Management Maturity Model (RM3) analysis
suggests that Network Rail still has some way to go in building
safety management maturity.
Train service performance
Passenger
Work by Transport Focus shows that punctuality remains the
single most important driver of passenger satisfaction,
underlining the need for a continuing focus on performance
delivery. As we reported in the Quarter 1-2 Monitor for 2014-
15, Network Rail‟s worse than expected performance in Control
Period 4 (CP4) meant that it entered Control Period 5 (CP5) at
a lower performance point than anticipated. As a result, the
company put forward a plan, which we agreed (the CP5
Performance Plan) to return performance to targeted levels by
1 April 2016. We agreed that we would monitor delivery against
this plan during those first two years.
Office of Rail and Road June 2015 Network Rail Monitor Q3-4 6
Over the last decade there has been a significant improvement
in performance, although there are still some areas where it is
unsatisfactory (set out below). Most recent data shows that the
overall punctuality and reliability of the railway for passenger
services has been stable over the last four months, compared
with an overall downward trend since the latter part of 2011-12.
Operators using the East Coast Mainline have seen
performance for the last few periods of 2014-15 well above
previous levels.
However, Network Rail has fallen short of the performance
trajectory to which it committed in its plan. At the end of 2014-
15, PPM in England and Wales was 1.4 percentage points (pp)
below the CP5 Performance Plan target whilst CaSL was 0.5pp
above (i.e. worse than) target. Although it is largely delivering
on the activity milestones in the plan, these actions are not
having the effect on performance the company anticipated.
We are investigating whether Network Rail has done
everything reasonably practicable to achieve the levels of
performance to which it committed and for which it was funded.
Freight
Performance for the freight sector was relatively strong. The
Freight Delivery Metric (FDM) MAA at the end of 2014-15
stood at 94.5%, 2.0 pp above the annual target of 92.5%.
Asset management
Network Rail‟s Composite Reliability Index (CRI) which
measures the improvement in asset reliability weighted by
asset type and the potential impact of failure, shows an
improving trend in the number of incidents caused by asset
failure. The company has achieved all the 2014-15 milestones
for the Offering Rail Better Information Services (ORBIS)
programme which will deliver significant improvements in the
way asset information is collected, stored and utilised.
The number of unplanned temporary speed restrictions has
halved since a high at the end of 2013-14.
Network Rail has under-delivered against the volumes of
renewals work to which it committed in the CP5 Delivery Plan.
The position for maintenance volumes remains mixed. We are
reviewing the company‟s plans for the remainder of the control
period to understand whether this under-delivery will be
recovered and whether there is any impact on the sustainability
of the network.
Office of Rail and Road June 2015 Network Rail Monitor Q3-4 7
Developing the network
Network Rail has delivered a number of significant
infrastructure enhancements in the first year of CP5, all of
which are providing or will provide tangible benefits to its
customers and passengers. For example, upgrades to
Reading station and capacity improvements on the East Coast
Main line and the Barry to Cardiff Queen Street corridor.
However, nationally 39% of project completion outputs and
34% of project development regulated outputs were missed in
2014-15. We have initiated an enhancements capability
investigation and want to see the implementation of planned
measures to deliver improvements in this area.
Overrunning engineering works
On 27 and 28 of December 2014, passengers travelling into or
out of King‟s Cross and Paddington stations were severely
disrupted as a result of overrunning engineering works. In
February, following an intensive investigation, the ORR Board
concluded that Network Rail had breached its licence in that it
had not done everything reasonably practicable in planning
these engineering works and in the development and
implementation of operational contingency plans. We need to
see in place clear contingency plans which help passengers if
engineering works do overrun.
We are continuing to hold the company to account through its
existing licence obligations for the way in which it works with
train operators and prepares for key holiday periods such as
Easter, Bank Holidays and Christmas. Network Rail needs to
continue undertaking large-scale engineering projects in order
to renew and enhance Britain's railways. The company has
commissioned a cross-industry review of the programming of
major engineering works and whether it is appropriate to do
these during holiday periods.
Engineering work carried out over Easter was completed with
no significant delays.
Expenditure and finance
Based on provisional information we have received, Network
Rail‟s operating, maintenance and renewals (OMR) efficiency
was around -2.2% in 2014-15 and the company is now
forecasting a cumulative efficiency gain of around 16% by the
end of CP5 compared to the 22% forecast alongside the CP5
Delivery Plan. Network Rail overspent its budget for 2014-15
by around £230m and ORR expects the company to
underperform the regulatory financial performance measure by
around £430m. This means that it has spent more than was
thought necessary to achieve what it did in 2014-15.
Business plan review
Network Rail is updating its CP5 business plans to reflect its
latest views on when outputs will be delivered and revised cost
information. This process has taken longer than expected and
we are currently reviewing the draft plans.
Office of Rail and Road June 2015 Network Rail Monitor Q3-4 8
Information and data quality
The quality of Network Rail‟s data is critical to understanding
and addressing underlying problems on the network. We have
previously expressed concerns about data quality and in our
2013 Periodic Review we required the company to give us
access to more of its data so we could monitor it more closely.
We have now seen evidence of unsatisfactory data quality in
some areas including asset condition, volumes data and
financial reporting. Network Rail‟s Audit Committee is
reviewing data quality across all these areas. We have seen
evidence of progress towards improving financial reporting but
we now expect to see improvement in data quality and
management information across all areas of the business.
This issue needs to be addressed urgently.
Office of Rail and Road June 2015 Network Rail Monitor Q3-4 9
Health and safety
Track quality
During the second half of 2014-15 we served one national
improvement notice on Network Rail concerning its
management of derailment risk at switches. We continue to
monitor the company‟s progress in complying with the June
2014 improvement notice which we served as a result of our
investigation into the derailment at Gloucester in October 2013.
This notice focussed on adequacy of track staff resource at all
levels in the Bristol delivery unit, and whilst Network Rail has
made good progress, we have granted an extension of time to
26 June 2015 to allow the company to develop a robust
solution to address issues relating to section manager
workload.
Drainage is an important enabler for sustaining and improving
track geometry. In February 2015, we served a national
improvement notice on Network Rail regarding its management
of drainage assets critical to earthwork stability. In response to
our notice the company has increased its focus on the
management of track geometry, and we are seeing
improvements in key measures, for example a reduction in the
number of twist faults. However, we have not yet seen the
same reductions in repeat faults, with some routes that had
previously halted the increase now seeing that increasing trend
returning. This perhaps reflects the greater challenge in
securing longer lasting repairs for this type of fault. It is
currently unclear if Network Rail‟s recovery plans will deliver
sustainable improvements and it has re-launched route-level
fault reduction targets. We will continue to monitor this area.
We continue with our programme of proactive route-based
inspections, focusing on Network Rail‟s management of risk at
switches and crossings (S&C) and track geometry. The latter
continues into 2015-16 focusing on the effectiveness of
Network Rail‟s arrangements for managing risk arising from
track quality.
At this stage, we are satisfied that safety risk arising from poor
track geometry is being controlled. But this is being done in a
largely reactive way that sometimes does not address the
underlying causes of faults and misses opportunities to
address identified weaknesses. This increases the reliance on
routine inspection and reactive maintenance.
Office of Rail and Road June 2015 Network Rail Monitor Q3-4 10
Interaction of train and track
In recent years there have been several freight container
wagon derailments1. There were a number of common factors
relating to track condition: in particular track twist; vehicle
characteristics; and asymmetric loading of containers. The
consequences of these incidents have so far been limited to
infrastructure and vehicle damage and fortunately no injuries or
fatalities have been sustained. The risk here is shared by a
number of industry parties and whilst the industry as a whole is
undertaking some work, there does not appear to be a co-
ordinated approach focussed on addressing the system risk. In
March 2015 we wrote to the industry setting out our concerns,
and led an industry seminar to agree the next steps the
industry needs to take to better understand the risks and the
arrangements necessary to control them. We continue to
monitor progress in this area.
Electrification
We need assurance that Network Rail can deliver a safe
infrastructure at the end of enhancements projects and that it
can take fast and safe engineering possessions once a project
goes live. We have seen some early evidence of Network
Rail‟s responsiveness to our “safety by design” challenge: the
1 Washwood Heath (2006), Duddeston Junction (2007), Marks Tey (2008),
Wigan NW (2009), Reading West (2012), Camden (2013), Gloucester
(2013)
company has produced a draft set of electrical safety principles
which can be used to establish a consistent approach across
new electrification projects. Progress has been good but
significant scope remains for increasing efficiency in those
areas.
On the third rail network, solutions for faster and safer isolation
work are continuing. Trial sites for Negative Short Circuiting
Devices are in place although safety validation of this solution
is not yet complete. If successful this will deliver a step change
not only in safety but also in productivity. However, other
options for improving isolation utility and security are being
considered to increase momentum.
Network Rail has recognised that there needs to be a step
change in the way that it meets its statutory obligations, for
example under the Electricity at Work Regulations 1989 and
this area continues to present a significant challenge for the
company.
SPADs
Following a long period of gradual improvement, Signal
Passed at Danger (SPAD) numbers increased in 2013-14 and
remained at a high level in 2014-15. During the year SPADs
have been fairly evenly distributed around the network,
suggesting that increasing traffic volumes may be a factor.
Office of Rail and Road June 2015 Network Rail Monitor Q3-4 11
ORR has continued to encourage train operators and
infrastructure providers to review their SPAD risk profiles. Our
inspectors look at operators‟ driver training and management
processes closely. We are encouraging operators to integrate
non-technical skills training and assessment into their
competence management systems.
Some operators now have plans in place to upgrade Train
Protection and Warning System (TPWS). This is important as
European Rail Traffic Management System (ERTMS) fitment is
likely to be some way off for some routes.
Wootton Bassett
There was a high risk SPAD at Wootton Bassett involving a
charter train operated by West Coast Railway Company
(WCRC). Network Rail took prompt action suspending WCRC‟s
access rights for a period and ORR undertook formal
consultation on the possible revocation of the Safety
Certificate. We have decided not to revoke and are seeking
resubmission of the Safety Certificate application from the
company. Our formal investigation into the incident is ongoing.
Level crossings
In our CP5 Final Determination, Network Rail was provided
with £99m of ring-fenced funding with the aim of reducing risk
at level crossings by 25%. Network Rail has identified over
250 crossings for closure which will result in a 21% overall
level crossing risk reduction. The total closed by the end of the
year was 118. The company is now developing a plan to
enable it to achieve the remaining 4% risk reduction. The plan
includes commissioning new technologies at user worked and
footpath crossings.
Network Rail is also developing a level crossing strategy which
will describe its management of risk at passive crossings for
CP5 and beyond.
It is evident from our engagement with level crossing
managers that they have an improving understanding of
crossing risks. The introduction of the narrative risk
assessment process will further enhance this understanding.
Infrastructure worker safety
Worker safety remains a key priority for both Network Rail and
ORR and there has been no noticeable improvement during
the year. The company is seeking to address this through a
number of initiatives, including:
national roll-out of the Planning and Delivery of Safe
Work (the new Control of Work permit procedure and
roll-out of the new Safe Work Leader role);
improved management of track patrolling including
specific briefings to improve coordination and
communication between different roles;
increased working under line blockage with additional
protection; and
the development of technology to enhance track
worker protection and provide higher integrity warning
Office of Rail and Road June 2015 Network Rail Monitor Q3-4 12
systems covering the movement of trains on the
mainline.
Progress has been made in these areas but we need to see
better coordination and faster and more effective
implementation.
We have found some examples of poor understanding and
management of basic health and safety risks by Network Rail
and its contractors, particularly in construction-related sites.
Specific concerns have included failure to control risks from;
excavations, working at height, working with or near electricity,
vehicle operation, heavy plant/machinery, and substances
hazardous to health. We have taken action on these cases
(including investigation and enforcement) as required.
Occupational health
Although Network Rail‟s health risk management maturity is
not well developed, we have seen some significant signs of
improvement, notably in the strategic approach being taken to
managing risks from hand arm vibration. We also recognise the
leadership, hard work and commitment to better occupational
health at senior levels, and welcome the recruitment of the
Occupational Health and Wellbeing Managers to most of the
routes. We see the potential for work on developing strategies
to be translated into action and progress on the frontline as a
next step, particularly on hand arm vibration, but also on
asbestos management, and silica in ballast dust. However,
sustained effort will be needed over the coming years to
maintain the initial impetus and deliver the vision in the
Industry Roadmap and Network Rail‟s Health and Wellbeing
Strategy, as well as achieving legal compliance consistently.
We have seen evidence that central initiatives are being
delivered very well. But there is a considerable gap between
what is delivered centrally and the management of health risk
in the routes and depots. Overall awareness of worker health
has improved and we have seen some good examples of
workforce involvement in programme development.
There are particular concerns surrounding Network Rail‟s
strategic management of manual handling. In 2013-14 we
served a prohibition notice concerning handling of concrete
troughing. However this was not dealt with effectively and we
have had to serve further prohibition notices in the last quarter
of 2014-15.
Key weaknesses found during 2014-15 were:
risk assessment was not used effectively to identify
risks and the control measures required;
failure to follow „hierarchy of control‟ principles in
managing health risks (with missed opportunities to
design or engineer out risk), and too much reliance on
personal protective equipment (with evidence of failure
to ensure it was worn even when it was the only
control measure);
lack of competence among front line managers for
health risk control at site level;
Office of Rail and Road June 2015 Network Rail Monitor Q3-4 13
lack of supervision by front line managers of health
risk control at site level, and insufficient attention by
managers to assurance on health; and
examples of contracts which did not adequately hold
contractors to account on health risk management.
Office of Rail and Road June 2015 Network Rail Monitor Q3-4 14
Train service performance
National level performance
Approach in years one and two
Network Rail entered 2014-15 at much lower levels of
performance than anticipated in our CP5 Final Determination and
at that stage did not expect to meet a number of its regulated
performance outputs during the first two years of the control
period. We agreed with the company that we would take an
input-based approach to monitoring PPM and CaSL in England
and Wales during the first two years of CP5. We have monitored
the delivery of its CP5 Performance Plan which details the
activities it will deliver with the aim of ensuring that performance
returns to the regulated target levels by 31 March 2016.
In addition, we are monitoring Network Rail‟s delivery of
regulated performance outputs (PPM and CaSL) at TOC level as
specified in the Performance Strategies Network Rail has agreed
with each operator.
National freight performance, measured by the Freight Delivery
Metric (FDM), remains an annual regulated target throughout
CP5.
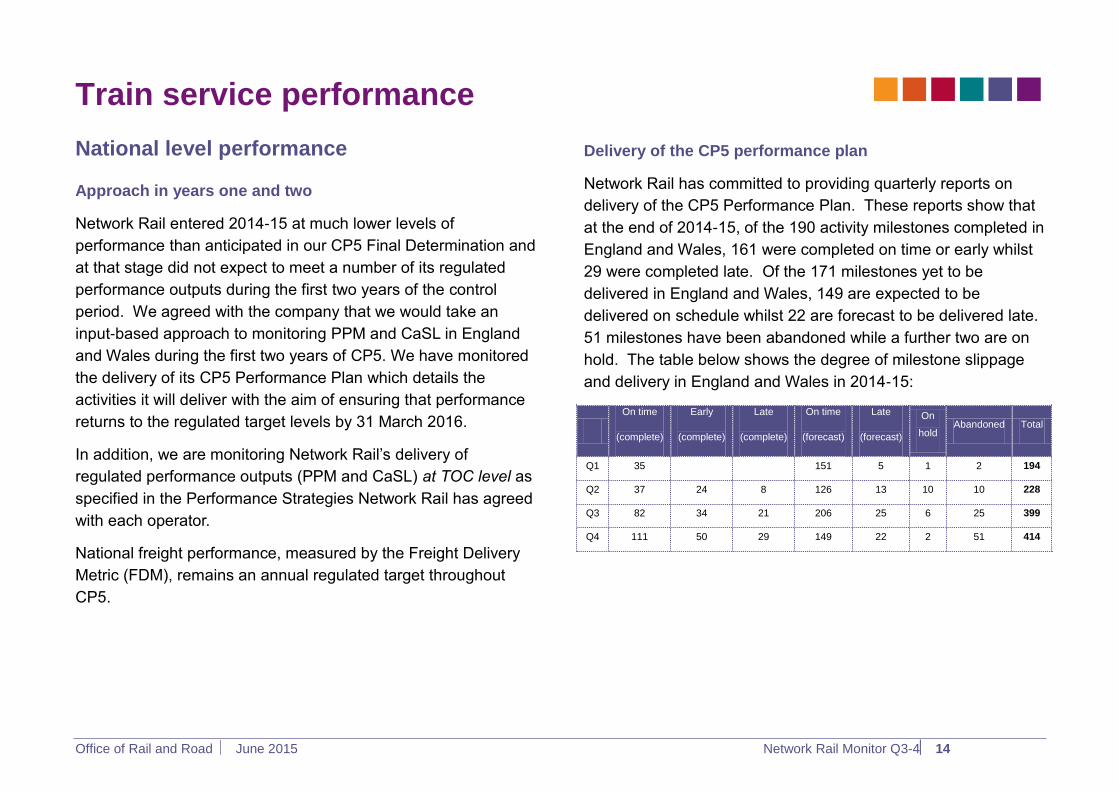
Delivery of the CP5 performance plan
Network Rail has committed to providing quarterly reports on
delivery of the CP5 Performance Plan. These reports show that
at the end of 2014-15, of the 190 activity milestones completed in
England and Wales, 161 were completed on time or early whilst
29 were completed late. Of the 171 milestones yet to be
delivered in England and Wales, 149 are expected to be
delivered on schedule whilst 22 are forecast to be delivered late.
51 milestones have been abandoned while a further two are on
hold. The table below shows the degree of milestone slippage
and delivery in England and Wales in 2014-15:
On time
(complete)
Early
(complete)
Late
(complete)
On time
(forecast)
Late
(forecast)
On
hold Abandoned Total
Q1 35 151 5 1 2 194
Q2 37 24 8 126 13 10 10 228
Q3 82 34 21 206 25 6 25 399
Q4 111 50 29 149 22 2 51 414
Office of Rail and Road June 2015 Network Rail Monitor Q3-4 15
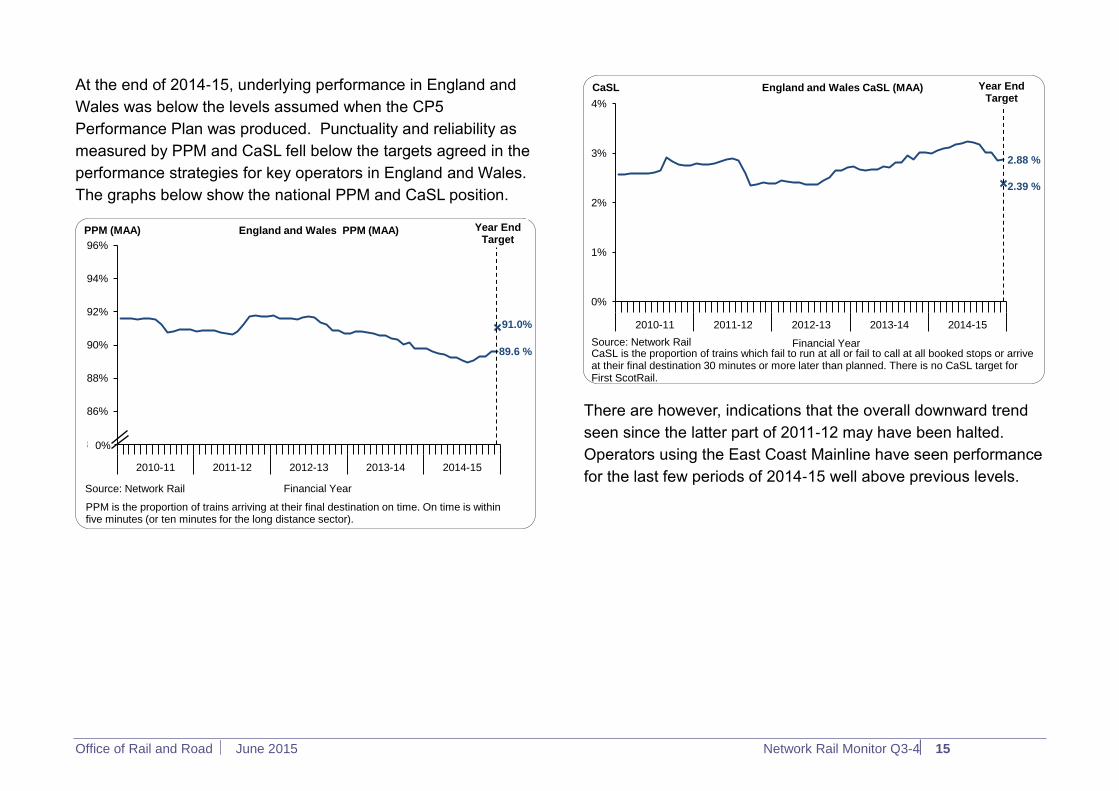
At the end of 2014-15, underlying performance in England and
Wales was below the levels assumed when the CP5
Performance Plan was produced. Punctuality and reliability as
measured by PPM and CaSL fell below the targets agreed in the
performance strategies for key operators in England and Wales.
The graphs below show the national PPM and CaSL position.
There are however, indications that the overall downward trend
seen since the latter part of 2011-12 may have been halted.
Operators using the East Coast Mainline have seen performance
for the last few periods of 2014-15 well above previous levels.
89.6 %
91.0%
84%
86%
88%
90%
92%
94%
96%
2010-11 2011-12 2012-13 2013-14 2014-15
PPM (MAA)
Financial Year
England and Wales PPM (MAA)
0%
Source: Network Rail
Year End Target
PPM is the proportion of trains arriving at their final destination on time. On time is within five minutes (or ten minutes for the long distance sector).
2.88 %
2.39 %
0%
1%
2%
3%
4%
2010-11 2011-12 2012-13 2013-14 2014-15
CaSL
Financial Year
England and Wales CaSL (MAA)
Source: Network Rail
CaSL is the proportion of trains which fail to run at all or fail to call at all booked stops or arrive at their final destination 30 minutes or more later than planned. There is no CaSL target for First ScotRail.
Source: Network Rail
Year End Target
Office of Rail and Road June 2015 Network Rail Monitor Q3-4 16
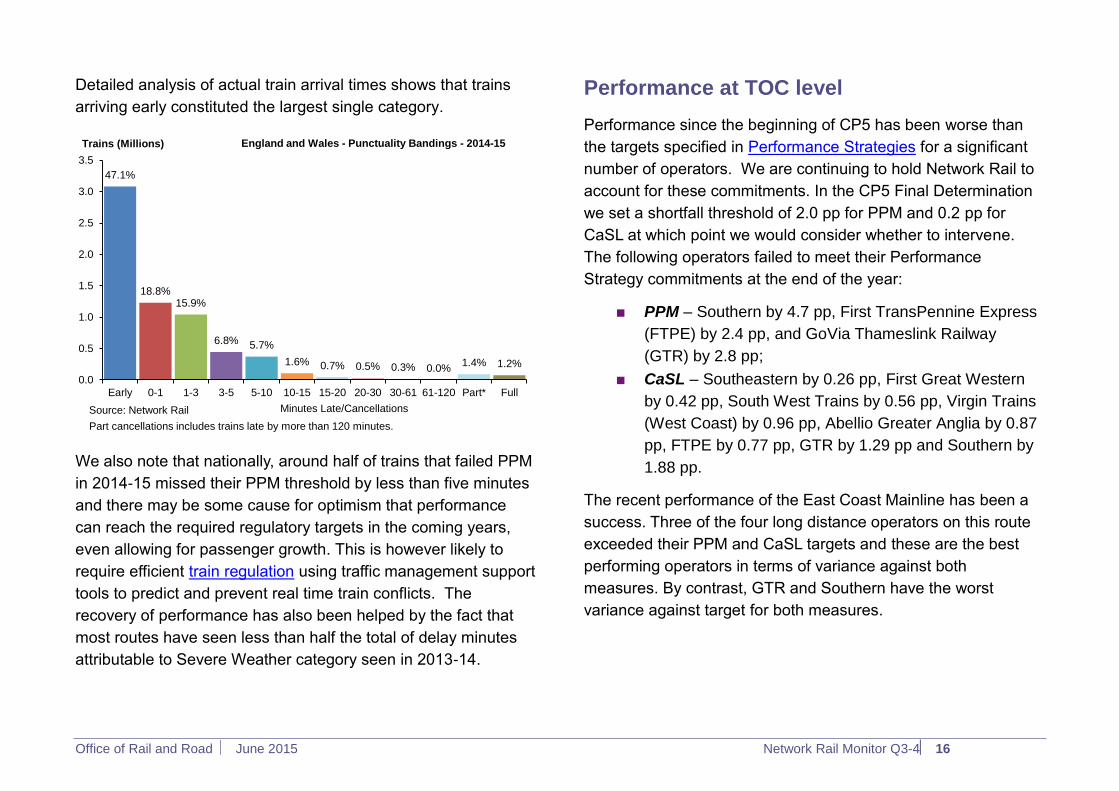
Detailed analysis of actual train arrival times shows that trains
arriving early constituted the largest single category.
We also note that nationally, around half of trains that failed PPM
in 2014-15 missed their PPM threshold by less than five minutes
and there may be some cause for optimism that performance
can reach the required regulatory targets in the coming years,
even allowing for passenger growth. This is however likely to
require efficient train regulation using traffic management support
tools to predict and prevent real time train conflicts. The
recovery of performance has also been helped by the fact that
most routes have seen less than half the total of delay minutes
attributable to Severe Weather category seen in 2013-14.
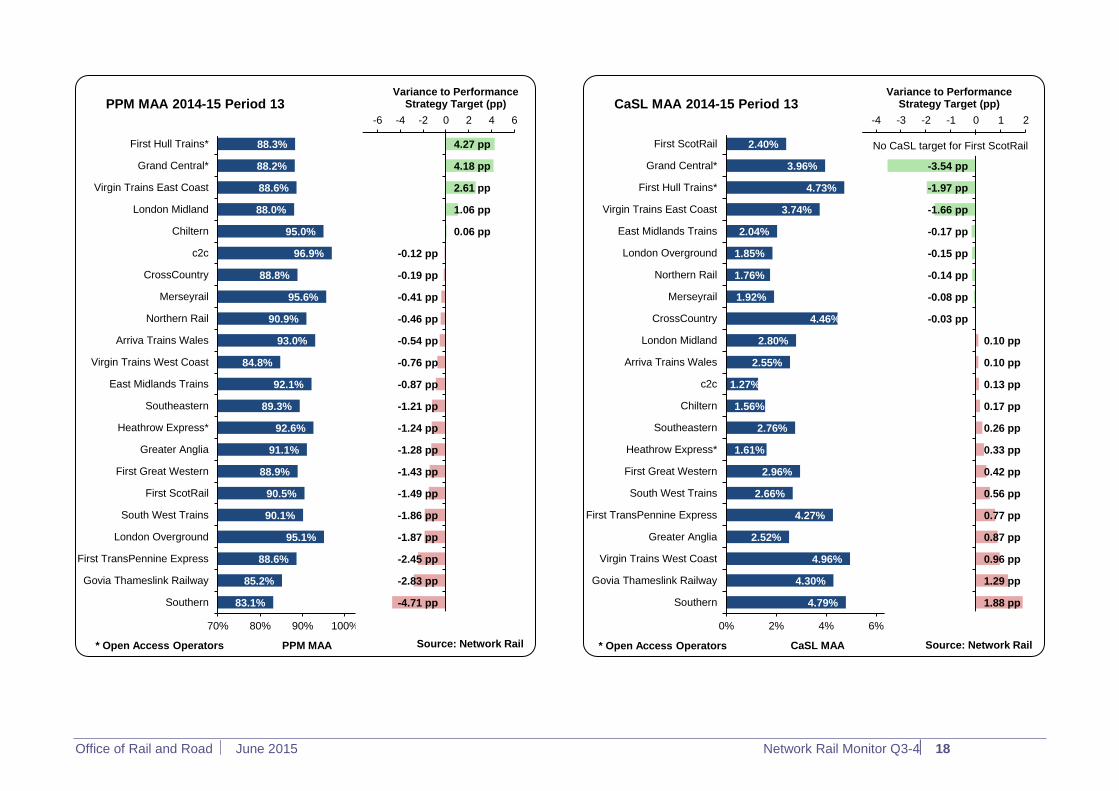
Performance at TOC level
Performance since the beginning of CP5 has been worse than
the targets specified in Performance Strategies for a significant
number of operators. We are continuing to hold Network Rail to
account for these commitments. In the CP5 Final Determination
we set a shortfall threshold of 2.0 pp for PPM and 0.2 pp for
CaSL at which point we would consider whether to intervene.
The following operators failed to meet their Performance
Strategy commitments at the end of the year:
PPM – Southern by 4.7 pp, First TransPennine Express
(FTPE) by 2.4 pp, and GoVia Thameslink Railway
(GTR) by 2.8 pp;
CaSL – Southeastern by 0.26 pp, First Great Western
by 0.42 pp, South West Trains by 0.56 pp, Virgin Trains
(West Coast) by 0.96 pp, Abellio Greater Anglia by 0.87
pp, FTPE by 0.77 pp, GTR by 1.29 pp and Southern by
1.88 pp.
The recent performance of the East Coast Mainline has been a
success. Three of the four long distance operators on this route
exceeded their PPM and CaSL targets and these are the best
performing operators in terms of variance against both
measures. By contrast, GTR and Southern have the worst
variance against target for both measures.
47.1%
18.8% 15.9%
6.8% 5.7%
1.6% 0.7% 0.5% 0.3% 0.0% 1.4% 1.2%
0.0
0.5
1.0
1.5
2.0
2.5
3.0
3.5
Early 0-1 1-3 3-5 5-10 10-15 15-20 20-30 30-61 61-120 Part* Full
Trains (Millions)
Minutes Late/Cancellations
England and Wales - Punctuality Bandings - 2014-15
Source: Network Rail
Part cancellations includes trains late by more than 120 minutes.

Office of Rail and Road June 2015 Network Rail Monitor Q3-4 17
We are investigating whether Network Rail has done everything
reasonably practicable to achieve its targets and the ORR Board
will consider this in the summer. Our investigation in England and
Wales is focused on Network Rail‟s delivery to Southern and
GTR. Together these operators account for approximately one
third of the PPM shortfall and one half of the CaSL shortfall in
England and Wales.
Our investigation is concentrating on potential causes of
underperformance including the impacts of the Thameslink
Programme, timetabling, operational and asset management
issues. We are also considering whether there is any evidence of
systemic issues impacting performance.
We are continuing to monitor Network Rail‟s delivery to all other
operators through our internal processes and will consider
launching further investigations should the plans set out in the
performance strategies fail to deliver the proposed benefits.
The graphs below show all operators‟ performance ranked by
variance to their profiled Performance Strategy targets at the end
of Period 13.
Office of Rail and Road June 2015 Network Rail Monitor Q3-4 18
83.1%
85.2%
88.6%
95.1%
90.1%
90.5%
88.9%
91.1%
92.6%
89.3%
92.1%
84.8%
93.0%
90.9%
95.6%
88.8%
96.9%
95.0%
88.0%
88.6%
88.2%
88.3%
-4.71 pp
-2.83 pp
-2.45 pp
-1.87 pp
-1.86 pp
-1.49 pp
-1.43 pp
-1.28 pp
-1.24 pp
-1.21 pp
-0.87 pp
-0.76 pp
-0.54 pp
-0.46 pp
-0.41 pp
-0.19 pp
-0.12 pp
0.06 pp
1.06 pp
2.61 pp
4.18 pp
4.27 pp
-20 -18 -16 -14 -12 -10 -8 -6 -4 -2 0 2 4 6
70% 80% 90% 100% 110% 120% 130% 140%
Southern
Govia Thameslink Railway
First TransPennine Express
London Overground
South West Trains
First ScotRail
First Great Western
Greater Anglia
Heathrow Express*
Southeastern
East Midlands Trains
Virgin Trains West Coast
Arriva Trains Wales
Northern Rail
Merseyrail
CrossCountry
c2c
Chiltern
London Midland
Virgin Trains East Coast
Grand Central*
First Hull Trains*
Variance to Performance Strategy Target (pp)
PPM MAA
PPM MAA 2014-15 Period 13
* Open Access Operators Source: Network Rail
4.79%
4.30%
4.96%
2.52%
4.27%
2.66%
2.96%
1.61%
2.76%
1.56%
1.27%
2.55%
2.80%
4.46%
1.92%
1.76%
1.85%
2.04%
3.74%
4.73%
3.96%
2.40%
1.88 pp
1.29 pp
0.96 pp
0.87 pp
0.77 pp
0.56 pp
0.42 pp
0.33 pp
0.26 pp
0.17 pp
0.13 pp
0.10 pp
0.10 pp
-0.03 pp
-0.08 pp
-0.14 pp
-0.15 pp
-0.17 pp
-1.66 pp
-1.97 pp
-3.54 pp
-10 -9 -8 -7 -6 -5 -4 -3 -2 -1 0 1 2
0% 2% 4% 6% 8% 10% 12%
Southern
Govia Thameslink Railway
Virgin Trains West Coast
Greater Anglia
First TransPennine Express
South West Trains
First Great Western
Heathrow Express*
Southeastern
Chiltern
c2c
Arriva Trains Wales
London Midland
CrossCountry
Merseyrail
Northern Rail
London Overground
East Midlands Trains
Virgin Trains East Coast
First Hull Trains*
Grand Central*
First ScotRail
Variance to Performance Strategy Target (pp)
CaSL MAA
CaSL MAA 2014-15 Period 13
No CaSL target for First ScotRail
* Open Access Operators Source: Network Rail
Office of Rail and Road June 2015 Network Rail Monitor Q3-4 19
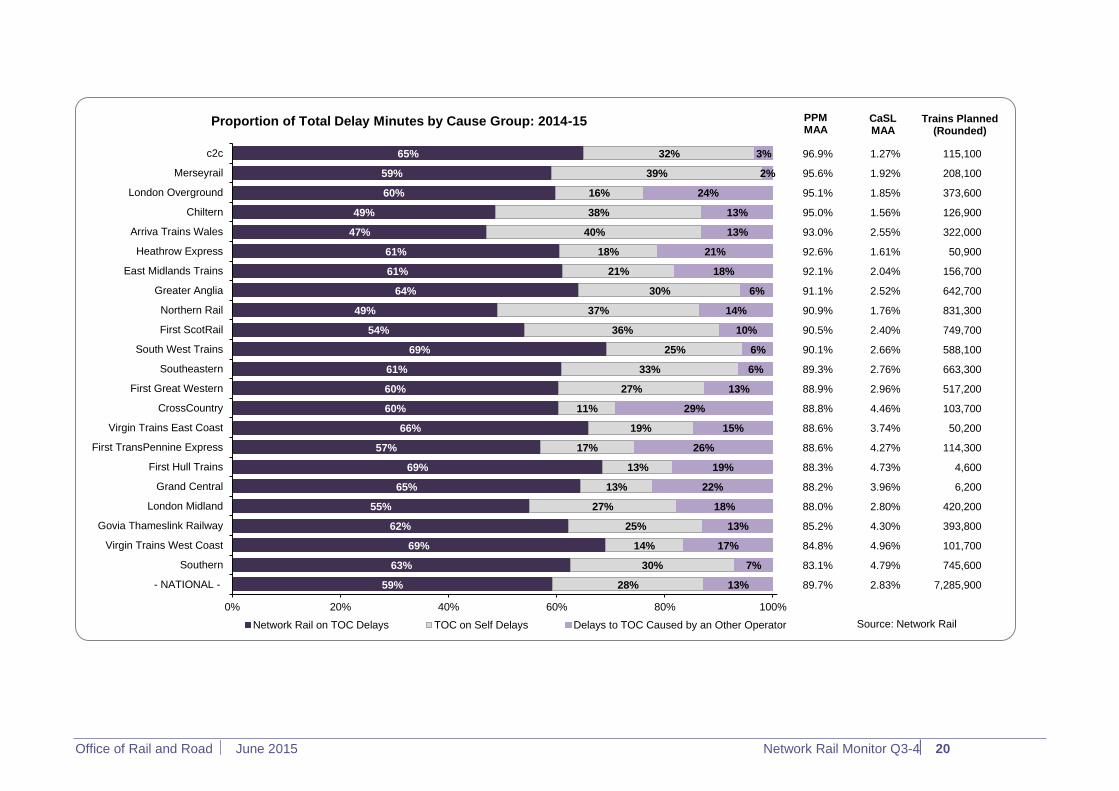
Delay minutes
We are continuing to monitor Network Rail delay minutes as a
key diagnostic indicator for train performance. In 2014-15
Network Rail caused 59% of delay minutes. 28% were “TOC on
Self” (delays to a passenger train operating company's services
caused by that company) and 13% were “TOC on TOC” (delays
to a passenger train operator‟s services caused by another train
company). The operator with the lowest proportion of Network
Rail caused delays was Arriva Trains Wales (47%). Network Rail
caused the highest proportion of delays to South West Trains,
First Hull Trains and Virgin Trains West Coast (69%). The table
overleaf provides further detail. On average Network Rail was
also responsible for 42 of the top 50 passenger affecting
incidents per period during 2014-15.
Freight performance
The regulatory performance measure for freight is the Freight
Delivery Metric (FDM). This metric measures the percentage of
freight trains arriving at their destination within 15 minutes of
scheduled time. FDM covers delays for which Network Rail is
responsible, i.e. not those caused by other train operators. FDM
MAA at the end of Period 13 stands at 94.5%, 2 pp ahead of the
annual target of 92.5%.
Office of Rail and Road June 2015 Network Rail Monitor Q3-4 20
65%
59%
60%
49%
47%
61%
61%
64%
49%
54%
69%
61%
60%
60%
66%
57%
69%
65%
55%
62%
69%
63%
59%
32%
39%
16%
38%
40%
18%
21%
30%
37%
36%
25%
33%
27%
11%
19%
17%
13%
13%
27%
25%
14%
30%
28%
3%
2%
24%
13%
13%
21%
18%
6%
14%
10%
6%
6%
13%
29%
15%
26%
19%
22%
18%
13%
17%
7%
13%
96.9%
95.6%
95.1%
95.0%
93.0%
92.6%
92.1%
91.1%
90.9%
90.5%
90.1%
89.3%
88.9%
88.8%
88.6%
88.6%
88.3%
88.2%
88.0%
85.2%
84.8%
83.1%
89.7%
1.27%
1.92%
1.85%
1.56%
2.55%
1.61%
2.04%
2.52%
1.76%
2.40%
2.66%
2.76%
2.96%
4.46%
3.74%
4.27%
4.73%
3.96%
2.80%
4.30%
4.96%
4.79%
2.83%
115,100
208,100
373,600
126,900
322,000
50,900
156,700
642,700
831,300
749,700
588,100
663,300
517,200
103,700
50,200
114,300
4,600
6,200
420,200
393,800
101,700
745,600
7,285,900
0% 200% 400% 600% 800% 1000% 1200% 1400%
0% 20% 40% 60% 80% 100% 120% 140%
c2c
Merseyrail
London Overground
Chiltern
Arriva Trains Wales
Heathrow Express
East Midlands Trains
Greater Anglia
Northern Rail
First ScotRail
South West Trains
Southeastern
First Great Western
CrossCountry
Virgin Trains East Coast
First TransPennine Express
First Hull Trains
Grand Central
London Midland
Govia Thameslink Railway
Virgin Trains West Coast
Southern
- NATIONAL -
Proportion of Total Delay Minutes by Cause Group: 2014-15
Network Rail on TOC Delays TOC on Self Delays Delays to TOC Caused by an Other Operator
PPM MAA
CaSL MAA
Trains Planned (Rounded)
Source: Network Rail
Office of Rail and Road June 2015 Network Rail Monitor Q3-4 21
Customer service
Passenger satisfaction
Transport Focus published the results of its autumn 2014
National Rail Passengers‟ Satisfaction survey (NRPS) on 27
January 2015.
Although passenger satisfaction depends on TOC as well as
Network Rail performance, these results reflect our concerns
about Network Rail‟s non-delivery of some regulated outputs.
The proportion of passengers satisfied with their journey
overall was 81%. This is down (-2.0 pp – a statistically
significant decline) compared to autumn 2013 when 83% of
passengers were satisfied. It is also lower than the spring
2014 result of 82%.
Similarly, the proportion of passengers satisfied with
punctuality/reliability was 77%. Again, this was significantly
down compared to autumn 2013 when 79% were satisfied.
Satisfaction with punctuality/reliability by individual TOC varied
between 68% (Southern) and 96% (Grand Central). Nationally,
satisfaction with the provision of information during the journey
also declined, with 69% satisfied (a statistically significant 2.0
pp down on the autumn 2013 result).
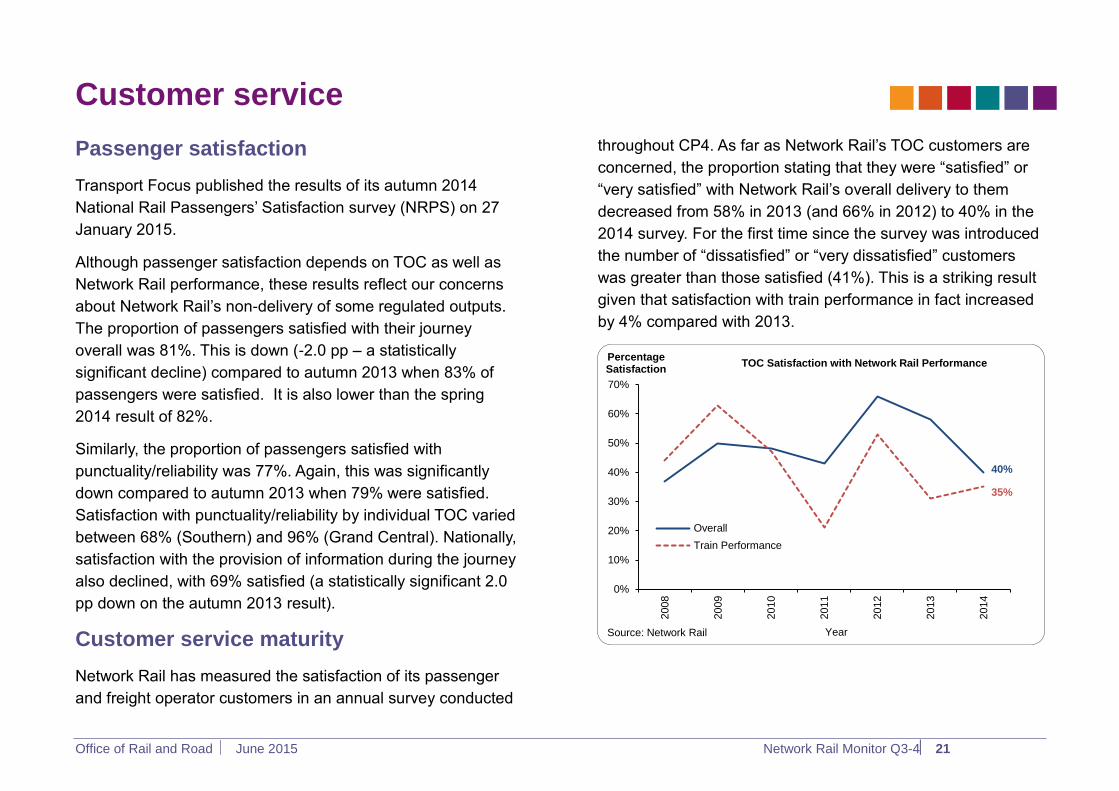
Customer service maturity
Network Rail has measured the satisfaction of its passenger
and freight operator customers in an annual survey conducted
throughout CP4. As far as Network Rail‟s TOC customers are
concerned, the proportion stating that they were “satisfied” or
“very satisfied” with Network Rail‟s overall delivery to them
decreased from 58% in 2013 (and 66% in 2012) to 40% in the
2014 survey. For the first time since the survey was introduced
the number of “dissatisfied” or “very dissatisfied” customers
was greater than those satisfied (41%). This is a striking result
given that satisfaction with train performance in fact increased
by 4% compared with 2013.
40%
35%
0%
10%
20%
30%
40%
50%
60%
70%
2008
2009
2010
2011
2012
2013
2014
Percentage Satisfaction
Year
TOC Satisfaction with Network Rail Performance
Overall
Train Performance
Source: Network Rail
Office of Rail and Road June 2015 Network Rail Monitor Q3-4 22
More positively, freight customers reported increased
satisfaction with Network Rail, with an improved score of 52%
compared to 47% in the previous survey.
The survey provides a useful overview of satisfaction levels but
does not allow Network Rail to understand the effectiveness of
its focus on customers. So in our CP5 Final Determination we
required the company to implement and embed a maturity
model providing a much fuller picture of the level of service
delivered to its customers.
In the second half of 2014-15 Network Rail made some
positive progress in developing this model. Its route teams
developed measures based on a national template which
incorporates:
hard measures that are brought together from other
existing sources;
scores from the latest surveys / pulse check; and
measures for softer / intangible issues.
We expect to see the benefits of this new approach start to
become apparent in 2015-16.
Office of Rail and Road June 2015 Network Rail Monitor Q3-4 23
Asset management
Maintenance and renewals volumes
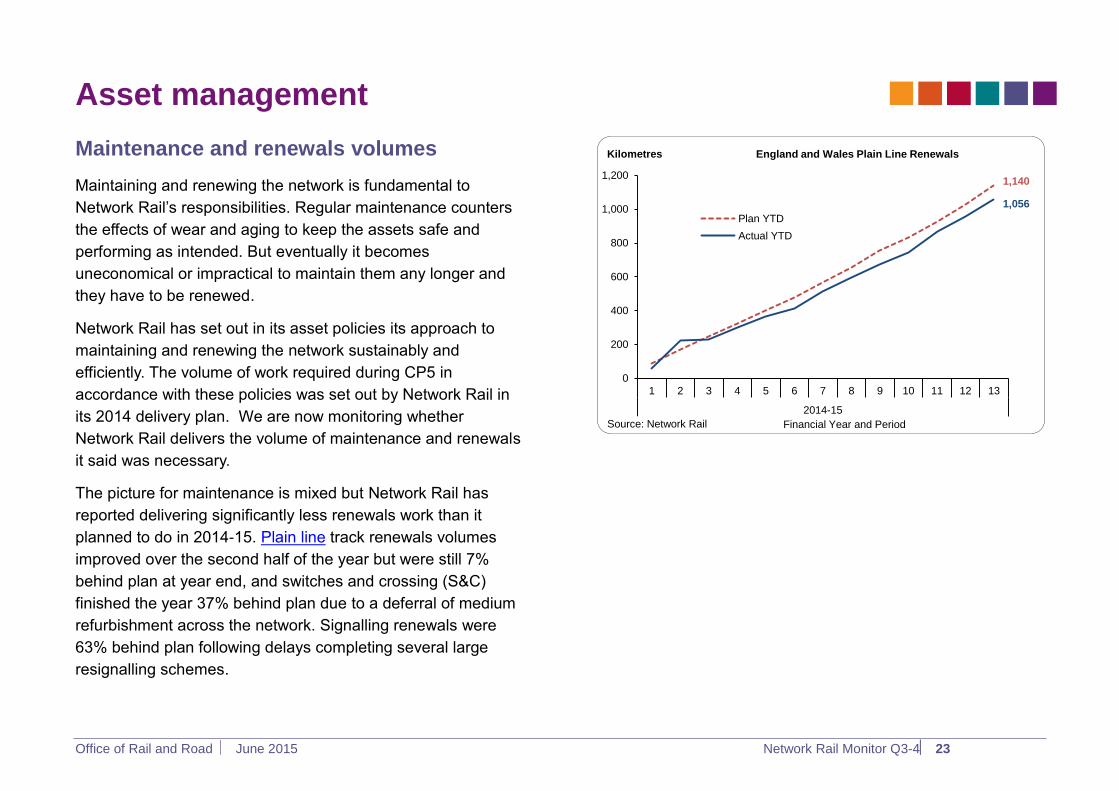
Maintaining and renewing the network is fundamental to
Network Rail‟s responsibilities. Regular maintenance counters
the effects of wear and aging to keep the assets safe and
performing as intended. But eventually it becomes
uneconomical or impractical to maintain them any longer and
they have to be renewed.
Network Rail has set out in its asset policies its approach to
maintaining and renewing the network sustainably and
efficiently. The volume of work required during CP5 in
accordance with these policies was set out by Network Rail in
its 2014 delivery plan. We are now monitoring whether
Network Rail delivers the volume of maintenance and renewals
it said was necessary.
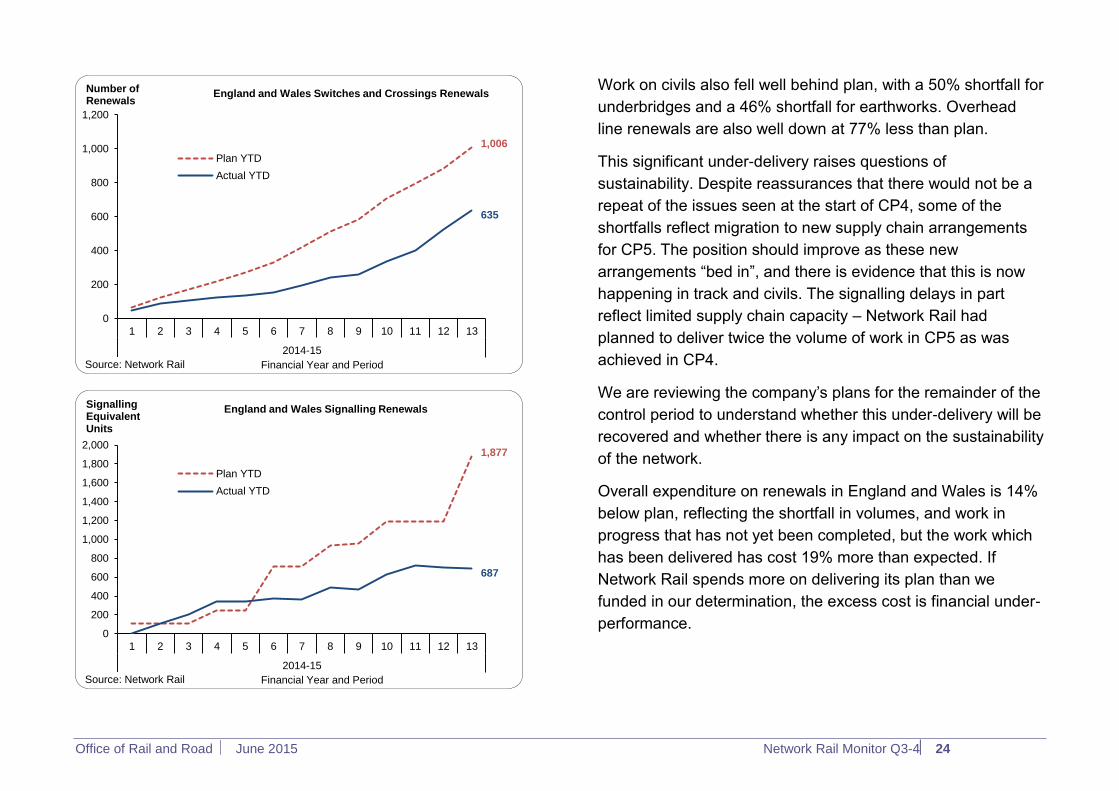
The picture for maintenance is mixed but Network Rail has
reported delivering significantly less renewals work than it
planned to do in 2014-15. Plain line track renewals volumes
improved over the second half of the year but were still 7%
behind plan at year end, and switches and crossing (S&C)
finished the year 37% behind plan due to a deferral of medium
refurbishment across the network. Signalling renewals were
63% behind plan following delays completing several large
resignalling schemes.
1,140
1,056
0
200
400
600
800
1,000
1,200
1 2 3 4 5 6 7 8 9 10 11 12 13
2014-15
Kilometres
Financial Year and Period
England and Wales Plain Line Renewals
Plan YTD
Actual YTD
Source: Network Rail
Office of Rail and Road June 2015 Network Rail Monitor Q3-4 24
Work on civils also fell well behind plan, with a 50% shortfall for
underbridges and a 46% shortfall for earthworks. Overhead
line renewals are also well down at 77% less than plan.
This significant under-delivery raises questions of
sustainability. Despite reassurances that there would not be a
repeat of the issues seen at the start of CP4, some of the
shortfalls reflect migration to new supply chain arrangements
for CP5. The position should improve as these new
arrangements “bed in”, and there is evidence that this is now
happening in track and civils. The signalling delays in part
reflect limited supply chain capacity – Network Rail had
planned to deliver twice the volume of work in CP5 as was
achieved in CP4.
We are reviewing the company‟s plans for the remainder of the
control period to understand whether this under-delivery will be
recovered and whether there is any impact on the sustainability
of the network.
Overall expenditure on renewals in England and Wales is 14%
below plan, reflecting the shortfall in volumes, and work in
progress that has not yet been completed, but the work which
has been delivered has cost 19% more than expected. If
Network Rail spends more on delivering its plan than we
funded in our determination, the excess cost is financial under-
performance.
1,006
635
0
200
400
600
800
1,000
1,200
1 2 3 4 5 6 7 8 9 10 11 12 13
2014-15
Number of Renewals
Financial Year and Period
England and Wales Switches and Crossings Renewals
Plan YTD
Actual YTD
Source: Network Rail
1,877
687
0
200
400
600
800
1,000
1,200
1,400
1,600
1,800
2,000
1 2 3 4 5 6 7 8 9 10 11 12 13
2014-15
Signalling Equivalent Units
Financial Year and Period
England and Wales Signalling Renewals
Plan YTD
Actual YTD
Source: Network Rail
Office of Rail and Road June 2015 Network Rail Monitor Q3-4 25
For CP5 we asked Network Rail to provide more detailed
reporting on the volume of maintenance delivered, so we could
see how each route is performing by maintenance activity. We
have found shortcomings in the data reporting during the year
and asked the company to improve the quality of its reporting.
The situation is also complicated in some areas where
maintenance activities are delivered as part of an
enhancement project or in the course of renewals activity and
are thus not captured as maintenance in Network Rail‟s work
reporting system. Overall it appears there has been a mix of
both over and under-delivery of maintenance across the
network, in part reflecting shortcomings in the DP14
maintenance plans. We will continue to press Network Rail for
greater transparency in this area and for improvements in
maintenance planning.
Office of Rail and Road June 2015 Network Rail Monitor Q3-4 26
Asset management excellence
Asset management excellence is key to improving the
reliability and performance of Network Rail‟s assets in an
efficient and sustainable way. A consistent systematic strategy
with robust processes and procedures will lead to a more
“predict and prevent” approach to asset management so that
issue can be addressed before they affect services. This
contrasts with „find and fix‟ which is usually reactive and less
efficient. There are opportunities for Network Rail to learn from
leading edge organisations and to adopt and adapt new
technologies and work practices to its advantage. This will
translate into more reliable and efficient infrastructure,
ultimately leading to a better experience for customers and
passengers.
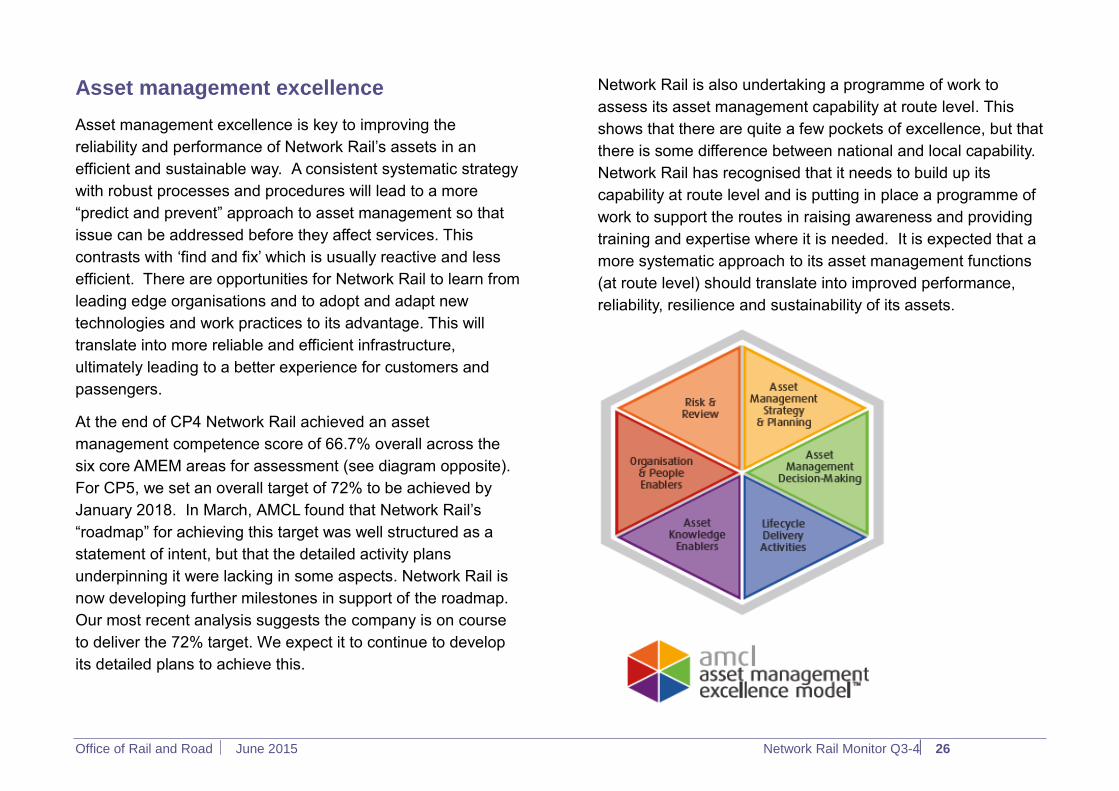
At the end of CP4 Network Rail achieved an asset
management competence score of 66.7% overall across the
six core AMEM areas for assessment (see diagram opposite).
For CP5, we set an overall target of 72% to be achieved by
January 2018. In March, AMCL found that Network Rail‟s
“roadmap” for achieving this target was well structured as a
statement of intent, but that the detailed activity plans
underpinning it were lacking in some aspects. Network Rail is
now developing further milestones in support of the roadmap.
Our most recent analysis suggests the company is on course
to deliver the 72% target. We expect it to continue to develop
its detailed plans to achieve this.
Network Rail is also undertaking a programme of work to
assess its asset management capability at route level. This
shows that there are quite a few pockets of excellence, but that
there is some difference between national and local capability.
Network Rail has recognised that it needs to build up its
capability at route level and is putting in place a programme of
work to support the routes in raising awareness and providing
training and expertise where it is needed. It is expected that a
more systematic approach to its asset management functions
(at route level) should translate into improved performance,
reliability, resilience and sustainability of its assets.
Office of Rail and Road June 2015 Network Rail Monitor Q3-4 27
Asset data quality
Knowing what assets you have, where they are and how they
are performing is a fundamental building block of asset
management. Without up to date knowledge about its assets
an organisation will not have sufficient understanding of how
and why they fail, and its maintenance approach will be largely
reactive rather than preventative. This in turn leads to
inefficiencies through reduced performance and repeat
maintenance.
For CP5 we challenged Network Rail to improve its asset data
quality, and we set a specific quality target to be achieved by
April 2017. To that end Network Rail has adopted a
comprehensive assurance programme to enable it to populate,
verify and monitor the quality of its „data assets‟. We are
monitoring progress on a quarterly basis, and Network Rail
remains on target to achieve the required standard.
ORBIS milestones Offering Rail Better Information Services (ORBIS) is an
ambitious programme aimed at improving asset management
capability through improved information management. It
involves adopting consistent data specifications, providing
simpler mobile data capture tools, replacing outdated asset
information systems (such as GEOGIS and CARRS), and
providing improved decision support tools. The programme
began in CP4, and we set specific milestones during CP5 to
help ensure it delivers all the benefits expected.
To date all milestones have been achieved on schedule,
including for the signalling core data, which was completed in
January. The next milestone is completion of the national
rollout of the signalling decision support tool, due in
September. This will bring together disparate signalling data
sources and enable Network Rail to target work more
efficiently.
Track
Track performance
Nationally, the number of service-affecting track failures has
decreased over the year, although Wales and Sussex Routes
are exceptions, showing worsening trends.
There has been a continuing reduction in the numbers of
broken rails and serious rail defects. After some problems mid-
year, „poor track geometry‟ has improved and the position at
the end of March 2015 was better than at the beginning of
2014-15 and indeed the best (i.e. lowest) level recorded for
more than a decade.
Office of Rail and Road June 2015 Network Rail Monitor Q3-4 28
Civils
Drainage
Earthworks and track both rely on the condition of drainage.
Poor drainage can cause wet beds and eventually poor vertical
track alignment or sudden failures in embankment or cutting
slopes. There were many earthworks failures during the wet
weather over the winter of 2013-14 and these were partly
attributable to historic problems with drainage. We are still not
satisfied that Network Rail is doing enough in this area and we
issued an improvement notice on the 18 February 2015
covering the management of critical drainage system
components. This was a network-wide notice.
Station buildings and operational property
Earlier in the year a backlog in operational property
assessments came to light as well as significant gaps in data
knowledge. These assessments determine whether a structure
is capable of carrying the maximum load it might be expected
to carry, such as passenger loading on a footbridge or wind
loading on a canopy. Network Rail has established mitigation
measures and is rechecking their effectiveness. A recovery
plan has been developed and is now being implemented.
Progress is slow at present but we are continuing to monitor
delivery closely and to press Network Rail to accelerate the
program which extends into 2017-18.
Office of Rail and Road June 2015 Network Rail Monitor Q3-4 29
Developing the network
Network Rail is responsible for delivering over £12 billion of
infrastructure enhancement expenditure over the five years of
CP5. The government‟s rail investment plans in CP5 are more
ambitious and complex than in CP4, with a high level of
interdependency between the infrastructure projects, the re-
franchising timetable and rolling stock procurement and the
resulting reallocation of rolling stock. The infrastructure
component for which Network Rail is responsible will be the
critical enabler for planned step changes in train services, with
significant timetable improvements planned for later in the
control period.
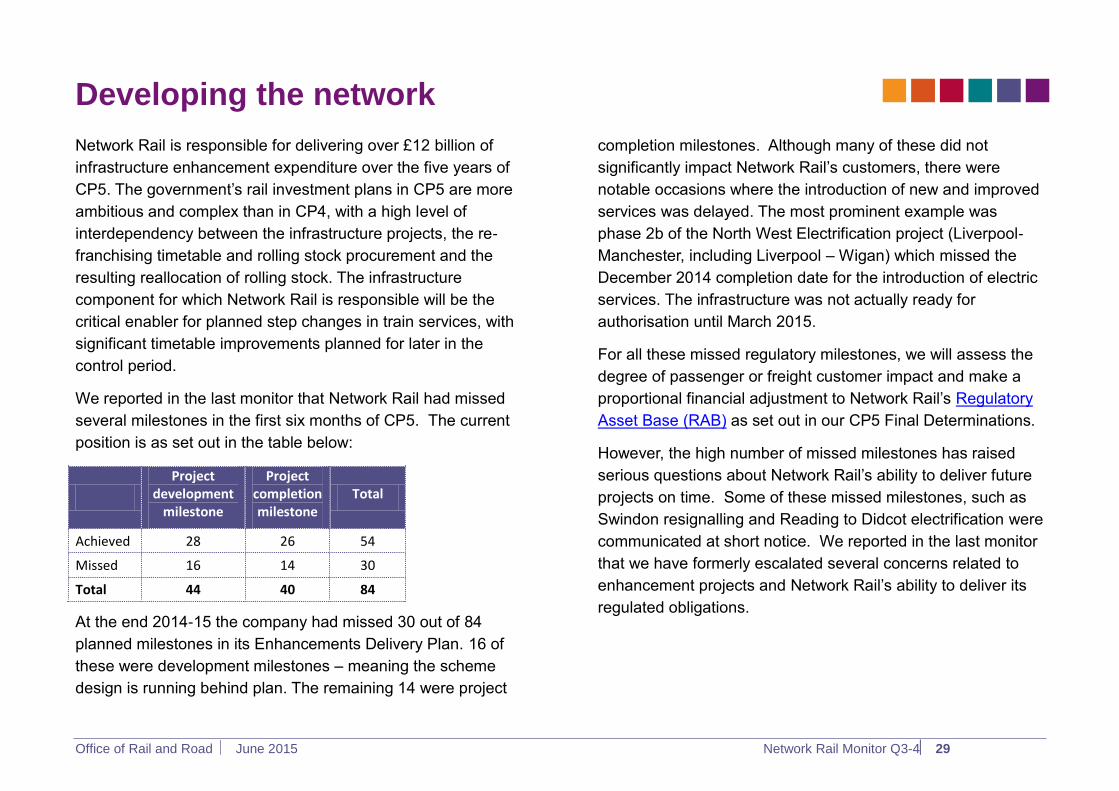
We reported in the last monitor that Network Rail had missed
several milestones in the first six months of CP5. The current
position is as set out in the table below:
Project
development milestone
Project completion milestone
Total
Achieved 28 26 54
Missed 16 14 30
Total 44 40 84
At the end 2014-15 the company had missed 30 out of 84
planned milestones in its Enhancements Delivery Plan. 16 of
these were development milestones – meaning the scheme
design is running behind plan. The remaining 14 were project
completion milestones. Although many of these did not
significantly impact Network Rail‟s customers, there were
notable occasions where the introduction of new and improved
services was delayed. The most prominent example was
phase 2b of the North West Electrification project (Liverpool-
Manchester, including Liverpool – Wigan) which missed the
December 2014 completion date for the introduction of electric
services. The infrastructure was not actually ready for
authorisation until March 2015.
For all these missed regulatory milestones, we will assess the
degree of passenger or freight customer impact and make a
proportional financial adjustment to Network Rail‟s Regulatory
Asset Base (RAB) as set out in our CP5 Final Determinations.
However, the high number of missed milestones has raised
serious questions about Network Rail‟s ability to deliver future
projects on time. Some of these missed milestones, such as
Swindon resignalling and Reading to Didcot electrification were
communicated at short notice. We reported in the last monitor
that we have formerly escalated several concerns related to
enhancement projects and Network Rail‟s ability to deliver its
regulated obligations.
Office of Rail and Road June 2015 Network Rail Monitor Q3-4 30
These concerns can be summarised as follows:
shortcomings in project design and development,
including inadequate rigour in cost estimating;
late project delivery;
shortcomings in how Network Rail delivers its part in
cross-industry programmes such as Great Western
Route Modernisation; and
lack of evidence that Network Rail is managing the
CP5 investment portfolio to achieve efficiencies.
In the Final Determination we gave Network Rail time to work
up some early lifecycle projects requested by DfT and then
make an Enhancements Cost Adjustment Mechanism (ECAM)
submission including a robust scope and cost estimate for
delivering defined outputs. This would enable us to assess
whether this was an efficient cost that could be added to the
RAB. We have seen slippage in the dates of this project
development work and significant escalations in the cost
estimates since the early estimates included in the Strategic
Business Plan.
Additionally, in order to provide assurance that a project has
complied with all its safety and legislative duties, projects that
make significant changes to the risk profile for a section of the
railway (such as electrification) are required to submit
Technical Files to the National Safety Authority (which for the
UK is ORR) in order to receive permission to authorise into
public use. The late submission and poor quality of many of
these submissions, which are made at the very end of the
project, has highlighted significant failings in Network Rail‟s
delivery processes and capability.
Network Rail has acknowledged our concerns and is carrying
out several separate internal reviews to learn lessons and put
in place improvements. It needs to strengthen and enhance its
capabilities in key areas to ensure it can deliver what is
required on time. We are investigating whether the company is
doing everything reasonably practicable to address these
concerns and to improve its capability so that we are more
assured that it can deliver its regulatory obligations for CP5.
Independent Reporter review
Network Rail has a critical role in major cross-industry
programmes. We commissioned the independent reporter last
year, to check that lessons had been learnt from recent
experience in establishing a programme framework in
Thameslink and the Great Western route modernisation. The
review has already established a rapid assessment framework
to apply to Network Rail‟s programmes. The work has proved
valuable in establishing what each programme needs to do in
order to improve its capability. It has also been expanded to
develop an outline programme management process for major
route upgrades, innovating from established best practice. We
expect to see evidence of improvements as a result of this
work.
Office of Rail and Road June 2015 Network Rail Monitor Q3-4 31
Expenditure and finance
Overall financial performance
We consider Network Rail‟s financial performance in two
different ways as set out in the tables overleaf. Firstly we
provide a simple comparison of spend against Network Rail‟s
own budget and second we look at our regulatory performance
measure. This measure takes account of issues such as the
delivery of regulated outputs and the effectiveness of Network
Rail‟s asset management, in order to assess how the company
is performing in relation to our CP5 Final Determination. It does
not allow any benefit from where work has simply been
delayed. The baseline is our CP5 Final Determination.
Regulatory financial performance against budget
Financial performance for the year is around £230m adverse to
Network Rail‟s own budget. Key drivers of overspend include:
higher schedule 8 costs, reflecting worse than
expected train performance;
higher than expected renewal costs partly due to
delays in some efficiency initiatives;
overspend across a number of enhancements
projects; and
the introduction within the year of the Tidy Railway
and Vegetation Management programmes.
Whilst not directly affecting regulatory financial performance
(justified deferral has a neutral effect on regulatory financial
performance) we note that renewals work delivered in the year
slipped by around 20% compared to Network Rail‟s budget
resulting in the largest budget variance. This is largely due to
under-delivery of planned track, signalling and electrification
work (considered in the asset management section above). We
will keep this under review and our assessments of Network
Rail‟s financial performance in CP5 will take into account any
concerns we may have regarding the sustainability of the
company‟s asset management. Enhancements work also
slipped by around 8% and we are keeping that under review as
set out in the section on developing the network.
Overall regulatory financial performance
We currently expect Network Rail to underperform the
regulatory financial performance measure (which excludes
some expenditure and fixed income) by around £430m in
2014-15. This takes into account the variances between:
actual performance and its own budget (c. £230m
adverse);
the financial assumptions in our PR13 determination
for CP5 and Network Rail‟s own budget (c. £100m
adverse); and
Office of Rail and Road June 2015 Network Rail Monitor Q3-4 32
Network Rail‟s estimate of the financial effect of the
under-delivery of the regulatory outputs for train
performance (c. £100m adverse).
Network Rail’s borrowing
Network Rail‟s net debt at 31 March 2015 was £36.9 billion,
£0.3 billion lower than its budget. This variance was largely
due to the deferral of capital expenditure to later in CP5.
The amount of new borrowing available from DfT is limited to
£30.3 billion across CP5. Following the company‟s
classification to the public sector by the Office of National
Statistics (ONS), Network Rail agreed to borrow from DfT
instead of issuing bonds.
Network Rail is updating its CP5 business plans to reflect its
latest views on when outputs will be delivered and revised cost
information. This process has taken longer than expected and
we are currently reviewing the draft plans.
Network Rail’s financial performance
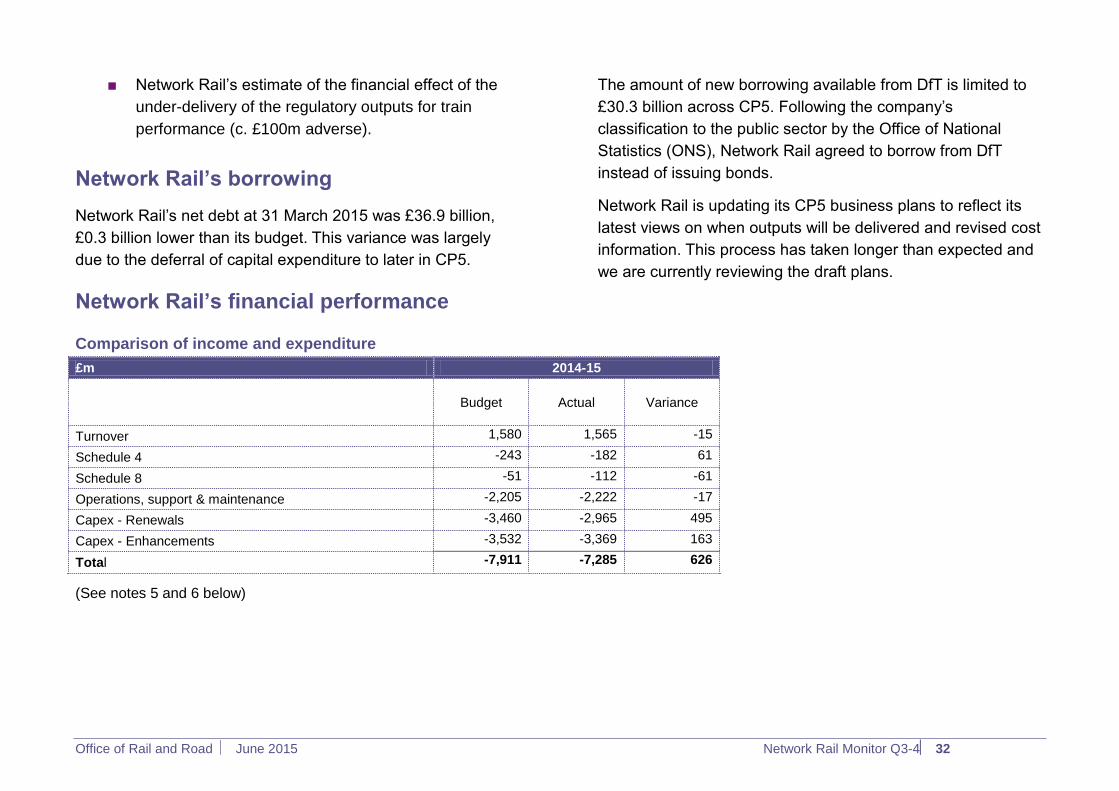
Comparison of income and expenditure
£m 2014-15
Budget Actual
Variance
Turnover 1,580 1,565 -15
Schedule 4 -243 -182 61
Schedule 8 -51 -112 -61
Operations, support & maintenance -2,205 -2,222 -17
Capex - Renewals -3,460 -2,965 495
Capex - Enhancements -3,532 -3,369 163
Total -7,911 -7,285 626
(See notes 5 and 6 below)
Office of Rail and Road June 2015 Network Rail Monitor Q3-4 33
Total regulatory financial performance
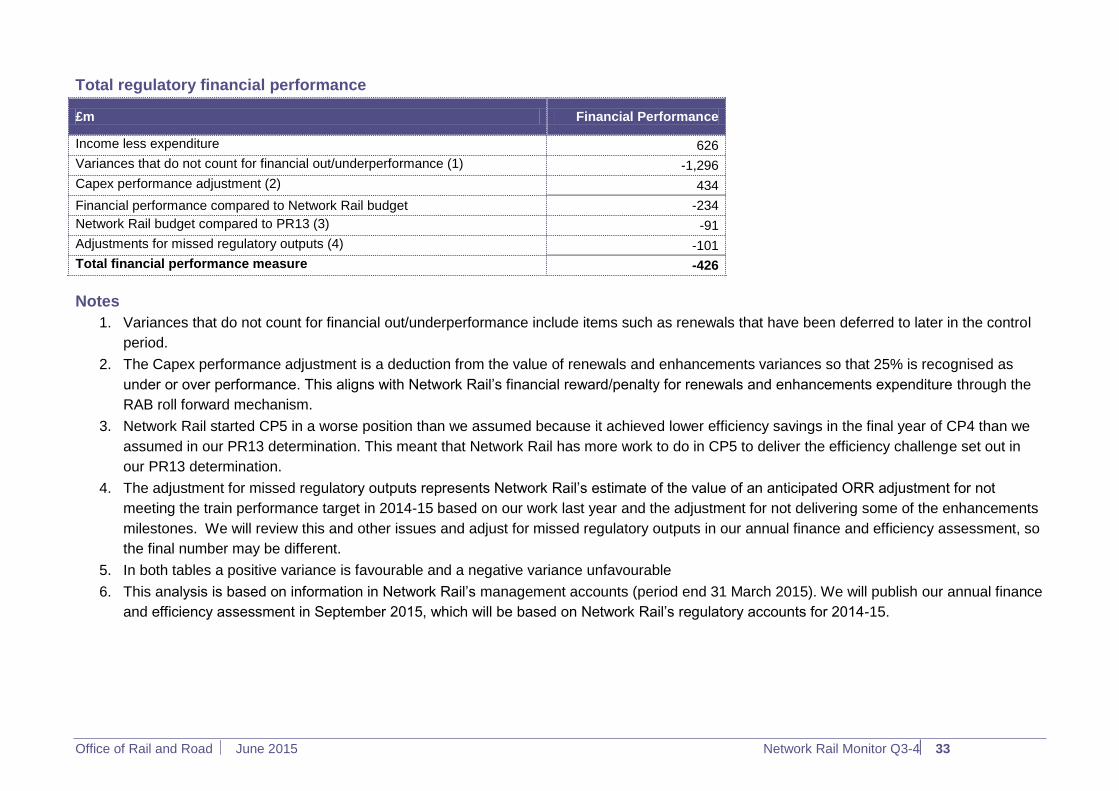
£m Financial Performance
Income less expenditure
626 Variances that do not count for financial out/underperformance (1)
-1,296 Capex performance adjustment (2)
434
Financial performance compared to Network Rail budget -234 Network Rail budget compared to PR13 (3)
-91 Adjustments for missed regulatory outputs (4)
-101 Total financial performance measure
-426
Notes
1. Variances that do not count for financial out/underperformance include items such as renewals that have been deferred to later in the control
period.
2. The Capex performance adjustment is a deduction from the value of renewals and enhancements variances so that 25% is recognised as
under or over performance. This aligns with Network Rail‟s financial reward/penalty for renewals and enhancements expenditure through the
RAB roll forward mechanism.
3. Network Rail started CP5 in a worse position than we assumed because it achieved lower efficiency savings in the final year of CP4 than we
assumed in our PR13 determination. This meant that Network Rail has more work to do in CP5 to deliver the efficiency challenge set out in
our PR13 determination.
4. The adjustment for missed regulatory outputs represents Network Rail‟s estimate of the value of an anticipated ORR adjustment for not
meeting the train performance target in 2014-15 based on our work last year and the adjustment for not delivering some of the enhancements
milestones. We will review this and other issues and adjust for missed regulatory outputs in our annual finance and efficiency assessment, so
the final number may be different.
5. In both tables a positive variance is favourable and a negative variance unfavourable
6. This analysis is based on information in Network Rail‟s management accounts (period end 31 March 2015). We will publish our annual finance
and efficiency assessment in September 2015, which will be based on Network Rail‟s regulatory accounts for 2014-15.
Office of Rail and Road June 2015 Network Rail Monitor Q3-4 34
We publish the Network Rail Monitor every six
months, focusing on Network Rail’s delivery of its
obligations to its customers and funders, for which it
is mainly accountable under its network licence.
We welcome your feedback on this publication. Please
send your comments or queries to:
Andy Lewis on 020 7282 2102
Office of Rail and Road
One Kemble Street
London
WC2B 4AN
© Crown copyright 2015
This publication is licensed under the terms of the Open Government Licence v3.0 except where otherwise stated. To view this licence, visit
nationalarchives.gov.uk/doc/open-government-licence/version/3 or write to the Information Policy Team, The National Archives, Kew, London TW9 4DU, or
email: [email protected].
Where we have identified any third party copyright information you will need to obtain permission from the copyright holders concerned.
This publication is available at orr.gov.uk
Any enquiries regarding this publication should be sent to us at orr.gov.uk.
Recommended