
Electronic copy available at: http://ssrn.com/abstract=958158
Network Structure & Information Advantage
1
Network Structure & Information Advantage
Sinan Aral, Stern School of Business, NYU & Sloan School of Management, MIT.
Marshall Van Alstyne, Boston University School of Management & Sloan School of Management, MIT.
We investigate the long held but empirically untested assumption that diverse networks drive performance by providing
access to novel information. We build and validate an analytical model of information diversity, develop theory linking
network structure to the distribution of novel information among actors and their performance, and test our theory using
a unique ten month panel of email communication patterns, message content and performance data from a medium
sized executive recruiting firm. While our theory and results demonstrate that network structures predict performance
due to their impact on access to information, we also find important theoretically driven non-linearities in these rela-
tionships. Novel and diverse information are increasing in network size and network diversity, but with diminishing
marginal returns. There are also diminishing marginal productivity returns to novel information, consistent with theo-
ries of cognitive capacity, bounded rationality, and information overload. Network diversity contributes to performance
even when controlling for the performance effects of novel information, suggesting additional benefits to diverse net-
works beyond those conferred through information advantage. Our theory and results suggest subtle nuances in rela-
tionships between networks, information and economic performance, and the methods and tools developed are replic-
able, opening a new line of inquiry into these relationships.
Keywords: Social Networks, Information Economics, Information Content, Information Diversity, Network Size, Net-
work Diversity, Performance, Productivity, Information Work.
______________________________________________________________________________
We are grateful to Erik Brynjolfsson, Emilio Castilla, Ezra Zuckerman, Arun Sundararajan, Erol Pekoz, and seminar participants at the Workshop on Information Systems Economics, the Sunbelt Social Networks Conference, the International Conference on Network Science, the Academy of Management, NYU and MIT for valuable comments, and to the National Science Foundation (Career Award IIS-9876233 and grant IIS-0085725), Cisco Systems, France Telecom and the MIT Center for Digital Business for generous funding. We thank Tim Choe, Petch Manoharn and Jun Zhang for their tireless research assistance.

Electronic copy available at: http://ssrn.com/abstract=958158
Network Structure & Information Advantage
1
1. Introduction
A growing body of evidence links the structural properties of individuals’ and groups’ networked
relationships to various dimensions of economic performance. However, the mechanisms driving this
linkage, thought to be related to the value of the information flowing between connected actors, are typi-
cally inferred, and rarely empirically demonstrated. As a consequence, our understanding of how and why
social structure explains economic outcomes remains underdeveloped, and competing explanations of the
causal mechanisms underlying structural advantage proliferate. For instance, we know little about the
relative importance of information and control benefits to social structure, and numerous puzzles remain
concerning the situational importance of network cohesion and brokerage (Burt 1992, Coleman 1988),
and the tradeoffs between the knowledge and power benefits derived from network structures (Reagans &
Zuckerman 2006). At the heart of these puzzles lie foundational questions about the degree to which so-
cial structure creates intermediate information benefits, and how different network topologies enable
these benefits. Comprehensive theories of the structure-performance relationship require a more thorough
examination of the intermediate mechanisms through which social structure affects economic advantage.
The strategy of this paper is to narrowly examine one of these mechanisms – the relationship between
network structure and information benefits – in detail.
One of the most prominent mechanisms theorized to drive the relationship between social struc-
ture and performance is the existence of ‘information benefits’ to network structure. According to this
argument, actors in favorable structural positions enjoy social and economic advantages based on their
access to specific types of information. Burt (1992) convincingly shows that individuals with structurally
diverse networks (networks low in (a) cohesion, and (b) structural equivalence) are more successful in
terms of wages, promotion, job placement, and creativity (Burt 2004a). He argues that these performance
differentials can be explained in part by actors’ access to diverse pools of knowledge, and their ability to
efficiently gather non-redundant information.1 Aral, Brynjolfsson and Van Alstyne (2006) demonstrate
1 Coleman’s (1988) argument, that focused information from cohesive networks provides more precise signals of actors’ environments, also assumes that cohesive networks provide focused (while diverse networks provide diverse) information.
Electronic copy available at: http://ssrn.com/abstract=958158
Network Structure & Information Advantage
2
that structural diversity is associated with higher levels of economic productivity for task-based informa-
tion workers. These studies, and numerous others, infer that network diversity is associated with perform-
ance in part because diverse contacts provide access to novel information. Novel information is thought to
be valuable due to its local scarcity. Actors with scarce, novel information in a given network neighbor-
hood are better positioned to broker opportunities, use information as a commodity, or apply information
to problems that are intractable given local knowledge.
While this argument is intuitively appealing, there are important theoretical and empirical reasons
to be skeptical about whether structural diversity drives performance by providing access to diverse,
novel information. Simultaneous consideration of within channel novelty (the novelty of information re-
ceived from the same alter over time) and across channel novelty (the relative novelty of information re-
ceived from different alters over time) may lead to indeterminate or nonlinear predictions about the rela-
tionship between structural diversity and access to novel information. If the information actors receive
through diverse networks tends to have high topic variety across channels but low topic variety within
channels, it could be that diverse networks provide less total novel information on average or that there
are diminishing marginal contributions to novelty from increasing structural diversity. In addition, the
greater structural awareness of actors in constrained networks (Coleman 1988) may enable alters to dif-
ferentiate their information flows from one another, allowing them to avoid transmitting redundant infor-
mation. There may also be non-information based benefits driving the relationship between network di-
versity and performance, or limits to the benefits of novel information itself.
Although theories of the value of information and empirical evidence on the relationship between
network structure and performance exist, little theory, and almost no empirical evidence addresses how
network structure influences the nature of the information distributed across a network - the network’s
‘information structure.’2 To build theory relating network structure to information structure we investigate
how topological properties of individuals’ network positions (network size and network diversity) impact
2 The term “information structure” is used in the economics literature to denote the mapping of states of nature to signals i.e. news, received by a decision maker (see Arrow 1985).
Network Structure & Information Advantage
3
the abundance and diversity of the information they receive and distribute, and whether this in turn ex-
plains productivity. We test the implications of our theory using empirical evidence from a ten month
panel of email communication patterns and message content among information workers in a medium
sized executive recruiting firm.
Our findings indicate that (1) the total amount of novel information and the diversity of informa-
tion flowing to actors are increasing in actors’ network size and network diversity, but (2) diminishing
marginal returns set in at two levels. Network size is a concave predictor of information diversity, and
there are diminishing marginal productivity returns to novel information. Part of the explanation for the
decreasing marginal contribution of network size to information diversity is that (3) network diversity is
increasing in network size, but with diminishing marginal returns. As actors establish relationships with a
finite set of possible contacts in an organization, the probability that a marginal relationship will be non-
redundant, and provide access to novel information, decreases as possible alters in the network are ex-
hausted. We also find that (4) network diversity contributes to performance even when controlling for the
positive performance effects of access to novel information, suggesting additional benefits to network
diversity beyond those conferred through information advantage, Surprisingly, (5) traditional demo-
graphic and human capital variables (e.g. age, gender, industry experience, education) have little effect on
access to diverse information, highlighting the importance of network structure for information advan-
tage. These results represent some of the first evidence on the relationship between network structure and
information content and reveal subtle nuances and non-linearities in their relationships. Our findings ad-
vance our understanding of the economic value of information and the intermediate mechanisms driving
the relationship between social structure and productivity. Our methods for analyzing network structure
and information content in email data are replicable, opening a new line of inquiry into the relationship
between networks, information and performance.
2. Theory
2.1. Network Structure & Information Advantage: A Critical Inference
Network Structure & Information Advantage
4
The assumption that network structure influences the distribution of information and knowledge
in social groups (and thus characteristics of the information to which individuals have access) underpins a
significant amount of theory linking social structure to economic outcomes. Granovetter (1973) argues
that topological properties of friendship networks, constrained by basic norms of social interaction, em-
power weak ties to deliver information about socially distant opportunities more effectively than strong
ties. He posits that contacts maintained through weak ties typically “move in circles different from our
own and thus have access to information different from that which we receive… [and are therefore]… the
channels through which ideas, influence, or information socially distant from ego may reach him”
(Granovetter 1973: 1371). Burt (1992) argues that networks rich in structural diversity confer “informa-
tion benefits” by providing access to diverse perspectives, ideas and information. As information in local
network neighborhoods tends to be redundant, structurally diverse contacts provide channels through
which novel information flows to individuals from distinct pools of social activity. Redundant informa-
tion is less valuable because many actors are aware of it at the same time, reducing opportunities associ-
ated with its use. Structural redundancy is also inefficient because actors incur costs to maintain redun-
dant contacts while receiving no new information from them (Burt 1992).
In contrast, exposure to diverse ideas, perspectives, and solutions is thought to enable information
arbitrage, the creation of new innovations, and access to economic opportunities. Hargadon and Sutton
(1997) describe how engineers use their structural positions between diverse engineering and scientific
disciplines to broker the flow of information and knowledge from unconnected industrial sectors, creating
novel design solutions. As Burt (2004b) puts it, “creativity is an import-export game,… not a creation
game.” The economic value of information in a network stems from its uneven distribution across actors
and resides in pockets of distinct and diverse pools of information and expertise in local network
neighborhoods. Actors with access to these diverse pools “benefit from disparities in the level and value
of particular knowledge held by different groups…” (Hargadon & Sutton 1997: 717), and one of the key
mechanisms through which network structures are theorized to improve performance is through access to
novel, non-redundant information (Burt 1992).

Network Structure & Information Advantage
5
While the argument that network structures influence performance through their effect on the dis-
tribution of information is intuitive and appealing, the vast majority of empirical work on networks and
information advantage remains ‘content agnostic’ (Hansen 1999: 83), and infers the relationship between
network structure and information structure from evidence of a link between networks and performance
(e.g. Sparrowe et al. 2001, Cummings & Cross 2003). Reagans & Zuckerman (2001) infer that productiv-
ity gains from the external networks of corporate R&D teams are due in part to “information benefits,” “a
broader array of ideas and opportunities,” and access to “different skills, information and experience.”
Burt (1992, 2004a) also makes this empirical leap, inferring that the observed co-variation of wages, pro-
motion, job placement, and creativity with network diversity is due in part to access to diverse and novel
information. Others equate network content with the social function of relationships. For example, Burt
(2000: 45) refers to “network content” as “the substance of relationships, qualities defined by distinctions
such as friendship versus business versus authority.” In one of the first studies to explore this type of net-
work content, Podolny & Baron (1997) showed that while cohesive ties are beneficial in ‘buy-in’ net-
works and for those contacts that have control over the fate of employees, structural holes are important
for collecting advice and information. We take a different view of network content, focused on the subject
matter of communication rather than the social function of relationships.
The limited research that does empirically examine networks and information content has either
focused on identifying tie and network characteristics that facilitate effective knowledge transfers; or on
types of information (e.g. complex or simple; tacit or explicit) most effectively transferred through differ-
ent types of ties. As a result, the fundamental assumption that structurally diverse network contacts pro-
vide access to diverse and novel information remains unexplored. For example, several studies examine
how characteristics of dyadic relationships, like the strength of ties, impact the effectiveness of knowl-
edge transfer, and how knowledge transfer processes in turn affect performance (Granovetter 1973, Uzzi
1996, 1997, Hansen 1999). These studies infer the impact of network structure on the effectiveness of
knowledge sharing from the strength of individual dyadic relationships. Reagans & McEvily (2003) ex-
tend this work by simultaneously examining the effects of tie strength and network structure on the ease
Network Structure & Information Advantage
6
of transferring knowledge between individuals. These studies either examine the strength of dyadic ties or
the impact of network structure on discrete dyadic information transfer events, instead of on the informa-
tion actors receive from all their network contacts in concert. Others examine characteristics of the infor-
mation transferred across different types of ties. For example, Hansen (1999, 2002) and Uzzi (1996,
1997) explore the degree to which knowledge being transferred is tacit or codifiable, simple or complex,
and related or unrelated to a focal actor’s knowledge.
To complement this research, we ask a related, yet fundamentally different question: Do networks
affect the acquisition of diverse and novel information and to what extent does this intermediate mecha-
nism predict performance? In pursuing this question, we undertake two fundamental departures from the
current literature. First, by exploring the relative information content differences among different network
contacts, we explore an actor’s information diversity in relation to the body of information available in
the entire network. Second, we focus on subject matter. Rather than characterizing the simplicity or com-
plexity of information, or the degree to which knowledge is codifiable or tacit, we explore the topical con-
tent being discussed. Both simple and complex information can be either focused or diverse in terms of
subject matter. Complexity and codifiability do not describe whether information is topically similar or
dissimilar, or novel relative to a larger body of knowledge. As the theoretical mechanism linking structure
to performance through information rests on the relative novelty of the information to which actors have
access, these two departures from previous research are critical to effectively exploring the dimensions of
information theorized to drive value in networks.
2.2. A Need for Skepticism
More detailed theoretical and empirical examinations of information advantage are warranted
because it is not obvious that network diversity necessarily delivers more novel information or that novel
information contributes to performance. Four arguments highlight the need for skepticism – the first two
examine whether diverse networks provide access to more novel information; the second two show that
even with new information, productivity need not rise.
Network Structure & Information Advantage
7
First, consider the distinction between novelty across channels and novelty within channels. A
simple model demonstrates that although a diverse network of weak ties (“diverse-weak”) can provide
access to more novel information than a constrained network of strong ties (“constrained-strong”), the
converse is also possible. This indeterminacy arises from a basic tradeoff: While constrained ties favor
redundant information, they are also typically stronger (Granovetter 1973, Burt 1992), implying greater
bandwidth. Weak ties are by their nature lower bandwidth conduits for information (Granovetter 1973,
Burt 1992). Information flows less frequently (Granovetter 1973), with lower complexity (Hansen 1999)
and detail (Uzzi 1999), and along fewer topical dimensions (see Granovetter 1973: p 1361) through weak
ties. This implies that the total amount of novel information flowing within each channel in a diverse net-
work could be lower than the amount of novel information flowing within each channel in a constrained
network, where stronger ties enable thicker communication between actors.3 An ego might therefore re-
ceive greater novelty from either strong yet constrained ties or weak yet diverse ties depending on the
relative importance of bandwidth and bias in determining the type of content received.
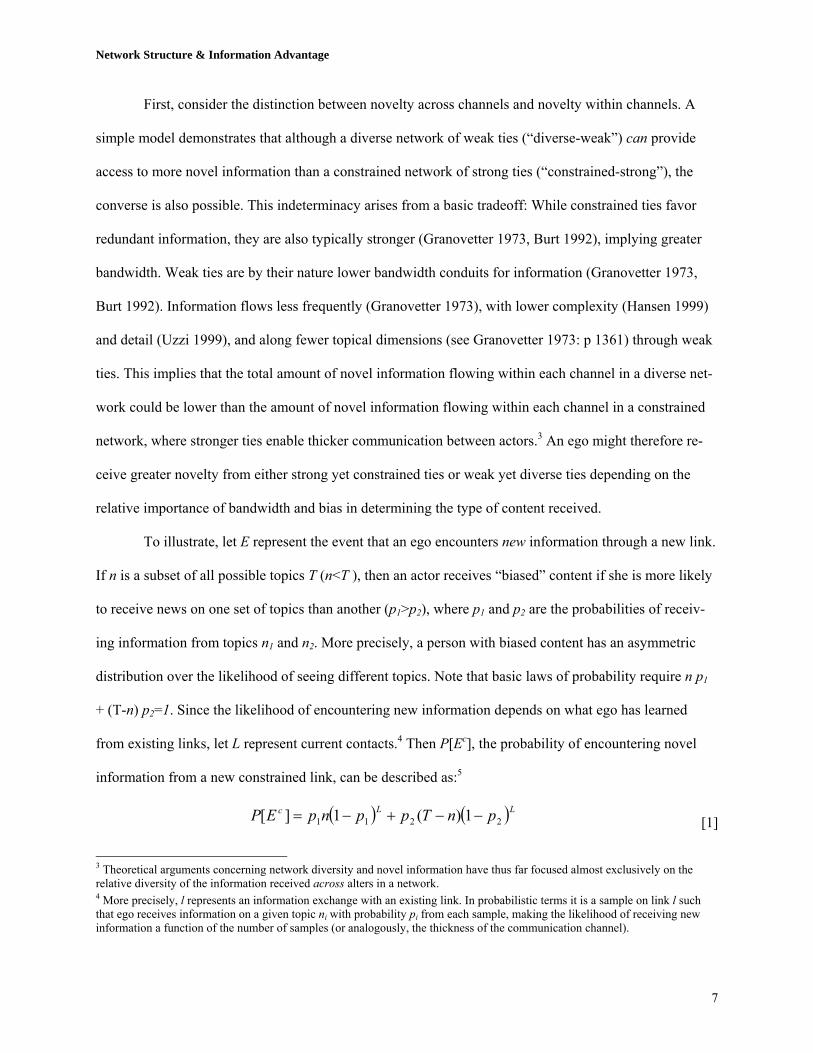
To illustrate, let E represent the event that an ego encounters new information through a new link.
If n is a subset of all possible topics T (n<T ), then an actor receives “biased” content if she is more likely
to receive news on one set of topics than another (p1>p2), where p1 and p2 are the probabilities of receiv-
ing information from topics n1 and n2. More precisely, a person with biased content has an asymmetric
distribution over the likelihood of seeing different topics. Note that basic laws of probability require n p1
+ (T-n) p2=1. Since the likelihood of encountering new information depends on what ego has learned
from existing links, let L represent current contacts.4 Then P[Ec], the probability of encountering novel
information from a new constrained link, can be described as:5
( ) ( )LLc pnTppnpEP 2211 1)(1][ −−+−= [1]
3 Theoretical arguments concerning network diversity and novel information have thus far focused almost exclusively on the relative diversity of the information received across alters in a network. 4 More precisely, l represents an information exchange with an existing link. In probabilistic terms it is a sample on link l such that ego receives information on a given topic ni with probability pi from each sample, making the likelihood of receiving new information a function of the number of samples (or analogously, the thickness of the communication channel).

Network Structure & Information Advantage
8
Unbiased content implies p1= p2, so that Equation 1 reduces to P[ED] = pT(1-p)L, where Ec and ED
represent the events of forging a constrained and a diverse link and getting new information.6 To model
the more frequent communication of the higher bandwidth tie, let B represent additional chances to cover
new material over the constrained link during any given interval. Simplifying with n2=T-n1 gives:
( ) ( ) ( ) ( ) BLBLLL
BL
Ll
cC pnppnppnppnpEPEP +++
=
−+−+−+−== ∑ 222111222111 11...11][][ [2]
To see that a constrained-strong tie could offer more novel information, let bias be negligible with p1 = p2
+ ε so that P[Ec] ≈ P[ED]. Then choose any B large enough such that the following inequality is strict:
][][...][][][...][][ 11DL
DBL
DL
DL
cBL
cL
cL EPEPEPEPEPEPEP >++≈++ ++++ [3]
This demonstrates the original claim. When the advantage of bandwidth swamps the disadvantage of bias,
an ego always prefers the constrained-strong tie to the diverse-weak tie to increase the chances of encoun-
tering novel information.
To see when an diverse-weak tie could be preferred, let a “group think” network spread its band-
width only over the subset of n topics with probability p1=B/T (such bias necessarily constrains p2 ≈ ε).
For ease of simplification, let n = T/B. Then algebra reduces the relative probabilities to:
][111][ DL
LLcL EP
TLBEP =⎟
⎠⎞
⎜⎝⎛ −<⎟
⎠⎞
⎜⎝⎛ −= [4]
This alternative case demonstrates the counterclaim. Although ][...][][ cBL
cL
CL EPEPEP ++= and increas-
ing B adds more terms to ][ CLEP and none to ][ D
LEP , it also causes each term to approach 0 faster. No
matter how large the bandwidth on constrained ties, there always exists a fixed number of links L such
that link L+1 should be an unconstrained tie. When the disadvantage of bias swamps the advantage of
bandwidth, an ego always prefers the diverse-weak tie to the constrained-strong tie to increase chances of
encountering novel information. While an enormous range of intermediate cases span these two extremes,
5 Since our purpose is illustrative rather than proof theoretic, we refrain from presenting non-essential primatives and assump-tionns here and present the derivation of Equation 1 in Appendix A.

Network Structure & Information Advantage
9
conditions exist when a person could always prefer one or the other type of link depending on bias,
bandwidth, and the number of links already present.
Second, greater structural awareness of actors in constrained networks may enable them to differ-
entiate their information flows and avoid transmitting redundant information. Prior research suggests that
actors in constrained networks are more aware of other actors, what they know and whom they know.
Coleman’s (1988) argument about the value of network closure relies in part on actors’ awareness of the
knowledge of others in their immediate network. Information exchange in constrained networks may
therefore exhibit greater specialization as actors are more aware of the information flowing to and from
other actors in the network. Actors may avoid transmitting repetitive information knowing that such in-
formation is flowing to their contacts from others in the network. For example, two immediate subordi-
nates working on a portfolio of projects for a manager may divide their information flows across subjects
to maximize the value of their limited communication time with the manager. Such optimization may be
more likely in organizational settings where time is scarce and information is critical to work.
Third, other mechanisms can explain the observed relationship between network diversity and
performance. Network contacts could provide resources other than information (e.g. Podolny & Barron
1997), there could be power or control benefits to network structure independent of information flows
(e.g. Burt 1992), and structural diversity could reduce dependence, place individuals in favorable trading
relationships (e.g. Emerson 1962) or entitle them to benefits from informal reciprocity (e.g. Cook, Emer-
son & Gilmore 1983). These alternate mechanisms could also explain the link between structural diversity
and performance without any prediction concerning actors’ information access. Indeed, our empirical
results in §4.3 suggest that non-information benefits to network structure also affect productivity.
Finally, several fundamental results from information economics show that complex non-
linearities in the value of information affect the quality of decision making. Arrow (1985) demonstrates
that the expected payoffs from decisions about uncertain events are concave in the amount of information
6 The likelihood of encountering novel information (for both constrained and unconstrained ties) decreases strictly and asymp-totically toward 0 with each additional tie L. This exactly mirrors the pattern we observe empirically as shown later in Figure 5.

Network Structure & Information Advantage
10
the decision maker obtains, implying diminishing marginal returns to more information. As measured by
decision relevance, value only increases when new information leads to different and better decisions (Ar-
row 1985, Hirshleifer 1973). Information is novel if it provides an alternate perspective on a known topic
or knowledge of an altogether new topic. As new information on known topics accumulates, beliefs tend
to converge on a particular view of the world, making further confirmation unnecessary. Expected con-
vergence under Bayes' Rule, for example, exhibits clear diminishing returns such that, beyond some
threshold, more news has no more value. As new information on new topics accumulates, value is likely
to exhibit diminishing marginal returns due to decision irrelevance. As actors’ information space becomes
disparate, ideas are less likely to connect in complementary ways and each bit of information is less likely
to be relevant to the space of decisions and actions the actor is interested in. We find evidence of dimin-
ishing marginal returns to novel information in our own theoretical model above, and in our empirical
analysis below. Collectively, these arguments suggest that non-linearities may exist in relationships be-
tween networks, information and performance, and they help explain the current lack of empirical evi-
dence relating novel information to performance – evidence we seek to provide.
2.3. Network Determinants of Information Advantage
Two network characteristics in particular are theorized to drive access to diverse, novel informa-
tion: network size and network diversity. These characteristics are fundamental because they represent the
two dimensions of structure most directly related to information acquisition. As Burt (1992: 16) argues
“everything else constant, a large, diverse network is the best guarantee of having a contact present where
useful information is aired…”
Network Size. The size of i’s network (Si) is simply the number of contacts with whom i ex-
changes at least one message. Size is the most familiar network characteristic related to information bene-
fits and is a good proxy for a variety of characteristics, like degree centrality, betweenness centrality and
network reach, which describe the breadth and range of actors’ networks (see Burt 1992: 12). In our data,
network size is significantly correlated with degree centrality (ρ = .70; p < .001), betweeness centrality (ρ
= .77; p < .001), and reach (ρ = .56; p < .001), demonstrating its value as a proxy for network breadth.
Network Structure & Information Advantage
11
The greater the size of an actor’s network, the more likely she is to have access to more information and
to multiple social circles increasing the diversity of her information. However, size may not matter if each
additional contact is embedded in the same social circles, biasing the information she receives. Network
diversity may therefore be more important in providing access to diverse information.
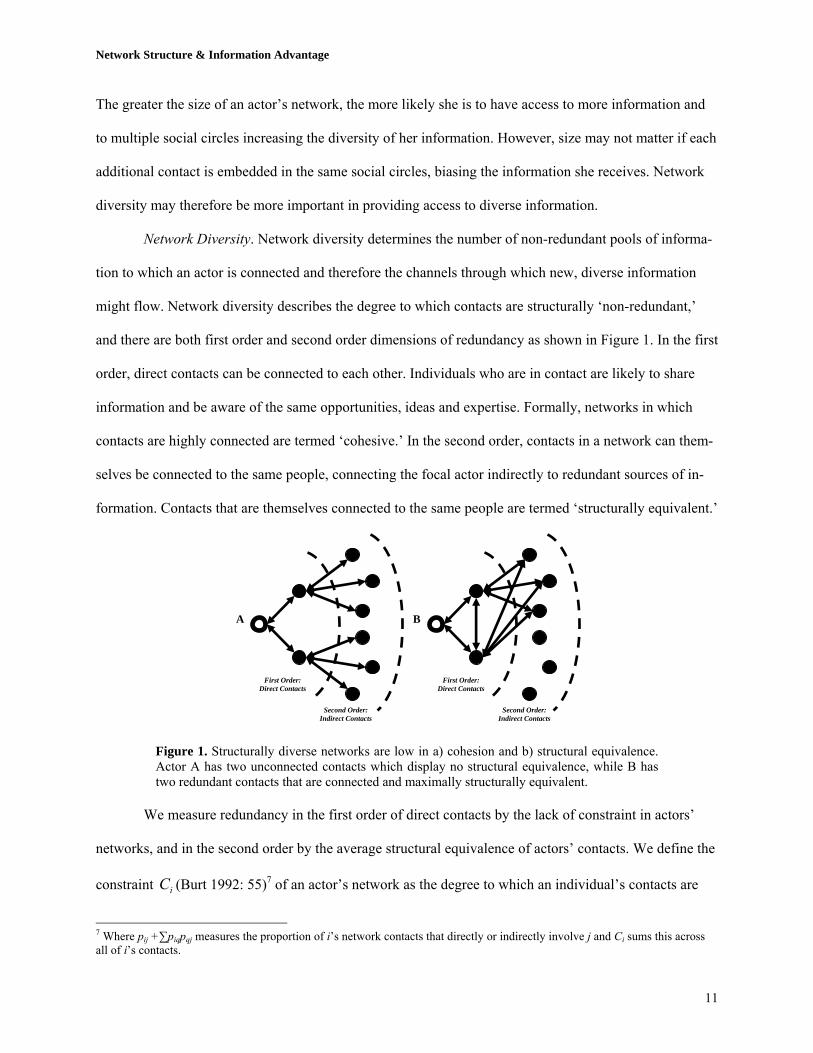
Network Diversity. Network diversity determines the number of non-redundant pools of informa-
tion to which an actor is connected and therefore the channels through which new, diverse information
might flow. Network diversity describes the degree to which contacts are structurally ‘non-redundant,’
and there are both first order and second order dimensions of redundancy as shown in Figure 1. In the first
order, direct contacts can be connected to each other. Individuals who are in contact are likely to share
information and be aware of the same opportunities, ideas and expertise. Formally, networks in which
contacts are highly connected are termed ‘cohesive.’ In the second order, contacts in a network can them-
selves be connected to the same people, connecting the focal actor indirectly to redundant sources of in-
formation. Contacts that are themselves connected to the same people are termed ‘structurally equivalent.’
Figure 1. Structurally diverse networks are low in a) cohesion and b) structural equivalence. Actor A has two unconnected contacts which display no structural equivalence, while B has two redundant contacts that are connected and maximally structurally equivalent.
We measure redundancy in the first order of direct contacts by the lack of constraint in actors’
networks, and in the second order by the average structural equivalence of actors’ contacts. We define the
constraint iC (Burt 1992: 55)7 of an actor’s network as the degree to which an individual’s contacts are
7 Where pij +∑piqpqj measures the proportion of i’s network contacts that directly or indirectly involve j and Ci sums this across all of i’s contacts.
First Order: Direct Contacts
Second Order: Indirect Contacts
First Order: Direct Contacts
Second Order: Indirect Contacts
A B

Network Structure & Information Advantage
12
connected to each other, such that ,2
∑ ∑ ⎟⎟⎠
⎞⎜⎜⎝
⎛+=
j qqjiqiji pppC jiq ,≠ ; and the structural diversity iD of an
actor’s network as iC−1 . We use the standard definition of the structural equivalence of two actors,
measured as the Euclidean distance of their contact vectors.8 In our setting, we expect the disadvantage of
bias to swamp the advantage of bandwidth. Interviews indicate that the dimensionality of information
content in executive recruiting is limited (in the parlance of our model T, the space of topics, is small)
meaning thicker channels are not as necessary to communicate information on more topics. Therefore, as
individuals communicate with more contacts, and as individuals’ networks connect them to actors that are
themselves unconnected and structurally non-equivalent, we expect the information they receive to be
more diverse and we expect them to receive more total novel information:
H1: Network size and network diversity are positively associated with receiving more diverse in-formation and less redundant information. While a greater number of contacts are likely to provide access to more diverse, non-redundant
information, the probability that an additional contact will have novel information is likely decreasing in
the size of an individual’s network. This expectation is a direct result of our model and is also supported
by prior empirical evidence on network formation. Social networks tend to cluster into homophilous
cliques (for a review see McPherson, Smith-Loving, & Cook 2001). Since individuals usually make con-
nections through contacts they already have, in bounded networks the likelihood that a marginal contact
will be redundant should increase in the number of people already known.9 As actors establish relation-
ships with a finite set of alters, the probability that a marginal relationship will be structurally non-
redundant should decrease as possible alters in the network are exhausted. We therefore expect marginal
increases in information diversity and network diversity are decreasing in network size:
H2a: The marginal increase in information diversity is decreasing in network size.
8 Euclidean distance measures the square root of the sum of squared distances between two contact vectors, or the degree to which contacts are connected to the same people. We measure the average structural equivalence of actors’ direct contacts. 9 We focus on internal networks due to difficulties in collecting reliable data outside the firm and in estimating accurate network structures without access to whole network data (see Barnes 1979, Marsden 1990). As Burt (1992: 172) demonstrates however “little evidence of hole effects [are] lost... when sociometric choices [are] restricted to relations within the firm.”
Network Structure & Information Advantage
13
H2b: The marginal increase in structural network diversity is decreasing in network size. 2.4. Non-Network Determinants of Information Advantage
Several other factors could affect access to diverse information and individual performance. We
therefore examine five possible alternative explanations as controls: demography, human capital, total
communication volume, unobservable individual characteristics, and temporal shocks to the flow of in-
formation in the firm. Demography can influence performance, learning capabilities and the variety of
ideas to which individuals have access (e.g. Ancona & Caldwell 1992, Reagans & Zuckerman 2001).
Older employees may have prior knowledge on a wider variety of topics or be more aware of experts.
Employment discrimination and interpersonal difference could also impact the relative performance and
information seeking habits of men and women. We therefore control for the age and gender of employees.
Greater industry experience, education or individuals’ organizational position could also create variation
in access to diverse and novel information and performance. As individuals gain experience, they may
collect expertise across several domains, or specialize and focus their work and communication on a lim-
ited number of topics. We therefore control for education, industry experience and organizational posi-
tion.10 As previous studies have demonstrated the importance of controlling for communication volume to
isolate structural effects (e.g. Cummings & Cross 2003), we include controls for total email communica-
tion. At the same time, some employees may simply be more social or more ambitious, creating variation
in information seeking habits and performance. To control for unobservable individual characteristics we
test fixed effects specifications of each hypothesis. Finally, temporal shocks could affect demand for the
firm’s services and information seeking activities associated with more work.11 These exogenous shocks
to demand could drive simultaneous increases in project workload, information seeking, and revenue gen-
eration creating a spurious correlation between information flows and output. We therefore control for
temporal variation with dummy variables for each month and year.
2.5. The Setting – Executive Recruiting
10 Employees are partners, consultants or researchers – we include dummy variables for each of these positions. 11 In our data, business exhibits seasonal variation, with demand for the firm’s services picking up sharply in January and declin-ing over the next eight months. There may also be transitory shocks to demand in a given month or year.

Network Structure & Information Advantage
14
We studied a medium-sized executive recruiting firm with fourteen offices in the U.S. Interviews
revealed that the core of executive recruiters’ work involves matching job candidates to clients’ require-
ments. This matching process is information-intensive and requires activities geared toward assembling,
analyzing, and making decisions based on information gathered from team members, other firm employ-
ees, and contacts outside the firm. Qualitative studies show that executive recruiters fill “brokerage posi-
tions” between clients and candidates and rely heavily on information flows to complete their work effec-
tively (Finlay & Coverdill 2000). In our context, more precise or accurate information about the candidate
pool reduces time wasted interviewing unsuitable candidates and increases the quality of placement deci-
sions (Bulkley & Van Alstyne 2004). In addition, the sharing of procedural information can improve effi-
ciency and effectiveness (Szulanski 1996) and executive recruiters report learning to deal with difficult
situations through communication with peers.
Recruiters generate revenue by filling vacancies rather than billing hourly. Therefore, the speed
with which vacancies are filled is an important intermediate measure of workers’ productivity. Contract
completion implies that recruiters have met a client’s minimum thresholds of candidate fit and quality.
Project duration can therefore be interpreted as a quality controlled measure of productivity. In assessing
individual recruiters’ performance, we measure revenues generated per month, projects completed per
month and average project duration per month. Effective recruiters rely on being “in the know” and deliv-
ering candidates that display specific professional and personal attributes. To accomplish this, recruiters
must be aware of several different information channels to match different candidates with different client
requirements. We therefore expect recruiters with diverse and non-redundant information to complete
more projects, to complete projects faster, and to generate more revenue for the firm per unit time.
H3: Access to non-redundant and diverse information is positively associated with more project completions, faster project completions and more revenue generated per unit time.
While we expect network structure to impact performance through its effects on access to diverse
and novel information, there could be other intermediate mechanisms tying structure to performance as
Network Structure & Information Advantage
15
outlined in § 2.2. We therefore hypothesize that network diversity is positively associated with perform-
ance even controlling for access to novel information.
H4: Network diversity is positively associated with more project completions, faster project com-pletions and more revenue generated per unit time, controlling for access to novel information.
Finally, as argued in § 2.2, there is reason to suspect that there are diminishing marginal returns to novel
information. In particular, our formal model showed that the likelihood of novel information decreases
with each additional link. Further, information economic arguments show that, regardless of source, in-
cremental news has no benefit past the point of decision relevance. Therefore:
H5: The marginal increase in performance associated with access to novel information is de-creasing in the amount of novel information to which actors have access.
3. Methods
By analyzing email communication patterns and message content, we are able to match informa-
tion channels to the subject matter of the content flowing through them. Our empirical approach also ad-
dresses another methodological puzzle that has historically troubled network research. In traditional net-
work studies, a fundamental tradeoff exists between comprehensive observation of whole networks and
the accuracy of respondents’ recall. Most research elicits network data from respondents who have diffi-
culty recalling their networks (e.g. Bernard et. al 1981), especially among individuals socially distant to
themselves (Krackhardt & Kilduff 1999). The inaccuracy of respondent recall and the bias associated
with recall at social distance creates inaccurate estimates of network variables (Kumbasar, Romney &
Batchelder 1994), forcing most empirical studies to artificially limit the boundary of estimated networks
to local areas around respondents (e.g. Reagans & McEvily 2003). Such empirical strategies create esti-
mation challenges due to the sensitivity of network metrics to the completeness of data (Marsden 1990).
If important areas of the network are not captured, estimates of network positions can be biased. Further-
more, as our content measures consider the similarity of topics across the entire network, poor coverage
of the firm could bias our estimates of the relative novelty or diversity of topics discussed via email. We
therefore take several steps to ensure a high level of participation (described below). As 87% of eligible
recruiters agreed to participate, and given that our inability to observe the remaining 13% is limited to

Network Structure & Information Advantage
16
messages between two employees who both opted out of the study, we collect email network and individ-
ual content data with nearly full coverage of the firm.12
3.1. Data
Our data come from four sources: (i) detailed accounting records of individual project assign-
ments and performance, (ii) email data from the corporate server, (iii) survey data on demographic char-
acteristics, human capital and information seeking behaviors, and (iv) data from the web site Wikipe-
dia.org used to validate our analytical models of information diversity. Internal accounting data describe:
revenues generated by individual recruiters, contract start and stop dates, projects handled simultaneously
by each recruiter, project team composition, and job levels of recruiters and placed candidates. These pro-
vide excellent performance measures that can be normalized for quality. Email data cover 10 months of
complete email history at the firm. The data were captured from the corporate mail server during two
equal periods from October 1, 2002 to March 1, 2003 and from October 1, 2003 to March 1, 2004. Par-
ticipants received $100 in exchange for permitting use of their data, resulting in 87% coverage of eligible
recruiters and more than 125,000 email messages captured. Details of email data collection are described
by Aral, Brynjolfsson & Van Alstyne (2006). The third data set contains survey responses on demo-
graphic and human capital variables such as age, education, industry experience, and information-seeking
behaviors. Survey questions were generated from a review of relevant literature and interviews with re-
cruiters. Experts in survey methods at the Inter-University Consortium for Political and Social Science
Research vetted the survey instrument, which was then pre-tested for comprehension and ease-of-use.
Individual participants received $25 for completed surveys and participation exceeded 85%. The fourth
dataset is a set of 291 entries collected from Wikipedia.org, which we describe in detail in the section per-
taining to the validity of our information diversity metrics (see Appendix C).
12 F-tests comparing performance levels of those who opted out with those who remained did not show statistically significant differences. F (Sig): Rev02 2.295 (.136), Comp02 .837 (.365), Multitasking .386 (.538).
Network Structure & Information Advantage
17
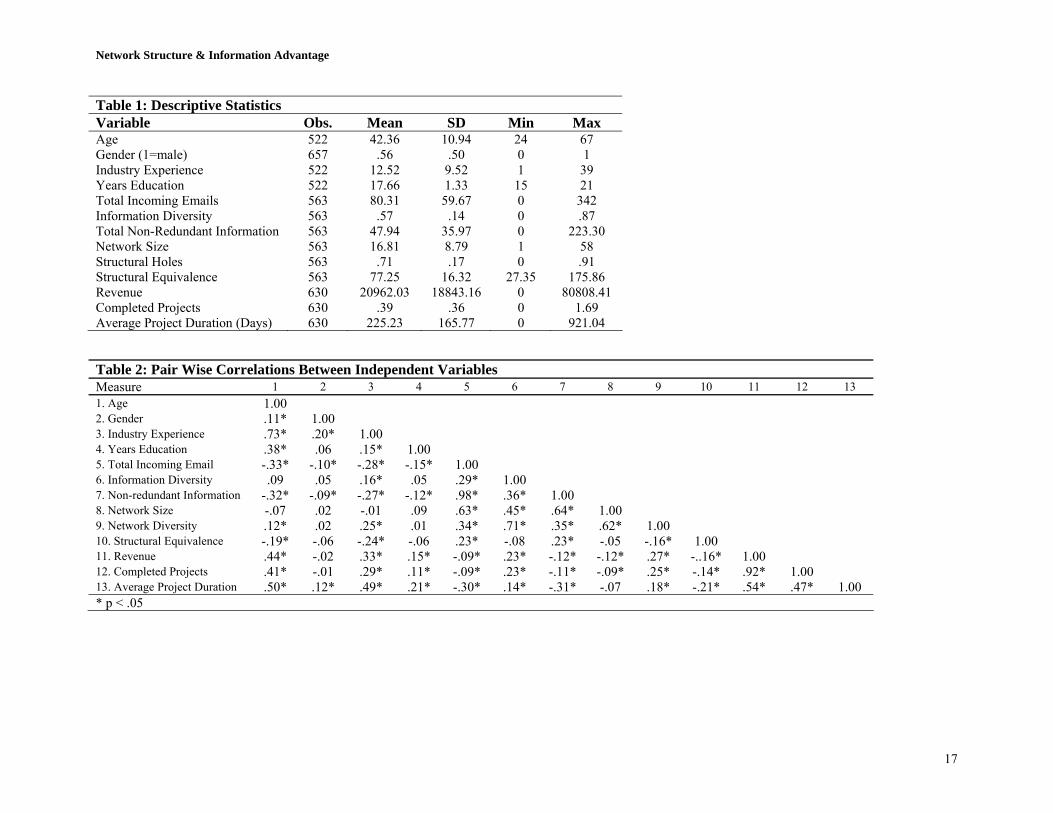
Table 1: Descriptive Statistics Variable Obs. Mean SD Min Max Age 522 42.36 10.94 24 67 Gender (1=male) 657 .56 .50 0 1 Industry Experience 522 12.52 9.52 1 39 Years Education 522 17.66 1.33 15 21 Total Incoming Emails 563 80.31 59.67 0 342 Information Diversity 563 .57 .14 0 .87 Total Non-Redundant Information 563 47.94 35.97 0 223.30 Network Size 563 16.81 8.79 1 58 Structural Holes 563 .71 .17 0 .91 Structural Equivalence 563 77.25 16.32 27.35 175.86 Revenue 630 20962.03 18843.16 0 80808.41 Completed Projects 630 .39 .36 0 1.69 Average Project Duration (Days) 630 225.23 165.77 0 921.04
Table 2: Pair Wise Correlations Between Independent Variables Measure 1 2 3 4 5 6 7 8 9 10 11 12 13 1. Age 1.00 2. Gender .11* 1.00 3. Industry Experience .73* .20* 1.00 4. Years Education .38* .06 .15* 1.00 5. Total Incoming Email -.33* -.10* -.28* -.15* 1.00 6. Information Diversity .09 .05 .16* .05 .29* 1.00 7. Non-redundant Information -.32* -.09* -.27* -.12* .98* .36* 1.00 8. Network Size -.07 .02 -.01 .09 .63* .45* .64* 1.00 9. Network Diversity .12* .02 .25* .01 .34* .71* .35* .62* 1.00 10. Structural Equivalence -.19* -.06 -.24* -.06 .23* -.08 .23* -.05 -.16* 1.00 11. Revenue .44* -.02 .33* .15* -.09* .23* -.12* -.12* .27* -..16* 1.00 12. Completed Projects .41* -.01 .29* .11* -.09* .23* -.11* -.09* .25* -.14* .92* 1.00 13. Average Project Duration .50* .12* .49* .21* -.30* .14* -.31* -.07 .18* -.21* .54* .47* 1.00 * p < .05
Network Structure & Information Advantage
18
Descriptive statistics and correlations are provided in Tables 1 & 2. An observation is a person-month. 13
3.2.1. Modeling & Measuring Topics in Email: A Vector Space Model of Communication Content
We model and measure the diversity of information in individuals’ email using a Vector Space
Model of the topics present in email content (e.g. Salton et. al. 1975).14 Vector Space Models are widely
used in information retrieval and search query optimization algorithms to identify documents that are
similar to each other or pertain to topics identified by search terms. They represent textual content as vec-
tors of topics in multidimensional space based on the relative prevalence of topic keywords. In our model,
each email is represented as a multidimensional ‘topic vector’ whose elements are the frequencies of key-
words in the email. The prevalence of certain keywords indicates that a topic that corresponds to those
keywords is being discussed. For example, an email about pets might include frequent mentions of the
words “dog,” “cat,” and “veterinarian;” while an email about econometrics might mention the words
“variance,” “specification,” and “heteroskedasticity.” The relative topic similarity of two emails can then
be assessed by topic vector convergence or divergence – the degree to which the vectors point in the same
or orthogonal directions.15 To measure content diversity, we characterize all emails as topic vectors and
measure the variance or spread of topic vectors in individuals’ inboxes and outboxes. Emails about simi-
lar topics contain similar language on average, and vectors used to represent them are therefore closer in
multidimensional space, reducing their collective variance or spread.
3.2.2. Construction of Topic Vectors & Keyword Selection
13 We wrote and developed email capture software specific to this project and took multiple steps to maximize data integrity. New code was tested at Microsoft Research Labs for server load, accuracy and completeness of message capture, and security exposure. To account for differences in user deletion patterns, we set administrative controls to prevent data expunging for 24 hours. The project went through nine months of human subjects review and content was masked using cryptographic techniques to preserve privacy (see Van Alstyne & Zhang 2003). Spam messages were excluded by eliminating external contacts who did not receive at least one message from someone inside the firm. 14 While email is not the only source of employees’ communication, it is one of the most pervasive media that preserves content. It is also a good proxy for other social sources of information in organizations where email is widely used. In our data, the aver-age number of contacts by phone (ρ= .30, p < .01) and instant messenger (ρ = .15, p < .01) are positively and significantly corre-lated with email contacts. Our interviews indicate that in our firm, email is a primary communication media. 15 Each email may pertain to multiple topics based on keyword prevalence, and topic vectors representing emails can emphasize one topic more than another based on the relative frequencies of keywords associated with different topics. In this way, our framework captures nuances of emails that may pertain to several topics of differing emphasis.
Network Structure & Information Advantage
19
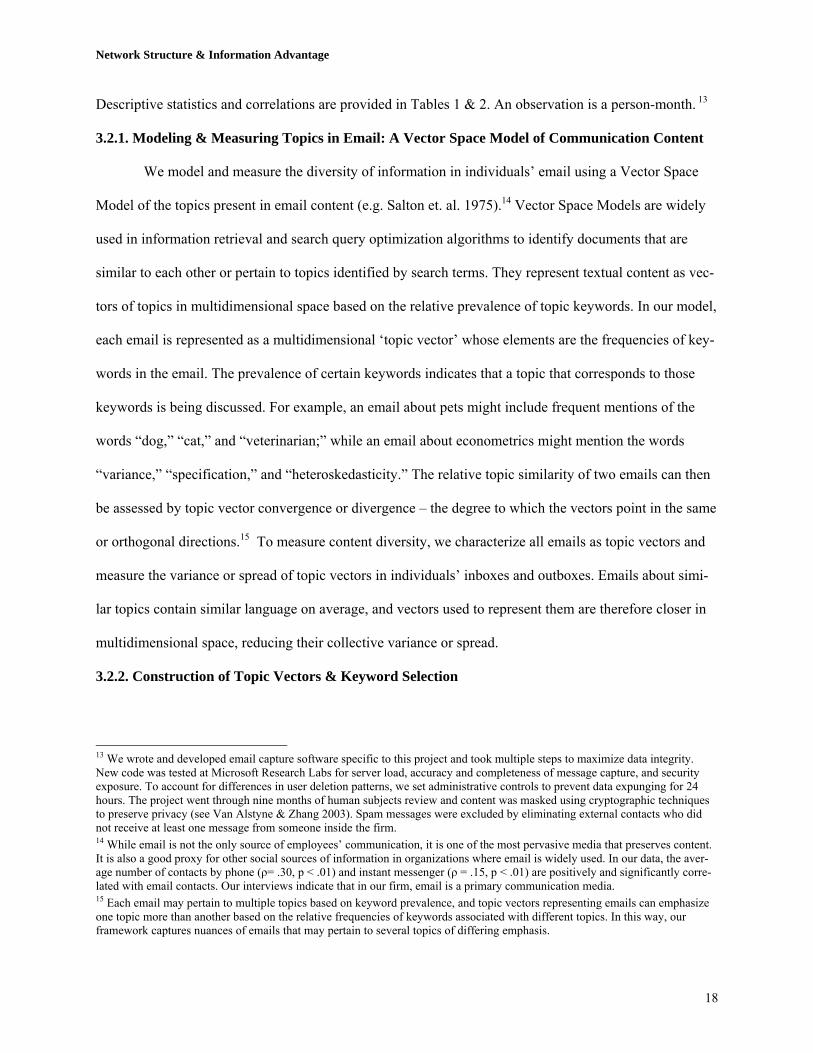
Vector Space Models characterize documents iD by keywords jk weighted according to their fre-
quency of use (or with 0 weights for words excluded from the analysis – called “stop words”). Each docu-
ment is represented as an n-dimensional vector of keywords in topic space,
),...,,( 21 iniii kkkD = ,
where ijk represents the weight of the jth keyword.
),,( 3211 kkkD =
),,( 3212 kkkD ′′′=
),,( 3213 kkkD ′′′′′′=
1K
2K
3K
),,( 3211 kkkD =
),,( 3212 kkkD ′′′=
),,( 3213 kkkD ′′′′′′=
1K
2K
3K
Figure 2. A three dimensional Vector Space Model of three documents is shown on the left. A Vector Space Model containing a test inbox with emails clustered along three dimensions is shown on the right.
Weights define the degree to which a particular keyword impacts the vector characterization of a docu-
ment. Words that discriminate topics are weighted more heavily than words less useful in distinguishing
topics. As terms that appear frequently in a document are typically thematic and relate to the document’s
subject matter, we use the ‘term frequency’ of keywords in email as weights to construct topic vectors and
refine our keyword selection with criteria designed to select words that distinguish and represent topics.16
In order to minimize their impact on the clustering process, we initialized our data by removing
common “stop words,” such as “a, “an,” “the,” “and,” and other common words with high frequency
across all emails that are likely to create noise in content measures. We then implemented an iterative, k-
means clustering algorithm to group emails into clusters that use the same words, similar words or words
16 Another common weighting scheme is the ‘term-frequency/inverse-document frequency.’ However, we use a more sophisticated keyword selection refinement method specific to this dataset described in detail in the remainder this section.

Network Structure & Information Advantage
20
that frequently appeared together.17 The result of iterative k-means clustering is a series of assignments of
emails to clusters based on their language similarity. Rather than imposing exogenous keywords on the
topic space, we extract topic keywords likely to characterize topics by using a series of algorithms guided
by three basic principles.
First, in order to identify distinct topics in our corpus, keywords should distinguish topics from
one another. We therefore chose keywords that maximize the variance of their mean frequencies across k-
means clusters. This refinement favors words with widely differing mean frequencies across clusters,
suggesting an ability to distinguish between topics. In our data, we find the coefficient of variation of the
mean frequencies across topics to be a good indicator of this dispersion.18
( )M
Mmn
C ii
v
∑ −=
21
Second, keywords should represent the topics they are intended to identify. In other words, key-
words identifying a given topic should frequently appear in emails about that topic. To achieve this goal
we chose keywords that minimize the mean frequency variance within clusters, favoring words that are
consistently used across emails discussing a particular topic:19
( )c
c ici
i M
MfITF
2∑∑ −
=
Third, keywords should not occur too infrequently. Infrequent keywords will not represent or dis-
tinguish topics and will create sparse topic vectors that are difficult to compare. We therefore select high
frequency words (not eliminated by the “stop word” list of common words) that maximize the inter-topic
17 K-means clustering generates clusters by locally optimizing the mean squared distance of all documents in a corpus. The algo-rithm first creates an initial set of clusters based on language similarities, computes the ‘centriod’ of each cluster, and then reas-signs documents to clusters whose centriod is the closest to that document in topic space. The algorithm stops iterating when no reassignment is performed or when the objective function falls below a pre-specified threshold. 18 The coefficient of variation is particularly useful due to its scale invariance, enabling comparisons of datasets, like ours, with heterogeneous mean values (Ancona & Caldwell 1992). To ease computation we use the square of the coefficient of variation, which produces a monotonic transformation of the coefficient without affecting our keyword selection. 19 i indexes emails and c indexes k-means clusters. We squared the variation to ease computation as in footnote 18.
Network Structure & Information Advantage
21
coefficient of variation and minimize intra-topic mean frequency variation. This process generated topical
keywords from usage characteristics of the email communication of employees at our research site.20
3.2.3. Measuring Email Content Diversity
Using the keywords generated by our usage analysis, we populated topic vectors representing the
subject matter of the emails in our data. We then measured the degree to which the emails in an individual
employee’s inbox or outbox were focused or diverse by measuring the spread or variance of their topic
vectors. We created five separate diversity measurement specifications based on techniques from the in-
formation retrieval, document similarity and information theory literatures. The approach of all five
measures is to compare individuals’ emails to each other, and to characterize the degree to which emails
are about a set of focused topics, or rather about a wider set of diverse topics. We used two common
document similarity measures (Cosine similarity and Dice’s coefficient) and three measures enhanced by
an information theoretic weighting of emails based on their “information content.”21 We performed exten-
sive validation tests of our diversity measures and their correlations, including application to an inde-
pendent dataset from Wikipedia. A detailed description of the validation process and results appears in
Appendix C. As all diversity measures are highly correlated (~ corr = .98; see Appendix B), our specifica-
tions use the average cosine distance of employees’ incoming email topic vectors Iijd from the mean vec-
tor of their topic space IiM to represent incoming information diversity ( I
iID ):
( )( )N
MdCosID
N
j
Ii
Iij
Ii
∑== 1
2,, where:
∑∑∑ ×
=•
=22
),(Mjij
j Mjij
ii
iiij
ww
ww
MdMd
MdCos , such that 10 ≤≤ IiID .
This measure aggregates the cosine distance of email vectors in an inbox from the mean topic vector of
that inbox, approximating the spread or variance of topics in incoming email for a given individual. We
measure the total amount of i’s incoming email communication as a count of incoming email messages,
20 We conducted sensitivity analysis of our keyword selection process by choosing different thresholds at which to select words based on our criteria and found results were robust to all specifications and generated keyword sets more precise than those used in traditional term frequency/inverse document frequency weighted vector space models that do not refine keyword selection.

Network Structure & Information Advantage
22
∑= j jiIi mE , where mji represents a message sent from j to i; and the total amount of non-redundant
information flowing to each actor i )( IiNRI as diversity times total incoming email: )*( I
iIi
Ii IDENRI = .
3.3. Statistical Specifications
We began by examining the structural determinants of access to diverse and novel information.
We first estimated an equation relating network structure to the diversity of information flowing into ac-
tors’ email inboxes using pooled OLS specifications controlling for individual characteristics and fixed
effects models on monthly panels of individuals’ networks and information diversity.22 The estimating
equation is specified as follows:
itm
mjij
jititititIiti
Iit MonthBHCBSENDNSNSEID εβββββγ ++++++++= ∑∑43
2321 [5],
where IitID represents the diversity of the information in a given individual’s inbox, I
itE represents the
total number of incoming messages received by i, itNS represents the size of i’s network, 2itNS repre-
sents network size squared, itND represents structural diversity (measured by one minus constraint),
itSE represents average structural equivalence, jij
j HC∑β represents controls for human capital and
demographic variables (Age, Gender, Education, Industry Experience, and Managerial Level), and
Monthm
m∑β represents temporal controls for each month/year.
We then examined the relationship between network structure and the total amount of novel in-
formation flowing into actors’ email inboxes ( IitNRI ), again testing pooled OLS and fixed effects specifi-
cations using the following model:
itm
mjij
jititititiIit MonthBHCBSENDNSNSNRI εββββγ +++++++= ∑∑43
221 [6].
21 Information Content is used to describe how informative a word or phrase is based on its level of abstraction. Formally, the information content of a concept c is quantified as its negative log likelihood –log p(c). 22 We focus in this paper on incoming information for two reasons. First, we expect network structure to influence incoming information more than outgoing information. Second, the theory we intend to test is about the information to which individuals have access as a result of their network structure, not the information individuals send. These dimensions are highly correlated.
Network Structure & Information Advantage
23
To explore the mechanisms driving the non-linear relationship between network size and infor-
mation diversity, we tested the hypothesis (2b) that while structural diversity is increasing in size, there
are diminishing marginal diversity returns to size in bounded networks. If this is the case, we should see a
non-linear positive relationship between network size and structural diversity, such that the marginal in-
crease in structural diversity is decreasing in size in the following model:
itm
mjij
jititiit MonthBHCBNSNSND εββγ +++++= ∑∑221 [7].
Finally, we tested the relationship between non-redundant information ( IitNRI ) and performance
( itP ), and included our measure of structural network diversity ( itND ) in the specification.
itm
mjij
jititIitiit MonthBHCBNSNDNRIP εβββγ ++++++= ∑∑321 [8].
If information benefits to network diversity exist, network diversity should be positively associated with
access to diverse and non-redundant information, and non-redundant information should be positively
associated with performance. If network diversity confers additional benefits beyond information advan-
tage (such as power or favorable trading conditions) network diversity should contribute to performance
beyond its contribution through information diversity.23 Finally, if there are diminishing marginal returns
to novel information, we should see a non-linear relationship between novel information and productivity.
4. Results
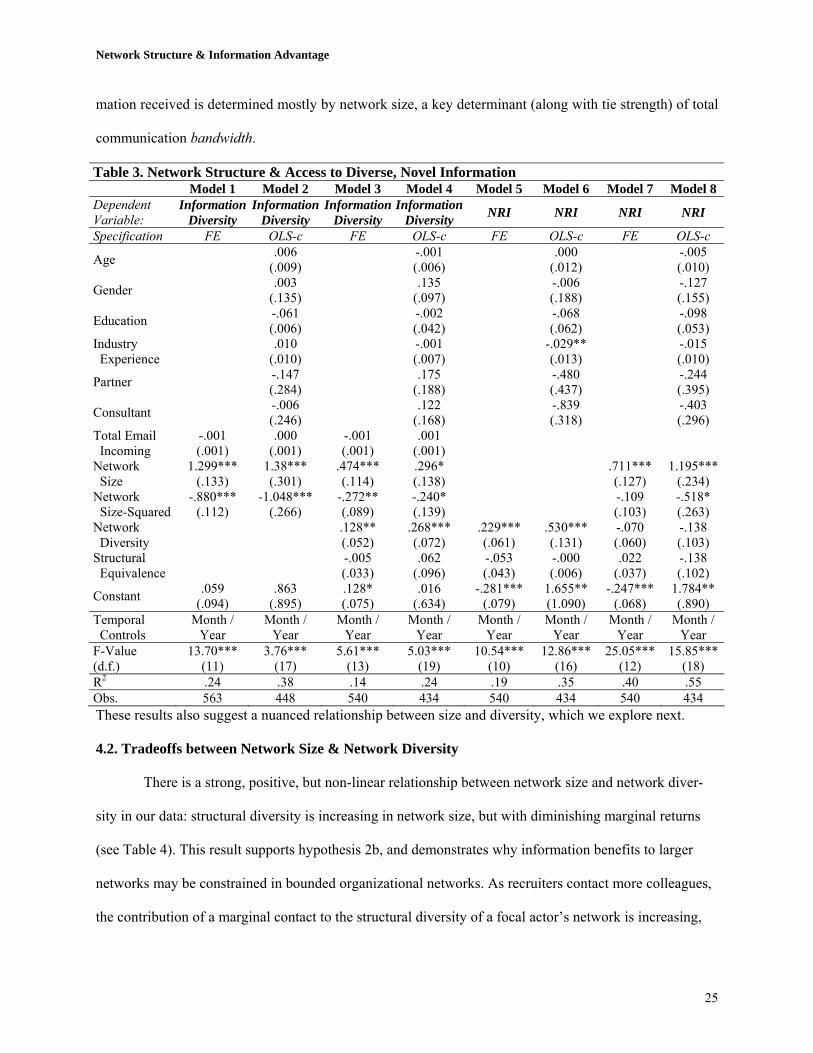
4.1. Network Structure & Access to Diverse, Non-Redundant Information
We first estimated the relationships between network size, network diversity and access to diverse
information controlling for demographic factors, human capital, unobservable individual characteristics,
temporal shocks and the total volume of communication. Our results, shown in Table 3 Models 1-4, dem-
onstrate that the diversity of information flowing to an actor is increasing in the actor’s network size and
23 We were unable to reject the hypothesis of no heteroskedasticity and report standard errors according to the White correction (White 1980). White’s approach is conservative. Estimated coefficients are unbiased but not efficient. In small samples, we may observe low t-statistics even when variables exert a real influence. As there may be idiosyncratic error at the level of individuals, for OLS analyses we report robust standard errors clustered by individual. Clustered robust standard errors are robust to correla-tions within observations of each individual, but are never fully efficient. They are conservative estimates of standard errors.
Network Structure & Information Advantage
24
network diversity, while the marginal increase in information diversity is decreasing in network size, sup-
porting hypotheses 1 and 2a. A one standard deviation increase in the size of recruiters’ networks (ap-
proximately 8 additional contacts) is associated with a 1.2 standard deviation increase in information di-
versity; while the coefficient on network size squared is negative and significant indicating diminishing
marginal diversity returns to network size.24 As actors add network contacts, the contribution to informa-
tion diversity lessens, implying that information benefits to network size are constrained. Network diver-
sity is also positively and significantly associated with greater information diversity in incoming email.
The first order diversity variable which measures the lack of constraint in the an actor’s network is highly
significant in all specifications, while the average structural equivalence of actors’ contacts does not in-
fluence access to diverse information controlling for network size and first order structural diversity.
These results demonstrate that large diverse networks provide access to diverse, novel sets of information.
We then tested relationships between network size, network diversity and the total amount of
novel information that accrues to recruiters in incoming email. Our results, shown in Table 3 Models 5-8,
demonstrate that the amount of novel information flowing to an actor is increasing in the actor’s network
size and network diversity. Network diversity has a strong positive relationship with the total amount of
novel information flowing into actors’ inboxes (Models 5 & 6), but is not significant when controlling for
network size (Models 7 & 8). The impact of size on total novel information dominates that of structural
diversity because of the strong relationship between size and total incoming email, a critical driver of the
total amount of novel information (pair wise correlation: ρ = .98, p < .01). This result highlights the im-
portance of information flows over time. The amount of novel information flowing in networks of similar
structural diversity is greater in larger networks. We would also expect network diversity to drive greater
access to total non-redundant information, controlling for network size. However, our model and results
imply that while structural diversity has a strong impact on characteristics of the information actors re-
ceive (greater information diversity per unit of information), variation in the total amount of novel infor-
24 We also tested a negative exponential specification of this relationship with very similar results. Both models fit well.
Network Structure & Information Advantage
25
mation received is determined mostly by network size, a key determinant (along with tie strength) of total
communication bandwidth.
Table 3. Network Structure & Access to Diverse, Novel Information Model 1 Model 2 Model 3 Model 4 Model 5 Model 6 Model 7 Model 8 Dependent Variable:
Information Diversity
Information Diversity
Information Diversity
Information Diversity NRI NRI NRI NRI
Specification FE OLS-c FE OLS-c FE OLS-c FE OLS-c
Age .006 (.009) -.001
(.006) .000 (.012) -.005
(.010)
Gender .003 (.135) .135
(.097) -.006 (.188) -.127
(.155)
Education -.061 (.006) -.002
(.042) -.068 (.062) -.098
(.053) Industry Experience .010
(.010) -.001 (.007) -.029**
(.013) -.015 (.010)
Partner -.147 (.284) .175
(.188) -.480 (.437) -.244
(.395)
Consultant -.006 (.246) .122
(.168) -.839 (.318) -.403
(.296) Total Email Incoming
-.001 (.001)
.000 (.001)
-.001 (.001)
.001 (.001)
Network Size
1.299*** (.133)
1.38*** (.301)
.474*** (.114)
.296* (.138) .711***
(.127) 1.195***
(.234) Network Size-Squared
-.880*** (.112)
-1.048*** (.266)
-.272** (.089)
-.240* (.139) -.109
(.103) -.518* (.263)
Network Diversity .128**
(.052) .268*** (.072)
.229*** (.061)
.530*** (.131)
-.070 (.060)
-.138 (.103)
Structural Equivalence -.005
(.033) .062
(.096) -.053 (.043)
-.000 (.006)
.022 (.037)
-.138 (.102)
Constant .059 (.094)
.863 (.895)
.128* (.075)
.016 (.634)
-.281*** (.079)
1.655** (1.090)
-.247*** (.068)
1.784** (.890)
Temporal Controls
Month / Year
Month / Year
Month / Year
Month / Year
Month / Year
Month / Year
Month / Year
Month / Year
F-Value (d.f.)
13.70*** (11)
3.76*** (17)
5.61*** (13)
5.03*** (19)
10.54*** (10)
12.86*** (16)
25.05*** (12)
15.85*** (18)
R2 .24 .38 .14 .24 .19 .35 .40 .55 Obs. 563 448 540 434 540 434 540 434 These results also suggest a nuanced relationship between size and diversity, which we explore next.
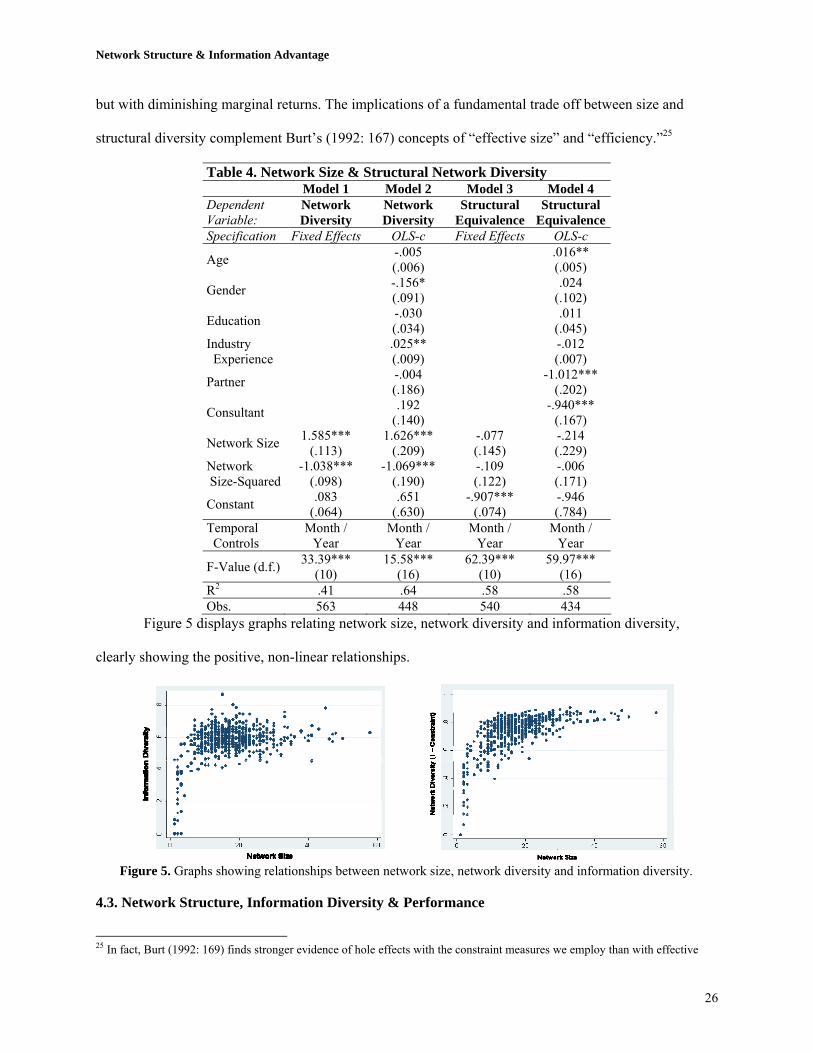
4.2. Tradeoffs between Network Size & Network Diversity
There is a strong, positive, but non-linear relationship between network size and network diver-
sity in our data: structural diversity is increasing in network size, but with diminishing marginal returns
(see Table 4). This result supports hypothesis 2b, and demonstrates why information benefits to larger
networks may be constrained in bounded organizational networks. As recruiters contact more colleagues,
the contribution of a marginal contact to the structural diversity of a focal actor’s network is increasing,
Network Structure & Information Advantage
26
but with diminishing marginal returns. The implications of a fundamental trade off between size and
structural diversity complement Burt’s (1992: 167) concepts of “effective size” and “efficiency.”25
Table 4. Network Size & Structural Network Diversity Model 1 Model 2 Model 3 Model 4 Dependent Variable:
Network Diversity
Network Diversity
Structural Equivalence
Structural Equivalence
Specification Fixed Effects OLS-c Fixed Effects OLS-c
Age -.005 (.006) .016**
(.005)
Gender -.156* (.091) .024
(.102)
Education -.030 (.034) .011
(.045) Industry Experience .025**
(.009) -.012 (.007)
Partner -.004 (.186) -1.012***
(.202)
Consultant .192 (.140) -.940***
(.167)
Network Size 1.585*** (.113)
1.626*** (.209)
-.077 (.145)
-.214 (.229)
Network Size-Squared
-1.038*** (.098)
-1.069*** (.190)
-.109 (.122)
-.006 (.171)
Constant .083 (.064)
.651 (.630)
-.907*** (.074)
-.946 (.784)
Temporal Controls
Month / Year
Month / Year
Month / Year
Month / Year
F-Value (d.f.) 33.39*** (10)
15.58*** (16)
62.39*** (10)
59.97*** (16)
R2 .41 .64 .58 .58 Obs. 563 448 540 434
Figure 5 displays graphs relating network size, network diversity and information diversity,
clearly showing the positive, non-linear relationships.
Figure 5. Graphs showing relationships between network size, network diversity and information diversity.
4.3. Network Structure, Information Diversity & Performance
25 In fact, Burt (1992: 169) finds stronger evidence of hole effects with the constraint measures we employ than with effective

Network Structure & Information Advantage
27
Finally, we test the performance implications of network structure and access to diverse, non-
redundant information measured by revenues generated per month, projects completed per month, and the
average duration of projects.26 Table 5 displays strong evidence of a positive relationship between access
to non-redundant information and performance. In fixed effects models, which control for variation ex-
plained by unobserved, time invariant characteristics of individuals, a one unit increase in the amount of
non-redundant information flowing to individuals is associated on average with just over $3,800 more
revenue generated, an extra one tenth of one project completed, and 14 days shorter average project dura-
tion per person per month. Between estimates are all in the same direction and of similar magnitude, al-
though only the relationship with revenue is significant. Pooled OLS estimates also show that access to
non-redundant information is associated with higher productivity across all measures. These results sup-
port Hypothesis 3 and provide evidence for ‘information advantages’ to network structure. Tables 3, 4
and 5 together demonstrate that diverse networks provide access to diverse, non-redundant information,
which in turn drives performance in information intensive work. We also uncover evidence of alternative
mechanisms linking network structure to performance. Table 5 shows network diversity is positively as-
sociated with performance even when holding access to novel information constant, providing prelimi-
nary evidence of additional benefits to network structure beyond those conferred through information ad-
vantage. Controlling for access to novel information, network diversity is associated with greater revenue
generation in fixed effects and pooled OLS specifications, more completed projects in pooled OLS speci-
fications, and with faster project completion in fixed effects specifications. These results leave open the
possibility that some benefits to network diversity come not from access to novel, non-redundant informa-
tion, but rather from other mechanisms, like access to job support, power or organizational influence.
size, demonstrating “exclusive access is a critical quality of relations that span structural holes.” 26 As there are some employees who do not take on projects or who are not involved in any projects in a given month, we only estimate equations for individuals with non-zero revenues in a given month.
Network Structure & Information Advantage
28
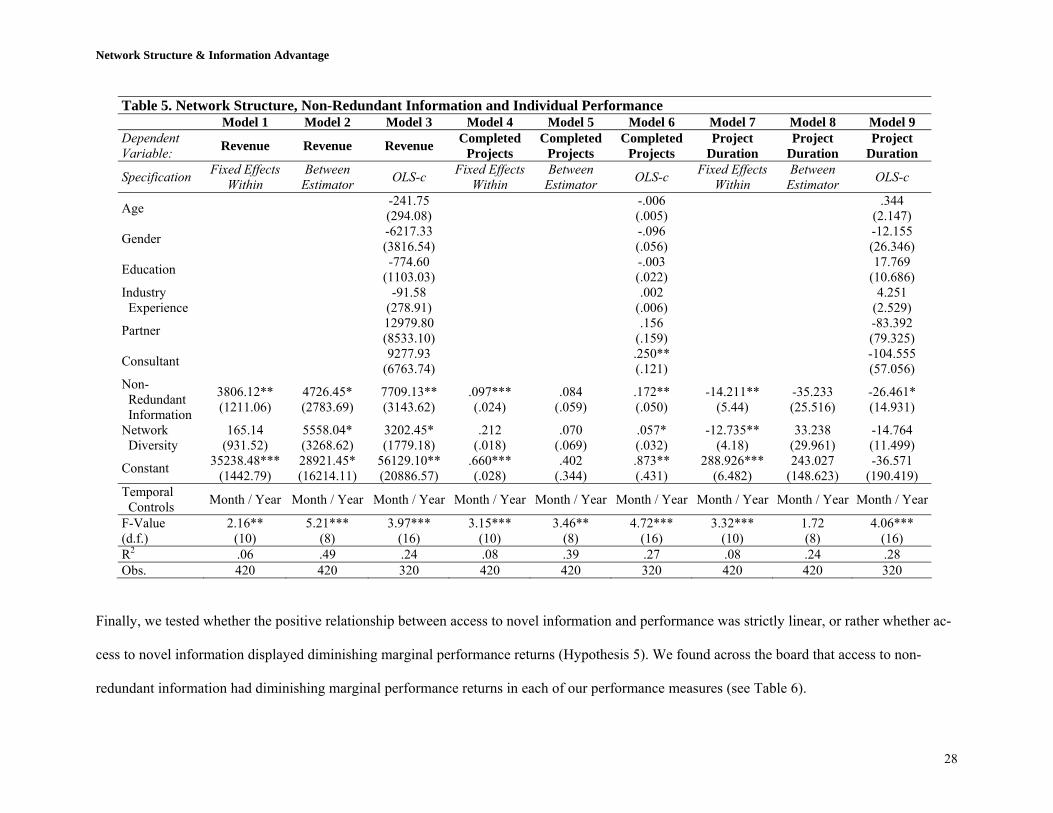
Finally, we tested whether the positive relationship between access to novel information and performance was strictly linear, or rather whether ac-
cess to novel information displayed diminishing marginal performance returns (Hypothesis 5). We found across the board that access to non-
redundant information had diminishing marginal performance returns in each of our performance measures (see Table 6).
Table 5. Network Structure, Non-Redundant Information and Individual Performance Model 1 Model 2 Model 3 Model 4 Model 5 Model 6 Model 7 Model 8 Model 9 Dependent Variable: Revenue Revenue Revenue Completed
Projects Completed
Projects Completed
Projects Project
Duration Project
Duration Project
Duration
Specification Fixed Effects Within
Between Estimator OLS-c Fixed Effects
Within Between
Estimator OLS-c Fixed EffectsWithin
Between Estimator OLS-c
Age -241.75 (294.08) -.006
(.005) .344 (2.147)
Gender -6217.33 (3816.54) -.096
(.056) -12.155 (26.346)
Education -774.60 (1103.03) -.003
(.022) 17.769 (10.686)
Industry Experience -91.58
(278.91) .002 (.006) 4.251
(2.529)
Partner 12979.80 (8533.10) .156
(.159) -83.392 (79.325)
Consultant 9277.93 (6763.74) .250**
(.121) -104.555 (57.056)
Non- Redundant Information
3806.12** (1211.06)
4726.45* (2783.69)
7709.13** (3143.62)
.097*** (.024)
.084 (.059)
.172** (.050)
-14.211** (5.44)
-35.233 (25.516)
-26.461* (14.931)
Network Diversity
165.14 (931.52)
5558.04* (3268.62)
3202.45* (1779.18)
.212 (.018)
.070 (.069)
.057* (.032)
-12.735** (4.18)
33.238 (29.961)
-14.764 (11.499)
Constant 35238.48*** (1442.79)
28921.45* (16214.11)
56129.10** (20886.57)
.660*** (.028)
.402 (.344)
.873** (.431)
288.926*** (6.482)
243.027 (148.623)
-36.571 (190.419)
Temporal Controls Month / Year Month / Year Month / Year Month / Year Month / Year Month / Year Month / Year Month / Year Month / Year
F-Value (d.f.)
2.16** (10)
5.21*** (8)
3.97*** (16)
3.15*** (10)
3.46** (8)
4.72*** (16)
3.32*** (10)
1.72 (8)
4.06*** (16)
R2 .06 .49 .24 .08 .39 .27 .08 .24 .28 Obs. 420 420 320 420 420 320 420 420 320
Network Structure & Information Advantage
29
Table 6. Non-Redundant Information and Performance Model 1 Model 2 Model 3 Model 4 Model 5 Model 6 Dependent Variable: Revenue Revenue Completed
Projects Completed
Projects Project
Duration Project
Duration Specification Fixed Effects OLS-c Fixed Effects OLS-c Fixed Effects OLS-c
Age -233.39 (280.47) -.006
(.005) .528 (2.191)
Gender -6539.65 (3930.32) -.101*
(.059) -8.432 (26.907)
Education -1061.88 (1131.07) -.008
(.022) 18.050 (11.195)
Industry Experience -.493
(261.17) .003 (.005) 3.817
(2.531)
Partner 13891.09* (7971.08) .172
(.157) -96.117 (82.379)
Consultant 9457.81 (6055.44) .252**
(.115) -115.209* (59.892)
Non- Redundant Information
6096.58*** (1287.82)
9310.37*** (2528.86)
.152*** (.025)
.201*** (.040)
-23.11*** (5.94)
-31.870** (16.047)
Non- Redundant Information Squared
-3270.83*** (775.10)
-6659.35*** (1194.65)
-.074*** (.015)
-.121*** (.026)
9.59*** (3.58)
4.172 (9.686)
Constant 37808.06*** (1489.21)
64901.77** (20890.10)
.724*** (.029)
1.032** (.443)
276.75*** (6.87)
-44.411 (197.604)
Temporal Controls
Month / Year
Month / Year
Month / Year
Month / Year
Month / Year
Month / Year
F-Value (d.f.) 4.04*** (10)
5.56*** (16)
3.10*** (10)
5.69*** (16)
3.10*** (10)
3.09** (16)
R2 .10 .30 .08 .31 .08 .27 Obs. 420 320 420 320 420 320
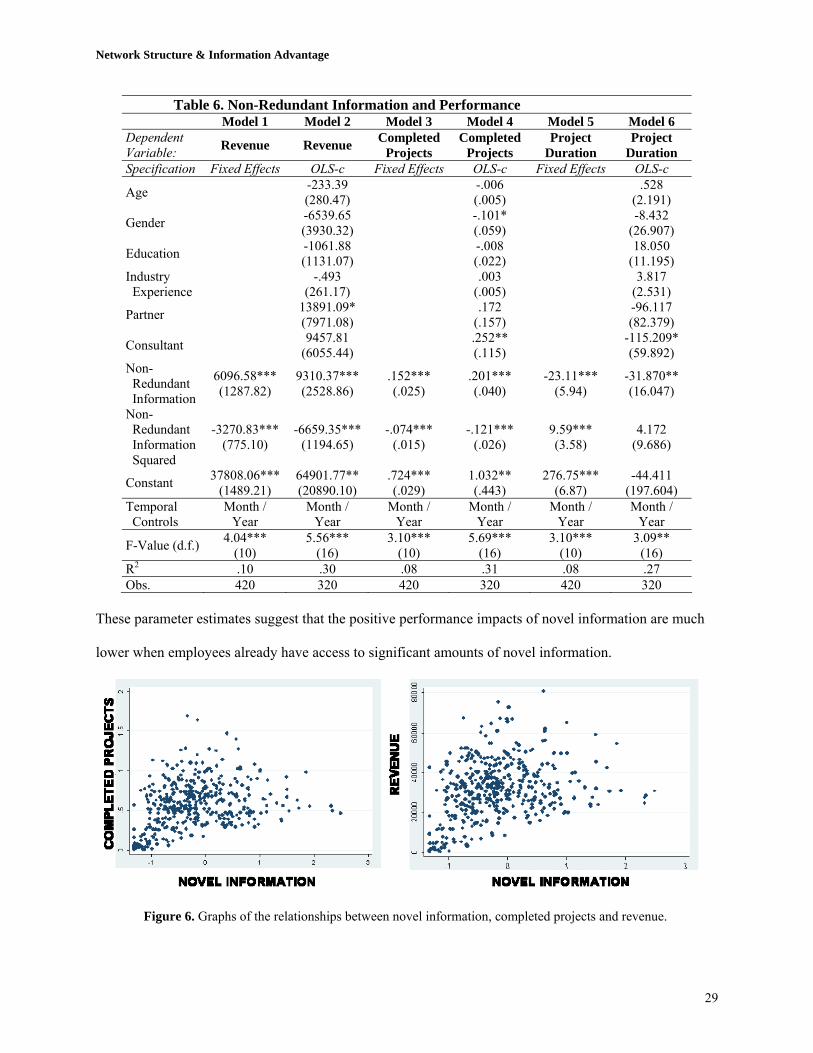
These parameter estimates suggest that the positive performance impacts of novel information are much
lower when employees already have access to significant amounts of novel information.
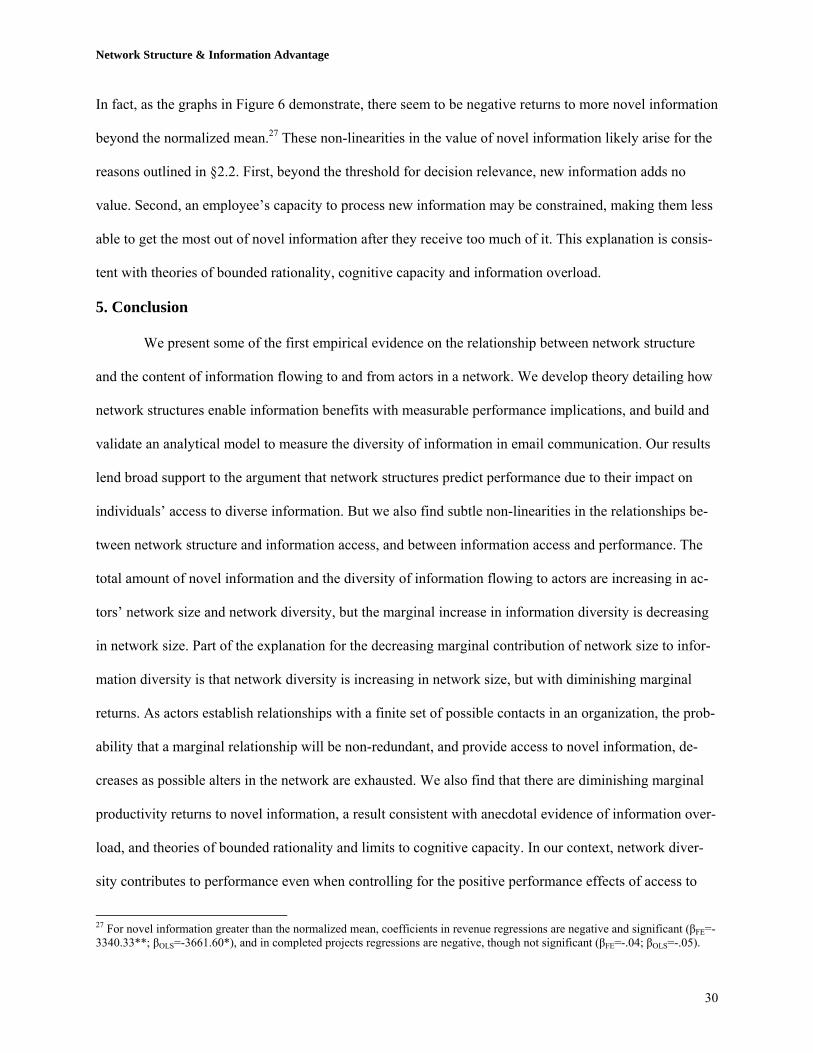
Figure 6. Graphs of the relationships between novel information, completed projects and revenue.
Network Structure & Information Advantage
30
In fact, as the graphs in Figure 6 demonstrate, there seem to be negative returns to more novel information
beyond the normalized mean.27 These non-linearities in the value of novel information likely arise for the
reasons outlined in §2.2. First, beyond the threshold for decision relevance, new information adds no
value. Second, an employee’s capacity to process new information may be constrained, making them less
able to get the most out of novel information after they receive too much of it. This explanation is consis-
tent with theories of bounded rationality, cognitive capacity and information overload.
5. Conclusion
We present some of the first empirical evidence on the relationship between network structure
and the content of information flowing to and from actors in a network. We develop theory detailing how
network structures enable information benefits with measurable performance implications, and build and
validate an analytical model to measure the diversity of information in email communication. Our results
lend broad support to the argument that network structures predict performance due to their impact on
individuals’ access to diverse information. But we also find subtle non-linearities in the relationships be-
tween network structure and information access, and between information access and performance. The
total amount of novel information and the diversity of information flowing to actors are increasing in ac-
tors’ network size and network diversity, but the marginal increase in information diversity is decreasing
in network size. Part of the explanation for the decreasing marginal contribution of network size to infor-
mation diversity is that network diversity is increasing in network size, but with diminishing marginal
returns. As actors establish relationships with a finite set of possible contacts in an organization, the prob-
ability that a marginal relationship will be non-redundant, and provide access to novel information, de-
creases as possible alters in the network are exhausted. We also find that there are diminishing marginal
productivity returns to novel information, a result consistent with anecdotal evidence of information over-
load, and theories of bounded rationality and limits to cognitive capacity. In our context, network diver-
sity contributes to performance even when controlling for the positive performance effects of access to
27 For novel information greater than the normalized mean, coefficients in revenue regressions are negative and significant (βFE=-3340.33**; βOLS=-3661.60*), and in completed projects regressions are negative, though not significant (βFE=-.04; βOLS=-.05).
Network Structure & Information Advantage
31
novel information, suggesting additional benefits to network diversity beyond those conferred through
information advantage. Surprisingly, traditional demographic and human capital variables (e.g. age, gen-
der, industry experience, education) have little effect on access to diverse information, highlighting the
importance of network structure for information advantage.
These results represent some of the first evidence on the relationship between network structure
and information advantage. But, relationships between social structure, information access and economic
outcomes are subtle and complex and require more detailed theoretical development and empirical in-
quiry across different contexts. Our methods for analyzing network structure and information content in
email data are replicable, opening a new line of inquiry into the relationships between networks, informa-
tion and economic performance.
References
Ancona, D.G. & Caldwell, D.F. 1992. “Demography & Design: Predictors of new Product Team Per-formance.” Organization Science, 3(3): 321-341.
Aral, S., Brynjolfsson, E., & Van Alstyne, M. 2006. “Information, Technology and Information Worker Productivity: Task Level Evidence.” Proceedings of the 27th Annual International Conference on In-formation Systems, Milwaukee, Wisconsin.
Arrow, K.J. 1985. “Informational Structure of the Firm.” AEA Papers and Proceedings, 75(2): 303-307.
Bernard, H.R., Killworth, P., & Sailor, L. 1981. “Summary of research on informant accuracy in network data and the reverse small world problem.” Connections, (4:2): 11-25.
Bulkley, N. & Van Alstyne, M. 2004. “Why Information Influence Should Productivity” The Network Society: A Global Perspective; Manuel Castells (ed.). Edward Elgar Publishers. pp: 145-173.
Burt, R. 1992. Structural Holes: The Social Structure of Competition. Harvard University Press, Cam-bridge, MA.
Burt, R. 2000. “The network structure of social capital” In B. Staw, & Sutton, R. (Ed.), Research in or-ganizational behavior (Vol. 22). New York, NY, JAI Press.
Burt, R. 2004a. “Structural Holes & Good Ideas” American Journal of Sociology, (110): 349-99.
Burt, R. 2004b. “Where to get a good idea: Steal it outside your group.” As quoted by Michael Erard in The New York Times, May.
Coleman, J.S. 1988. “Social Capital in the Creation of Human Capital” American Journal of Sociology, (94): S95-S120.
Cook, K.S., Emerson, R.M., Gilmore, M.R., & Yamagishi, T. 1983. “The distribution of power in ex-change networks.” American Journal of Sociology, 89: 275-305.
Cummings, J., & Cross, R. 2003. “Structural properties of work groups and their consequences for per-formance.” Social Networks, 25(3):197-210.
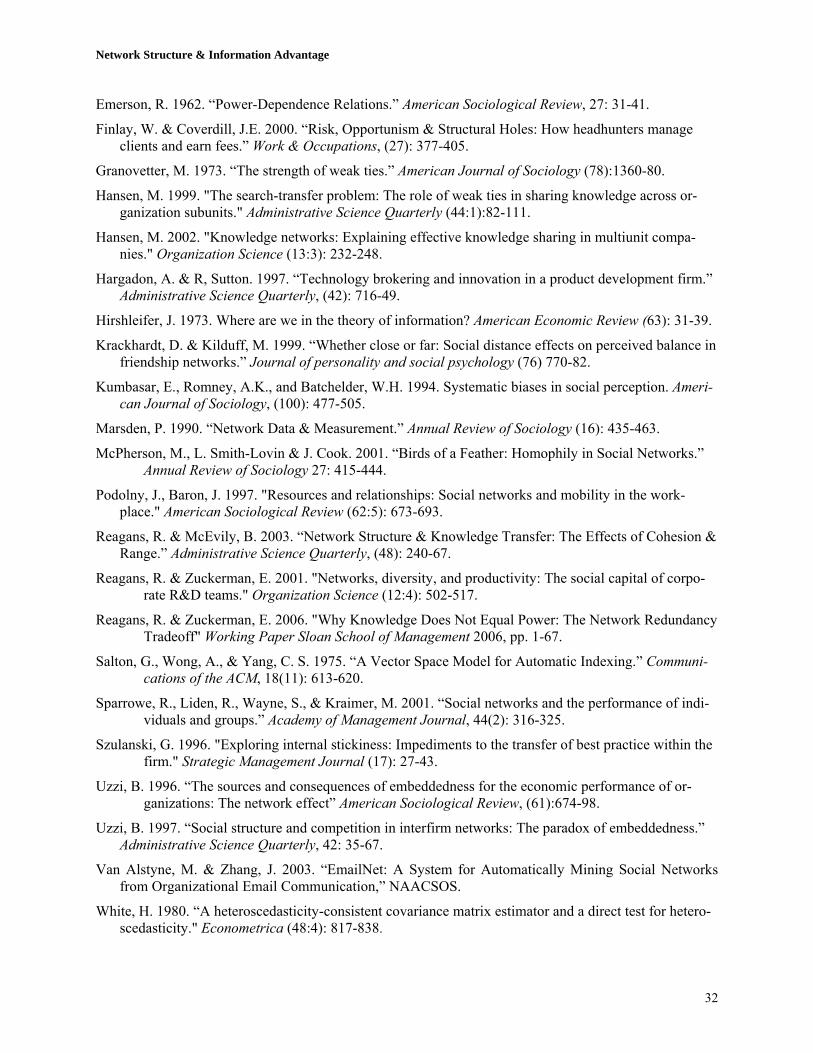
Network Structure & Information Advantage
32
Emerson, R. 1962. “Power-Dependence Relations.” American Sociological Review, 27: 31-41.
Finlay, W. & Coverdill, J.E. 2000. “Risk, Opportunism & Structural Holes: How headhunters manage clients and earn fees.” Work & Occupations, (27): 377-405.
Granovetter, M. 1973. “The strength of weak ties.” American Journal of Sociology (78):1360-80.
Hansen, M. 1999. "The search-transfer problem: The role of weak ties in sharing knowledge across or-ganization subunits." Administrative Science Quarterly (44:1):82-111.
Hansen, M. 2002. "Knowledge networks: Explaining effective knowledge sharing in multiunit compa-nies." Organization Science (13:3): 232-248.
Hargadon, A. & R, Sutton. 1997. “Technology brokering and innovation in a product development firm.” Administrative Science Quarterly, (42): 716-49.
Hirshleifer, J. 1973. Where are we in the theory of information? American Economic Review (63): 31-39.
Krackhardt, D. & Kilduff, M. 1999. “Whether close or far: Social distance effects on perceived balance in friendship networks.” Journal of personality and social psychology (76) 770-82.
Kumbasar, E., Romney, A.K., and Batchelder, W.H. 1994. Systematic biases in social perception. Ameri-can Journal of Sociology, (100): 477-505.
Marsden, P. 1990. “Network Data & Measurement.” Annual Review of Sociology (16): 435-463.
McPherson, M., L. Smith-Lovin & J. Cook. 2001. “Birds of a Feather: Homophily in Social Networks.” Annual Review of Sociology 27: 415-444.
Podolny, J., Baron, J. 1997. "Resources and relationships: Social networks and mobility in the work-place." American Sociological Review (62:5): 673-693.
Reagans, R. & McEvily, B. 2003. “Network Structure & Knowledge Transfer: The Effects of Cohesion & Range.” Administrative Science Quarterly, (48): 240-67.
Reagans, R. & Zuckerman, E. 2001. "Networks, diversity, and productivity: The social capital of corpo-rate R&D teams." Organization Science (12:4): 502-517.
Reagans, R. & Zuckerman, E. 2006. "Why Knowledge Does Not Equal Power: The Network Redundancy Tradeoff" Working Paper Sloan School of Management 2006, pp. 1-67.
Salton, G., Wong, A., & Yang, C. S. 1975. “A Vector Space Model for Automatic Indexing.” Communi-cations of the ACM, 18(11): 613-620.
Sparrowe, R., Liden, R., Wayne, S., & Kraimer, M. 2001. “Social networks and the performance of indi-viduals and groups.” Academy of Management Journal, 44(2): 316-325.
Szulanski, G. 1996. "Exploring internal stickiness: Impediments to the transfer of best practice within the firm." Strategic Management Journal (17): 27-43.
Uzzi, B. 1996. “The sources and consequences of embeddedness for the economic performance of or-ganizations: The network effect” American Sociological Review, (61):674-98.
Uzzi, B. 1997. “Social structure and competition in interfirm networks: The paradox of embeddedness.” Administrative Science Quarterly, 42: 35-67.
Van Alstyne, M. & Zhang, J. 2003. “EmailNet: A System for Automatically Mining Social Networks from Organizational Email Communication,” NAACSOS.
White, H. 1980. “A heteroscedasticity-consistent covariance matrix estimator and a direct test for hetero-scedasticity." Econometrica (48:4): 817-838.

Network Structure & Information Advantage
33
Online Appendix A. Model Derivation
This short section provides the derivation for Equation 1. Let there be 1 … n1 topics in topic set n1 and 1 … n2 top-ics in topic set n2 for a total of n1+n2 = T. Define the likelihoods of encountering n1 and n2 topics as p1 and p2 re-spectively. It follows that n1p1 + n2p2 = 1. Further, define the following:
1=lkI if link l connects to idea k, 0 otherwise.
⎪⎭
⎪⎬⎫
⎪⎩
⎪⎨⎧
== ∑=
otherwise
IifJL
llk
k
0
011
Ψ = {Event that link L+1 connects to a new idea} Here, Jk indicates whether idea k has failed to appear among the information provided by any of the links 1 … L. With this terminology, we can now derive P(Ψ), the probability of encountering a new idea given that there are k ideas remaining to be seen.
)]...|([)( 1 kJJPEP Ψ=Ψ
][1
21
11
1
∑∑+==
+=T
nhh
n
ii pJpJE
][][ 2211 hi JEpnJEpn += LL ppnppn )1()1( 222111 −+−=
The last step arises because an idea that occurs with probability p must not have occurred in any of the previous L draws. This completes the derivation. It is useful to note three properties. First, having no prior links L=0 implies that a new idea is encountered with certainty. Second, increasing links without bound L→∞ implies the chances of encountering a new idea approach 0. Third, unbiased information implies p1= p2=1/T. Further, if ideas in n1 be-
come B times more likely to appear among in-group communications, then p1=B/T which implies that p2=1
11
nTT
Bn
−
−
(with n1 < T, B<T, and n1B ≤ T) which simplifies the final derivation in the main text.
Online Appendix B. Descriptions & Correlations of Information Diversity Metrics
1. Cosine Distance Variance Variance based on cosine distance (cosine similarity):
( )( )N
MdCosID
N
j
Ii
Iij
Ii
∑== 1
2,, where
∑∑∑ ×
=•
=22
),(Mjij
j Mjij
ii
iiij
ww
ww
MdMd
MdCos
We measure the variance of deviation of email topic vectors from the mean topics vector and average the deviation across emails in a given inbox or outbox. The distance measurement is derived from a well-known document simi-larity measure – the cosine similarity of two topic vectors. 2. Dice’s Coefficient Variance
Variance based on Dice’s Distance and Dice’s Coefficient: ( )( )
N
dDistDiceVarDice
N
j
Iij
Ii
∑== 1
2
, where

Network Structure & Information Advantage
34
),(1),()( MdDiceMdDiceDistdDistDice −== , and where
∑ ∑
∑
= =
=
+
×= T
i
T
ijDjD
T
ijDjD
tt
ttDDDice
1 121
121 )(2
)2,1(
Similar to VarCos, variance is used to reflect the deviation of the topic vectors from the mean topic vector. Dice’s coefficient is used as an alternative measure of the similarity of two email topic vectors. 3. Average Common Cluster AvgCommon measures the level to which the documents in the document set reside in different k-means clusters produced by the eClassifier algorithm:
( )( )N
ddCommonDistAvgCommon
N
j
Ij
Ij
Ii
∑== 1
21 ,,
where ),( 21I
jIj dd represents a given pair of documents (1 and 2) in an inbox and j indexes all pairs of documents in
an inbox, and where:
( ) ( )Ij
Ij
Ij
Ij ddCommonSimddCommonDist 2121 ,1, −=
( )∑
∑=Iterations
clustersameinIterationsddCommonSim I
jIj
___, 21
AvgCommon is derived from the concept that documents are similar if they are clustered together by k-means clus-tering and dissimilar if they are not clustered together. The k-means clustering procedure is repeated several times, creating several clustering results with 5, 10, 20, 30, 40 … 200 clusters. This measures counts the number of times during this iterative process two emails were clustered together divided by the number of clustering iterations. There-fore, every two emails in an inbox and outbox that are placed in separate clusters contribute to higher diversity val-ues. 4. Average Common Cluster with Information Content AvgCommonIC uses a measure of the “information content” of a cluster to weight in which different emails reside. AvgCommonIC extends the AvgCommon concept by compensating for the different amount of information provided in the fact that an email resides in the same bucket for either highly diverse or tightly clustered clusters. For exam-ple, the fact that two emails are both in a cluster with low intra-cluster diversity is likely to imply more similarity between the two emails than the fact that two emails reside in a cluster with high intra-cluster diversity.
( )levelsbucketofnumbertotal
DDmCommonICSi bucketsameinDDdocumentsall
buckettheindocuments
documentsall ____
log
)log(1),( __,
____
_121
21
∑⋅=
),(1),( 2121 DDmCommonICSiDDstCommonICDi −=
{ }),( 21, 21
ddstCommonICDiaverageCAvgCommonIdocumentsdd ∈
=
5. Average Cluster Distance AvgBucDiff measures diversity using the similarity/distance between the clusters that contain the emails:
{ }),( 21, 21
ddDocBucDistaverageAvgBucDiffdocumentsdd ∈
= , where
( )∑∈
==⋅=iterationsclusteri
DiiterationDiiteration BBBucketDistiterationscluster
DDistDocBucketD_
,,21 ),(_
1),(21
, and:

Network Structure & Information Advantage
35
),(),(2121 BB mmCosDistBBBucketDist = .
AvgBucDiff extends the concept of AvgCommon by using the similarity/distance between clusters. While AvgCommon only differentiates whether two emails are in the same cluster, AvgBucDiff also considers the distance between the clusters that contain the emails.
Correlations Between the Five Measures of Information Diversity Measure 1 2 3 4 5
1. VarCosSim 1.0000
2. VarDiceSim 0.9999 1.0000
3. AvgCommon 0.9855 0.9845 1.0000
4. AvgCommonIC 0.9943 0.9937 0.9973 1.0000
5. AvgClusterDist 0.9790 0.9778 0.9993 0.9939 1.0000
Online Appendix C: External Validation of Diversity Measures
We validated our diversity measurement using an independent, publicly available corpus of documents from Wikipedia.org. Wikipedia.org, the user created online encyclopedia, stores entries according to a hierarchy of topics representing successively fine-grained classifications. For example, the page describing “genetic algorithms,” is assigned to the “Genetic Algorithms” category, found under “Evolutionary Algorithms,” “Machine Learning,” “Artificial Intelligence,” and subsequently under “Technology and Applied Sciences.” This hierarchical structure enables us to construct clusters of entries on diverse and focused subjects and to test whether our diversity meas-urement can successfully characterize diverse and focused clusters accurately.
We created a range of high to low diversity clusters of Wikipedia entries by selecting entries from either the same sub-category in the topic hierarchy to create focused clusters, or from a diverse set of unrelated subtopics to create diverse clusters. For example, we created a minimum diversity cluster (Type-0) using a fixed number of documents from the same third level sub-category of the topic hierarchy, and a maximum diversity cluster (Type-9) using documents from unrelated third level sub-categories. We then constructed a series of document clusters (Type-0 to Type-9) ranging from low to high topic diversity from 291 individual entries as shown in Figure 3.28 The topic hierarchy from which documents were selected appears at the end of this section.
If our measurement is robust, our diversity measures should identify Type-0 clusters as the least diverse and Type-9 clusters as the most diverse. We expect diversity will increase relatively monotonically from Type-0 to Type-9 clusters, although there could be debate for example about whether Type-4 clusters are more diverse than Type-3 clusters.29 After creating this independent dataset, we used the Wikipedia entries to generate keywords and measure diversity using the methods described above. Our methods were very successful in characterizing diversity and ranking clusters from low to high diversity. Figure 3 displays cosine similarity metrics for Type-0 to Type-9 clusters using 30, 60, and 90 documents to populate clusters. All five diversity measures return increasing diversity scores for clusters selected from successively more diverse topics.30 Overall, these results give us confidence in the ability of our diversity measurement to characterize the subject diversity of groups of text documents of varying sizes.
28 We created several sets of clusters for each type and averaged diversity scores for clusters of like type. We repeated the process using 3, 6 and 9 document samples per cluster type to control for the effects of the number of documents on diversity measures. 29 Whether Type-3 or Type-4 clusters are more diverse depends on whether the similarity of two documents in the same third level sub category is greater or less than the difference of similarities between documents in the same second level sub category as compared to documents in categories from the first hierarchical layer onwards. This is, to some extent, an empirical question. 30 The measures produce remarkably consistent diversity scores for each cluster type and the diversity scores increase relatively monotonically from Type-0 to Type-9 clusters. The diversity measures are not monotonically increasing for all successive sets, such as Type-4, and it is likely that the information contained in Type-4 clusters are less diverse than Type-3 clusters due simply to the fact that two Type-4 documents are taken from the same third level sub category.
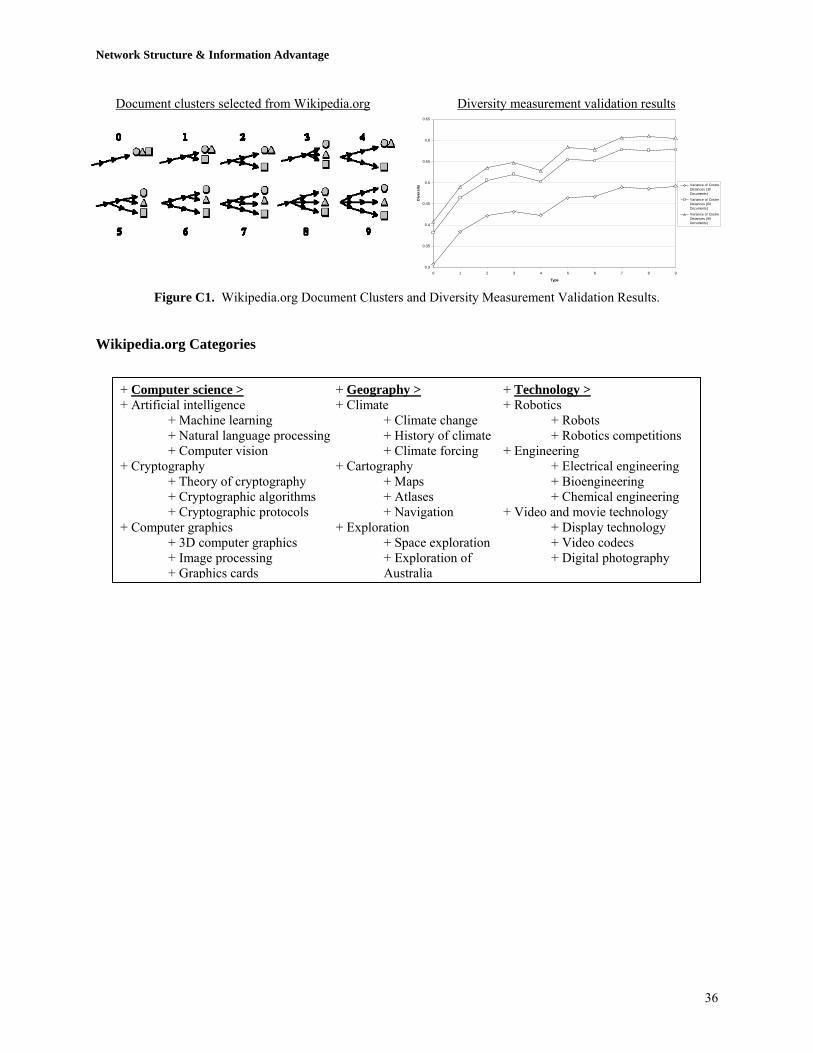
Network Structure & Information Advantage
36
Document clusters selected from Wikipedia.org
Diversity measurement validation results
0.3
0.35
0.4
0.45
0.5
0.55
0.6
0.65
0 1 2 3 4 5 6 7 8 9
Type
Div
ersi
ty Variance of CosineDistances (30Documents)
Variance of CosineDistances (60Documents)
Variance of CosineDistances (90Documents)
Figure C1. Wikipedia.org Document Clusters and Diversity Measurement Validation Results.
Wikipedia.org Categories
+ Computer science > + Artificial intelligence + Machine learning + Natural language processing + Computer vision + Cryptography + Theory of cryptography + Cryptographic algorithms + Cryptographic protocols + Computer graphics + 3D computer graphics + Image processing + Graphics cards
+ Geography > + Climate + Climate change + History of climate + Climate forcing + Cartography + Maps + Atlases + Navigation + Exploration + Space exploration + Exploration of
Australia
+ Technology > + Robotics + Robots + Robotics competitions + Engineering + Electrical engineering + Bioengineering + Chemical engineering + Video and movie technology + Display technology + Video codecs + Digital photography
Recommended