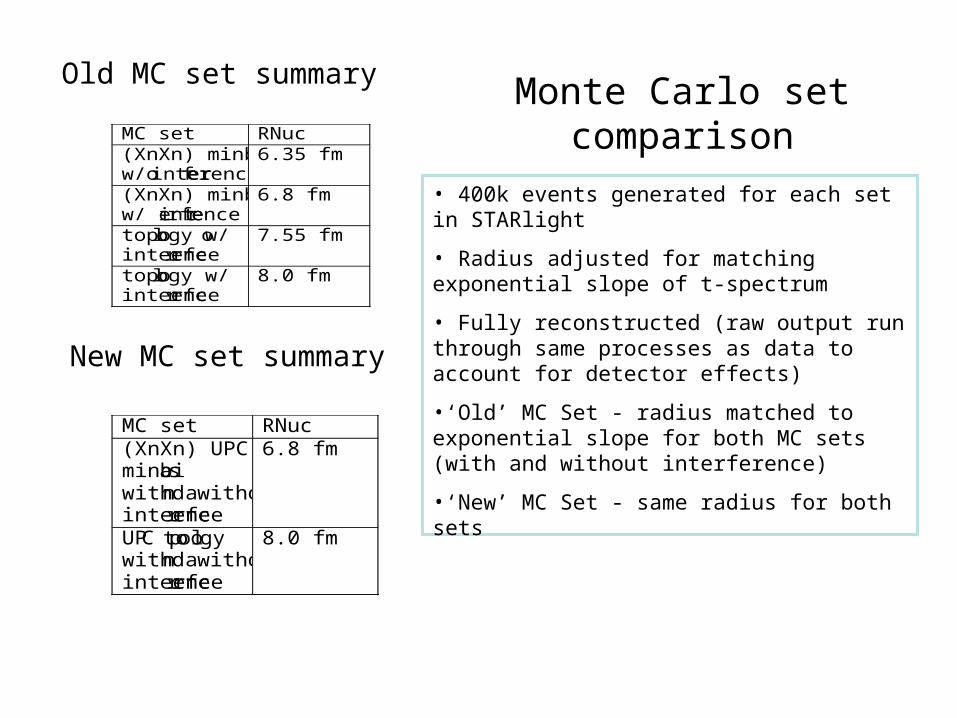
New MC set summary
MC set RNuc (XnXn) UPC minbias with and without interference
6.8 fm
UPC topology with and without interference
8.0 fm
MC set RNuc (XnXn) minbias w/o interference
6.35 fm
(XnXn) minbias w/ interference
6.8 fm
topology w/o interference
7.55 fm
topology w/ interference
8.0 fm
Old MC set summary
• 400k events generated for each set in STARlight
• Radius adjusted for matching exponential slope of t-spectrum
• Fully reconstructed (raw output run through same processes as data to account for detector effects)
•‘Old’ MC Set - radius matched to exponential slope for both MC sets (with and without interference)
•‘New’ MC Set - same radius for both sets
Monte Carlo set comparison

• 400k events generated for MinBias (XnXn) MC set in STARlight
• Radius adjusted for matching exponential slope of t-spectrum
• fit function = Ae-k*t
• data k = 302 GeV-1
• MC k = 296 GeV -1
• fit range: 0.004 < t < 0.01
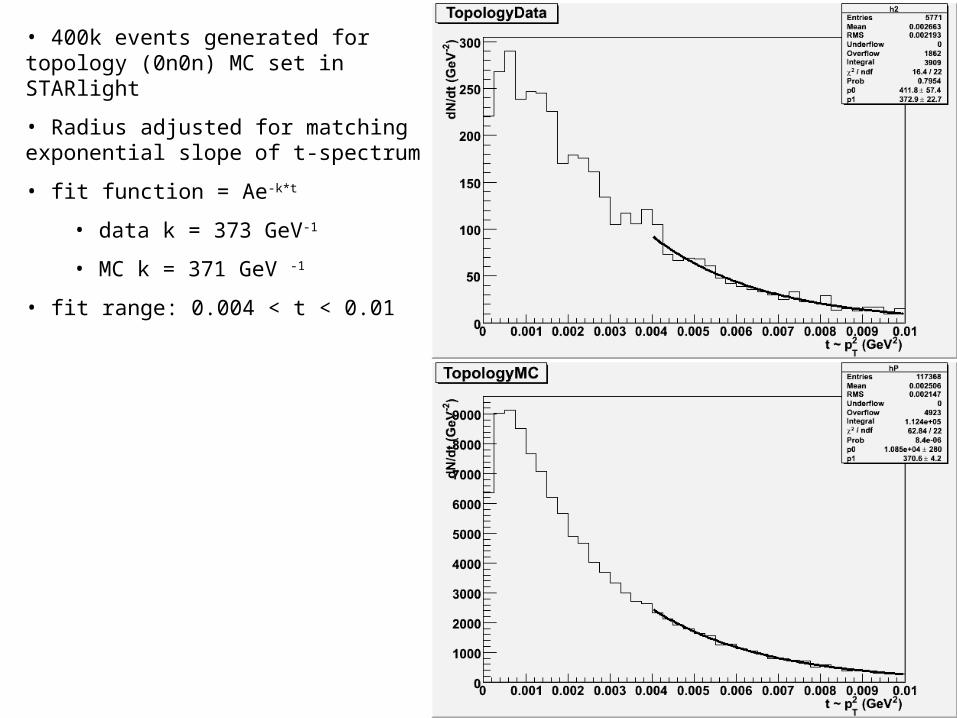
• 400k events generated for topology (0n0n) MC set in STARlight
• Radius adjusted for matching exponential slope of t-spectrum
• fit function = Ae-k*t
• data k = 373 GeV-1
• MC k = 371 GeV -1
• fit range: 0.004 < t < 0.01

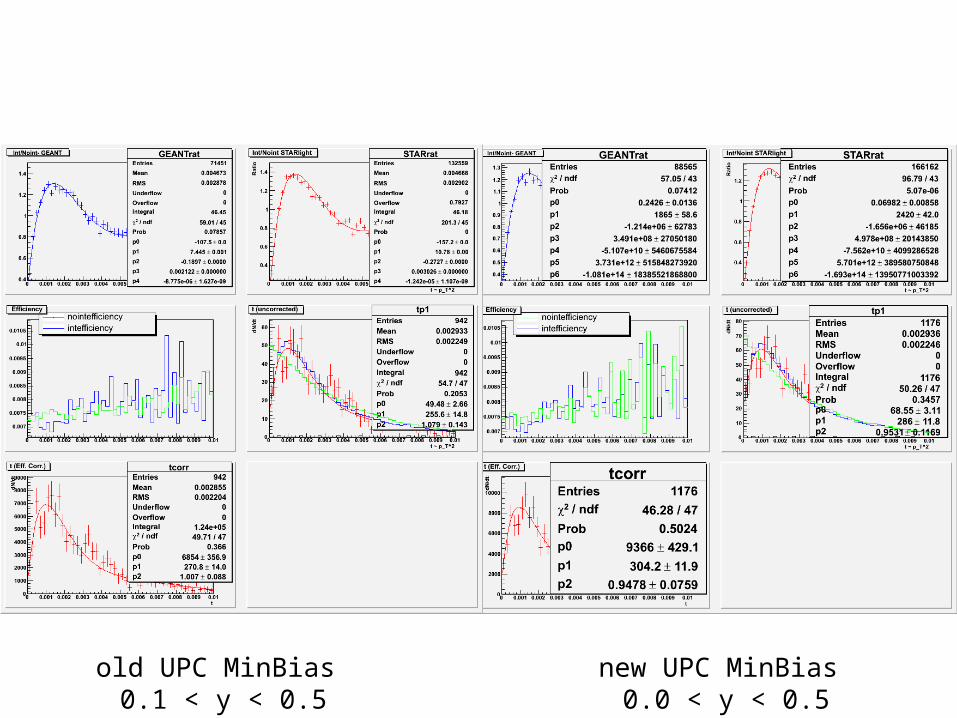
Explanation of plots:
1) Ratio of GEANT corrected Monte Carlo (STARlight) interference t-spectrum (t~pT
2) to no-interference t-spectrum
2) Ratio of uncorrected STARlight interference t-spectrum to no-interference t-spectrum
3) Efficiency curves calculated for interference and no-interference scenarios (ratio of MC t-spectrum run through GEANT to t-spectrum not run through GEANT)
4) MC interference histogram (blue), MC no-interference histogram (green), uncorrected data (red points), overall parameterization (red curve)
5) uncorrected data (red points), overall parameterization (red curve)
1 2
3 4
5
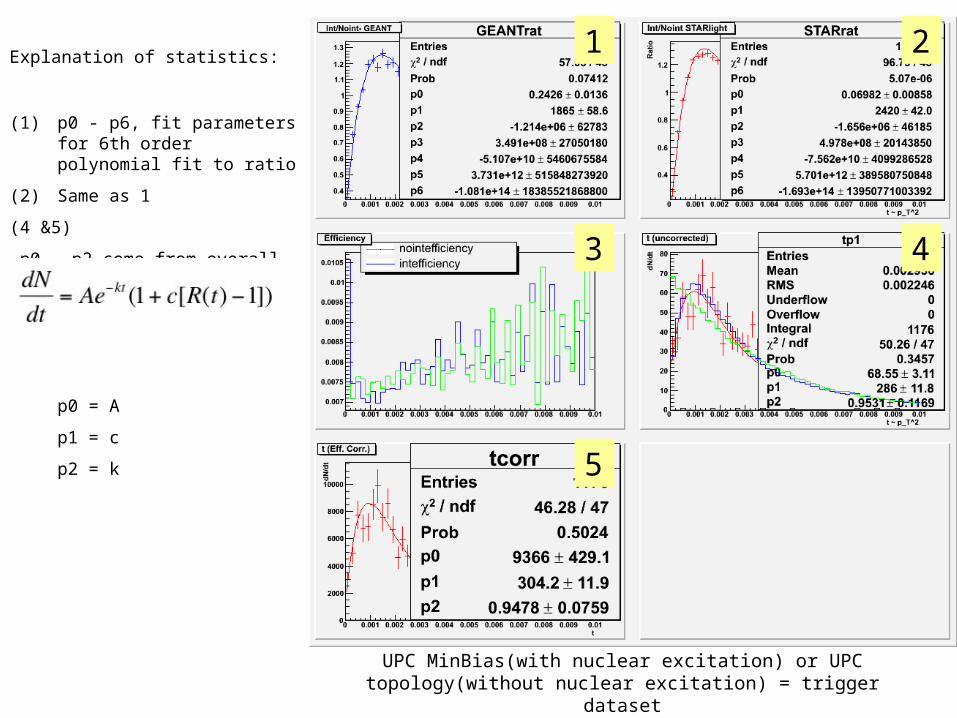
UPC MinBias(with nuclear excitation) or UPC topology(without nuclear excitation) = trigger dataset
Explanation of statistics:
(1) p0 - p6, fit parameters for 6th order polynomial fit to ratio
(2) Same as 1
(4 &5)
p0 - p2 come from overall fit:
p0 = A
p1 = c
p2 = k
1 2
3 4
5
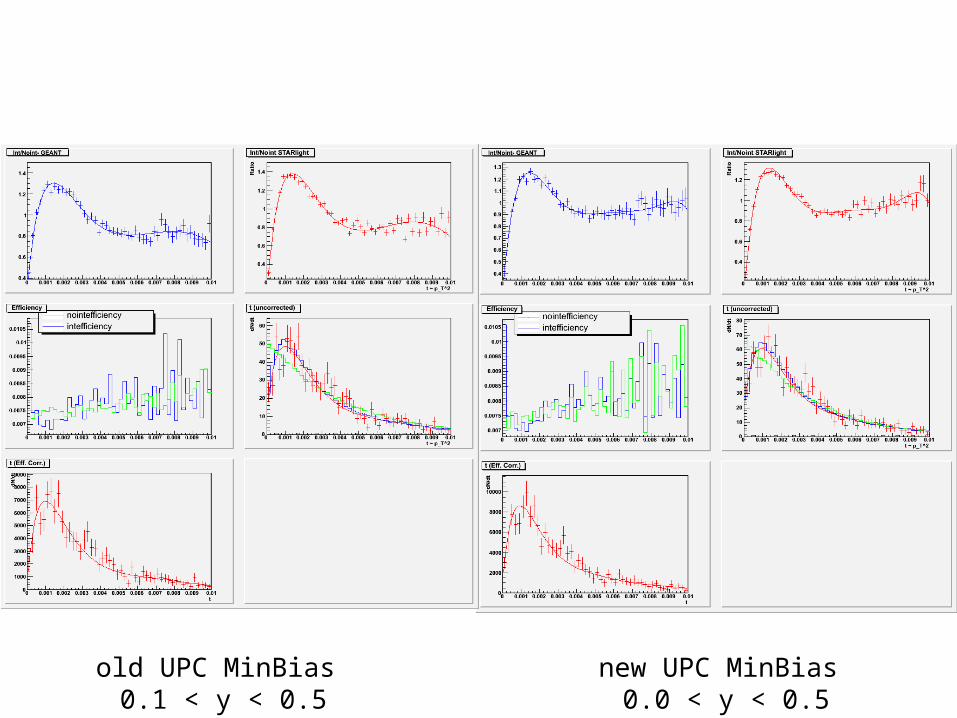
old UPC MinBias 0.1 < y < 0.5
new UPC MinBias 0.0 < y < 0.5
old UPC MinBias 0.1 < y < 0.5
new UPC MinBias 0.0 < y < 0.5

old UPC MinBias 0.5 < y < 1.0
new UPC MinBias 0.5 < y < 1.0

old UPC MinBias 0.5 < y < 1.0
new UPC MinBias 0.5 < y < 1.0
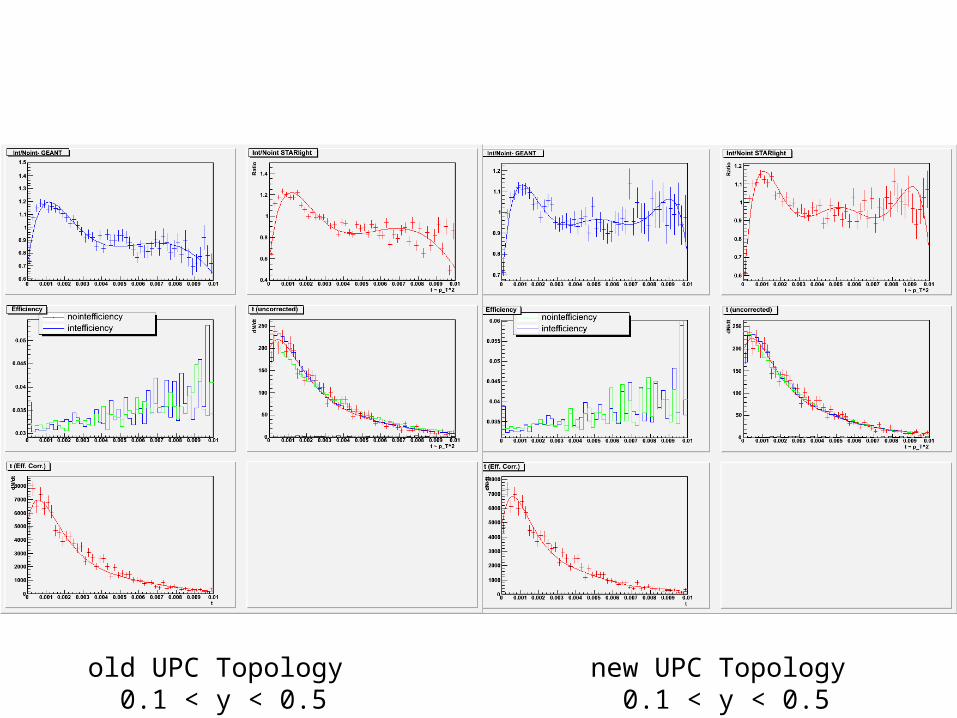
old UPC Topology 0.1 < y < 0.5
new UPC Topology 0.1 < y < 0.5

old UPC Topology 0.1 < y < 0.5
new UPC Topology 0.1 < y < 0.5
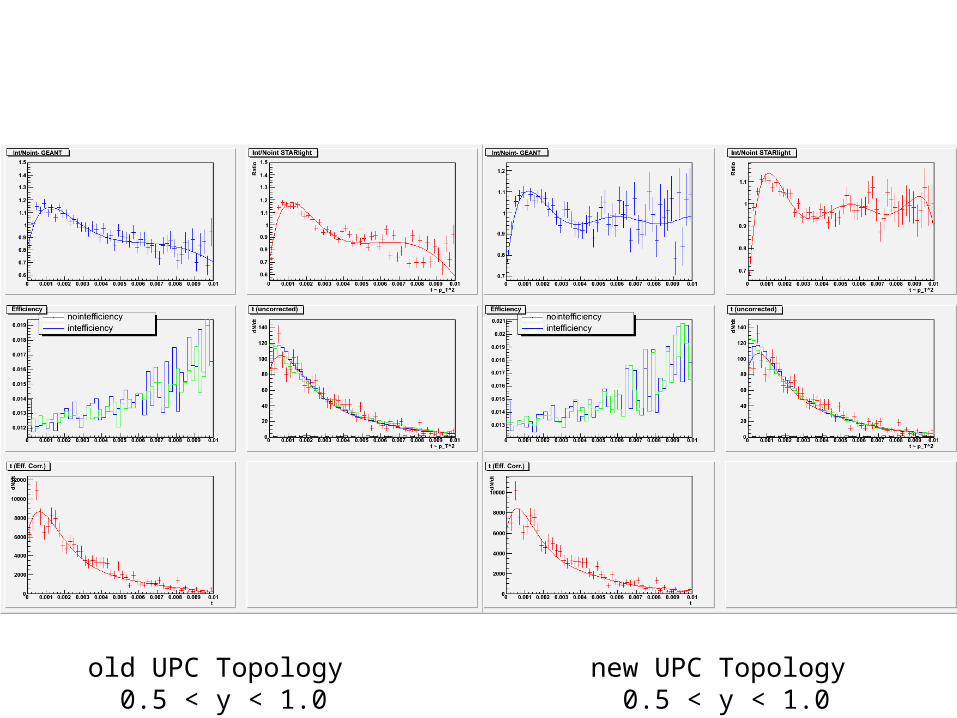
old UPC Topology 0.5 < y < 1.0
new UPC Topology 0.5 < y < 1.0

old UPC Topology 0.5 < y < 1.0
new UPC Topology 0.5 < y < 1.0

MC set Summary
cold 2/dof cnew 2/dof
Minbias
0.1 < y < 0.5
1.010.09
77/47 0.950.08
46/47
0.5 < y < 1.0
0.930.11
77/47 0.930.11
79/47
Topology
0.1 < y < 0.5
0.800.11
86/47 0.860.11
84/47
0.5 < y < 1.0
1.10.21
80/47 0.970.20
88/47
Recommended