University of Salerno
Department of Chemistry and Biology
Ph.D. Thesis in Chemistry
New Technologies in Tires: From Layered
Nanofillers to Metathesis Reactions
Marco Mauro
Tutor: Prof. Gaetano Guerra
Co-tutors: Prof. Maurizio Galimberti, Dr. Luca Giannini
Supervisor: Prof. Pasquale Longo
XII Cycle 2011-2014


i
Dedicated to Sheila and to my wonderful family

ii

iii
The true sign of intelligence is not knowledge but imagination.
Albert Einstein

iv

v
Abstract
Tires are annually manufactured in more than one billion of
artefacts and the ever increasing demand is on the basis of the efforts
in finding new solutions for more performant, sustainable and
durable products. This PhD thesis presents highly new contributions
to the nanotechnology applied to rubber nanocomposites,
particularly focussing on clays and graphitic fillers with tunable
periodicities and degree of order of their structures. The interaction
of layered nanofillers with the rubber matrix was investigated,
correlating nanocomposites structure and morphology, studied by
means of X-ray diffraction and transmission electron microscopy,
with measured tensile and dynamic-mechanical properties. Unique
reversible thermal transitions of nanocomposites containing
organoclays and graphite oxide intercalation compounds were also
investigated through differential scanning calorimetry. Metathesis
applied to the rubber chemistry is presented as a strongly innovative
technology to produce novel rubber materials, hardly obtainable
with conventional synthetic methods and to promote the
degradation of rubbers, when the latter process is desired.

vi
vii
Abbreviations
2HT: Dimethyl ditallow ammonium
6PPD: N-(1,3-dimethylbutyl)-N´-phenyl-1,4-benzenediamine
ADMET: Acyclic diene metathesis polymerization
AIPEA: Association Internationale pour l’Etude des Argiles
BC: 1,4-cis-butadiene unit
BET: Brunauer-Emmett-Teller
BT: 1,4-trans-butadiene unit
BV: 1,2-butadiene unit
CB: Carbon black
CEC: Cation-exchange-capacity
CM: Cross-metathesis
CMS: Clay Minerals Society
CNTs: Carbon nanotubes
CRGO: Chemically reduced graphite oxide
CTAB: Cetyl trimethylammonium bromide
Cy: Cyclohexyl group
DBP: Dibutyl phthalate
DCB: 1,2-dichloro benzene
DCBS: N-dicyclohexylbenzothiazol-2-sulfenamide
DCUP: Dicumylperoxide
DMA: Dynamic-mechanical analysis
DSC: Differential scanning calorimetry
DTGS: Deuterated triglycine sulfate
eGO: Exfoliated graphite oxide
FTIR: Fourier transform infrared spectra
FWHMD: Full width at half maximum of the D-band in the Raman
spectra of a graphitic material
G: High surface area graphite
G1: First generation Grubbs catalyst
G2: Second generation Grubbs catalyst

viii
GICs: Graphite intercalation compounds
GO/2HT/GTS: Graphite oxide intercalated with dimethyl ditallow
ammonium and glyceryl tristearate
GO/2HT/SAES: Graphite oxide intercalated with dimethyl
ditallow ammonium and 2-stearamidoethyl stearate
GO/2HT-H: Graphite oxide intercalated with higher content of
dimethyl ditallow ammonium
GO/2HT-L: Graphite oxide intercalated with lower content of
dimethyl ditallow ammonium
GO/PP2: Graphene oxide layers functionalized with second
generation phosphinated Piers catalyst
GO: Graphite oxide
GO-Cl: Chlorinated Graphene oxide layers
GO-G2: Graphene oxide layers functionalized with second
generation Grubbs catalyst
GO-Gly: GO-Cl esterified with ethylene glycol
GOICs: Graphite oxide intercalation compounds
GO-Nor: GO-Gly reacted with 5-acid chloride 2-norbornene
GPC: Gel permeation chromatography
GTS: Glyceryl tristearate
HG1: First generation Hoveyda-Grubbs catalyst
HG2: Second generation Hoveya-Grubbs catalyst
H-GO: Graphite oxide with higher oxygen content
HT: Hydrotalcite
IC: 1,4-cis-isoprene unit
iPr: Isopropyl group
IT: 1,4-trans-isoprene unit
JNCs: Joint Nomenclature Committees of the AIPEA and the CMS
LDH: Layered double hydroxides
L-GO: Graphite oxide with lower oxygen content
MCM: Macromolecular cross-metathesis
Me: Methyl group
MMT/2HT/SA: Montmorillonite intercalated with dimethyl
ix
ditallow ammonium and stearic acid (also referred as OC 6nm)
MMT/2HT/SAES: Montmorillonite intercalated with dimethyl
ditallow ammonium and 2-stearamidoethyl stearate
MMT/2HT: Montmorillonite intercalated with dimethyl ditallow
ammonium (also referred as OC 4nm)
MMT: Montmorillonite
MWCNTs: Multi-wall carbon nanotubes
NHC: N-heterocyclic carbene
NMR: Nuclear magnetic resonance
NXT: 3-octanoylthio-1-propyltriethoxysilane
O: Octahedral sheet within a clay Layer
OC 2.5nm: OC obtained by extraction of MMT/2HT with ethyl
acetate
OCs: Organically modified clays
PBR: 1,4-cis-polybutadiene
Ph: Phenyl group
Phr: Parts per hundred grams of rubber
PIR/GO: PIR grafted to GO sheets
PIR/H: PIR-based nanocomposites containing GO/2HT-H
PIR/L: PIR-based nanocomposites containing GO/2HT-L
PIR/OCs: PIR-based nanocomposites containing OCs (OC 4nm,
OC 6nm an OC 2.5nm)
PIR: 1,4-cis-polyisoprene
RCM: Ring-closing metathesis
rGO: Reduced graphite oxide
ROM: Ring-opening metathesis
ROMP: Ring-opening metathesis polymerization
RT: Room temperature
SA: Stearic acid
SAES: 2-stearamidoethyl stearate
scCO2: Supercritical carbon dioxide
SEM: Scanning electron microscopy
SIC: Strain-induced crystallization
x
sPS/OC: sPS aerogels containing OCs
sPS/rGO: sPS aerogels containing rGO
sPS: Syndiotactic polystyrene
SWCNTs: Single-wall carbon nanotubes
T: Tetrahedral sheets within a clay Layer
TGA: Thermogravimetric analysis
THF: tetrahydrofuran
TMS: Tetramethylsilane
WAXD: Wide angle X-ray diffraction
xi
Symbols
%mol.: Mole percent
%wt.: Weight percent
hklx : Angle between the normal to the film surface and the normal
to the hkℓ crystallographic plane
hkl : Azimuthal angle measured from the equator of the Debye ring
)( hklI : Intensity distribution of a hkℓ diffraction on the Debye
ring
nM : Number average molecular mass
nw MM / : Polydispersity index
hklx2cos : Squared average cosine value of the angle hklx
2θ: Peak position in a X-ray diffraction pattern
a: Crystallographic a axe
A: sp2-hybridized carbon layer within the …ABABAB… stacking
sequence of the hexagonal graphite
a0: a0 lattice constant of the hexagonal graphite
AC: Cross-section perpendicular to the outstretched hydrocarbon
chains
ag: ag lattice constant of the graphite oxide
ao: ao lattice constant of the orthorhombic order
ar: ar lattice constant of the hexagonal rotator order
AS: Available clay surface per amphiphile
b: Crystallographic b axe
B: sp2-hybridized carbon layer within the …ABABAB… stacking
sequence of the hexagonal graphite
c: Crystallographic c axe
c0: c0 lattice constant of the hexagonal graphite
D║ / D┴: Shape anisotropy
D║: In-plane correlation length

xii
D┴: Out-of-plane correlation length
dhkℓ: Bragg’s distance between hkℓ lattice planes
Dhkℓ: Correlation length perpendicular to hkℓ lattice planes
E': Tensile storage modulus
fhkℓ: Degree of uniplanar orientation of the crystallites with respect to
the film plane
g: Reflection relative to the graphite oxide planes
G'': Shear loss modulus
G': Shear storage modulus
hkℓ: Miller indices for a family of lattice planes in a crystal structure
K: Scherrer constant
n: Stage number or number of graphene layers that separate adjacent
intercalate layers in GICs
o: Reflection relative to the orthorhombic order
P/P0: Ratio between the measured pressure and the atmospheric
pressure
p: p orbital
P: Porosity of sPS aerogels
r: Reflection relative to the hexagonal rotator order
SBET: Total area evaluated following the BET model in the standard
0.05<P/P0 <0.3 pressure range
sp2: sp2 carbon hybridization
sp3: sp3 carbon hybridization
tanδ: Loss tangent
Tg: Glass transition temperature
α layer: Type of layers of hydrocarbon chains with orthorhombic
order in the interlayer space
β layer: Type of layers of hydrocarbon chains with orthorhombic
order in the interlayer space
βhkℓ: Integral breadth, defined as the ratio between the integral
intensity and the maximum intensity of a diffraction peak
ΔHm: Melting enthalpy

xiii
ΔHr: Enthalpy relative to the loss of rotator order of the intercalated
hydrocarbon chains
ε║: In-plane lattice strain
ε┴: Out-of-plane lattice strain
εB: Elongation at break
θ: Diffraction angle
λ: Wavelength of the incident X-rays (1.5418 Å, Cu Kα radiation)
π: pi C-C bond
ρapp: Aerogel apparent density calculated from the mass/volume ratio
of the monolithic aerogels
ρpol: Density of polymer (sPS) matrix
σ: Sigma C-C bond
σB: Tensile strength
φ: Tilting angle of the hydrocarbon chains with respect to the
normal to the clay or graphite oxide layers

xiv

xv
Contents
Abstract / v
Abbreviations / vii
Symbols / xi
Introduction / 1
Section I Layered Nanofillers for Rubber
Nanocomposites / 3
Chapter 1 Cationic Clays and Organoclays / 5
1.1 Clays and Their Structures / 5
1.1.1 Multiscale Organization of Clays / 8
1.2 Organoclays / 10
1.2.1 Preparation of Organoclays at the Solid State
/ 13
1.2.2 Characterization of Organoclays / 14
1.2.3 Structural Reversibility of Organoclays with
Temperature / 18
1.2.4 Structures of Organoclays / 21
1.3 Clay Exfoliation and Polymer/Clay Aerogels by
Supercritical Carbon Dioxide / 23
1.3.1 Organoclay Exfoliation by Supercritical
Carbon Dioxide / 26
1.3.2 Monolithic Nanoporous Polymeric Aerogels
with Large Organoclay Content / 28
1.3.3 Comparison between Aerogels with
Intercalated and Exfoliated Organoclays / 32
References / 36
Chapter 2 Graphites and Derived Compounds / 41
2.1 Carbon Allotropes / 42
2.2 Structures of Layered Carbons / 43

xvi
2.2.1 Graphites / 43
2.2.2 Turbostratic Graphites / 45
2.2.3 Amorphous Carbons / 47
2.2.4 Carbon Blacks / 48
2.3 Structural Characterization of Graphitic Materials for
the Preparation of Anisotropic Carbon Nanofillers / 50
2.4 Graphite Oxide / 54
2.4.1 Preparation, Composition and Surface Areas
of Graphite Oxide Samples / 55
2.4.2 Characterization of Graphite Oxide Samples /
57
2.5 Graphite and Graphite Oxide Intercalation Compounds
/ 61
2.5.1 Preparation and Composition of Graphite
Oxide Intercalation Compounds / 63
2.5.2 Characterization of Graphite Oxide
Intercalation Compounds / 64
2.5.3 Structural Reversibility of Graphite Oxide
Intercalation Compounds with Temperature / 65
2.5.4 Structures of Graphite Oxide Intercalation
Compounds / 70
2.6 Disordered Structures from Graphite Oxide: Chemically
Modified Graphenes / 76
2.6.1 Chemical Exfoliation of Graphite Oxide / 77
2.6.2 Mechanical Exfoliation of Graphite Oxide /
83
2.6.3 Syndiotactic Polystyrene Aerogels with
Reduced Graphite Oxide / 88
References / 94
Section II Rubber Nanocomposites / 103
Chapter 3 Rubber/Organoclay Nanocomposites / 105
3.1 Structure and Morphology of Organoclays in Rubber

xvii
Nanocomposites / 105
3.2 Properties of Rubber/Organoclay Nanocomposites /
112
References / 115
Chapter 4 Rubber/Graphite Oxide Intercalation
Compound Nanocomposites / 117
4.1 Structure and Morphology of Graphite Oxide
Intercalation Compounds in Rubber Nanocomposites /
117
4.2 Properties of Rubber/Graphite Oxide Intercalation
Compound Nanocomposites / 120
References / 125
Section III Metathesis Reactions in Rubber
Chemistry / 127
Chapter 5 Olefin Metathesis / 129
5.1 Introduction / 129
5.2 Grubbs Catalysts / 132
References / 135
Chapter 6 Rubber-Scrambling Metathesis Reactions /
137
6.1 Macromolecular Cross-Metathesis / 137
6.2 Multiblock Copolymers of High-cis Polybutadiene and
Polyisoprene by Macromolecular Cross-metathesis / 141
6.2.1 Characterization of the Starting
Homopolymers / 142
6.2.2 Characterization of the PBR-PIR Copolymers
/ 148
6.2.3 Extraction of PBR-PIR Copolymers with
Solvent / 154
6.3 Metathetic Degradation of Rubbers / 158
6.3.1 Degradation of Homopolymers / 158
xviii
6.3.2 Degradation of PBR-PIR Mixtures / 160
References / 164
Chapter 7 Grafting of Rubbers to Graphene Oxide Layers
through Grubbs and Piers Catalyst-Functionalized
Graphite Oxides / 167
7.1 Covalent and Non-Covalent Functionalization of
Graphene Oxide Layers with Grubbs and Piers Catalysts /
167
7.2 Grafting Reactions of Polyisoprene to Graphene Oxide
Layers / 173
References / 178
Section IV Experimental Part / 181
Chapter 8 Materials and Preparation Procedures / 183
8.1 Materials / 183
8.2 Preparation of Organoclays / 185
8.3 Extraction of Organoclay with Ethyl Acetate / 185
8.4 Clay Exfoliation by Supercritical CO2 / 186
8.5 Preparation of sPS/Clay Gels and Aerogels / 186
8.6 Preparation of GO with Higher Content of Oxygenated
Groups / 187
8.7 Preparation of GO with Lower Content of Oxygenated
Groups / 188
8.8 Preparation of GOICs / 188
8.9 Preparation of GO and GOIC films / 189
8.10 Preparation of Chemically Reduced Graphite Oxide /
189
8.11 Graphite Oxide Exfoliation by Ball-Milling / 190
8.12 Solvo-thermal Reduction of Graphite Oxide / 190
8.13 Preparation of sPS/rGO Gels and Aerogels / 190
8.14 Preparation Organoclays in Rubber Medium / 191
8.15 Preparation of Rubber/Organoclay Nanocomposites
by Melt Blending / 191

xix
8.16 Preparation Rubber/Graphite Oxide Intercalation
Compound Nanocomposites by Melt Blending / 192
8.17 Crosslinking of Rubber Nanocomposites / 193
8.18 Macromolecular Cross-Metathesis of High-cis
Polybutadiene and Polyisoprene / 193
8.19 Metathetic Degradations of Polybutadiene and
Polyisoprene and their Mixtures / 194
8.20 Covalent Functionalization of Graphene Oxide Layers
with Grubbs Catalyst / 195
8.21 Non-Covalent Functionalization of Graphene Oxide
Layers with Piers Catalyst / 196
8.22 Grafting of Polyisoprene to Grubbs and Piers Catalyst-
Functionalized Graphene Oxides / 197
References / 197
Chapter 9 Characterization Techniques / 199
9.1 Wide Angle X-ray Diffraction / 199
9.2 Fourier Trasform Infrared Spectroscopy /201
9.3 Differential Scanning Calorimetry /202
9.4 Thermogravimetric Analysis / 202
9.5 Elemental Analysis / 202
9.6 BET Surface Area Measurements / 202
9.7 Scanning Electron Microscopy / 203
9.8 Trasmission Electron Microscopy / 203
9.9 Back Titration of Graphite Oxides / 203
9.10 Gel Permeation Chromatography / 203
9.11 NMR Spectroscopy / 204
9.12 Raman Spectroscopy / 204
9.13 Dynamic-Mechanical Analysis / 204
9.14 Tensile Tests / 205
9.15 Strain Sweep Tests / 205
9.16 Crosslinking Tests / 206
References / 206

xx
Conclusions / 207
Acknowledgements / 209

1
Introduction
Tires are, by definition, composite artefacts in both structure and
composition. A vehicle tire generally can contain different types of
synthetic and natural rubbers, different types of fillers, steel cord,
polyester, nylon, steel bead wire and various kinds of chemicals,
waxes, oils and pigments.
Tire technology has always been based on nanostructured
fillers. Carbon black and silica, in fact, are the most used reinforcing
fillers for tires and have their internal structure in the nanoscale, so
tires are primary nanocomposites.
Research and development of new nanofillers, able to
produce an extended interface with the rubber matrix, play a role of
increasing importance for tire industry, particularly on the
commercial scale. Nanotechnology opens a wide range of product
opportunities, in particular, allows not only to improve mechanical
and barrier properties, but also to produce lighter and more durable
tires.
Among nanofillers, clays were first used, in the 90’s, for the
preparation of polymer nanocomposites and are, still nowadays, the
most applied ones in the rubber field, in spite of the large interest
for carbon nanotubes and of the increasing number of studies on
graphene and on nanofillers made by few layers of graphene, also for
rubber composites.
Section I shows the preparation of tailor made layered
nanofillers at the solid state, based on clays or graphitic materials,
with different interlayer distance and different degrees of crystalline
order in the direction parallel and perpendicular to the structural
layers and in the interlayer space. In particular, the interaction of
layered hosts with long-chain amphiphilic guests able to intercalate
in the interlayer space, in presence or in absence of polar molecules,
is investigated. Methods for the exfoliation of nanofillers are

2
successfully implemented at the solid state and the conservation of
the filler exfoliation state in polymeric aerogels is discussed.
Section II deals with the effect of organoclays and graphite
oxide intercalation compounds in nanocomposites of 1,4-cis-
polyisoprene, trying to attempt a correlation between the
nanocomposite properties and the nanofiller structure.
Section III was completely devoted to metathesis of
polydienes as a powerful technology to obtain not only novel
polymer-polymer materials, but also hybrid polymer-filler
nanocomposites with suitably functionalized fillers. Furthermore,
degradation reactions of rubbers are also investigated by using
metathesis catalysts.
Finally, Section IV collects details on materials, all
experimental procedures and characterization techniques used in this
work.

3
Section I
Layered Nanofillers for Rubber
Nanocomposites
The text in this section is reproduced in part with permission from
the following published works:
V. Cipolletti, M. Galimberti, M. Mauro, G. Guerra. Appl.
Clay Sci. 2014, 87, 179–188.
S. Longo, M. Mauro, C. Daniel, M. Galimberti, G.
Guerra. Front. Chem. 2013, 1, 1–9.
M. Mauro, M. Maggio, V. Cipolletti, M. Galimberti, P.
Longo, G. Guerra. Carbon 2013, 61, 395–403.
M. Mauro, V. Cipolletti, M. Galimberti, P. Longo, G.
Guerra. J. Phys. Chem. C 2012, 116, 24809–24813.
M. R. Acocella, M. Mauro, L. Falivene, L. Cavallo, G.
Guerra. ACS Catalysis 2014, 4, 492–496.

4

5
Chapter 1
Cationic Clays and Organoclays
1.1 Clays and Their Structures
According to the definition of the Joint Nomenclature Committees
(JNCs) of the Association Internationale pour l’Etude des Argiles
(AIPEA) and the Clay Minerals Society (CMS), a clay is “a
naturally occurring material composed primarily of fine-grained
minerals, which is generally plastic at appropriate water contents and
will harden when dried or fired”.[1]
Clays are layered materials with strong iono-covalent bonds
inside each layer and weaker forces along the stacking direction.
The volume included between two successive layers is called the
“interlayer space”.[2]
Clays are classified in three different categories according to
the electrical charge of the layer (see Scheme 1.1). Pyrophyllite, talc,
and kaolinite are composed by neutral layers held together by van
der Waals interactions and/or hydrogen bonds. Cationic clays, as
phyllosilicates, are composed by negatively charged layers
compensated exactly by an equal amount of positive charges,
provided by cations located in the interlayer space (compensating
cations). Anionic clays are composed by positively charged layers
with compensating anions in the interlayer space. The most common
natural mineral in this group is hydrotalcite (HT), but this belongs
to a broader family of “HT-like” materials called layered double
hydroxides or LDH.

6
Scheme 1.1. The basic structure of a clay mineral at the nanometric
scale: (A) neutral layers, (B) negatively charged layers with
compensating cations (cationic clays) and (C) positively charged
layers with compensating anions (anionic clays), after ref. 2.
In this chapter we focused on phyllosilicates, such as
montmorillonite (MMT), belonging to the group of smectites,
composed by two tetrahedral (T) sheets linked to both sides to a
central octahedral (O) sheet (2:1 or TOT type clay layers). Weak
forces held together the layers and alkaline and alkaline-earth
cations, as well as water molecules are located in the interlayer space.
Tetrahedral sheets are constituted of corner sharing [XO4] units,
where X is a small cation, which may be either Si4+or Al3+; oxide
ions (formally O2-) occupy the corners. Octahedral sheets consist of
edge-sharing [MO4(OH)2] units, where M can be either a trivalent
(such as Al3+), a divalent (such as Mg2+).[3]
The general formula of MMT is [IV(Si4) VI(Al2-yMgy) O10
(OH2)]y- (Mn+)y/n · mH2O, Mn+ may be nearly any alkaline and
alkaline-earth cation and y is the divalent cation substitution degree.
The X-ray diffraction pattern of sodium MMT (Dellite® HPS
from Laviosa Chimica Mineraria S.p.A.) is shown in Fig. 1.1, while a
plausible structure of the MMT is reported in Fig. 1.2.

7
Fig. 1.1. X-ray diffraction patterns (Cu Kα) of the commercially
available sodium MMT, Dellite® HPS, from Laviosa Chimica
Mineraria S.p.A.
Fig. 1.2. Structure of MMT.

8
The pattern of the sodium MMT in Fig. 1.1 presents a
broad 001 reflection, corresponding to an interlayer distance of 1.2
nm, with a correlation length of 5 nm. Narrow 020 and 060
reflections, corresponding to a long-range order in the clay layers
(correlation length perpendicular to the 020 planes higher than 18
nm) are also observed.[4,5]
1.1.1 Multiscale Organization of Clays
Clays are characterized by structural features particularly suitable to
substantially improve rubber properties, namely mechanical and
barrier properties: a high average ratio of the width to the thickness
of the particles, the so-called aspect ratio, the availability of a space
between two opposite layers, suitable to accommodate molecules, the
tunability of properties such as hydrophilicity and hydrophobicity.
In fact, clays are characterized by a multiscale organization.[3]
At the upper level (macroscopic) of said organization, clay
particles of micrometric size form millimetric-size aggregates.
Accordingly we may distinguish between interlayer space,
interparticle space, and interaggregate space (pores) (see Scheme
1.2).
The arrangement of the particles or aggregates leads to
different morphologies, such as platelets or “tactoids”, tubules, laths,
and fibres. Phyllosilicates are composed by platelets and are porous,
containing pores of varied size and shape.[3]
Clay particles can interact in different ways, such as face-to-
face, edge-to-edge, or edge-to-face. Extended edge-to-face aggregates
are sometimes called “house-of-cards” structures (see Scheme 1.2).
The type of dispersion of clay particles in a polymer matrix is a very
important feature of polymer nanocomposite.[2]
9
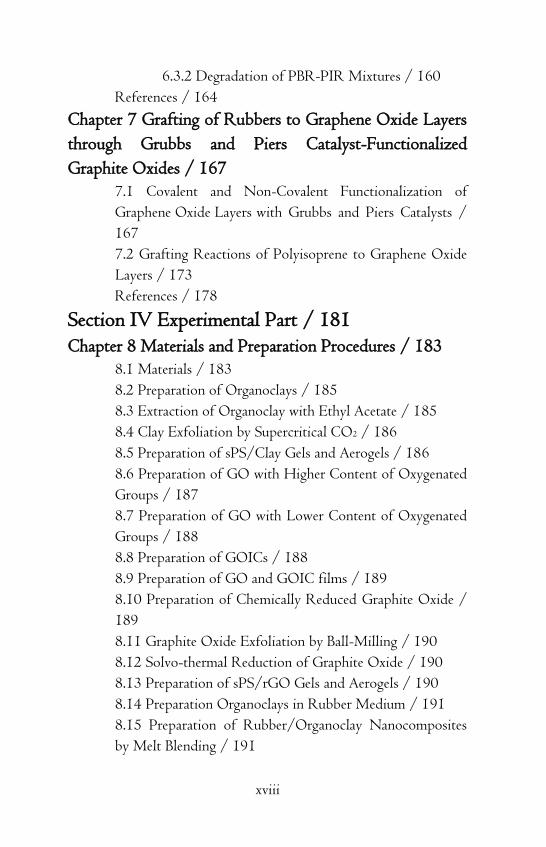
Scheme 1.2. Top: aggregation of clay particles at the micrometer
scale, mostly edge-to-edge (A) the inset shows the stacking of
elementary layers within a particle; and mostly edge-to-face (B).
Bottom: higher level organization of aggregates (C), after ref. 2.
At the lowest (molecular) level, the individual particles
shown in Scheme 1.2 are composed of the stacking of elementary
layers, alternating with interlayer spaces containing the compensating
cations, and whatever other molecules may happen to be intercalated
(see next paragraph). The stacking exhibits crystallographic
periodicity along the c axis, even though successive layers may be
oriented differently according to the a and b directions. A single clay
layer is characterized by lateral dimensions from 100 to 1000 nm
and by a thickness of about 1 nm.
The term exfoliation is used to designate the separation
between the planar faces of two adjacent layers. The layers may
eventually become completely independent from one another and
isotropically dispersed in the solvent or polymer matrix (see Scheme
1.3).

10
Scheme 1.3. Schematic representation of the exfoliation of a clay
particle.
1.2 Organoclays
Most of the technological applications of clays are related to their
ability to intercalate organic cations by exchange reactions with the
cations in their interlayer spaces. Here, we define the cation exchange
capacity (CEC) of a clay as the total amount of cations available for
exchange at a given pH, which is commonly expressed as
milliequivalent/100 g of calcined clay.
The organically modified clays of organoclays (OCs) are
used, since long time, for important applications,[6,7] such as waste-
water treatment and waste disposal,[8–11] as rheological control
agents,[12] in the environmental field,[13,14] for cosmetics [15]
and for drug delivery.[16–18]
In the last decades, modified clay minerals, based in
particular on MMT, have played a key role for the development of
clay polymer nanocomposites.[19–22]
Clay minerals have a hydrophilic nature and, to be evenly
distributed and dispersed in a hydrocarbon polymer matrix, they
need a compatibilizer [6]: organophilic ammonium cations have
been mostly used as MMT modifier. OCs are prepared with the
help of liquids, such as water and alcohols,[23] but also at the solid
state.[7] Over the last years, an alternative route for the synthesis of
OCs to be used in polymer-clay nanocomposites was developed
[24,25]: the reaction of the pristine clay mineral with the
ammonium cation was performed in situ in the polymer matrix,

11
adopted as the reaction medium.
The neat synthesis of OCs appears of great interest for the
development of a large variety of polymer-clay nanocomposites, as
the absence of solvents makes this process environmentally friendly
and suitable for industrialization, with a favourable impact on
economic aspects. As anticipated above, OCs preparation at the solid
state is well known in clay minerals field. Ogawa et al. first reported
the intercalation in MMT of acrylamide, n-alkylamine and 2,2'-
bipyridine [26,27] and of naphthalene and anthracene into
alkyltrimethylammonium modified MMT.[28] Reactions with
smectites at the solid state were then reported for
octadecylamine,[29,30] also in the presence of stearic acid,[31]
2HTCl,[32] alcohols, aldehydes, n-alkyl pyrrolidones,[33] aniline
salts,[34] polycarbazole [35] and distearyl dimethyl ammonium
chloride.[36]
In this work, OCs were prepared at the solid state, in the
absence of any solvent, according to the experimental procedure
described in paragraph 8.2 in Section IV. The preparation of the
OCs was performed by the group of Prof. Maurizio Galimberti at
the Polytechnic of Milan.
A commercially available OC with roughly 40 %wt. of
2HT, such as Dellite® 67G from Laviosa Chimica Mineraria S.p.A,
was first characterized, as reference sample. The X-ray diffraction
(Cu K) pattern in the 2 range 2-80° of Dellite® 67G is
reported in Fig. 1.3.

12
Fig. 1.3. X-ray diffraction patterns (Cu Kα) of commercially
available Dellite® 67G from Laviosa Chimica Mineraria S.p.A. The
symbol r indicates the reflection relative to the rotator order.
Besides many 00ℓ reflections (up to ℓ = 12) that indicate a
high degree of order perpendicular to the clay layers and an
interlayer spacing of 3.5 nm, the pattern shows well defined weak
reflections, corresponding to the typical 020, 210 and 060 in-plane
MMT periodicities.
It is worth adding that a well defined narrow reflection is
also present at 2 = 21.7°, corresponding to d = 0.41 nm, which
suggests the occurrence of a hydrocarbon rotator order,[37–42] i.e.
of an hexagonal order of the intercalated long hydrocarbon chains.
Analogous hexagonal rotator order in the packing of long
hydrocarbon tails has been observed for intercalates of anionic clays
[43] and of graphite oxide [44] (see paragraph 2.5).
The thickness of the clay layer (≈ 1 nm) and the length of
the alkylammoniums [45] (≈ 5 nm) indicate that the tilting angle of
the hydrocarbon chains with respect to the normal to the clay layers
is not far from φ = 60°. Hence, the X-ray diffraction pattern of

13
Dellite® 67G in Fig. 1.3 indicates the presence of an intercalate
structure, whose schematic projections, parallel and perpendicular to
the clay layers, are shown in Fig. 1.4A and Fig. 1.4B, respectively.
Fig. 1.4. Schematic projections parallel (A) and perpendicular (B) to
the clay layers of the starting OC intercalate structure (Dellite®
67G). The hydrocarbon tails of the ammonium cations are
represented as cylinders in the lateral view (A) and as ellipses in the
top view (B). The distance between the axes of adjacent cylinders
(0.41 nm) is shown in B while the definition of the alkyl chains tilt
angle φ is shown in A.
1.2.1 Preparation of Organoclays at the Solid State
For the preparation of OCs at the solid state, pristine MMT
(Dellite® HPS from Laviosa Chimica Mineraria S.p.A.) and
dimethyl ditallow ammonium chloride (2HTCl) (the molecular
structure of 2HT is reported in Fig. 1.5) were used as the clay
mineral and as the ammonium salt, respectively. The molar amount
of the ammonium salt was equal to the nominal CEC of pristine
MMT (128 mmol/ 100g).

14
Fig. 1.5. Molecular structures of ionic and polar compounds
intercalated with MMT: dimethyl ditallow ammonium (2HT),
stearic acid (SA) and 2-stearamidoethyl stearate (SAES).
The neat synthesis is composed of two steps, characterized
by the use of two different forms of energy for promoting the
reaction between MMT and 2HTCl. In the first step, mechanical
energy is given to the reaction mixture, by ball milling it at 380 rpm
for 1 hour. In the second step, the mixture is kept (for about 1
hour) at a temperature well above the melting point of the
ammonium salt. OC samples were also prepared, through the neat
synthesis, by adding to the reaction mixture, before the ball milling
step, either stearic acid (SA) and 2-stearamidoethyl stearate (SAES)
(see the molecular structures in Fig. 1.5), used in a molar amount
equal to the molar amount of the ammonium salt. As the OC
samples were not washed with any solvent after their preparation,
they were characterized by the presence of NaCl, arising from the
cation exchange reaction.
1.2.2 Characterization of Organoclays
OC samples were first characterized through thermogravimetric
analysis reported in Fig. 1.6. The organic contents of MMT/2HT,

15
MMT/2HT/SA and MMT/2HT/SAES were evaluated as 44
%wt., 54 %wt. and 61 %wt., respectively.
Fig. 1.6. Thermogravimetric analysis in N2 of: MMT/2HT,
MMT/2HT/SA and MMT/2HT/SAES.
The X-ray diffraction pattern of the OC, prepared by
mixing MMT and 2HT, in Fig. 1.7 shows four 00ℓ reflections and
a basal spacing of 4.0 nm with a correlation length increased up to
17 nm.
More ordered OCs were obtained by adding a second polar guest,
such as SA or SAED to the pristine MMT and 2HT. Both patterns
of MMT/2HT/SA and MMT/2HT/SAES show al least six 00ℓ
reflections with an increased correlation length (D = 31 nm) and
with a largely increased spacing (d = 6.0 nm).
The X-ray diffraction pattern of the OC after extraction of
MMT/2HT in a Kumagawa extractor with a good solvent such as
ethyl acetate for 12 h is shown in the upper part of Fig. 1.7. The
same results were obtained for the extraction of MMT/2HT/SA
and MMT/2HT/SAES in the same conditions. The basal spacing

16
decreases from the initial 4 nm or 6 nm value to a value of 2.5 nm
and the correlation length also decreases down to 8 nm.
Fig. 1.7. X-ray diffraction patterns (Cu Kα) of MMT/2HT,
MMT/2HT/SA and MMT/2HT/SAES. The pattern of the OC
obtained by extraction of MMT/2HT with ethyl acetate is also
reported in the upper part. The symbol r indicates the reflection
relative to the rotator order.
An analogous structure was obtained by extraction of
Dellite® 67G with ethyl acetate from 2 to 6 hours (see Fig. 1.8).
The interlayer distance decreased from the initial 3.5 nm value to a
plateau value of 2.5 nm. A lower value was not observed even by
protracting the extraction. The organic content detected in the
extracted OC samples with 2.5 nm as the d001 interlayer distance, as
evaluated from TGA measurements, was about 36 %wt. The value
of 2.5 nm as interlayer distance seems thus to correspond to a
minimum of energy.

17
Fig. 1.8. d001 interlayer distance as a function of the extraction time
for a sample of commercially available organoclay (Dellite® 67G).
The patterns of Fig. 1.7 also presents an intense reflection at
d = 0.42 nm, i.e. the distance between long hydrocarbon chains in
their rotator order,[37–42] already observed for Dellite® 67G. In
the patterns of MMT/2HT/SA and MMT/2HT/SAES the
reflection attributed to the rotator order is more intense and
narrower than in the pattern of MMT/2HT, as a consequence of
addition of a second polar guest.
The influence of SA on the formation of MMT/2HT/SA
organoclay, with 6.0 nm as interlayer distance (see Fig. 1.7), was
further explored by Fourier transform infrared (FTIR)
measurements.[25] The co-intercalation of SA and of 2HT in the
MMT/2HT/SA organoclay is clearly confirmed by analysis of the
carbonyl region of the FTIR spectra in Fig. 1.9. In particular, the
carbonyl peak of SA, for the molecules in the crystalline solid is
centered at 1704 cm-1. On the other hand, the carbonyl peak of SA
is largely shifted (up to nearly 1725 cm-1) after mixing with the

18
2HT ammonium salt (at 100 °C, weight ratio close to 1:1) or after
mixing with 2HT and MMT in the solid state (nearly 1726 cm-1).
The observed shift to higher frequencies of the acid carbonyl
stretching mode indicates weaker hydrogen bonding in the mixed
systems, with respect to the pure acid.[46] Analogous results were
obtained for the carbonyl stretching of the MMT/2HT/SAES
organoclay with respect to SAES amide.
Fig. 1.9. Infrared spectra of: MMT, 2HT, SA, solid mixture of
2HT and SA (1:1) and MMT/2HT/SA.
1.2.3 Structural Reversibility of Organoclays with
Temperature
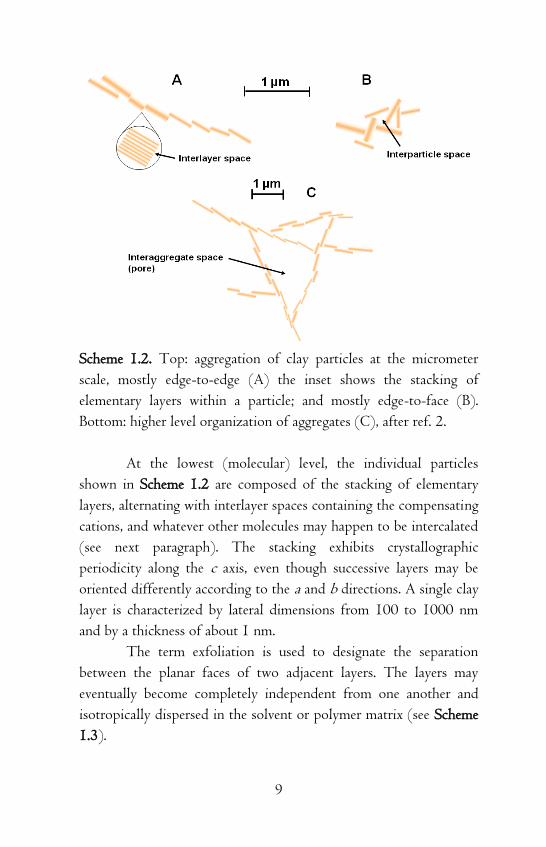
DSC heating scans of MMT/2HT, MMT/2HT/SA,
MMT/2HT/SAES samples and of the OC obtained by extraction
of MMT/2HT with ethyl acetate are shown in Figs 1.10A–D. The
data on transition temperature and enthalpy corresponding to the
loss of rotator order of the hydrocarbon tails, as detected in the first
19
heating scan, are also shown. As expected on the basis of X-ray
diffraction findings, calorimetric results reveal that the transition
temperatures increase from MMT/2HT to MMT/2HT/SA and,
in particular, to MMT/2HT/SAES. These endothermic
phenomena detected by heating OC samples have been also
described as 2D melting of ammonium cations, that can not give rise
to the 3D melting, as they are linked to the inorganic layer.[45]
Fig. 1.10. DSC heating scans of: (A) MMT/2HT, (B)
MMT/2HT/SA, (C) MMT/2HT/SAES and (D) OC obtained
by extraction of MMT/2HT with ethyl acetate.
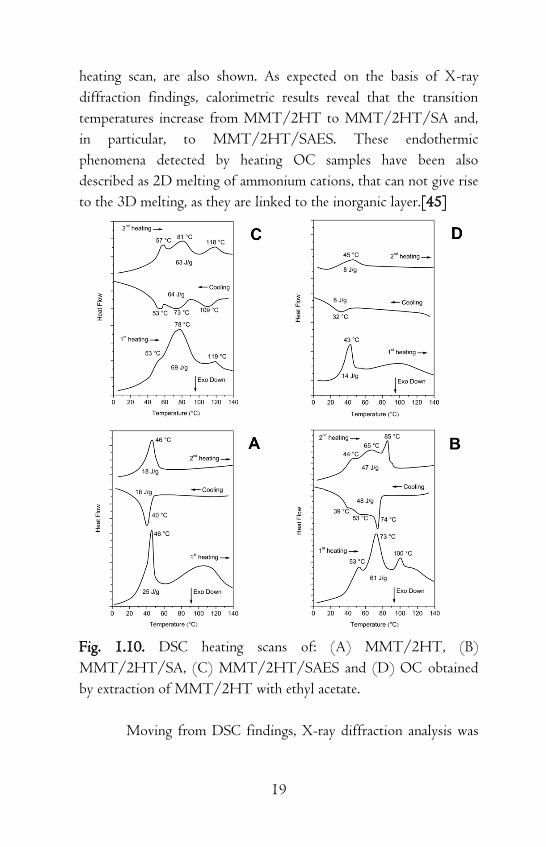
Moving from DSC findings, X-ray diffraction analysis was
20
repeated on MMT/2HT and MMT/2HT/SA samples, exploring
a temperature range from 20 °C to 85 °C. For both OC, diffraction
patterns were taken every 5 °C and d001 basal spacing was
determined, by first heating and then cooling the samples. In Fig.
1.11, d001 values are plotted against the temperature at which the
pattern was taken. The lower part of Fig. 1.11 refers to
MMT/2HT sample, whose heating causes a fully reversible increase
of the interlayer distance, of nearly 0.3 nm. The upper part of Fig.
1.11 refers to MMT/2HT/SA, whose heating leads to a reversible
decrease of the interlayer distance of nearly 1.0 nm. In this case,
however, a substantial hysteresis in the interlayer spacing recovery is
observed.
Fig. 1.11. d001 values determined in the temperature range 25°C –
80°C, every 5 °C, for MMT/2HT and MMT/2HT/SA.
The hexagonal rotator order for the packing of paraffinic
chains belonging to the ammonium cation and to the guest (either
SA or SAES) was further investigated by performing successive
WAXD analysis of the MT/2HT/SA organoclay: at room

21
temperature (RT), then at 80 °C and, finally, at RT, upon cooling
the OC.
Fig. 1.12 shows the X-ray diffraction patterns taken at the
mentioned temperatures. It can be clearly seen that the hexagonal
rotator order is present at RT, is then lost at 80 °C and is again
visible, when the OC is cooled to RT.
Fig. 1.12. X-ray diffraction patterns (Cu Kα) of MMT/2HT/SA
sample prepared through the neat synthesis. Patterns subsequently
taken at: (A) RT, (B) 80 °C and at (C) RT upon cooling the OC.
1.2.4 Structures of Organoclays
The overall analysis of data arising from the characterization of OCs
reveals that three main types of organically modified MMT are
obtained from the neat synthesis of MMT with 2HTCl and,
optionally, either SA or SAES. Said three main types of organically
modified MMT are characterized by a typical d001 interlayer
distance: 2.5 nm, 4.0 nm, 6.0 nm. The d001 clay interlayer distance

22
depends on the placement of the paraffinic chains of the amphiphile
modifier of the clay layer, and, more in particular, is a function of
the tilting angle of said chains. The structures shown in Fig. 1.13
could be preliminary proposed to justify the experimental findings.
Bilayer tilted placements, with tilting angles of φ = 72° and of 54°
with respect to the normal to the clay layers, are proposed to justify
the 2.5 nm and 4.0 nm interlayer distances, respectively. These
distances depend on the amount of the compensating cation present
in the interlayer space. A perpendicular placement of paraffinic
chains accounts for the 6.0 nm distance. These d001 values can be
considered to correspond to minima of energy for the organically
modified MMT.
Fig. 1.13. Plausible structures for OCs with: (A) 2HT + SA or
SAES, (B) 2HT, (C) 2HT, after extraction with ethyl acetate. The
cylinders indicate hydrocarbon tails of the ammonium cation (blue)
or of the additional polar guest (red). The definition of the alkyl
chains tilt angle φ is shown in B and C.

23
The structures proposed above can be also rationalized
taking into account that the orientation of the alkyl chains is a
function of the cross-sectional area of the paraffinic chains of the
amphiphile (AC), defined as the cross-section perpendicular to the
outstretched hydrocarbon chains in relation to the available clay
surface per amphiphile (AS).[47]
The increase of the cross-sectional area of the paraffinic
chains of the amphiphile generally leads to a reduction of the tilting
angle and, when AC is very close to AS, the paraffinic chains become
perpendicular to the clay layer surfaces.[47]
In the case of the OC with stearic acid as the guest, the
interaction of the acid group of stearic acid with the ammonium
group of the amphiphile exhibiting two long alkyl chains (2HT),
leads to three parallel alkyl chains, which locally produce large
cross-sectional areas, and thus in turn leading to their perpendicular
orientation with respect to the clay layers.
Ordered OCs structures were prepared by the neat synthesis
of MMT with 2HTCl, adding optionally, either SA or SAES. The
interaction of rubber with OCs prepared both in the solid state and
by using the rubber matrix as reaction medium will be discussed in
chapter 3 in Section II. In the next paragraph the exfoliation of
intercalated clays by supercritical carbon dioxide and the
conservation of their exfoliation state in clay rich polymer/clay
aerogels will be discussed.
1.3 Clay Exfoliation and Polymer/Clay Aerogels by
Supercritical Carbon Dioxide
Intercalated clays are interesting intermediate materials that allow to
prepare not only ordered intercalate structures, but also disordered
structures. Mechanical treatments of intercalated clays are reported
as effective routes to produce exfoliated clays.[48,49]
Many reports show that different processing techniques

24
based on supercritical carbon dioxide (scCO2) constitute effective
ways to increase dispersion and exfoliation in polymer/clay
nanocomposites. However, X-ray characterization of most samples
show the presence of basal 00ℓ reflections, clearly indicating that
treatments with scCO2 are generally unsuitable to induce complete
organoclay exfoliation.[50–56]
Only some reports, from the Kannan’s group, show that a
complete disappearance of the 00ℓ reflections (and hence a complete
exfoliation) can be achieved by scCO2 treatments on pure
organoclays, where alkali counterions have been exchanged with
long-chain alkylammoniums.[57,58] However, as a consequence of
preparation of polymer nanocomposites, the 00ℓ reflections
reappear with peak height and location essentially independent of
the processing conditions.[58]
scCO2 treatments are also effective to prepare monolithic
aerogels, by drying of wet gels. Aerogels constitute a unique class of
materials, characterized by a highly porous network being attractive
for many applications such as thermal and acoustic insulation,
capacitors or catalysis.[59–63]
In recent years, the scCO2 extraction of gels of suitable
thermoplastic polymers, like syndiotactic polystyrene (sPS) [64–66]
has allowed the preparation of a special class of monolithic
aerogels,[67–70] that present, beside disordered amorphous
micropores (typical of all aerogels), identical nanopores of
nanoporous-crystalline phases (see Fig. 1.14).
25
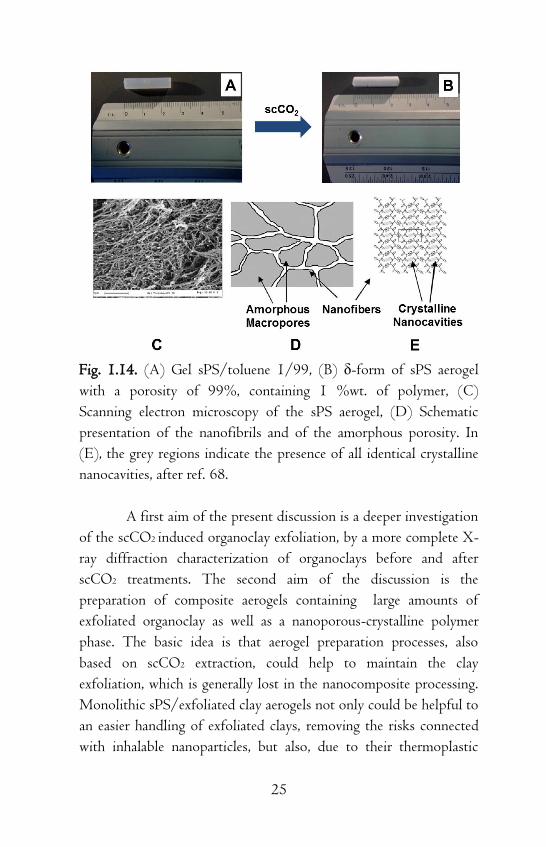
Fig. 1.14. (A) Gel sPS/toluene 1/99, (B) δ-form of sPS aerogel
with a porosity of 99%, containing 1 %wt. of polymer, (C)
Scanning electron microscopy of the sPS aerogel, (D) Schematic
presentation of the nanofibrils and of the amorphous porosity. In
(E), the grey regions indicate the presence of all identical crystalline
nanocavities, after ref. 68.
A first aim of the present discussion is a deeper investigation
of the scCO2 induced organoclay exfoliation, by a more complete X-
ray diffraction characterization of organoclays before and after
scCO2 treatments. The second aim of the discussion is the
preparation of composite aerogels containing large amounts of
exfoliated organoclay as well as a nanoporous-crystalline polymer
phase. The basic idea is that aerogel preparation processes, also
based on scCO2 extraction, could help to maintain the clay
exfoliation, which is generally lost in the nanocomposite processing.
Monolithic sPS/exfoliated clay aerogels not only could be helpful to
an easier handling of exfoliated clays, removing the risks connected
with inhalable nanoparticles, but also, due to their thermoplastic

26
nature, could be used as exfoliated clay “masterbatches” for
composite processing, also for rubber compounds. The commercial
Dellite® 67G was selected as the starting OC. The preparation and
the characterization of polymer/clay aerogels were performed in
collaboration with Dr. Simona Longo of the Department of
Chemistry and Biology of the University of Salerno.
1.3.1 Organoclay Exfoliation by Supercritical Carbon
Dioxide
The X-ray diffraction patterns of Dellite® 67G of Fig. 1.15A, after
short term and long term treatments by scCO2 are shown in Fig.
1.15B and 1.15C, respectively.
Fig. 1.15. X-ray diffraction (Cu K) patterns in the 2 range 2-80°
of Dellite® 67G before (A) and after 16h (B) and 32h (C) scCO2
treatments. The inset in B and C enlarges the 2 range 2-10°.The
Miller index 110r indicate the reflection relative to the rotator order
of the long hydrocarbon chains within the interlayer space.
For the intermediate pattern of Fig. 1.15B, the intensities of

27
the 00ℓ peaks as well as of the rotator order peak (100r) are
strongly reduced (see also the inset of Fig. 1.15B). The in-plane
020, 210 and 060 peaks maintain their intensity and narrowness.
This indicates that short term scCO2 treatments lead to a nearly
complete clay exfoliation with maintenance of the in-plane order. In
agreement with previous results,[58] the X-ray diffraction pattern of
the OC, after long-term scCO2 treatments, does not show anymore
the 00ℓ reflections (see also the inset of Fig. 1.15C): clay exfoliation
is achieved. It is worth adding that the in-plane 020, 210 and 060
reflections are still present, although become less intense than a
broad amorphous halo that appears in the 2θ range 20°-30°. This
amorphous halo can be attributed to a loss of order in the stacking
of the clay layers, also associated with a complete loss of order in the
packing of the hydrocarbon tails.
In summary, the described long-term scCO2 treatments lead
to exfoliation of the OC, and to a complete loss of long-range lateral
order of the hydrocarbon tails of the cationic surfactant. The
maintenance of hk0 reflections (mainly of the isolated 060
reflection), not yet reported in the literature, assures the maintenance
of a long-range order in the clay layers. In this respect, it is worth
adding that the half-height width of the 060 reflection, after
exfoliation, remains equal to 0.45°, indicating a correlation length
D060 = 28 nm.
Relevant additional information, relative to the as received
and scCO2-treated OC, can be obtained by DSC scans (see Fig.
1.16). The scan of the as received OC (Fig. 1.16A) presents a
reversible transition nearly located at 47°C (Hr ≈ 24 J/g) that
corresponds to the loss of rotator order of the hydrocarbon tails of
the cations intercalated in the interlayer space. The DSC scan of the
scCO2 treated OC does not present any thermal transition in the
considered temperature range (Fig. 1.16B) and hence indicates the
loss of 3D order in the packing of the hydrocarbon tails of the

28
ammonium surfactant, which is compatible with clay exfoliation.
Fig. 1.16. DSC heating scans of: (A) as received intercalated OC
(Dellite® 67G); (B) OC after treatment by scCO2 (exfoliated); (C,
D) aerogels with 90% of porosity, with 50/50 weight ratio of
sPS/intercalated OC (C) and of sPS/exfoliated OC (D).
The overall information arising from X-ray diffraction and
DSC characterization allows to conclude that the as received and
scCO2 treated OC can be described as intercalated and exfoliated
OC, respectively.
1.3.2 Monolithic Nanoporous Polymeric Aerogels with
Large Organoclay Content
Monolithic composite aerogels, filled with large fractions of
intercalated and exfoliated OC, have been prepared by using an sPS
matrix. This polymer choice is mainly due to the ability of sPS to
produce monolithic aerogels in a very broad range of porosity (from

29
50% up to 99%).[67,68]
Aerogels with a porosity of nearly 90% were obtained by
scCO2 extraction of gels with a 1,2-dichloro benzene (DCB) content
of 90 %wt. and with different sPS/OC weight ratios. For all
aerogels with polymer/OC ratio equal or higher than 80/20,
monolithic structures were obtained. Moreover, as usual for sPS
based aerogels,[67,68] the size and shape of sPS/clay aerogels are
essentially the same of the precursor gels. Aerogels with a 50/50
polymer/OC ratio are brittle and are generally obtained as powders.
X-ray diffraction (Cu K) patterns of sPS based aerogels,
containing intercalated and exfoliated OC, are shown in Fig. 1.17
and 1.18, respectively.
All patterns of Fig. 1.17 show the typical reflections of the
nanoporous-crystalline δ form. In particular, the isolated intense 010
reflection is always clearly apparent and located at 2θ ≈ 8.4°. The
00ℓ reflections of the OC are not detected for the aerogels with low
clay content (4 and 8 %wt.) while for higher clay contents (20 and
50 %wt.) a narrow and intense 001 reflection is present, while the
002 and 003 reflections of the starting clay have disappeared.
Moreover, the 001 reflection is markedly shifted with respect to its
original position (from 2θ = 2.6° up to 2θ = 3.8°), indicating a
decrease of the interlayer spacing from d = 3.5 nm down to d = 2.3
nm.
The results of Figs 1.17A-C suggest that the aerogel
preparation procedure involving scCO2 extraction, for low OC
content, could lead to clay exfoliation, as already observed for scCO2
treatment of the neat OC in Fig. 1.15. Figs 1.17D,E show that, for
high OC content in the aerogels, the used procedure is not suitable
to generate OC exfoliation but, on the contrary, a reduction of the
interlayer spacing is observed. An analogous phenomenon of
reduction of interlayer spacing has been observed for OC extraction
with ethyl acetate, as already described in paragraph 1.2. The

30
observed reduction of basal spacing can be attributed to the
extraction of excess cationic surfactant, not being ionically bonded
to the negatively charged clay layers, but being simply included in
the interlayer space by non-bonded interactions and contributing to
the crystalline order of the hydrocarbon tails.
Fig. 1.17. X-ray diffraction (Cu K) patterns in the 2 range 2-35°
of sPS aerogels with as received OC, as obtained from gels with a
solvent content of 90 %wt. and presenting different polymer/OC
weight ratios: (A) 100/0; (B) 96/4; (C) 92/8; (D) 80/20; (E)
50/50. The insets C', D' and E' enlarge the 060 in-plane reflection
of the clay. The Miller indexes of the main reflections of the
nanoporous-crystalline δ form of sPS are indicated in A.
Additional information on the structural organization in the
sPS/OC aerogels comes from DSC analyses. In particular, DSC
heating scan of a 50/50 by %wt. sPS/as-received-clay aerogel is
shown in Fig. 1.16C. The endothermic peak, corresponding to loss

31
of rotator order in the interlayer spacing becomes broader and its
maximum is shifted up to 50-60°C, with only a minor reduction of
the related enthalpy (Hr ≈ 10 J/g ≈ 20 J/gOC).
The combined information of the X-ray diffraction patterns
of Figs 1.17D,E and the DSC scans of Fig. 1.16C indicates that, for
high clay content, the aerogel preparation procedure brings to a
reduction of the OC basal spacing (d001) from 3.5 nm down to 2.3
nm, with only partial loss of the hydrocarbon rotator order in the
interlayer space.
The X-ray diffraction patterns of the sPS aerogels prepared
with the exfoliated OC (Fig. 1.18), independently of the aerogel
composition, do not show 00ℓ clay reflections, while show the
isolated weak 060 in-plane clay reflection (as shown by the inset of
Fig. 1.18C',D'). This clearly indicates that the gel and aerogel
preparation procedures, also for high clay concentrations, allow to
maintain clay exfoliation without re-aggregation.
In this respect, it is worth citing that X-ray diffraction
patterns of polymer-clay aerogels as obtained by freeze-drying of
polymer solutions including clays [71–73] show the presence of 00ℓ
clay reflections, which exclude the occurrence of exfoliation.
The patterns of Fig. 1.18 also show that sPS is generally
crystallized in the nanoporous δ form (Figs 1.18A-C) while, for the
50/50 polymer/exfoliated-OC aerogel, the sPS crystallization does
not occur (broad amorphous halo of Fig. 1.18D). This is probably
due to the good dispersion of a large amount of exfoliated OC,
leading to a diluting effect on sPS that reduces its crystallization
kinetics. This loss of polymer crystallinity leads to a loss of the
typical fibrillar structure, which in turn allows rationalizing the loss
of monolithic structure.

32
Fig. 1.18. X-ray diffraction (Cu K) patterns in the 2 range 5-50°
of sPS aerogels with exfoliated OC, as obtained from gels with a
solvent content of 90 %wt. and presenting different polymer/OC
weight ratios: (A) 100/0; (B) 95/5; (C) 80/20; (D) 50/50. The
inset C’, D’ enlarges the 060 in-plane reflection of the clay.
1.3.3 Comparison between Aerogels with Intercalated and
Exfoliated Organoclays
This section presents a strict comparison between properties of sPS
monolithic aerogels exhibiting a porosity of 90% and a OC content
of 20 %wt., as obtained by using intercalated or exfoliated OC, that
present the X-ray diffraction patterns shown in Figs 1.17D and
1.18C, respectively.
On the basis of quantitative evaluations on the X-ray
diffraction patterns, the two aerogels present similar degree of
polymer crystallinity (≈ 40%). However, aerogels with the
exfoliated clay (Fig. 1.19A) are much more homogeneous than
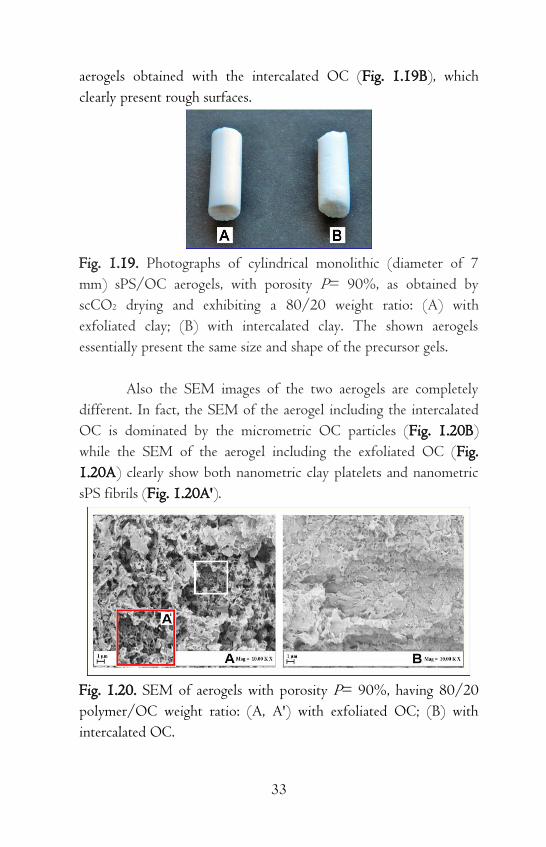
33
aerogels obtained with the intercalated OC (Fig. 1.19B), which
clearly present rough surfaces.
Fig. 1.19. Photographs of cylindrical monolithic (diameter of 7
mm) sPS/OC aerogels, with porosity P= 90%, as obtained by
scCO2 drying and exhibiting a 80/20 weight ratio: (A) with
exfoliated clay; (B) with intercalated clay. The shown aerogels
essentially present the same size and shape of the precursor gels.
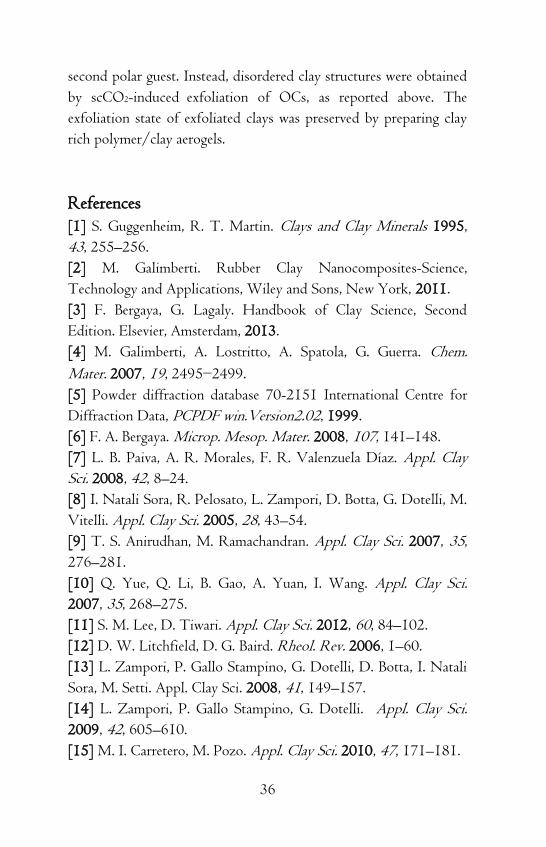
Also the SEM images of the two aerogels are completely
different. In fact, the SEM of the aerogel including the intercalated
OC is dominated by the micrometric OC particles (Fig. 1.20B)
while the SEM of the aerogel including the exfoliated OC (Fig.
1.20A) clearly show both nanometric clay platelets and nanometric
sPS fibrils (Fig. 1.20A').
Fig. 1.20. SEM of aerogels with porosity P= 90%, having 80/20
polymer/OC weight ratio: (A, A') with exfoliated OC; (B) with
intercalated OC.

34
The results of the SEM analyses suggest that also the large
difference in the visual appearance between the two aerogels of Fig.
1.19 could be due to micrometric and nanometric size of
intercalated and exfoliated clays, respectively.
DMA analyses (see paragraph 9.13 in Section IV for
experimental details) indicate that the aerogel based on the
exfoliated clay present an elastic modulus definitely higher than for
those based on intercalated OC (36 MPa vs 15 MPa).
Surface areas, SBET, as obtained by N2 adsorption data at 77 K,
for the intercalated and exfoliated OC, as well as those of the
corresponding aerogels, are compared in Table 1.1. For the sake of
comparison, SBET of the neat sPS aerogel presenting the same
porosity is shown in the last row of Table 1.1. As well known, sPS
aerogels exhibit high surface areas, mainly associated with the
crystalline cavities of the δ crystalline phase, but also associated with
the amorphous aerogel porosity.[67,68] In agreement with literature
data,[74] SBET of the OC is rather low and is substantially increased
for the exfoliated OC (SBET = 18 m2/g). The sPS/exfoliated-clay
aerogels present values of SBET (281 m2g-1) much higher than those
of the sPS/intercalated-clay aerogels (166 m2g-1) and not far from
those observed for pure sPS aerogels (312 m2g-1). This indicates
that, also for this high OC content (20 %wt.), the exfoliated clay
not only does not disturb the formation of the nanoporous
crystalline phase but also does not alter the amorphous aerogel
porosity.

35
Table 1.1. Total surface area (SBET) of OC samples and of aerogels
with porosity P= 90%, having 80/20 polymer/OC weight ratio.
Sample SBETa (m2g-1)
Intercalated OC (Dellite® 67G) 10
Exfoliated OC (scCO2 treated) 18
sPS/intercalated-OC, 80/20 aerogel 166
sPS/exfoliated-OC, 80/20 aerogel 281
Aerogel δ sPS 312
aTotal area evaluated following the BET model in the standard
0.05<P/P0 <0.3 pressure range.
A schematic representation of the sPS/exfoliated-OC aerogels is
shown in Scheme 1.4.
Scheme 1.4. Schematic representation of the sPS/exfoliated-OC
aerogels.
So, a thorough investigation of scCO2-induced exfoliation of
OCs was conducted mainly by X-ray diffraction and DSC
characterization techniques.
A complete control over the degree of order of the OC
structures was achieved. In particular ordered clay structures were
obtained by intercalation of long-chain ammonium cations in the
interlayer spaces of pristine MMT, in presence or in absence of a
36
second polar guest. Instead, disordered clay structures were obtained
by scCO2-induced exfoliation of OCs, as reported above. The
exfoliation state of exfoliated clays was preserved by preparing clay
rich polymer/clay aerogels.
References
[1] S. Guggenheim, R. T. Martin. Clays and Clay Minerals 1995,
43, 255–256.
[2] M. Galimberti. Rubber Clay Nanocomposites-Science,
Technology and Applications, Wiley and Sons, New York, 2011.
[3] F. Bergaya, G. Lagaly. Handbook of Clay Science, Second
Edition. Elsevier, Amsterdam, 2013.
[4] M. Galimberti, A. Lostritto, A. Spatola, G. Guerra. Chem.
Mater. 2007, 19, 2495−2499.
[5] Powder diffraction database 70-2151 International Centre for
Diffraction Data, PCPDF win.Version2.02, 1999.
[6] F. A. Bergaya. Microp. Mesop. Mater. 2008, 107, 141–148.
[7] L. B. Paiva, A. R. Morales, F. R. Valenzuela Díaz. Appl. Clay
Sci. 2008, 42, 8–24.
[8] I. Natali Sora, R. Pelosato, L. Zampori, D. Botta, G. Dotelli, M.
Vitelli. Appl. Clay Sci. 2005, 28, 43–54.
[9] T. S. Anirudhan, M. Ramachandran. Appl. Clay Sci. 2007, 35,
276–281.
[10] Q. Yue, Q. Li, B. Gao, A. Yuan, I. Wang. Appl. Clay Sci.
2007, 35, 268–275.
[11] S. M. Lee, D. Tiwari. Appl. Clay Sci. 2012, 60, 84–102.
[12] D. W. Litchfield, D. G. Baird. Rheol. Rev. 2006, 1–60.
[13] L. Zampori, P. Gallo Stampino, G. Dotelli, D. Botta, I. Natali
Sora, M. Setti. Appl. Clay Sci. 2008, 41, 149–157.
[14] L. Zampori, P. Gallo Stampino, G. Dotelli. Appl. Clay Sci.
2009, 42, 605–610.
[15] M. I. Carretero, M. Pozo. Appl. Clay Sci. 2010, 47, 171–181.
37
[16] K. Campbell, D. Q. M. Craig, T. McNally. Int. J. Pharm.
2008, 363, 126–131.
[17] G. V. Joshi, B. D. Kevadiya, H. A. Patel, H. C. Bajaj, R. V.
Jasra. Int. J. Pharm. 2009, 374, 53–57.
[18] C. Viseras, P. Cerezo, R. Sanchez, I. Salcedo, C. Aguzzi. Appl.
Clay Sci. 2010, 48, 291–295.
[19] P. C. LeBaron, Z. Wang, T. J. Pinnavaia. Appl. Clay Sci. 1999,
15, 11–29.
[20] M. Alexandre, P. Dubois. Mat. Scie. Eng. 2000, 28, 1–63.
[21] S. S. Ray, M. Okamoto. Progr. Polym. Sci. 2003, 28, 1539–
1641.
[22] B. Chen, J. R. G. Evans, H. C. Greenwell, P. Boulet, P. V.
Coveney, A. A. Bowden, A. Whiting. Chem. Soc. Rev. 2008, 37,
568–594.
[23] C. Della Porta. Industrial treatments and modification of clay
minerals, in: M. Galimberti (Ed.), Rubber Clay Nanocomposites -
Science, Technology and Applications, Wiley and Sons, New York,
pp. 87–100, 2011.
[24] M. Galimberti, S. Senatore, L. Conzatti, G. Costa, G. Giuliano,
G. Guerra. Polym. Adv. Technol. 2009, 20, 135–142.
[25] M. Galimberti, S. Giudice, V. Cipolletti, G. Guerra. Polym.
Adv. Technol. 2010, 21, 679–684.
[26] M. Ogawa, T. Handa, K. Kuroda, C. Kato. Chem. Lett. 1990,
19, 71–74.
[27] M. Ogawa, M. Hirata, K. Kuroda, C. Kato. Chem. Lett. 1992,
365–368.
[28] M. Ogawa, H. Shirai, K. Kuroda, C. Kato. Clays and Clay
Minerals 1992, 40, 485–490.
[29] J. Bujdak, H. Slosiarikova. Appl. Clay Sci. 1992, 7, 263–269.
[30] D. Merinska, Z. Malac, M. Pospisil, Z. Weiss, M. Chmielova,
P. Capkova, J. Simonik. Comp. Interf. 2002, 9, 529–540.
[31] P. Capková, M. Pospíšil, M. Valášková, D. Merínská, M.
Trchová, Z. Sedláková, Z. Weiss, J. Šimoník. J. Coll. Intera. Sci.

38
2006, 300, 264–269.
[32] K. I. Breakwell, J. Homer, M. A. M. Lawrence, W. R.
McWhinnie. Polyedron 1995, 14, 2511–2518.
[33] G. W. Beall, M. Gross. Appl. Clay Sci. 2004, 27, 179–186.
[34] S. Yoshimoto, F. Osashi, T. Kameyama. Sol. Sta. Comm. 2005,
136, 251–256.
[35] U. Riaz, S. M. Ashraf. Appl. Clay Sci. 2011, 52, 179–183.
[36] L. B. Paiva, A. R. Morales. Braz. J. Chem. Eng. 2012, 29, 525–
536.
[37] S. Y. Chazhengina, E. N. Kotelnikova, I. V. Filippova, S. K.
Filatov. J. Mol. Struct. 2003, 647, 243–257.
[38] M. Dirand, Z. Achour-Boudjema. J. Mol. Struct. 1996, 375,
243–248.
[39] V. Chevallier, D. Petitjean, M. Bouroukba, M. Dirand. Polymer
1999, 40, 2129–2137.
[40] D. Fu, Y. Liu, Y. Su, G. Liu, D. Wang. J. Phys. Chem. B 2011,
115, 4632–4638.
[41] D. Fu, Y. Liu, G. Liu, Y. Su, D. Wang. Phys. Chem. Chem.
Phys. 2011, 13, 15031–15036.
[42] G. Ungar, N. Mašić. J. Phys. Chem. 1985, 89, 1036–1042.
[43] T. Itoh, N. Ohta, T. Shichi, T. Yui, K. Takagi. Langmuir
2003, 19, 9120–9126.
[44] M. Mauro, M. Maggio, V. Cipolletti, M. Galimberti, P. Longo,
G. Guerra. Carbon 2013, 61, 395–403.
[45] M. A. Osman, M. Ernst, B. H. Meier, U. W. Suter. J. Phys.
Chem. B 2002, 106, 653–662.
[46] M. E. Rerek, D. Van Wyck, R. Mendelsohn, D. J. Moore.
Chem. Phys. Lipids 2005, 134, 51–58.
[47] H. Heinz, H. J. Castelijns, U. W. Suter. J. Am. Chem. Soc.
2003, 125, 9500-9510.
[48] Y. C. Lee, C. L. Kuo, S. B. Wen, C. P. Lin. Appl. Clay Sci.
2007, 36, 265–270.
[49] A. R. Ramadan, A. M.K. Esawi, A. A. Gawad. Appl. Clay Sci.

39
2010, 47, 196–202.
[50] K. C. Baker, M. Manitiu, R. Bellair, C. A. Gratopp, H. N.
Herkowitz, R. M. Kannan. Acta Biomaterialia 2011, 7, 3382–3389.
[51] C. Chen, J. Samaniuk, D. G. Baird, G. Devoux, M. Zhang, R.
B. Moore, J. P. Quigley. Polymer 2012, 53, 1373–1382.
[52] S. Feng-hua, H. Han-xiong, Z. Yang. Compos. Part B 2011,
42, 421–428.
[53] J. Ma, E. Bilotti, T. Peijs, J. A. Darr. Eur. Polym. J. 2007, 43,
4931–4939.
[54] Q. T. Nguyen, D. G. Baird. Polymer 2007, 48, 6923–6933.
[55] J. Samaniuk, D. Litchfield, D. Baird. Polym. Eng.& Sci. 2009,
49, 2329–2341.
[56] M. A. Treece, J. P. Oberhauser. J. Appl. Polym. Sci. 2007, 103,
884–892.
[57] S. Horsch, G. Serhatkulu, E. Gulari, R. M. Kannan. Polymer
2006, 47, 7485−7496.
[58] M. Manitiu, R. J. Bellair, S. Horsch, E. Gulari, R. M. Kannan.
Macromolecules 2008, 41, 8038–8046.
[59] M. L. Anderson, R. M. Stroud, D. R. Rolison. Nano Letters
2002, 2, 235–240.
[60] S. S. Kistler. Nature 1931, 127, 741.
[61] S. O. Kucheyev, M. Stadermann, S. J. Shin, J. H. Satcher, S. A.
Gammon, S. A. Letts, T. Van Buuren, A. V. Hamza. Adv. Mater.
2012, 24, 776−780.
[62] S. Longo, J. G. Vitillo, C. Daniel, G. Guerra. ACS Appl. Mater.
Interf. 2013, 5, 5493−5499.
[63] S. Malik, D. Roizard, J. M. Guenet. Macromolecules 2006, 39,
5957–5959.
[64] C. De Rosa, G. Guerra, V. Petraccone, B. Pirozzi.
Macromolecules 1997, 30, 4147–4152.
[65] G. Milano, V. Venditto, G. Guerra, L. Cavallo, P. Ciambelli,
D. Sannino. Chem. Mater. 2001, 13, 1506–1511.
[66] V. Petraccone, O. Ruiz de Ballesteros, O. Tarallo, P. Rizzo, G.

40
Guerra. Chem. Mater. 2008, 20, 3663–3668.
[67] C. Daniel, D. Alfano, V. Venditto, S. Cardea, E. Reverchon, D.
Larobina, G. Mensitieri, G. Guerra, G. Adv. Mater. 2005, 17,
1515–1518.
[68] C. Daniel, S. Giudice, G. Guerra. Chem. Mater. 2009, 21,
1028–1034.
[69] C. Daniel, S. Longo, R. Ricciardi, E. Reverchon, G. Guerra.
Macromol. Rapid. Commun. 2013, 34, 1194–1207.
[70] G. Guerra, C. Daniel, P. Rizzo, O. Tarallo. J. Polym. Sci. Part
B 2012, 50, 305–322.
[71] S. Bandi, M. Bell, D. A. Schiraldi. Macromolecules 2005, 38,
9216–9220.
[72] T. Pojanavaraphan, D. A. Schiraldi, R. Magaraphan. Appl. Clay
Sci. 2010, 50, 271–279.
[73] Y. Wang, S. M. Alhassan, V. H. Yang, D. A. Schiraldi.
Composites: Part B 2013, 45, 625–630.
[74] Y. Park, G. A. Ayoko, R. L. Frost. J. Colloid Interface Sci.
2011, 360, 440–456.

41
Chapter 2
Graphites and Derived Compounds
2.1 Carbon Allotropes
Carbon, the sixth element in the Periodic Table of Elements, is truly
remarkable for its extraordinary ability of catenation to combine
with itself and other chemical elements in different ways and thereby
form the basis of organic chemistry and of life. Diamond and
graphite are well-known allotropes of carbon. Elemental carbon with
sp3 hybridization builds up a tetrahedral lattice, giving rise to
diamond (Fig. 2.1A), while sp2 hybridized extended networks are
responsible for the formation of graphite (Fig. 2.1B).
Fig. 2.1. Crystal structures of (A) diamond and (B) hexagonal
graphite.
Graphene is an atomically thick, two-dimensional (2D)
sheet composed of sp2 carbon atoms arranged in a honeycomb
structure (Scheme 2.1). It has been viewed as the building block of
all other graphitic carbon allotropes of different dimensionality. For

42
example, graphite (3D carbon allotrope) is made of graphene sheets
piled on top of each other with …ABABAB… stacking and
separated by 0.335 nm. More disordered graphitic structures exist
for coals, cokes and carbon blacks. The 0D carbon allotrope,
fullerenes (buckyballs), can be envisioned to be made by wrapping a
section of graphene sheet. The 1D carbon allotropes, carbon
nanotubes (CNT), can be made by rolling graphene sheets.
Scheme 2.1. Mother of all graphitic forms. Graphene is a 2D
building material for carbon materials of all other dimensionalities.
It can be wrapped up into 0D buckyballs, rolled into 1D nanotubes,
piled with a …ABABAB… stacking into 3D graphite or randomly
stacked in primary particles of carbon black.
2.2 Structures of Layered Carbons
Materials with layers of sp2-bonded carbon atoms exhibit a large
variety of structures characterized by different degree of structural
order and morphologies. These materials, principally, differ for their
degree of order perpendicular to the graphitic layers (out-of-plane
order) and in the graphitic layers (in-plane order).
The structures of layered carbons, from ordered graphites to
amorphous carbons, are discussed in the following.
43
A systematic X-ray diffraction characterization of different
graphitic materials was also performed, in order to select the most
suitable starting material for the preparation of anisotropic carbon
nanofillers to be used in rubber nanocomposites.
2.2.1 Graphites
Graphite is a crystalline, polymorphic form of elementary carbon
with ordered layers. Each carbon atom in the graphite crystal is
hybridised trigonally, forming three σ and one π bonds. The
hybridised orbitals of the sp2 type give σ bonds of a length of 1.42
Å, arranged at 120° angles with respect to one another, with sheets
made up of regular hexagons. The fourth electron of each atom,
being in the p orbital, forms π bonds with all the neighbouring
atoms. The structure of graphite consists of six-membered rings in
which each carbon atom has three near neighbours at the apices of
an equilateral triangle. Within the large planar layers, there are
linkages intermediate between atomic and metallic bonds. The layers
in the crystal are held together by van der Waals bonding forces.
Weak bonding perpendicular to the layers gives rise to easy gliding
parallel to the sheets.[1]
According to the structural model proposed by Hull in
1917 [2] and described by Bernal in 1924,[3] the hexagonal unit
cell of hexagonal graphite contains four atoms in the positions listed
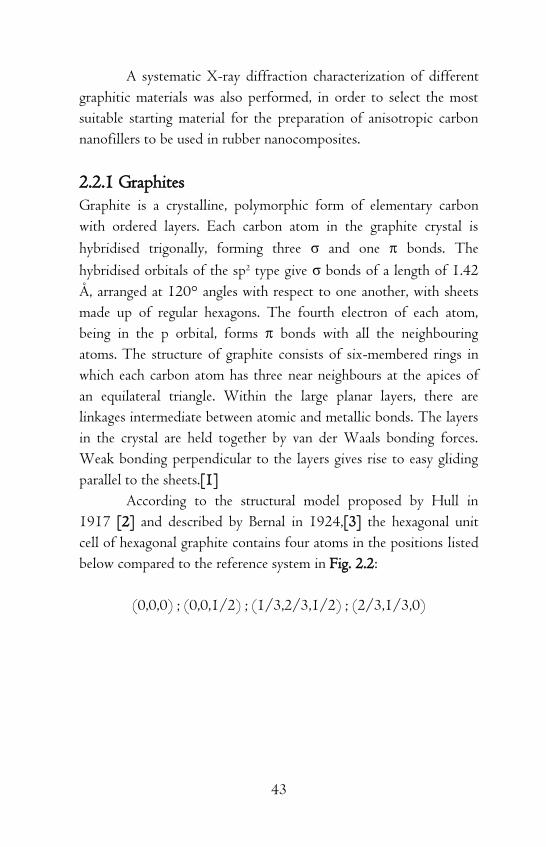
below compared to the reference system in Fig. 2.2:
(0,0,0) ; (0,0,1/2) ; (1/3,2/3,1/2) ; (2/3,1/3,0)
44
Fig. 2.2. Detailed crystal structure of hexagonal graphite.
Hexagonal graphite consists of sheets stacked along the
crystallographic c axe with a regular …ABABAB… sequence and
lattice costant c0 = 0.67 nm (see Fig. 2.2).
The X-ray diffraction analysis is the most powerful tool to
study the structure of graphites and of carbon materials in general.
The hexagonal graphite reflections can be classified into three
groups: reflections with 00ℓ, hk0 and hkℓ indices. Reflections with
00ℓ are due to the diffraction from the basal planes stacked along
the crystallographic c axe. Only even ℓ values are permitted because
of the systematic extinction of 00ℓ reflections with odd ℓ values,
related to the …ABABAB… stacking. Reflections with hk0 are due
to the diffraction from the crystal planes perpendicular to the basal
planes and the hkℓ reflections are related to the diffraction from the
inclined planes respect to the basal planes.
The X-Ray diffraction pattern of hexagonal graphite in Fig.
2.3 [4] presents the 002, 004 and 006 reflections characteristic of
the stacking along the crystallographic c axe, while the 100 and 110

45
reflections are related to the order inside the graphitic layers. The
distance between the A and B planes is the Bragg’s distance d002 =
0.335 nm and the distance between the A and A planes is the lattice
costant c0 = 2d002 = 0.67 nm. The Bragg’s distances d100 = a0∙
cos(30°) = 0.213 nm and d110 = a0∙ sin(30°) = 0.123 nm, are
related to the 100 and 110 planes, orthogonal to the A and B planes
(see Fig. 2.2).
Fig. 2.3. X-ray diffraction (Cu Kα) pattern of hexagonal graphite,
after ref. 4.
2.2.2 Turbostratic Graphites
The described hexagonal structure of graphite refers to its crystalline
form defined as ideal models. However, in nature graphite usually
appears in less perfect forms and in a variety of disordered types
from the so-called turbostratic graphites to the amorphous carbons.
According to the random layer lattice structural model
proposed by Warren in 1941, turbostratic graphite is characterized
by the lack of …ABABAB… stacking with graphitic sheets
randomly translated to each other and rotated respect to the normal
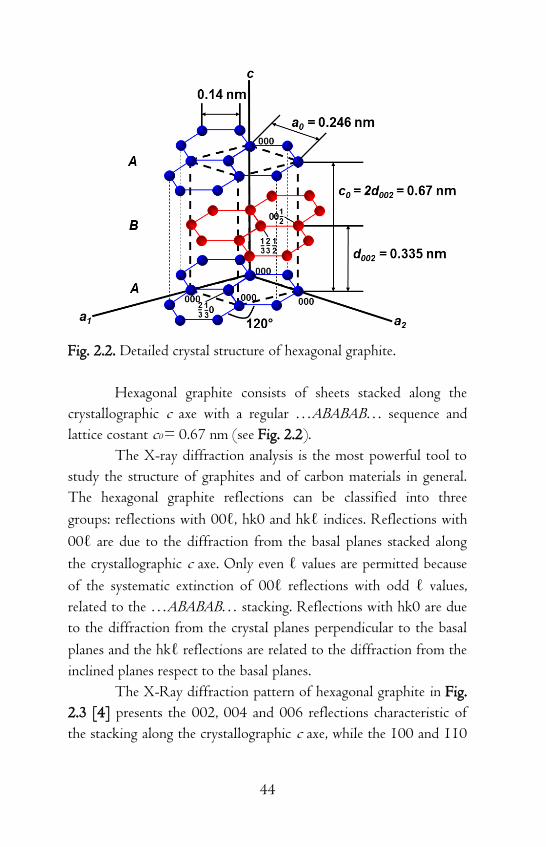
of the layers (see Scheme 2.2).[5]
46
Scheme 2.2. Top view of the turbostratic graphite structures
compared with the hexagonal graphite structure, after ref. 4.
Distortions from the hexagonal graphite structure determine
the intensity decrease or the disappearance of hkℓ reflections, such as
101, 102, 103, 104, 105 and 112, while the 00ℓ and the hk0
reflections are not suppressed. The Bragg’s distance d002 and the
width at half height β002 increase.[6]
Turbostratic structures are often observed in extensively
ball-milled graphites [7] or in carbon materials heated at relatively
low temperatures of 1300 – 1500 °C,[8] where the size of each
layer is small and only a few layers are stacked in ordered manner. By
heating these carbons to high temperatures, up to 3000 °C,[9] both
the size and number of stacked layers usually increase, and the
regularity in stacking is also improved. Heat treatment at
intermediate temperatures gives a partial improvement in stacking
regularity. A wide range of structures from completely turbostratic
structures to graphite structures with pure …ABABAB… stacking is
possible, depending primary on the starting materials and the heat
treatment temperature.
47
2.2.3 Amorphous Carbons
Amorphous carbons such as coals, cokes and carbon blacks are
materials without long-range crystalline order. Short-range graphite-
like order still exists, and the degree of this kind of order gives rise
to intermediate structures between the graphitic and the completely
amorphous (lack of any crystalline structure) carbons, according to
the random layer lattice structural model.[5] Deviations of the
interatomic distances and interbonding angles with respect to the
graphite lattice as well as to the diamond lattice occur in such
materials.
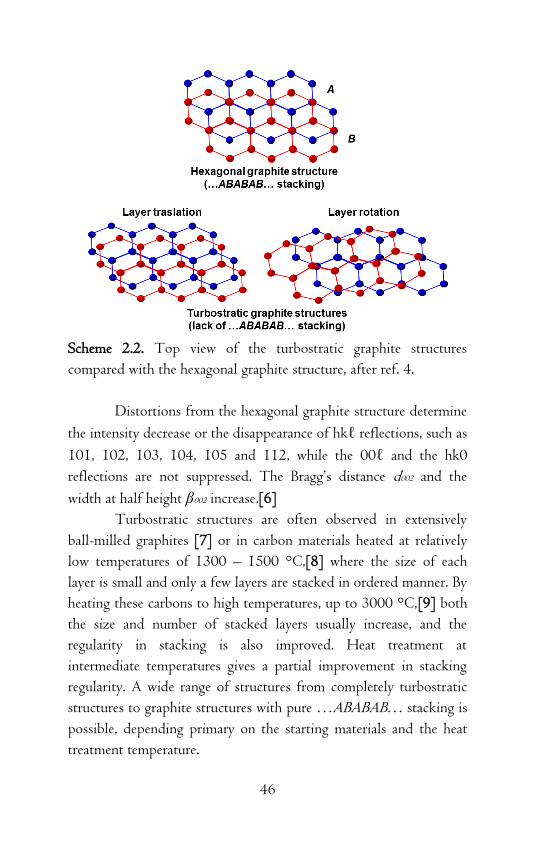
The X-Ray diffraction pattern of petroleum coke heat
treated at 1000 °C in Fig. 2.4 [4] is characterized by very broad 00ℓ
reflections, due to the small number of layers stacked in an orered
manner, unsymmetrical two-dimensional hk reflections, and no hkℓ
reflections, due to random turbostratic stacking of the layers.
Fig. 2.4. X-ray diffraction (Cu Kα) pattern of petroleum coke heat
treated at 1000 °C, after ref. 4.
The structure of amorphous carbons with short-range
graphite-like order can be rationalized by the Franklin’s model
proposed in 1950.[10] According to this model, this kind of

48
carbons are characterized by two types of carbon structures: carbon
crystallites and completely amorphous carbon. Small graphitic
crystallites, containing few layers, are joined together by cross-links.
These cross-links are established by aliphatic chains on the edges of
each crystalline domains. The structural units in non-graphitizing
carbons are distributed randomly, and the cross-links are sufficiently
strong to impede movement of the layers into a more parallel
arrangement (see Fig 2.5A). The structural units in a graphitizing
carbon are approximately parallel to each other, and the links
between adjacent units are assumed to be weak (see Fig 2.5B).[11]
Fig. 2.5. Franklin’s structural model of: (A) non-graphitizing and
(B) graphitizing carbons, after ref. 11.
2.2.4 Carbon Blacks
Carbon blacks (CBs), formed through incomplete combustion of
high molecular weight hydrocarbon fractions of petroleum crude
oils, coal tar, ethylene cracking tar, and vegetable oil, are very
important industrial products, in particular these materials are the
most important reinforcing filler used to improve strenght, rolling
resistance and abrasion resistance in tire compounds.
CB samples are characterized by aggregates (200 – 1000
nm) of nearly spherical particles (20 - 100 nm) with an internal
structure made of graphite-like units having a random orientation of
the graphitic layers, as shown in Fig. 2.6.[12]

49
Fig. 2.6. Structure of carbon black aggregates, after ref. 12.
CB powders are characterized by high surface areas, as a
consequence of their nanometric primary particles, that determine
high filler-polymer interfacial areas, when CB particles are dispersed
in a polymer matrix. The degree of aggregation of primary particles
defines a very important technological parameter, the so-called
‘‘structure’’ of CBs. High structure CBs are characterized by high
degree of aggregation (low void volume) (see Fig. 2.7)
Fig. 2.7. Degree of aggregation of primary particles of carbon black.
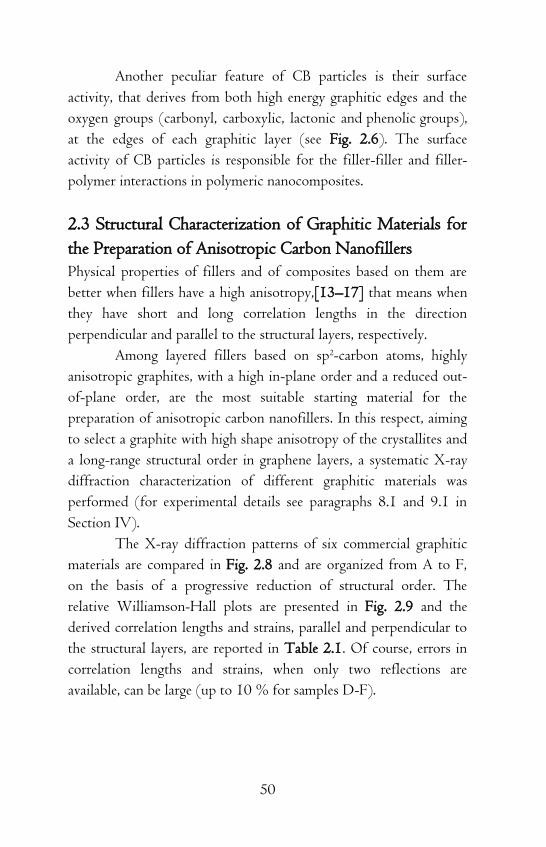
50
Another peculiar feature of CB particles is their surface
activity, that derives from both high energy graphitic edges and the
oxygen groups (carbonyl, carboxylic, lactonic and phenolic groups),
at the edges of each graphitic layer (see Fig. 2.6). The surface
activity of CB particles is responsible for the filler-filler and filler-
polymer interactions in polymeric nanocomposites.
2.3 Structural Characterization of Graphitic Materials for
the Preparation of Anisotropic Carbon Nanofillers
Physical properties of fillers and of composites based on them are
better when fillers have a high anisotropy,[13–17] that means when
they have short and long correlation lengths in the direction
perpendicular and parallel to the structural layers, respectively.
Among layered fillers based on sp2-carbon atoms, highly
anisotropic graphites, with a high in-plane order and a reduced out-
of-plane order, are the most suitable starting material for the
preparation of anisotropic carbon nanofillers. In this respect, aiming
to select a graphite with high shape anisotropy of the crystallites and
a long-range structural order in graphene layers, a systematic X-ray
diffraction characterization of different graphitic materials was
performed (for experimental details see paragraphs 8.1 and 9.1 in
Section IV).
The X-ray diffraction patterns of six commercial graphitic
materials are compared in Fig. 2.8 and are organized from A to F,
on the basis of a progressive reduction of structural order. The
relative Williamson-Hall plots are presented in Fig. 2.9 and the
derived correlation lengths and strains, parallel and perpendicular to
the structural layers, are reported in Table 2.1. Of course, errors in
correlation lengths and strains, when only two reflections are
available, can be large (up to 10 % for samples D-F).

51
Fig. 2.8. X-ray diffraction patterns (Cu Kα) of six commercial
graphitic materials: (A, B) graphites, (C) ball-milled graphite, (D, E)
needle coke and calcined petroleum coke and (F) carbon black
N326. The patterns are reported from A to F on the basis of a
progressive reduction of structural order.

52
Fig. 2.9. Out-of-plane (a) and in-plane (b) Williamson−Hall plots
for the graphitic samples from A to F, whose X-ray diffraction
patterns are reported in Fig. 2.8.
Table 2.1. Structural parameters derived from Bragg’s law and
Williamson-Hall plots of Fig. 2.9.
Sample d002
(nm) D┴
(nm) D║
(nm) D║ / D┴
ε┴ (%)
ε║ (%)
ε┴ / ε║
A 0.339 20.3 44.5 2.2 0.047 0.059 0.8
B 0.339 16.8 36.4 2.2 0.060 0.059 1.0
C 0.339 9.8 30.2 3.1 0.107 0.073 1.5
D 0.347 5.9 6.5 1.1 0.38 0.33 1.1
E 0.348 3.5 3.6 1.0 0.78 0.50 1.5
F 0.365 1.9 2.9 1.5 1.6 0.67 2.4
All samples of Fig. 2.8 present broad 00ℓ reflections and
out-of-plane correlation lengths (3rd column of Table 2.1) from 20
nm down to 2 nm. Moreover, all samples of Fig. 2.8, due to their
structural disorder, present distances between the structural layers
(d002 in the 2nd column of Table 2.1) slightly larger than those of
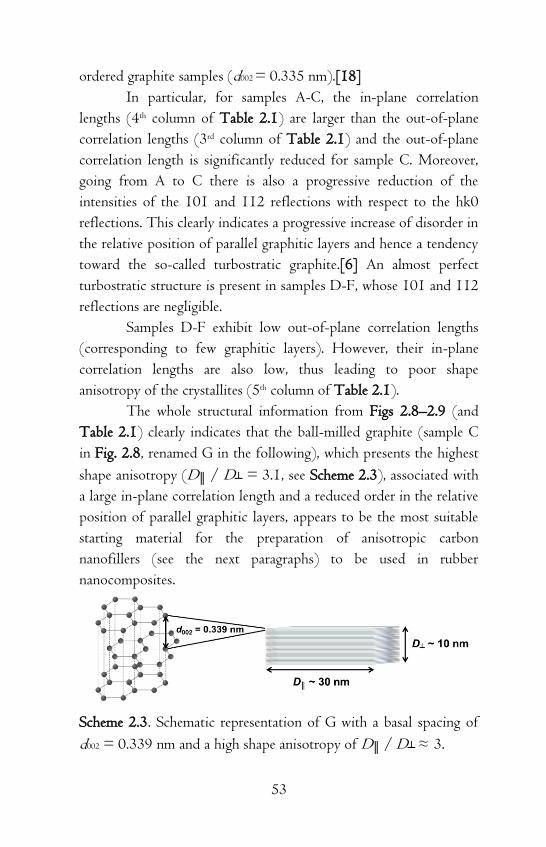
53
ordered graphite samples (d002 = 0.335 nm).[18]
In particular, for samples A-C, the in-plane correlation
lengths (4th column of Table 2.1) are larger than the out-of-plane
correlation lengths (3rd column of Table 2.1) and the out-of-plane
correlation length is significantly reduced for sample C. Moreover,
going from A to C there is also a progressive reduction of the
intensities of the 101 and 112 reflections with respect to the hk0
reflections. This clearly indicates a progressive increase of disorder in
the relative position of parallel graphitic layers and hence a tendency
toward the so-called turbostratic graphite.[6] An almost perfect
turbostratic structure is present in samples D-F, whose 101 and 112
reflections are negligible.
Samples D-F exhibit low out-of-plane correlation lengths
(corresponding to few graphitic layers). However, their in-plane
correlation lengths are also low, thus leading to poor shape
anisotropy of the crystallites (5th column of Table 2.1).
The whole structural information from Figs 2.8–2.9 (and
Table 2.1) clearly indicates that the ball-milled graphite (sample C
in Fig. 2.8, renamed G in the following), which presents the highest
shape anisotropy (D║ / D┴ = 3.1, see Scheme 2.3), associated with
a large in-plane correlation length and a reduced order in the relative
position of parallel graphitic layers, appears to be the most suitable
starting material for the preparation of anisotropic carbon
nanofillers (see the next paragraphs) to be used in rubber
nanocomposites.
Scheme 2.3. Schematic representation of G with a basal spacing of
d002 = 0.339 nm and a high shape anisotropy of D║ / D┴ ≈ 3.

54
2.4 Graphite Oxide
Graphite oxide (GO) is a layered material, which can be obtained by
chemical oxidation of graphite. Graphite oxide can be prepared by
the treatment of graphite with strong mineral acids and oxidizing
agents, typically via treatment with a mixture of sulfuric and nitric
acid, using potassium chlorate, as in the Brodie’s [19] or
Staudenmaier’s [20] methods, or with a mixture of sodium nitrate
and concentrated sulfuric acid, using potassium permanganate, as in
the Hummers’ method.[21]
The precise structure of GO remains a matter of debate,[22]
and, according to the Lerf-Klinowski model,[23] GO consists of
oxidized sheets having oxygen containing functional groups, that
confer polar surface properties and a strong hydrophilic character.
Hydroxyl and epoxide groups are at the surface of the basal planes
and carbonyl and carboxyl groups are at the edges. Therefore, GO
forms colloidal dispersion in water, which are stabilized by negative
charges from the carboxyl groups, without the need for any
surfactant.[24]
2.4.1 Preparation, Composition and Surface Areas of
Graphite Oxide Samples
Two sets of GO samples, containing higher (H-GO) and lower (L-
GO) oxygen content, were prepared by using Staudenmaier’s method
[20] and Hummers’ method,[21] respectively (for experimental
details see paragraphs 8.6 and 8.7 in Section IV), starting from the
highly anisotropic graphite G. The oxidation methods of G are
represented in Scheme 2.4.
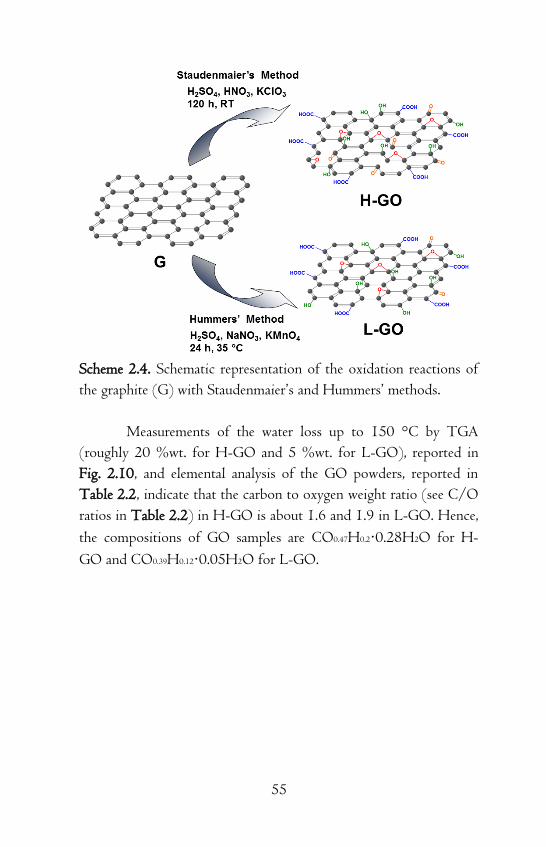
55
Scheme 2.4. Schematic representation of the oxidation reactions of
the graphite (G) with Staudenmaier’s and Hummers’ methods.
Measurements of the water loss up to 150 °C by TGA
(roughly 20 %wt. for H-GO and 5 %wt. for L-GO), reported in
Fig. 2.10, and elemental analysis of the GO powders, reported in
Table 2.2, indicate that the carbon to oxygen weight ratio (see C/O
ratios in Table 2.2) in H-GO is about 1.6 and 1.9 in L-GO. Hence,
the compositions of GO samples are CO0.47H0.2·0.28H2O for H-
GO and CO0.39H0.12·0.05H2O for L-GO.

56
Fig. 2.10. TGA curves in N2 of the starting high surface area
graphite (G) and of the derived L-GO and H-GO.
Table 2.2. Results of elemental analysis and BET measurements on the starting high surface area graphite G and of the derived L-GO and H-GO.a
Sample Surface
area (m2/g)
Elemental composition (%wt.)
C H N O S C/O
G 308 99.8 0.1 0.1 0.0 0.0 /
L-GO 0.8 63.7 0.6 0.1 33.7 1.9 1.9
H-GO 1.1 59.1 1.4 0.1 35 4.4 1.6 aElemental composition of the anhydrous GO samples: water contents of nearly 20 %wt. and 5 %wt. are evaluated by TGA for H-GO and L-GO, respectively.
Results of the BET measurements, reported in Table 2.2,
show that G exhibits a high surface area, SBET = 308 m2/g,

57
associated to its highly porous morphology, as shown in the SEM
images in Fig. 2.11.
Fig. 2.11. SEM images of G at different magnifications: (A) 50 μm
and (B) 5 μm.
The oxidation of G definitely decreases its surface area from
308 m2/g to 0.8 m2/g for L-GO and 1.1 m2/g for H-GO. These
surface area values agree well with those reported in the literature for
GO samples.[25–27]
2.4.2 Characterization of Graphite Oxide Samples
FTIR spectra in Fig. 2.12 show the presence of oxygenated
functional groups on the layers of both H-GO and L-GO, whose
concentration is negligible in the starting graphite sample (G).
Absorption bands of carboxyl groups (1730 cm-1), hydroxyl groups
(stretching at 3420 cm-1 and bending at 1385 cm-1) and epoxide
groups (1145-1065 cm-1) are observed.[28]

58
Fig. 2.12. FTIR spectra in the range 4000−400 cm−1 of the starting
high surface area graphite (G) and of the derived L-GO and H-GO.
The TGA curves in Fig. 2.10 also confirm the presence of
oxygenated functional groups, infact, both GO samples exhibit a
weight loss from 150 °C to 300 °C, caused by the decarboxylation
reactions and a weight loss above 300 °C, associated to the removal
of hydroxyl and epoxide groups.[29]

59
Fig. 2.13. X-ray diffraction patterns (Cu Kα) of the starting high
surface area graphite (G) and of the derived L-GO and H-GO.
The X-ray diffraction patterns of GO samples in Fig. 2.13
reveal a broad 001 reflection, corresponding to an interlayer distance
of 0.84 nm, as already reported by some literature studies.[30–35]
This value is higher than the interlayer distance observed in the
starting graphite, about 0.339 nm. Hence, the oxidation of G
produces an oxidized layered material with increased interlayer
distance, from 0.339 nm to 0.84 nm, as represented in Scheme 2.5.
Scheme 2.5. Schematic representation of the increasing of the
interlayer distance in GO after oxidation of graphite G.
The out-of-plane correlation lengths, determined by the
Scherrer equation (see paragraph 9.1 and in Section IV) were 5.4
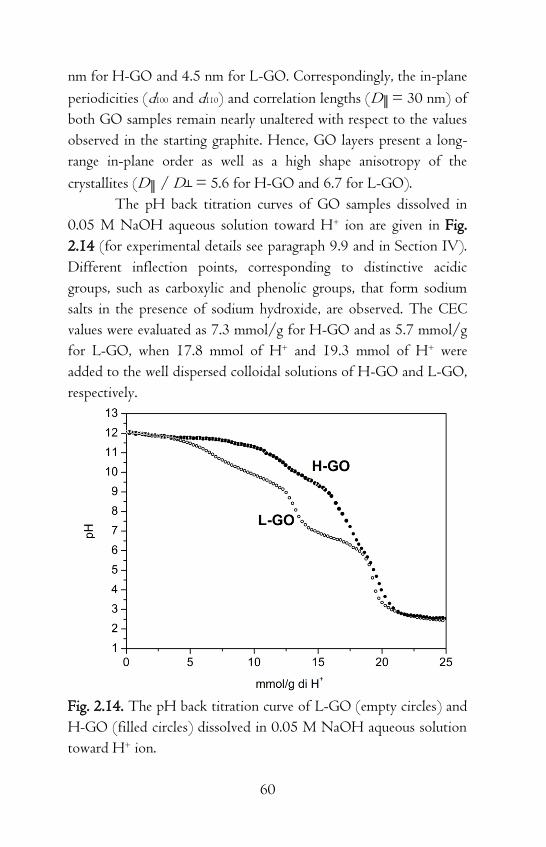
60
nm for H-GO and 4.5 nm for L-GO. Correspondingly, the in-plane
periodicities (d100 and d110) and correlation lengths (D║ = 30 nm) of
both GO samples remain nearly unaltered with respect to the values
observed in the starting graphite. Hence, GO layers present a long-
range in-plane order as well as a high shape anisotropy of the
crystallites (D║ / D┴ = 5.6 for H-GO and 6.7 for L-GO).
The pH back titration curves of GO samples dissolved in
0.05 M NaOH aqueous solution toward H+ ion are given in Fig.
2.14 (for experimental details see paragraph 9.9 and in Section IV).
Different inflection points, corresponding to distinctive acidic
groups, such as carboxylic and phenolic groups, that form sodium
salts in the presence of sodium hydroxide, are observed. The CEC
values were evaluated as 7.3 mmol/g for H-GO and as 5.7 mmol/g
for L-GO, when 17.8 mmol of H+ and 19.3 mmol of H+ were
added to the well dispersed colloidal solutions of H-GO and L-GO,
respectively.
Fig. 2.14. The pH back titration curve of L-GO (empty circles) and
H-GO (filled circles) dissolved in 0.05 M NaOH aqueous solution
toward H+ ion.

61
In analogy with the previously discussed OCs (see paragraph
1.2 in Section I), aiming to obtain graphitic fillers with improved
compatibility with the rubber matrix, the intercalation chemistry of
GO with organic ions was investigated. The method promotes a
non-covalent functionalization of highly anisotropic GO layers and
the results are discussed in the next paragraph.
2.5 Graphite and Graphite Oxide Intercalation
Compounds
Graphite is a unique layered host, which is electro-active and can be
either oxidized or reduced to form intercalation compounds (GICs).
GICs are formed by the insertion of atomic or molecular layers of
different chemical species between the layers of the graphite host
lattice.[36,37] In GICs, the graphene layers either accept electrons
from or donate electrons to the intercalated species. Graphite
intercalated by electron donors like alkali metals (e.g. litium,
potassium, sodium, etc.) are known as donor-type GICs,[38–41]
whereas compounds formed by the intercalation of molecular species
acting as electron acceptors like halogens, halide ions and acids are
known as acceptor-type GICs.[42–46] The structural model of
potassium graphite C8K, according to Rüdorff and Schulze,[37,47]
is shown in Fig. 2.15.
Fig. 2.15. Structural model of potassium graphite C8K: (A) side view
and (B) top view, after ref. 47.

62
The number of graphene layers between the intercalate
layers is known as the stage and the most important and
characteristic ordering property of GICs is the staging phenomenon
depicted in Scheme 2.6. The stage number n designates the number
of graphene layers that separate adjacent intercalate layers.
Scheme 2.6. Schematic diagram illustrating the staging phenomenon
in GICs for stages 1 ≤ n ≤ 4, after ref. 37.
When small ions, mainly inorganic, are intercalated, the
observed crystalline structures generally exhibit a 3D long-range
order as well order in the organization of the guest species in the
interlayer space.[38–43] Their complete 3D order is comparable
with those observed for many intercalate co-crystals, like those
obtained for instance for organometallic [48–50] and polymeric co-
crystals.[51–57]
GO layers also exhibit a rich intercalation chemistry, both
with organic ions [58–65] and with polar polymers.[66–69] All
known graphite oxide intercalation compounds (GOICs) present
poor crystalline order, being generally limited to the distance

63
between the graphite oxide layers, which can largely increase (also up
to 5 nm).[62]
2.5.1 Preparation and Composition of Graphite Oxide
Intercalation Compounds
GOICs, exhibiting a long-range order in the organization of the
guest species in the interlayer space as well as a large distance
between graphite oxide sheets, were prepared, according to the
procedure reported in paragraph 8.8 in Section IV, by first
dispersing GO powders in a aqueous solution of NaOH and by a
further treatment with an aqueous solution of dimethyl ditallow
ammonium chloride (2HTCl), in absence or in presence of polar
molecules with long hydrocarbon chains, like stearic acid (SA), 2-
stearamidoethyl stearate (SAES) (see the molecular structures in Fig.
1.5) and glyceryl tristearate (GTS) (see the molecular structure in
Fig. 2.16). When the intercalation occurred in absence of a second
polar guest, two GO/2HT intercalates with higher (GO/2HT-H)
and lower (GO/2HT-L) contents of 2HT were obtained (see
experimental details in paragraph 8.8 in Section IV). The GOIC
samples, presented here have been prepared starting from H-GO and
the results of the characterization are presented in the following
discussion. Other intercalation experiments have been also carried
out starting from L-GO, without any significant structural change of
the obtained GOICs.
Fig. 2.16. Molecular structure of glyceryl tristearate (GTS).

64
On the basis of the guest weight uptake and measurements
of the water loss by TGA, the composition of GO/2HT-L,
GO/2HT-H, GO/2HT/SAES and GO/2HT/GTS intercalates
has been evaluated as CO0.47H0.2·(C36H76N)0.059·0.15H2O,
CO0.47H0.2·(C36H76N)0.074·0.15H2O,
CO0.47H0.2·(C36H76N)0.059·(C38H75O3N)0.057·0.15H2O and
CO0.47H0.2·(C36H76N)0.059·(C57H110O6)0.059·0.15H2O, respectively.
The content of 2HT guest ions was 3.0 mmol/g GO in GO/2HT-
L and 3.8 mmol/g GO in GO/2HT-H. The content of the second
polar guest, SAES in GO/2HT/SAES and GTS in
GO/2HT/GTS, was roughly 3.0 mmol/g GO, with 2HT/SAES
and 2HT/GTS molar ratios not far from 1/1.
The above reported compositions correspond to a molar
ratio between carbon in the graphite oxide layers and alkyl chains of
the intercalated guest species (CGO/chains) of roughly 8/1 in
GO/2HT-L, 6/1 in GO/2HT-H and 4/1 in GO/2HT/SAES
and GO/2HT/GTS.
2.5.2 Characterization of Graphite Oxide Intercalation
Compounds
The X-ray diffraction patterns of GOICs with lower and higher
content of di(hydrogenated tallow)-dimethylammonium (2HT) are
shown in Fig. 2.17 (GO/2HT-L and GO/2HT-H, respectively).

65
Fig. 2.17. X-ray diffraction patterns (Cu K) of the GOICs, which
include the 2HT cation with two long hydrocarbon chains
(GO/2HT-L and GO/2HT-H), 2HT and SAES
(GO/2HT/SAES) or 2HT and GTS (GO/2HT/GTS). The
symbols g, r and o indicate reflections relative to the graphite oxide
planes, to the hexagonal rotator order and to the orthorhombic
order, respectively.
The pattern of GO/2HT-L shows essentially unaltered 100
and 110 reflections, clearly indicating the maintenance of the in-
plane graphite oxide order. Moreover, many narrow 00ℓ reflections
(with ℓ up to 7) appear, which correspond to a spacing between

66
graphite oxide layers of 3.4 nm with a correlation length increased
up to 14 nm.
The pattern of GO/2HT-L in Fig. 2.17 also presents a
reflection at d = 0.42 nm, which suggests the occurrence of a
hexagonal rotator order [70–75] of the long hydrocarbon chains of
the intercalated ammonium salt. The broadness of this reflection
indicates a correlation length of this hexagonal rotator order in the
interlayer space, in directions parallel to the graphite oxide layers,
close to 7 nm.
Surprisingly, the crystalline order of the GOICs can be
largely increased by adding or an excess of 2HT (typically an
amount of 2HT equal to 200% CEC of GO, see experimental
details in paragraph 8.8 in Section IV) or 2HT in presence of a
second guest species, including long hydrocarbon chains, like e.g.
stearic acid (SA), 2-stearamidoethyl stearate (SAES) or glyceryl
tristearate (GTS). In both cases the in-plane graphite oxide order is
maintained, while all the other kinds of order above described are
improved.
For instance, the patterns of GO/2HT-H and
GO/2HT/SAES in Fig. 2.17 show at least ten 00ℓ reflections with
increased correlation lengths (D = 16 nm and 42 nm, respectively)
and with largely increased spacings (d = 4.8 nm and 5.8,
respectively).
The intense and narrow diffraction peak at d = 0.42 nm,
typical of hexagonal arrangements of long n-alkanes,[70–75]
indicates an increase of the correlation length for the hexagonal
rotator order (in the direction parallel to the graphite oxide layers)
up to 10 nm for GO/2HT/SAES. The occurrence of a hexagonal
rotator order was also observed particularly for OCs with long-chain
polar guests (see paragraph 1.2).
The pattern of GO/2HT/GTS shows a further ordered
structure with the same periodicity of GO/2HT/SAES (d = 5.8

67
nm) and a larger correlation length in the direction perpendicular to
the structural layers (D = 50 nm). However, the most interesting
feature of GO/2HT/GTS intercalates is the orthorhombic order
[70–75] of the long hydrocarbon chains of the intercalated guests
in the direction parallel to the graphite oxide layers, as indicated by
the reflections at d = 0.42 nm and d = 0.38 nm. In particular, it is
worth adding that the reflection at d = 0.42 nm is the most intense
reflection of the entire GO/2HT/GTS pattern, therefore the
amount of the intercalated chains producing diffraction is largely
increased with respect to GO/2HT/SAES.
The GOICs with rotator order in the intercalated layers,
lead to polycrystalline films exhibiting macroscopic orientational
order, by simple casting procedures. For instance, X-ray diffraction
patterns of films having a thickness of nearly 30 μm, as obtained by
casting from aqueous suspensions of GO and of the derived
GO/2HT/SAES intercalate, are shown in Figs 2.18A and 2.18B,
respectively.
Fig. 2.18. Photographic X-ray diffraction patterns (Cu K) of films
cast from aqueous suspensions of graphite oxide (A) and of the
derived GOIC with 2HT and SAES (B), as collected with the X-ray
beam parallel to the film (EDGE patterns). The hkℓ Miller indexes
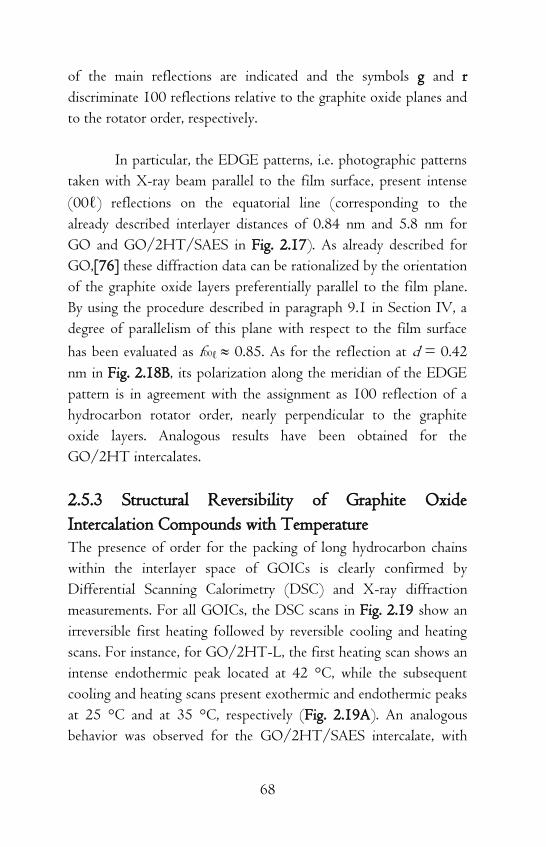
68
of the main reflections are indicated and the symbols g and r
discriminate 100 reflections relative to the graphite oxide planes and
to the rotator order, respectively.
In particular, the EDGE patterns, i.e. photographic patterns
taken with X-ray beam parallel to the film surface, present intense
(00ℓ) reflections on the equatorial line (corresponding to the
already described interlayer distances of 0.84 nm and 5.8 nm for
GO and GO/2HT/SAES in Fig. 2.17). As already described for
GO,[76] these diffraction data can be rationalized by the orientation
of the graphite oxide layers preferentially parallel to the film plane.
By using the procedure described in paragraph 9.1 in Section IV, a
degree of parallelism of this plane with respect to the film surface
has been evaluated as f00ℓ 0.85. As for the reflection at d = 0.42
nm in Fig. 2.18B, its polarization along the meridian of the EDGE
pattern is in agreement with the assignment as 100 reflection of a
hydrocarbon rotator order, nearly perpendicular to the graphite
oxide layers. Analogous results have been obtained for the
GO/2HT intercalates.
2.5.3 Structural Reversibility of Graphite Oxide
Intercalation Compounds with Temperature
The presence of order for the packing of long hydrocarbon chains
within the interlayer space of GOICs is clearly confirmed by
Differential Scanning Calorimetry (DSC) and X-ray diffraction
measurements. For all GOICs, the DSC scans in Fig. 2.19 show an
irreversible first heating followed by reversible cooling and heating
scans. For instance, for GO/2HT-L, the first heating scan shows an
intense endothermic peak located at 42 °C, while the subsequent
cooling and heating scans present exothermic and endothermic peaks
at 25 °C and at 35 °C, respectively (Fig. 2.19A). An analogous
behavior was observed for the GO/2HT/SAES intercalate, with

69
main crystallization and melting peaks of the rotator phase being
located at 86 °C and 92 °C, respectively (Fig. 2.19C).
Fig. 2.19. (A) DSC scans of GOICs: (A) GO/2HT-L, (B)
GO/2HT-H, (C) GO/2HT/SAES and (D) GO/2HT/GTS.
The X-ray diffraction patterns of the GO/2HT-L powder
at room temperature, at 50 °C and at room temperature after
treatment at 50 °C, have been reported in Fig. 2.20. The pattern at
50 °C shows that the endothermic phenomena of Fig. 2.19A lead to
the disappearance of the diffraction peak at d = 0.42 nm and hence
to the loss of the rotator order. Moreover, the pattern at 50 °C
shows shifts of the 00ℓ reflections, indicating an increase of the

70
interlayer spacing from 3.4 nm to 4.0 nm. The pattern at room
temperature of GO/2HT-L, after annealing at 50 °C, shows a
renewed reflection at d = 0.42 nm as well as 00ℓ peaks
corresponding to the former narrower periodicity (3.4 nm). This
demonstrates, as already observed for OCs in chapter 1 in Section I
and for other layered materials intercalated with long hydrocarbon
chain molecules,[77] that both loss of hexagonal rotator order and
increase of the interlayer spacing are thermally reversible.
Fig. 2.20. X-ray diffraction patterns (Cu K) of GO/2HT-L at
RT, 50 °C and at RT after thermal treatments up to 100 °C.
2.5.4 Structures of Graphite Oxide Intercalation
Compounds
The X-ray diffraction patterns of the GO/2HT intercalates present
a high similarity with those of ordered intercalate structures
obtained by self-assembling of stearate ions in layered double
hydrotalcite clay (LDH), in which C18 chains form bilayer structure

71
in the vertical direction and a distorted hexagonal structure in the
lateral direction, within the LDH interlayer space.[78] For the
GO/2HT intercalates, analogous structures with inclined bilayers
are here suggested (Figs 2.21A-D).
The tilt angle of the inclined bilayers of the GO/2HT-L
intercalate can be evaluated as φ = 60°, on the basis of the basal
spacing (d001 = 3.4 nm), by assuming that the thickness of the
graphite oxide layer is close to 0.8 nm,[58] and that the length of
two fully extended 2HT cations is 5.0 nm.[79]
For φ = 60°, the surface occupied by 8 graphite oxide unit
cells (four are indicated as dashed red lines in Fig. 2.21B) is nearly
equal to the surface occupied by a pseudo-cell of the rotator order,
being parallel to the GO planes (indicated as thick black lines in Fig.
2.21B). Hence, the intercalate GO/2HT-L exhibits a CGO/chains
molar ratio of nearly 8/1, in good agreement with the molar ratio as
independently evaluated by gravimetric measurements.
In the case of the GO/2HT-H intercalate, the tilt angle of
the inclined bilayers can be evaluated as φ = 37°, on the basis of the
basal spacing (d001 = 4.8 nm). In fact, the observed basal spacing is
equal to the sum of the periodicity of GO (~ 0.8 nm) [58] and of
the length of two fully extended 2HT cations (~ 5.0 nm).[79] The
CGO/chains molar ratio of the GO/2HT-H intercalate is nearly
6/1, in fact the surface occupied by 6 graphite oxide unit cells (four
are indicated as dashed red lines in Fig. 2.21D) is nearly equal to the
surface occupied by a pseudo-cell of the rotator order, being parallel
to the GO planes (indicated as thick black lines in Fig. 2.21D). The
results obtained by X-ray diffraction are in good agreement with the
molar ratio as independently evaluated by gravimetric measurements.
For the more ordered GOICs, including both 2HT and
SAES or GTS guests, on the basis of the large interlayer spacing (5.8
nm), analogous to those observed for cationic clays intercalated with
ammonium salts with C18 tails (~ 6 nm),[80] a structure with
perpendicular bilayers can be suggested (Figs 2.21E-H).

72
It is also worth adding that the patterns of
GO/2HT/SAES and GO/2HT/GTS, both in Fig. 2.17 and in
Fig. 2.18, present a clear odd-even effect for the 00ℓ reflections,
with definitely more intense odd reflections. This phenomenon can
be easily rationalized on the basis of the model with perpendicular
alkyl chains (Figs 2.21E,G). In fact, this model presents a minimum
of atomic density in the middle of the graphitic interlayer space, due
to non-bonded interactions between the tails of the long
hydrocarbon chains, being clearly consistent with the reduced
intensity of the 00ℓ reflections for ℓ even. A modest odd-even effect
for the 00ℓ reflections is also exhibited by GO/2HT-H.
In the case of GO/2HT/SAES intercalates, the basal planes
of the hexagonal cells of the rotator order (ar = 0.42 nm, thick black
lines), and of GO (ag = 0.214 nm, dashed red lines) are compared in
Fig. 2.21F. A good fit between the two hexagonal cells, with ar ≈
2ag corresponding to four hexagonal cells of GO per one hexagonal
cell of the rotator order, is apparent and clearly indicates a molar
ratio of CGO/chains =4/1. Again, the intercalate composition as
derived by structural considerations well agrees with the
composition as derived by gravimetric guest uptake. It is worth
adding that the observed long range hexagonal rotator order of
GO/2HT/SAES (D100r ≈ 10 nm) is possibly associated with this
good fit between the hexagonal cell bases of GO and of the
hydrocarbon rotator order.
The GO/2HT/GTS intercalates exhibit layers of
hydrocarbon chains in the interlayer space, for which the planes of
the zig-zag backbones are parallel (see α and β layers in Fig. 2.21H).
The planes of the zig-zag backbones of chains of adjacent layers
along ao = 0.76 nm are perpendicular (see Figs 2.21G,H). The
surface occupied by 8 graphite oxide unit cells (four are indicated as
dashed red lines in Fig. 2.21H) is nearly equal to the surface
occupied by a orthorhombic cell of the hydrocarbon chains,
indicated as thick black lines in Fig. 2.21H. The CGO/chains molar

73
ratio of the GO/2HT/GTS intercalates is nearly 4/1, as
independently evaluated by gravimetric measurements.
The four structures of Fig. 2.21 are also validated by density
considerations. In fact, an evaluation of the density in the interlayer
space, based on the compositions, provides a similar density for both
intercalates (0.98 g/cm3) not far from the value observed for
crystalline polyethylene.

74
Fig. 2.21. Schematic presentation of the crystalline structures of the
GO/2HT-L (A, B), GO/2HT-H (C, D), GO/2HT/SAES (E, F)
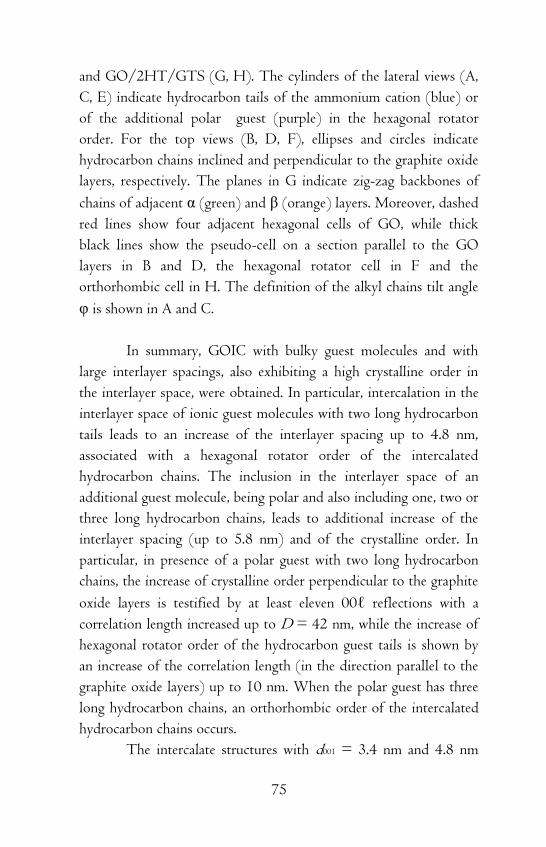
75
and GO/2HT/GTS (G, H). The cylinders of the lateral views (A,
C, E) indicate hydrocarbon tails of the ammonium cation (blue) or
of the additional polar guest (purple) in the hexagonal rotator
order. For the top views (B, D, F), ellipses and circles indicate
hydrocarbon chains inclined and perpendicular to the graphite oxide
layers, respectively. The planes in G indicate zig-zag backbones of
chains of adjacent α (green) and β (orange) layers. Moreover, dashed
red lines show four adjacent hexagonal cells of GO, while thick
black lines show the pseudo-cell on a section parallel to the GO
layers in B and D, the hexagonal rotator cell in F and the
orthorhombic cell in H. The definition of the alkyl chains tilt angle
φ is shown in A and C.
In summary, GOIC with bulky guest molecules and with
large interlayer spacings, also exhibiting a high crystalline order in
the interlayer space, were obtained. In particular, intercalation in the
interlayer space of ionic guest molecules with two long hydrocarbon
tails leads to an increase of the interlayer spacing up to 4.8 nm,
associated with a hexagonal rotator order of the intercalated
hydrocarbon chains. The inclusion in the interlayer space of an
additional guest molecule, being polar and also including one, two or
three long hydrocarbon chains, leads to additional increase of the
interlayer spacing (up to 5.8 nm) and of the crystalline order. In
particular, in presence of a polar guest with two long hydrocarbon
chains, the increase of crystalline order perpendicular to the graphite
oxide layers is testified by at least eleven 00ℓ reflections with a
correlation length increased up to D = 42 nm, while the increase of
hexagonal rotator order of the hydrocarbon guest tails is shown by
an increase of the correlation length (in the direction parallel to the
graphite oxide layers) up to 10 nm. When the polar guest has three
long hydrocarbon chains, an orthorhombic order of the intercalated
hydrocarbon chains occurs.
The intercalate structures with d001 = 3.4 nm and 4.8 nm

76
present bilayers of hydrocarbon chains being inclined (φ = 60° and
37°), with CGO/chains molar ratios of 8/1 and 6/1, respectively.
The intercalate structures with d001 = 5.8 nm are characterized by
bilayers of hydrocarbon chains being perpendicular to the GO layers,
with a CGO/chains molar ratio of 4/1. The molar ratios well agree
with those obtained by gravimetric measurements.
The intercalation procedure adopted in this work leads thus
to GOICs that seems to be suitable for having highly anisotropic
GO layers in the rubber matrix, provided that the crystalline order of
the GOICs can be overcome, for example by the mixing energy
during the melt blending of GOICs with the rubber. Rubber/GOIC
nanocomposites are discussed in chapter 4 in Section II.
2.6 Disordered Structures from Graphite Oxide:
Chemically Modified Graphenes
Graphene, a one-atom-thick single layer of sp2-bonded carbon atoms
packed in a two dimensional honeycomb crystal lattice,[81] has
attracted great interest, both in the scientific and industrial
communities, due to its excellent mechanical, thermal and electrical
properties.[82–84]
The first method for isolating graphene, based on
micromechanical exfoliation of graphite using a scotch tape, was
reported by Geim and Novoselov in 2004.[85]
In bottom-up processes, graphene is prepared by a variety of
methods such as chemical vapor deposition,[86,87] arc discharge
[88] and epitaxial growth on SiC.[89]
Nowadays, it is widely acknowledged that large scale
production of single or few layers of chemically modified graphenes
can be achieved by top-down processes of exfoliation and reduction
of GO, through chemical or thermal treatments.[90,91] The term
“chemically modified” is chosen because complete reduction of
graphene oxide to graphene has not yet been observed.[92]

77
Hence, it is worth adding that GO is a versatile intermediate
material that allows to prepare not only ordered intercalate
structures, as just discussed in the paragraph above, but also
disordered structures. In particular, starting from GO, chemically
reduced graphite oxide (CRGO), exfoliated graphite oxide (eGO,
also called graphene oxide) and reduced graphite oxide
(rGO)/syndiotactic polystyrene (sPS) aerogels have been obtained
by chemical reduction of GO aqueous dispersions, by mechanical
treatments on GO powders and by solvo-thermal reduction of GO
followed by supercritical CO2 drying of rGO/sPS gels, respectively.
These important results, discussed in the next paragraphs, have
allowed us to obtain a complete control over the degree of order of
the layered carbon structures we are able to prepare. Such disordered
carbon materials, because of their high degree of exfoliation, could
be suitable for applications as nanofillers in rubber nanocomposites.
2.6.1 Chemical Exfoliation of Graphite Oxide
Different methods currently exist for the reduction of GO to
produce chemically reduced graphite oxide (CRGO). Chemical
methods involve the treatment of colloidal GO dispersions with
reducing chemicals such as hydrazine monohydrate,[93,94]
dimethylhydrazine,[95,96] sodium borohydride,[97,98]
hydroquinone,[99] ascorbic acid,[100–102] strongly alkaline
solutions,[103] reducing sugars, such as glucose,[104] and sodium
hydrosulfite.[105] All these methods allow obtaining only a partial
reduction of the graphene oxide layers. In fact, after the reaction,
each layer still contains few oxygen groups,[29] as represented in
Scheme 2.7.

78
Scheme 2.7. Schematic representation of the partial reduction of the
graphene oxide layers in CRGO, after chemical reduction of GO.
CRGO samples were prepared both from H-GO and L-
GO, in presence of hydrazine monohydrate of ascorbic acid as
reducing species, achieving the same results, without any significant
structural change of the obtained CRGOs. Here, the results of the
reduction of H-GO with hydrazine monohydrate are discussed.
The X-ray diffraction pattern of CRGO, reported in Fig.
2.22, shows broad 00ℓ peaks with interlayer distance d002 = 0.362
nm and well-defined 100 and 110 peaks. By comparing CRGO and
the starting H-GO in Fig. 2.22, a large decrease of the out-of-plane
correlation length (D┴ decreases from 5.4 nm down to 2.1 nm) and
a large increase of the shape anisotropy (D║ / D┴ increases from 5.6
to 12.3) are clearly apparent. It is worth adding that after the
oxidation procedure (H-GO in Fig. 2.13) as well as after the
oxidation−reduction procedure (CRGO in Fig. 2.22) the 101 and
112 peaks are no longer observed, clearly indicating a complete loss
of translational order between adiacent parallel layers and hence the
occurrence of a turbostratic structure. Hence, Figs 2.13 and 2.22
show that the overall oxidation−reduction procedure, when applied
to anisotropic graphites, leads to aggregates of few piled graphene
layers with long-range structural order only in the graphene planes.
The oxidation−reduction procedure preserves the in-plane order of
graphite, while dramatically increases the out-of-plane disorder,
which becomes similar to that one of carbon black.

79
Fig. 2.22. X-ray diffraction patterns (Cu K) of the starting
graphite oxide (H-GO) and of the derived CRGO, compared with
the pattern of CB, also reported in Fig. 2.8 as F.
The FTIR spectrum of CRGO in Fig. 2.23, confirms the
presence of oxygenated functional groups, mainly phenolic and
epoxide, on the surface of the reduced layers.

80
Fig. 2.23. FTIR spectra of the starting graphite oxide (H-GO) and
of the derived CRGO, compared with the spectrum of CB.
The TGA and elemental analysis of the samples of Fig.
2.22, reported in Fig. 2.24 and Table 2.3, indicate for CRGO the
presence of large amount of oxygen (C/O = 4.4), which is more
than five times higher than for standard carbon black (CB).
The surface area of CRGO (SBET = 46.8 m2/g), evaluated
from the BET measurements reported in Table 2.3, strongly
increases during the chemical reduction of H-GO (SBET = 1.1 m2/g)
and becomes similar to that one of CB (SBET = 57.2 m2/g),
confirming the high degree of exfoliation of CRGO particles.

81
Fig. 2.24. TGA curves in N2 of the starting graphite oxide (H-GO)
and of the derived CRGO, compared with the curve of CB.
Table 2.3. Results of elemental analysis on the starting graphite oxide (H-GO) and of the derived CRGO, compared with CB.a
Sample
Surface area
(m2/g)
Elemental composition (%wt.)
C H N O S C/O
H-GO 1.1 59.1 1.4 0.1 35 4.4 1.6
CRGO 46.8 79.9 0.2 2.7 17.2 0.0 4.6
CB 57.2 96.2 0.5 0.1 3.2 0.0 30.1 aElemental composition of the anhydrous samples: water contents of nearly 20 %wt., 2 %wt. and 1 %wt. are evaluated by TGA for H-GO, CRGO and CB, respectively.
Additional informations about the structural changes during
the whole oxidation-reduction process from G to CRGO are
provided by the raman characterization of G, H-GO, CRGO and
CB reported in Fig. 2.25. The Raman characterization was

82
performed by the group of Dr. Pellegrino Musto at the CNR,
Institute of Chemistry and Technology of Polymers (ICTP)
Pozzuoli.
The main features of the Raman spectrum of a perfect
graphite are the G-band at ~ 1580 cm-1 and the 2D-band at ~ 2700
cm-1.[106] The Raman spectrum of G also present a pronounced D-
band at 1325 cm-1 , a shoulder of the G-band at 1592 cm-1, called
the D'-band and a combination (D+G) band at 2909 cm-1, which
indicate the presence of structural disorder.[107] In the Raman
spectrum of GO, D-band becomes more intense and both D and G-
bands are broader (FWHMD increases from 55.5 cm-1 to 97.7 cm-1)
because of reduction in size of the in-plane sp2-carbon domains,
caused by chemical oxygen functions in the graphitic layers.[108] It
is worth adding that the (D+G) band becomes more intense than
the close 2D band and that in this region the spectrum becomes
strictly similar to that one of carbon black (Fig. 2.25, upper curve).
The CRGO Raman spectrum presents D and G-bands being
narrower than for the GO samples and (e.g., FWHMD decreases
from 97.7 cm-1 to 60.2 cm-1) and close to those of the starting G
sample (see Table 2.4). The D'-band reappears at 1597 cm-1, as a
shoulder of the G-band while the (D + G) band is more intense
than in the case of graphite G.

83
Fig. 2.25. Raman spectra of the starting high surface area graphite
(G), the derived graphite oxide (H-GO), the chemically reduced
graphite oxide (CRGO) and the carbon black (CB) samples.
Table 2.4. Full width at half maximum of the D-band of the Raman spectra of Fig. 2.24.
Sample FWHMD
(cm-1)
G 55.5
H-GO 97.7
CRGO 60.2
CB 118.8
2.6.2 Mechanical Exfoliation of Graphite Oxide
The mechanical exfoliation of GO by ball-milling is a simple but
effective technique to produce exfoliated graphite oxide (eGO, also
called graphene oxide) in the bulk state (see Scheme 2.8).
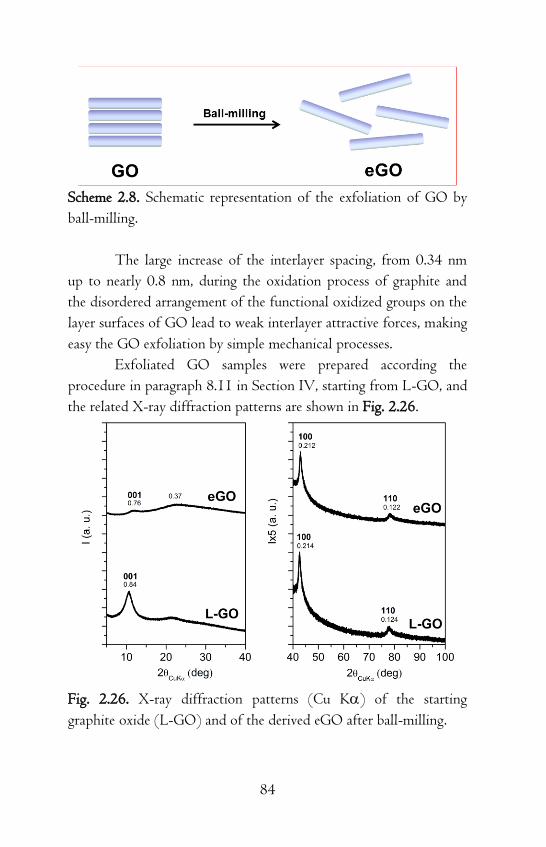
84
Scheme 2.8. Schematic representation of the exfoliation of GO by
ball-milling.
The large increase of the interlayer spacing, from 0.34 nm
up to nearly 0.8 nm, during the oxidation process of graphite and
the disordered arrangement of the functional oxidized groups on the
layer surfaces of GO lead to weak interlayer attractive forces, making
easy the GO exfoliation by simple mechanical processes.
Exfoliated GO samples were prepared according the
procedure in paragraph 8.11 in Section IV, starting from L-GO, and
the related X-ray diffraction patterns are shown in Fig. 2.26.
Fig. 2.26. X-ray diffraction patterns (Cu K) of the starting
graphite oxide (L-GO) and of the derived eGO after ball-milling.

85
The pattern of eGO shows, beside the maintenance of the
100 and 110 reflections, a very broad intense halo, centered at d =
0.37 nm with a correlation length of about 1 nm, indicating the
presence of a large fraction of essentially exfoliated GO.[109] The
weak reflection with d = 0.76 nm and D┴ ≈ 2.5 nm can be
interpreted as the 001 reflection of unexfoliated GO, occurring in an
amount lower than 10 %wt.
The bands of carboxyl, phenolic and epoxide groups in the
FTIR spectrum of eGO appear enhanced in intensity with respect to
the same bands in the L-GO FTIR spectrum in Fig. 2.27. This
result could be attributed to the greater exposure of the oxygenated
functional groups on the exfoliated layers of eGO.
Fig. 2.27. FTIR spectra of the starting graphite oxide (L-GO) and
of the derived eGO after ball-milling.
Similar considerations can be made by comparing the TGA
of L-GO and eGO in Fig. 2.28. In fact, above 150 °C, the
oxygenated functional groups of eGO decompose earlier with

86
respect to the same groups of L-GO, and, again, this phenomenon
could be attributed to a greater exposure of the groups on the
exfoliated layers of eGO.
Fig. 2.28. TGA curves in N2 of the starting graphite oxide (L-GO)
and of the derived eGO after ball-milling.
The results of the elemental analysis and the BET
measurements, reported in Table 2.5, show that L-GO and eGO
samples have similar C/O ratios and largely different surface areas,
0.8 m2/g and 4.6 m2/g, respectively, definitely lower than the value
for G (308 m2/g).

87
Table 2.5. Results of elemental analysis on the starting graphite oxide (L-GO) and of the derived eGO after ball-milling.a
Sample Surface
area (m2/g)
Elemental composition (%wt.)
C H N O S C/O
L-GO 0.8 63.7 0.6 0.1 33.7 1.9 1.9
eGO 4.2 66.1 0.5 0.1 31.4 1.9 2.1 aElemental composition of the anhydrous samples: water contents of nearly 5 %wt. and 6 %wt. are evaluated by TGA for L-GO and eGO, respectively. The SEM images of L-GO in Figs 2.29A-B indicate that the
oxidation of G leads to dense aggregates of graphene oxide sheets
(surface area largely decreases from 308 m2/g to 0.8 m2/g). The
mechanical exfoliation of L-GO by ball-milling strongly reduced the
dimension of the particles, providing sub-micrometric aggregates of
thin crumpled graphene oxide sheets, stacked in a disordered manner
(Figs 2.29C-D).
Fig. 2.29. SEM images of: (A,B) L-GO and (C,D) eGO at different
magnifications.

88
The high degree of exfoliation of eGO is also confirmed by
the TEM images in Fig. 2.30. Particularly, in Fig. 2.30B single
graphene oxide layers are clearly visible.
Fig. 2.30. TEM images of eGO at different magnifications: (A) 0.5
μm and (B) 200 nm.
2.6.3 Syndiotactic Polystyrene Aerogels with Reduced
Graphite Oxide
Monolithic sPS/reduced GO (rGO) aerogels were prepared for a
very broad polymerrGO composition range, according to the
procedure reported in paragraph 8.13 in Section IV. The
preparation and the characterization of polymer/rGO aerogels were
performed in collaboration with Dr. Simona Longo of the
Department of Chemistry and Biology of the University of Salerno.
These interesting materials, not only could be helpful to an
easier handling of exfoliated rGO, removing the risks connected
with inhalable nanoparticles, but also, due to their thermoplastic
nature, could be used as graphene “masterbatches” for composite
processing,[110–112] as already mentioned for monolithic
sPS/exfoliated clay aerogels (see paragraph 1.3).
Homogenous rGO dispersions in an organic solvent
(dichlorobenzene, DCB) were prepared by a solvo-thermal reduction
procedure,[113] described in paragraph 8.12 in Section IV i.e. by

89
sonication at 100 °C of L-GO, as shown in Fig. 2.31.
Fig. 2.31. Solvothermal reduction route of L-GO for preparation of
rGO dispersions in DCB.
The X-ray diffraction pattern of rGO powder, after
extraction of rGO/DCB dispersion with supercritical carbon
dioxide, is shown in Fig. 2.32 and exhibits a 002 reflection at 0.35
nm, with a correlation length of roughly 3.5 nm.
Fig. 2.32. X-ray diffraction (Cu K) patterns in the 2θ range 5-50°
of L-GO and reduced graphite oxide (rGO), as obtained by solvo-
thermal reduction of graphite oxide dispersions in DCB and
supercritical-CO2 removal of DCB.

90
sPS/rGO gels were prepared by dissolution of sPS in rGO
dispersions, followed by cooling to room temperature of the hot
solution. The overall amount of polymer and rGO in the gels was
generally fixed to 10 %wt. Monolithic aerogels, which essentially
present the same size and shape of the precursor gels and hence a
porosity close to 90%, are obtained by extracting with supercritical
carbon dioxide all the prepared sPS/rGO gels (Fig. 2.33). A
macroscopic phase separation of the black rGO aggregates is only
obtained for sPS/rGO weight ratios higher than 70/30.
Fig. 2.33. Photographs of homogenous monolithic sPS/rGO
80/20 aerogels, with porosity P= 90%, as prepared with cylindrical
(diameter of 7 mm) (A) and plate (length 15 mm, width 10 mm
and thickness 2 mm) (B) molds. The shown aerogels essentially
present the same size and shape of the precursor gels.
A peculiar feature of the sPS/rGO aerogels is their uniform
light blue color, even with high rGO content. All known composites
containing carbonaceous fillers are black in color and the unique
color of sPS/rGO aerogels could be attributed to the highly porous
morphology of the sPS aerogels (see Fig. 1.14).
The X-ray diffraction (Cu K) patterns of the sPS/rGO
aerogels, with porosity of 90% and presenting different
polymer/rGO weight ratios are shown in Fig. 2.34. The patterns
show the maintenance of the diffraction peaks of the nanoporous-
crystalline form of sPS, for the entire composition range. In this

91
respect, it is worth adding that the degree of crystallinity of the
polymer increases going from the pure sPS aerogel to the 95/5
aerogel (from nearly 45% up to 55%), suggesting a nucleating effect
of graphitic layers on the crystalline form. The in-plane 100 peak
of rGO clearly appears for the 50/50 aerogel (Fig. 2.34E), while
only appears as a shoulder for lower rGO contents.
Fig. 2.34. X-ray diffraction (Cu K) patterns in the 2θ range 5-50°
of sPS aerogels with rGO, as obtained from gels with a solvent
content of 90 %wt. and presenting different polymer/rGO weight
ratios: (A) 100/0; (B) 95/5; (C) 80/20; (D) 70/30; (E) 50/50.
The Miller indexes of the main reflections of the nanoporous-
crystalline δ form of sPS are indicated in A. The symbol g indicates
reflections relative to the graphite oxide planes.
SEM images of the sPS/rGO aerogels of different weight

92
ratios of Fig. 2.34 are shown in Fig. 2.35. For the polymer rich
aerogels (Figs 2.35A–C, rGO content up to 30 %wt.) the images are
dominated by the typical fibrillar morphology (with diameters of
roughly 50100 nm) of the form sPS aerogels. The rGO
component is clearly apparent, mainly as hexagonal platelets, only
for the 50/50 sPS/rGO aerogels (Fig. 2.35D). The exfoliation state
of rGO is preserved by preparing polymer/rGO aerogels up to 30
%wt. of rGO content.
Fig. 2.35. SEM images of sPS/rGO aerogels with weight ratios
95/5 (A), 80/20 (B), 70/30 (C), 50/50 (D).
The Raman imaging analysis on a sample of sPS/rGO
aerogel 80/20 was performed by the group of Dr. Pellegrino Musto
at the CNR, Institute of Chemistry and Technology of Polymers
(ICTP) Pozzuoli and is reported in Fig. 2.36.
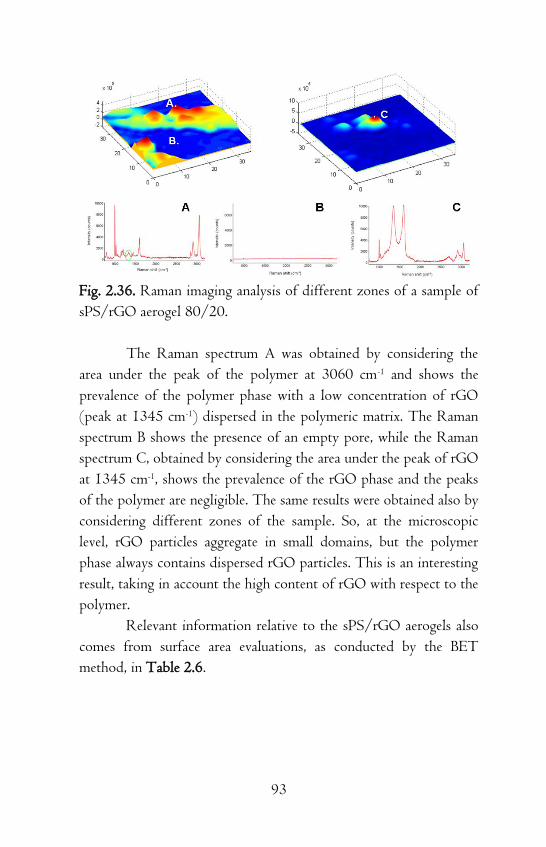
93
Fig. 2.36. Raman imaging analysis of different zones of a sample of
sPS/rGO aerogel 80/20.
The Raman spectrum A was obtained by considering the
area under the peak of the polymer at 3060 cm-1 and shows the
prevalence of the polymer phase with a low concentration of rGO
(peak at 1345 cm-1) dispersed in the polymeric matrix. The Raman
spectrum B shows the presence of an empty pore, while the Raman
spectrum C, obtained by considering the area under the peak of rGO
at 1345 cm-1, shows the prevalence of the rGO phase and the peaks
of the polymer are negligible. The same results were obtained also by
considering different zones of the sample. So, at the microscopic
level, rGO particles aggregate in small domains, but the polymer
phase always contains dispersed rGO particles. This is an interesting
result, taking in account the high content of rGO with respect to the
polymer.
Relevant information relative to the sPS/rGO aerogels also
comes from surface area evaluations, as conducted by the BET
method, in Table 2.6.

94
Table 2.6. Total surface area (SBET) of the starting graphite, graphite oxide, reduced graphite oxide and of aerogels with porosity P = 90%, exhibiting 80/20, 70/30 and 50/50 polymer/rGO weight ratio.a
Sample SBETa (m2 g-1)
Graphite 308
Graphite oxide 0.8
Reduced graphite oxide (scrCO2 treated) 2.1
sPS/rGO 80/20 aerogel 289
Aerogel δ sPS 312 aTotal area evaluated following the BET model in the standard 0.05<P/P0 <0.3 pressure range.
The sPS/rGO 80/20 aerogels present values of SBET (289
m2 g-1) not far from those observed for pure sPS aerogels (312 m2 g-
1). As already commented for sPS/exfoliated-OC aerogels, rGO not
only does not disturb the formation of the nanoporous crystalline
phase but also does not alter the amorphous aerogel porosity.
References
[1] B. Kwiecińska, H. I. Petersen. Int. J. Coal Geol. 2004, 57, 99–
116.
[2] A. W. Hull. Phys. Rev. 1917, 10, 661–696.
[3] J. D. Bernal. Proc. R. Soc. A 1924, 106, 749–773.
[4] M. Inagaki and F. Kang, Carbon Materials Science and
Engineering: from Fundamentals to Applications, Chapter 2, 36,
2006.
[5] B. E. Warren. Phys. Rev. 1941, 59, 693–698.
[6] Z. Q. Li, C. J. Lu, Z. P. Xia, Y. Zhou, Z. Luo. Carbon 2007,
45, 1686–1695.
[7] A. Milev, M. Wilson, G. S. Kamali Kannangara, N. Tran. Mater.
Chem. Phys. 2008, 111, 346–350.

95
[8] J. Zhao, L. Yang, F. Li, R. Yu, C. Jin. Carbon 2009, 47, 744–
751.
[9] O. J. Guentert. J. Chem. Phys. 1962, 37, 884–891.
[10] R. E. Franklin. Acta Crystallogr. 1950, 3, 107–121.
[11] P. J. F. Harris. Interisciplinary Science Reviews 2001, 26, 204–
210.
[12] M. J. Wang, C. A. Gray, S. A. Reznek, K. Mahmud, Y.
Kutsovsky, Kirk-Othmer Encyclopedia of Chemical Technology,
2003.
[13] S. Babu, M. S. Seehr. Carbon 1996, 34, 1259–1265.
[14] O. J. Guentert, C. A. Klein. Appl. Phys. Lett. 1963, 2, 125–
127.
[15] C. N. Hooker, A. R. Ubbelohde, D. A. Young. Proc. R. Soc.
London A 1965, 284, 17–31.
[16] A. Celzard, J. F. Marêché, G. Furdin, S. Puricelli. J. Phys. D:
Appl. Phys. 2000, 33, 3094–3101.
[17] M. Cardinali, L. Valentini, J. M. Kenny. J. Phys. Chem. C
2011, 115, 16652–16656.
[18] H. Fujimoto. Carbon 2003, 41, 1585–1592.
[19] B. C. Brodie. Philos. Trans. R. Soc. London 1859, 149, 249–
259.
[20] L. Staudenmaier. Ber. Dtsch. Chem. Ges. 1898, 31, 1481–
1487.
[21] W. S. Hummers, R. E. Offeman. J. Am. Chem. Soc. 1958, 80,
1339.
[22] D. R. Dreyer, R. S. Ruoff, C. W. Bielawski. Angew. Chem. Int.
Ed. 2010, 49, 9336–9344.
[23] H. He, J. Klinowski, M. Forster, A. Lerf. Chem. Phys. Lett.
1998, 287, 53–56.
[24] J. Luo, L. J. Cote, V. C. Tung, A. T. Tan, P. E. Goins, J. Wu,
J. Huang. J. Am. Chem. Soc. 2010, 132, 17667–17669.
[25] D. R. Dreyer, C. W. Bielawski. Adv. Funct. Mater. 2012, 12,
3247–3253;

96
[26] A. D. Todd, C. W. Bielawski. Catal. Sci. Technol. 2013,
3,135–139;
[27] D. R. Dreyer, S. Murali, Y. Zhu, R. S. Ruoff, C. W. Bielawski.
J. Mater. Chem. 2011, 21, 3443–3447.
[28] Y. Si, E. T. Samulski. Nano Lett. 2008, 8, 1679–1682.
[29] K. Haubner, J. Morawski, P. Olk, L. M. Eng, C. Ziegler, B.
Adolphi, E. Jaehne. ChemPhysChem 2010, 10, 2131–2139.
[30] D. Chen, H. Zhu, T. Liu. Appl. Mater. Interface 2010, 2,
3702−3708.
[31] Z. J. Fan, W. Kai, J. Yan, T. Wie, L. J. Zhi, J. Feng, Y. M.
Ren, L. P. Song, F. Wei. ACS Nano 2011, 5, 191−198.
[32] S. Zhang, Y. Shao, H. Liao, M. H. Engelhard, G. Yin, Y. Lin.
ACS Nano 2011, 5, 1785−1791.
[33] J. Wang, X. Wang, C. Xu, M. Zhang, X. Shang. Polym.
Int.2011, 60, 816−822.
[34] H. Kim, S. Kobayashi, M. A. AbdurRahim, M. J. Zhang, A.
Khusainova, M. A. Hillmyer. Polymer 2011, 52, 1837−1846.
[35] S. Ansari, E. P. Giannelis. J. Polym. Sci.: Part B 2009, 47,
888−889.
[36] H. P. Boehm, R. Setton, E. Stumpp. Pure Appl. Chem. 1994,
66, 1893–1901.
[37] S. Dresselhaus, G. Dresselhaus. Adv. Phys. 2002, 51, 1–186.
[38] J. O. Besenhard. Carbon 1976, 14, 111–115.
[39] C. Herold, A. Herold, P. Lagrange P. Solid State Sci. 2004, 6,
125–138.
[40] W. Q. Deng, X. Xu, W. A. Goddard. Phys. Rev. Lett. 2004,
92, 166103.
[41] T. Quang, P. Pokharel, G. S. Song, D. S. Lee. J. Nanosci.
Nanotech. 2012, 12, 4305–4308.
[42] J. Li, L. Vaisman, G. Marom, J. K. Kim. Carbon 2007, 45,
744–750.
[43] S. Tongay, J. Hwang, D. B. Tanner, H. K. Pal, D. Maslov, A. F.

97
Hebard. Phys. Rev. B 2010, 81, 115428.
[44] W. Yan, M. M. Lerner. Carbon 2004, 42, 2981–2987.
[45] W. Katinonkul, M. M. Lerner. Carbon 2007, 45, 2672–2677.
[46] T. Maluangnont, G. T. Bui, B. A. Huntington, M. M. Lerner.
Chem. Mater. 2011, 23, 1091–1095.
[47] W. Rüdorff, E. Schulze. Z. Anorg. Allg. Chem. 1954,
277,156–171.
[48] G. Cao, V. M. Lynch, L. N. Yacullo. Chem. Mater. 1993, 5,
1000–1006.
[49] J. Lu, T. Paliwala, S. C. Lim, C. Yu, T. Y. Niu, A. J. Jacobson.
Inorg. Chem. 1997, 36, 923–929.
[50] G. J. McManus, J. J. Perry, M. Perry, B. D. Wagner, M. J.
Zaworotko. J. Am. Chem. Soc. 2007, 129, 9094–9101.
[51] P. Iannelli, P. Damman, M. Dosière, J. F. Moulin.
Macromolecules 1999, 32, 2293–2300.
[52] A. Matsumoto, S. Oshita, D. Fujioka. J. Am. Chem. Soc.
2002, 124, 13749–13756.
[53] V. Petraccone, O. Tarallo, V. Venditto, G. Guerra.
Macromolecules 2005, 38, 6965–6971.
[54] O. Tarallo, V. Petraccone, V. Venditto, G. Guerra. Polymer
2006, 47, 2402–2410.
[55] A. R. Albunia, C. D’ Aniello, G. Guerra. CrystEngComm
2010, 12, 3942–3949.
[56] T. Shimogaki, S. Oshita, A. Matsumoto. Macromol. Chem.
Phys. 2011, 212, 1767–1777.
[57] A. R. Albunia, P. Rizzo, M. Coppola, M. De Pascale, G.
Guerra. Polymer 2012, 53, 2727–2735.
[58] Y. Matsuo, T. Niwa, Y. Sugie. Carbon 1999, 37, 897–901.
[59] I. Dékány, R. Krüger-Grasser, A. Weiss. Colloid Polym. Sci.
1998, 276, 570–576.
[60] Y. Matsuo, K. Hatase, Y. Sugie. Chem. Lett. 1999, 1109–
1110.
[61] Z. Liu, Z. M. Wang, X. Yang, K. Ooi. Langmuir 2002, 18,

98
4926–4932.
[62] Y. Matsuo, T. Miyabe, T. Fukutsuka, Y. Sugie. Carbon 2007,
45, 1005–1012.
[63] S. Stankovich, D. A. Dikin, O. C. Compton, G. H. B. Dommet,
R. S. Ruoff, S. B. T. Nguyen. Chem. Mater. 2010, 22, 4153–4157.
[64] K. Zhang, L. Mao, L. L. Zhang, H. S. O. Chan, X. S. Zhao, J.
Wu. J. Mater. Chem. 2011, 21, 7302–7307.
[65] M. Acik, D. R. Dreyer, C. W. Bielawski, Y. J. Chabal. J. Phys.
Chem. C 2012, 116, 7867−7873.
[66] T. Cassagneau, F. Guérin, J. H. Fendler. Langmuir 2000, 16,
7318−7324.
[67] R. Bissessur, S. F. Scully. Solid State Ionics 2007, 178, 877–
882.
[68] H. Bai, C. Li, X. Wang, G. Shi. J. Phys. Chem. C 2011, 115,
5545–5551.
[69] T. N. Blanton, D. Majumda. Powder Diffr. 2012, 27, 104–
107.
[70] S. Y. Chazhengina, E. N. Kotelnikova, I. V. Filippova, S. K.
Filatov. J. Mol. Struct. 2003, 647, 243–257.
[71] M. Dirand, Z. Achour-Boudjema. J. Mol. Struct. 1996, 375,
243–248.
[72] V. Chevallier, D. Petitjean, M. Bouroukba, M. Dirand. Polymer
1999, 40, 2129–2137.
[73] D. Fu, Y. Liu, Y. Su, G. Liu, D. Wang. J. Phys. Chem. B 2011,
115, 4632–4638.
[74] D. Fu, Y. Liu, G. Liu, Y. Su, D. Wang. Phys. Chem. Chem.
Phys. 2011, 13, 15031–15036.
[75] G. Ungar, N. Mašić. J. Phys. Chem. 1985, 89, 1036–1042.
[76] C. J. Kim, W. Khan, S. Y. Park. Chem. Phys. Lett. 2011, 511,
110–115.
[77] Y. Ide, M. Ogawa. J. Colloid Interface Sci. 2006, 296, 141–
149.
[78] T. Itoh, N. Ohta, T. Shichi, T. Yui, K. Takagi. Langmuir
99
2003, 19, 9120–9126.
[79] M. A. Osman, M. Ernst, B. H. Meier, U. W. Suter. J. Phys.
Chem. B 2002, 106, 653–662.
[80] M. Galimberti, S. Giudice, V. Cipolletti, G. Guerra. Polym.
Adv. Tech. 2010, 21, 679–684.
[81] A. K. Geim, K. S. Novoselov. Nat. Mater. 2007, 6, 183–191.
[82] C. Lee, X. Wei, J. W. Kysar, J. Hone. Science 2008, 321, 385–
388.
[83] A. A. Balandin, S. Ghosh, W. Bao, I. Calizo, D. Teweldebrhan,
F. Miao, C. N. Lau. Nano Lett. 2008, 8, 902–907.
[84] X. Du, I. Skachko, A. Barker, E. Y. Andrei. Nature
Nanotechnol. 2008, 3, 491–495.
[85] K. S. Novoselov, A. K. Geim, S. V. Morozov, D. Jiang, Y.
Zhang, S. V. Dubonos, I. V. Grigorieva, A. A. Firsov. Science 2004,
306, 666–669.
[86] S. J. Chae, F. Günes, K. K. Kim, E. S. Kim, G. H. Han, S. M.
Kim, H. J. Shin, S. M. Yoon, J. Y. Choi, M. H. Park, C. W. Yang,
D. Pribat, Y. H. Lee. Adv. Mater. 2009, 21, 2328–2333.
[87] X. Wang, H. You, F. Liu, M. Li, L. Wan, S. Li, Q. Li, Y. Xu,
R. Tian, Z. Yu, D. Xiang, J. Cheng. Chem. Vapor Deposition 2009,
15, 53–56.
[88] N. Li, Z. Wang, K. Zhao, Z. Shi, Z. Gu, S. Xu. Carbon 2009,
48, 255–259.
[89] C. Berger, Z. Song, X. Li, X. Wu, N. Brown, C. Naud, D.
Mayou, T. Li, J. Hass, A. N. Marchenkov, E. H. Conrad, P. N.
First, W. A. de Heer. Science 2006, 312, 1191–1196.
[90] S. Park, R. S. Ruoff. Nat. Nanotech. 2009, 5, 217–224.
[91] R. Sengupta, M. Bhattacharya, S. Bandyopadhyay, A. K.
Bhowmick. Prog. Polym. Sci. 2011, 36, 638–670.
[92] H. Kim, A. A. Abdala, C. W. Macosko. Macromol. 2010, 43,
6515–6530.
[93] S. Stankovich, D. A. Dikin, R. D. Piner, K. A. Kohlhaas, A.
Kleinhammes, Y. Jia, Y. Wu, S. T. Nguyen, R. S. Ruoff. Carbon
100
2007, 45, 1558–1565.
[94] S. Park, J. An, J. R. Potts, A. Velamakanni, S. Murali, R. S.
Ruoff. Carbon 2011, 49, 3019–3023.
[95] S. Stankovich, D. A. Dikin, G. H. B. Dommett, K. M.
Kohlhaas, E. J. Zimney, E. A. Stach, R. D. Piner, S. T. Nguyen, R.
S. Ruoff. Nature 2006, 442, 282–286.
[96] G. Eda, G. Fanchini, M. Chhowalla. Nat. Nanotech. 2008, 3,
270–274.
[97] H. J. Shin, K. K. Kim, A. Benayad, S. M. Yoon, H. K. Park, I. S.
Jung, M. H. Jin, H. K. Jeong, J. M. Kim, J. Y. Choi, Y. H. Lee. Adv.
Funct. Mater. 2009, 19, 1987–1992.
[98] A. B. Bourlinos, D. Gournis, D. Petridis, T. Szabò, A. Szeri, I.
Décány. Langmuir 2003, 19, 6050–6055.
[99] G. Wang, J. Yang, J. Park, X. Gou, B. Wang, H. Liu, J. Yao. J.
Phys. Chem. C 2008, 112, 8192–8195.
[100] R. Wissert, P. Steurer, S. Schopp, R. Thomann, R. Mülhaupt.
Macromol. Mater. Eng. 2010, 295, 1107–1115.
[101] Z. Sui, X. Zhang, Y. Lei, Y. Luo. Carbon 2011, 49, 4314–
4321.
[102] M. J. Fernández-Merino, L. Guardia, J. I. Paredes, S. Villar-
Rodil, P. Solís-Fernández, A. Martínez-Alonso, J. M. D. Tascón. J.
Phys. Chem. C 2010, 114, 6426–6432.
[103] X. Fan, W. Peng, Y. Li, X. Li, S. Wang, G. Zhang, F. Zhang.
Adv. Mater. 2008, 20, 4490–4493.
[104] W. Yuan, B. Li, L. Li. Appl. Surf. Sci. 2011, 257, 10183–
10187.
[105] T. Zhou, F. Chen, K. Liu, H. Deng, Q. Zhang, J. Feng, Q. Fu.
Nanotechnology 2011, 22, 45704–45709.
[106] C. Ferrari, J. C. Meyer, V. Scardaci, C. Casiraghi, M. Lazzeri,
F. Mauri, S. Piscanec, D. Jiang, K. S. Novoselov, S. Roth, A. K.
Geim. Phys. Rev. Lett. 2006, 97, 187401.
[107] V. Y. Osipov, A. V. Baranov, V. A. Ermakov, T. L.
Makarova, L. F. Chungong, A. I. Shames, K. Takai, T. Enoki, Y.
101
Kaburagi, M. Endo, A. Y. Vul'. Diam. Relat. Mater. 2011, 20,
205–209.
[108] Y. Guo, C. Bao, L. Song, B. Yuan, Y. Hu. Ind. Eng. Chem.
Res. 2011, 50, 7772–7783.
[109] I. Y. Jeon, Y. R. Shin, G. J. Sohn, H. J. Choi, S. Y. Bae, J.
Mahmood, S. M. Jung, J. M. Seo, M. J. Kim, D. W. Chang, L. Dai,
J. B. Baek. PNAS 2012, 109, 5588–5593.
[110] R. Verdejo, F. Barroso-Bujans, M. A. Rodriguez-Perez, J. A.
de Saja, M. A. Lopez-Manchado. J. Mater. Chem. 2008, 18, 2221–
2226.
[111] L. J. Cote, R. Cruz-Silva, J. Huang. J. Am. Chem. Soc. 2009,
131, 11027–11032.
[112] T. Kuilla, S. Bhadra, D. Yao, N. H. Kim, S. Bose, J. H. Lee.
Progr. Polym. Sci. 2010, 35, 1350–1375.
[113] C. Nethravathi, M. Rajamathi. Carbon 2008, 46, 1994–
1998.

102
103
Section II
Rubber Nanocomposites
The text in this section is reproduced in part with permission from
the following published works:
V. Cipolletti, M. Galimberti, M. Mauro, G. Guerra. Appl.
Clay Sci. 2014, 87, 179–188.
M. Galimberti, V. Cipolletti, M. Mauro, L. Conzatti.
Macromol. Chem. Phys. 2013, 214, 1931–1939.
M. Galimberti, V. Cipolletti, S. Musto, S. Cioppa, G. Peli,
M. Mauro, G. Guerra, S. Agnelli, T. Riccò, V. Kumar.
Proceedings at the Fall 184th Technical Meeting, Rubber
Division of American Chemical Society, Cleveland, OH
(USA), October 8–10, 2013.
M. Galimberti, M. Coombs, V. Cipolletti, V. Kumar, M.
Mauro, G. Guerra, L. Giannini. Proceedings at the Fall
182nd Technical Meeting, Rubber Division of American
Chemical Society, Cincinnati, OH (USA), October 9–11,
2012.

104

105
Chapter 3
Rubber/Organoclay Nanocomposites
3.1 Structure and Morphology of Organoclays in Rubber
Nanocomposites The world of rubber compounds was characterized, over the last
years, by the appearance of a new family of reinforcing fillers, the so
called nanofillers.[1] Basic features characterize their identity: they
are made by primary particles, that can be individually dispersed in a
polymer matrix, and have at least one dimension of one or few
nanometers.
Conversely, it is well known that fillers such as carbon black
(CB) and silica are nanostructured, being formed by aggregates of
nano-sized primary particles that can not be separated via
thermomechanical mixing.[2,3]
The nanometric size of nanofillers is at the origin of the
impressive research activity developed on rubber compounds based
on them, both in the academic and industrial worlds, as it is
correlated with features that are of great importance for the
reinforcement of rubber compounds: a huge specific surface area, a
very low concentration for establishing a network in a polymer
matrix (what is known as the percolation threshold) and, often, a
high length-to-width ratio, that is a high aspect ratio.
Organically modified clays (OCs) have been prevailingly
investigated [4–7] and it is nowadays well known that organophilic
cations, preferentially with long alkyl chains, are used to
compatibilize the hydrophilic pristine clays with the hydrophobic

106
polymer matrix. In the world of polymer nanocomposites, the
organization within a clay aggregate, in the polymer matrix, is
particularly investigated, because it strongly affects the final
properties of the composite material.
In the literature the following types of composites, arising
from the interaction of layered silicates and polymers, are proposed
(see Fig. 3.1), and they are called respectively microcomposite,
exfoliated nanocomposite and intercalated nanocomposite.[4–7]
Fig. 3.1. Scheme of different types of composites arising from the
interaction of layered silicates and polymers: (A) phase separated
microcomposite, (B) exfoliated nanocomposite and (C) intercalated
nanocomposite, after ref. 7.
Phase separated composite are reported to be formed when
the polymer is unable to intercalate between the silicate layers (Fig.
3.1A) and properties stay in the same range as traditional
microcomposites. Exfoliated or intercalated structures (Figs 3.1B,C)
are reported to be obtained when silicate layers are completely and
uniformly dispersed in a continuous polymer matrix or when

107
extended polymer chains are intercalated between the silicate layers
resulting in a well ordered multilayer morphology built up with
alternating polymeric and inorganic layers.[7]
The clay exfoliation is usually reported to occur through
the following mechanism: intercalation of polymer chains,
energetically favoured by the interaction between polymer and
alkylammonium chains, expansion of interlayer distance and, finally,
exfoliation.[4–6]
An alternative mechanism for explaining the formation of
polymer/OC nanocomposites is available in the scientific literature.
It is hypothesized that only low molecular mass substances, that
means compensating cations and, optionally, further polar molecules,
are intercalated in the clay interlayer space, being the intercalation of
hydrophobic polymer chains highly unlikely to occur.[8–10]
Upon examining polymer/OC nanocomposites by means of
X-ray Diffraction, reflections due to OC crystalline planes were
observed at almost the same 2θ values in patterns of pristine OC
and of polymer/OC nanocomposites and the small variations were
attributed to the reorganization of molecules in the interlayer space.
The relevant difference was the reduction of OC crystallites
dimension in the direction orthogonal to the structural layers,
interpreted with a different OC exfoliation degree. The reduction of
number of stacked layers was explained with the so called
“delamination mechanism”,[8] a progressive peeling off of clay
aggregates, excluding the intercalation of polymer chains.
In this paragraph the interaction of the rubber matrix with
OCs was investigated in order to elucidate the structure and the
morphology of the obtained OCs in rubber. OCs were first
prepared by using the rubber matrix as reaction medium. Rubber
nanocomposites were also prepared by melt blending OCs
previously prepared in the solid state. The structure of OCs in
rubber nanocomposites were finally compared with the ones
obtained in the solid state (see chapter 1 in Section I). The
108
preparation of rubber/OC nanocomposites and the characterization
of their mechanical properties (see next paragraph) were performed
by the group of Prof. Maurizio Galimberti at the Polytechnic of
Milan. TEM analysis on rubber nanocomposites was performed by
Dr. Lucia Conzatti at the CNR, Institute for Macomolecular
Studies (ISMAC)-UOS Genova.
The reaction between pristine MMT and the ammonium
salt 2HTCl was performed in poly(1,4-cis isoprene) (PIR) as the
reaction medium, by melt blending the ingredients, as described in
paragraph 8.14 in Section IV. The reaction was as well performed
by blending either SA or SAES together with MMT and 2HTCl.
The obtained nanocomposites had the same MMT content (about 5
phr), whereas the amounts of 2HT, SA and SAES were equal to the
CEC of MMT.
Results from X-ray diffraction analysis are shown in Fig.
3.2. By comparing the patterns in Fig. 3.2 with those reported in Fig
1.7, it is evident that the position of (00ℓ) reflections and the
corresponding interlayer distances are essentially the same for OCs
prepared from pristine MMT, 2HTCl and either SA or SAES either
through the neat synthesis at the solid state or in the PIR as the
reaction medium.

109
Fig. 3.2. X-ray diffraction patterns (Cu Kα) of of OC samples
prepared in PIR as the reaction medium: (A) MMT/2HT, (B)
MMT/2HT/SA, (C) MMT/2HT/SAES. The symbol r indicates
the reflection relative to the rotator order.
Moreover, the inspection of Fig. 3.2 reveals the presence of
the reflection at 2θ ≈ 21°, that indicates the occurrence of the
hexagonal rotator order in the packing of long hydrocarbon tails of
the compensating cation. These findings appear a clear indication
that the same OCs are prepared at the solid state, in the absence of
any other chemical substance, and in the polymer medium. The
crystalline structure of OCs is dictated by the low molecular mass
chemicals that are in the interlayer space, as suggested by the
mechanism proposed by Galimberti et al. for the formation of
polymer/OC nanocomposites.[8–10] One could add that
reflections due to long sequences (the methylene sequences), usually
attributed to polymeric chains, are present in the X-ray diffraction
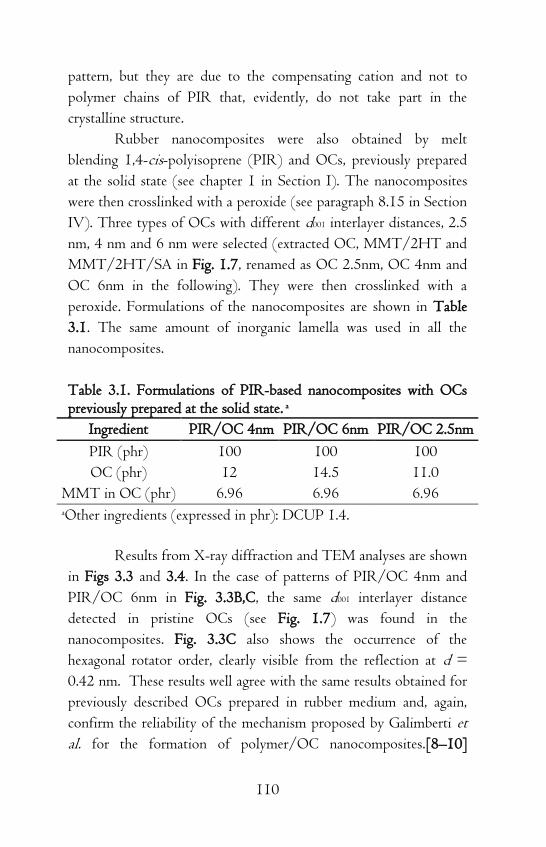
110
pattern, but they are due to the compensating cation and not to
polymer chains of PIR that, evidently, do not take part in the
crystalline structure.
Rubber nanocomposites were also obtained by melt
blending 1,4-cis-polyisoprene (PIR) and OCs, previously prepared
at the solid state (see chapter 1 in Section I). The nanocomposites
were then crosslinked with a peroxide (see paragraph 8.15 in Section
IV). Three types of OCs with different d001 interlayer distances, 2.5
nm, 4 nm and 6 nm were selected (extracted OC, MMT/2HT and
MMT/2HT/SA in Fig. 1.7, renamed as OC 2.5nm, OC 4nm and
OC 6nm in the following). They were then crosslinked with a
peroxide. Formulations of the nanocomposites are shown in Table
3.1. The same amount of inorganic lamella was used in all the
nanocomposites.
Table 3.1. Formulations of PIR-based nanocomposites with OCs previously prepared at the solid state. a
Ingredient PIR/OC 4nm PIR/OC 6nm PIR/OC 2.5nm
PIR (phr) 100 100 100
OC (phr) 12 14.5 11.0
MMT in OC (phr) 6.96 6.96 6.96 aOther ingredients (expressed in phr): DCUP 1.4.
Results from X-ray diffraction and TEM analyses are shown
in Figs 3.3 and 3.4. In the case of patterns of PIR/OC 4nm and
PIR/OC 6nm in Fig. 3.3B,C, the same d001 interlayer distance
detected in pristine OCs (see Fig. 1.7) was found in the
nanocomposites. Fig. 3.3C also shows the occurrence of the
hexagonal rotator order, clearly visible from the reflection at d =
0.42 nm. These results well agree with the same results obtained for
previously described OCs prepared in rubber medium and, again,
confirm the reliability of the mechanism proposed by Galimberti et
al. for the formation of polymer/OC nanocomposites.[8–10]
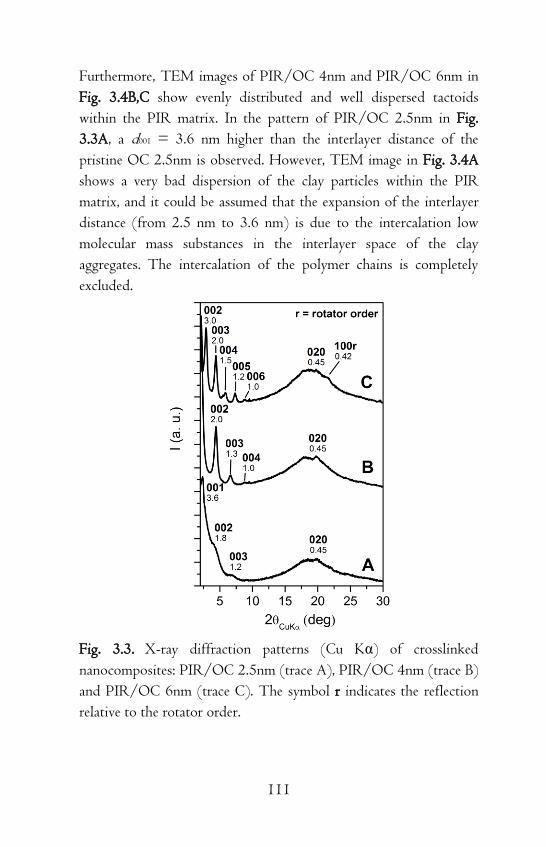
111
Furthermore, TEM images of PIR/OC 4nm and PIR/OC 6nm in
Fig. 3.4B,C show evenly distributed and well dispersed tactoids
within the PIR matrix. In the pattern of PIR/OC 2.5nm in Fig.
3.3A, a d001 = 3.6 nm higher than the interlayer distance of the
pristine OC 2.5nm is observed. However, TEM image in Fig. 3.4A
shows a very bad dispersion of the clay particles within the PIR
matrix, and it could be assumed that the expansion of the interlayer
distance (from 2.5 nm to 3.6 nm) is due to the intercalation low
molecular mass substances in the interlayer space of the clay
aggregates. The intercalation of the polymer chains is completely
excluded.
Fig. 3.3. X-ray diffraction patterns (Cu Kα) of crosslinked
nanocomposites: PIR/OC 2.5nm (trace A), PIR/OC 4nm (trace B)
and PIR/OC 6nm (trace C). The symbol r indicates the reflection
relative to the rotator order.

112
Fig. 3.4. TEM micrographs of crosslinked rubber nanocomposites:
(A) PIR/OC 2.5nm, (B) PIR/OC 4nm and (C) PIR/OC 6nm.
Hence, experimental findings from the preparation of OCs:
a) in the solid state (see chapter 1 in Section I), b) in situ in the
rubber matrix and c) for melt blending of PIR and OCs, previously
prepared at the solid state gave a strong support to the mechanism
proposed by Galimberti et al. for polymer/OC nanocomposites
formation.[8–10]
On the basis of this mechanism, the interlayer distance of
two successive layers in a OC depends on the tilting angle of the
substituents of the nitrogen atom of the compensating cation. The
degree of order of OCs depends on the density of compatible
hydrocarbon chains in the interlayer space: the higher is the density
of such chains, as in the case of 2HT and SA or SAES, the higher is
the degree of order.
3.2 Properties of Rubber/Organoclay Nanocomposites
OCs are characterized by reversible exothermic and endothermic
phenomena, corresponding to the recovery and the loss of the
rotator order, also in PIR-based nanocomposites. As already
observed for OCs in the solid state (see paragraph 1.2 in Section I),
the DSC analysis of PIR/OC 6nm in Fig. 3.5, besides the glass
transition of PIR at -65 °C, shows an irreversible first heating scan
followed by reversible cooling and heating scans with peaks at 66 °C
and at 74 °C, respectively.

113
Fig. 3.5. DSC scans of rubber nanocomposite containing OC 6nm.
Tensile and dynamic-mechanical properties of rubber
nanocomposites were found to be affected by the OC structure,
namely by the interlayer distance. Nominal stress–nominal strain
curves obtained from tensile tests are shown in Fig. 3.6, ultimate
properties from tensile measurements are reported in Table 3.2,
while curves of the dynamic storage modulus, determined in the
shear mode, as a function of the strain amplitude are presented in
Fig. 3.7.
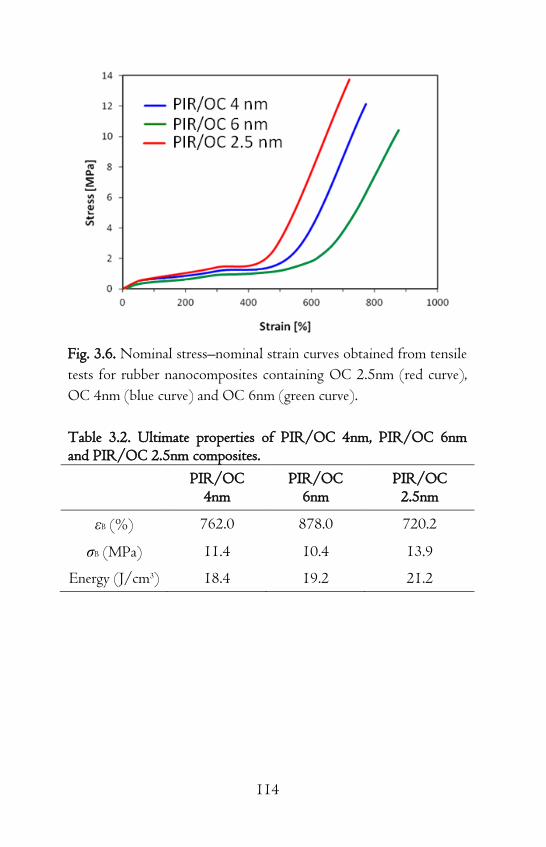
114
Fig. 3.6. Nominal stress–nominal strain curves obtained from tensile
tests for rubber nanocomposites containing OC 2.5nm (red curve),
OC 4nm (blue curve) and OC 6nm (green curve).
Table 3.2. Ultimate properties of PIR/OC 4nm, PIR/OC 6nm and PIR/OC 2.5nm composites.
PIR/OC
4nm PIR/OC
6nm PIR/OC
2.5nm
εB (%) 762.0 878.0 720.2
σB (MPa) 11.4 10.4 13.9
Energy (J/cm3) 18.4 19.2 21.2

115
Fig. 3.7. G' values (MPa) versus strain amplitude for rubber
nanocomposites containing OC 2.5nm (red curve), OC 4nm (blue
curve) and OC 6nm (green curve).
The higher values for stresses at given elongations and for
dynamic-mechanical moduli were obtained with OC having 2.5 nm
as the d001 interlayer distance. These findings could be attributed to
the large amount of the amphiphile in OC 4nm and OC 6nm that
acts as plasticizer and leads to lower mechanical properties.
References
[1] M. Maiti, M. Bhattacharya, A. K. Bhowmick. Rubber
Chem.Technol. 2008, 81, 384–469.
[2] A. I. Medalia, G. Kraus, in The Science and Technology of
Rubber Second Ed.; J. E. Mark, B. Erman, F. R. Eirich, Eds.
Elsevier Academic Press 1994, Chapter 8, p. 387.

116
[3] J. B. Donnet, E. Custodero, in The Science and Technology of
Rubber Third Ed.; J. E. Mark, B. Erman, F. R. Eirich, Eds. Elsevier
Academic Press 2005, Chapter 8, p. 367.
[4] S. S. Ray, M. Okamoto. Progr. Polym. Sci. 2003, 28, 1539–
1641.
[5] R. Sengupta, S. Chakraborty, S. Bandyopadhyay, S. Dasgupta, R.
Mukhopadhyay, K. Auddy, A. S. Deuri. Polym. Eng. Sci. 2007,
1956–1974.
[6] B. Chen, J. R. G. Evans, H. C. Greenwell, P. Boulet, P. V.
Coveney, A. A. Bowden, A. Whiting. Chem. Soc. Rev. 2008, 37,
568–594;
[7] M. Alexandre, P. Dubois. Mater. Sci. Eng. 2000, 28, 1–63.
[8] M. Galimberti, A. Lostritto, A. Spatola, G. Guerra. Chem.
Mater. 2007, 19, 2495–2499.
[9] M. Galimberti, S. Senatore, L. Conzatti, G. Costa, G. Giuliano,
G. Guerra. Polym. Adv. Technol. 2009, 20, 135–142;
[10] M. Galimberti, S. Giudice, V. Cipolletti, G. Guerra. Polym.
Adv. Technol. 2010, 21, 679–684.

117
Chapter 4
Rubber/Graphite Oxide Intercalation
Compound Nanocomposites
4.1 Structure and Morphology of Graphite Oxide
Intercalation Compounds in Rubber Nanocomposites
Besides carbon black, fillers made of sp2 carbon atoms, such as
carbon nanotubes (CNTs) [1–5] and graphene or graphite
nanoplatelets [6–9] were extensively reported for the preparation of
polymer nanocomposites.
In the case of elastomers, graphite nanoplatelets are reported
to improve mechanical,[10,11] electrical,[12,13] thermal,[14,15]
barrier [16] and tribological [17] properties.
The non-covalent modification of GO by intercalation of
long-chain amphiphilic guest molecules is a highly new and effective
approach to improve the compatibility of GO for apolar rubbers.
Hence, innovative nanocomposites are obtained by melt blending
PIR and GOICs with 2HT cations ionically bonded to the graphite
oxide layers. GOIC samples with different contents of 2HT are
prepared and homogeneously dispersed in the PIR matrix. The
preparation of rubber/GOIC nanocomposites and the
characterization of their mechanical properties (see next paragraph)
were performed by the group of Prof. Maurizio Galimberti at the
Polytechnic of Milan. TEM analysis on rubber nanocomposites was
performed by Dr. Lucia Conzatti at the CNR, Institute for
Macomolecular Studies (ISMAC)-UOS Genova.
Two series of PIR-based nanocomposites (Table 4.1),
containing different amounts (up to 7 phr) of GO/2HT-H or

118
GO/2HT-L (simply reported as H and L in Table 4.1) were
prepared by melt blending (see paragraph 8.16 in Section IV). The
content of graphitic layers is different in nanocomposites containing
the same amount (phr) of either GO/2HT-H or GO/2HT-L. For
example, in the nanocomposite with 7 phr as GO/2HT, the content
of graphitic layers is about 1.3 phr and about 2.3 phr for
GO/2HT-H and GO2HT-L, respectively.
Table 4.1. Formulations of PIR-based nanocomposites with GOICs.a
Ingredient PIR/ H-1
PIR/ H-3
PIR/ H-7
PIR/ L-3
PIR/ L-7
PIR (phr) 100 100 100 100 100
GO/2HT-H (phr) 1 3 7 0 0
GO/2HT-L (phr) 0 0 0 3 7 aOther ingredients (expressed in phr): ZnO 4, stearic acid 2, 6PPD 2, sulphur 4.5 , DCBS 1.8, CTP 0.5.
The morphology and the structure of the crosslinked
nanocomposites were investigated through TEM and WAXD
analyses. TEM observations were carried out on a large number of
cryosections obtained from different zones of the sample, collecting
images at different magnifications, with the aim to evaluate the
dispersion state of nanofiller within the PIR matrix. Representative
images are shown in Fig. 4.1 for PIR/H-7 (7 phr of GO/2HT-H)
sample.

119
Fig. 4.1. Representative TEM micrographs of PIR/H-7 at different
magnifications.
In both images, taken at low (Fig. 4.1A) and high
magnification (Fig. 4.1B), groups of very small and dark particles
appear. They are likely due to metal oxides coming from the
preparation of GO, rather than to ZnO, added to nanocomposites
for promoting the crosslinking reaction, as the typical crystals of
ZnO are not visible. Nanofiller particles are frequently very close to
the dark particles or are even included in them. As a consequence,
the quantitative analysis of the GOIC dispersion by automated
image analysis techniques could lead to unreliable results. Accurate
qualitative observations, carried out on a large number of
micrographs, indicate that GO/2HT-H is evenly distributed and
highly dispersed within the PIR matrix. A high number of stacks
with sub-micrometer dimensions are observed at low magnification,
in the absence of agglomerates. Moreover, a high level of GO/2HT-
H exfoliation is revealed by micrographs taken at high
magnification: stacks, composed of less than six layers, are
isotropically dispersed in the matrix (insert of Fig. 4.1B).
Fig. 4.2 shows the X-ray diffraction patterns of
nanocomposites containing 7 phr of GO/2HT-H (trace A) or
GO/2HT-L (trace B).
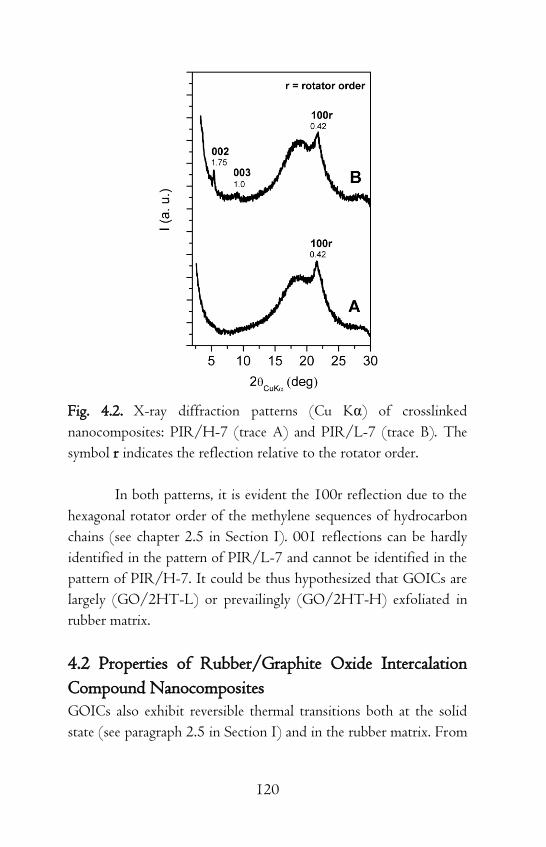
120
Fig. 4.2. X-ray diffraction patterns (Cu Kα) of crosslinked
nanocomposites: PIR/H-7 (trace A) and PIR/L-7 (trace B). The
symbol r indicates the reflection relative to the rotator order.
In both patterns, it is evident the 100r reflection due to the
hexagonal rotator order of the methylene sequences of hydrocarbon
chains (see chapter 2.5 in Section I). 001 reflections can be hardly
identified in the pattern of PIR/L-7 and cannot be identified in the
pattern of PIR/H-7. It could be thus hypothesized that GOICs are
largely (GO/2HT-L) or prevailingly (GO/2HT-H) exfoliated in
rubber matrix.
4.2 Properties of Rubber/Graphite Oxide Intercalation
Compound Nanocomposites
GOICs also exhibit reversible thermal transitions both at the solid
state (see paragraph 2.5 in Section I) and in the rubber matrix. From

121
the DSC analysis of PIR/H-7 in Fig. 4.3, the recovery and the loss
of the rotator order are clearly visible during the cooling and the
second heating scans, and confirm the results obtained by X-ray
diffraction analysis. Such findings are very interesting, in fact,
although GOICs result prevaingly exfoliated in the rubber matrix
(see Figs 4.1 and 4.2), their rotator order is preserved and, therefore,
represents a sort of filler fingerprint.
Fig. 4.3. DSC scans of rubber nanocomposite containing
GO/2HT-H.
Nominal stress–nominal strain curves obtained from tensile
tests are shown in Fig. 4.4 for nanocomposites containing
GO/2HT-H.

122
Fig. 4.4. Nominal stress–nominal strain curves obtained from tensile
tests for rubber nanocomposites containing GO/2HT-H.
The stress at a given elongation increases up to 3 phr as the
GOIC content. A further increase of the nanofiller amount (7 phr)
does not lead to a significant improvement of stress values, at any
elongation. Reinforcement under strain, with sudden increase of the
stress-strain curves slope, is evident for all the composites and it
could be attributed to the strain-induced crystallization (SIC)
phenomenon,[18] known to occur when a polymer such as PIR is
stretched. The addition of the GOIC leads to an appreciable
reduction of the strain needed to have the SIC phenomenon: from
about 550% for neat PIR to about 250% for nanocomposites with
3 or 7 phr of the GOIC. The nucleating effect of GOIC could be
hypothesized to allow an easier crystallization under strain, as
reported in the literature for nanocomposites based on NR and
OC.[19]

123
Table 4.2 shows the composites ultimate properties. The
addition of GOICs to PIR led to a reduction of the elongation at
break (εB) and to an increase of tensile strength (σB) and energy at
break, as a consequence of the reinforcement under strain above
commented.
Table 4.2. Ultimate properties of PIR-based nanocomposites with GOICs.
PIR PIR/H-1 PIR/H-3 PIR/H-7
εB (%) 678.7 592.9 551.3 555.3
σB (MPa) 12.0 11.0 13.5 15.0
Energy (J/cm3) 18.2 16.0 18.2 20.3
To give an explanation for the very similar stress–strain
behavior of nanocomposites with 3 or 7 phr of the GOIC, one
could take into account the conflicting effects of, on one side, the
higher amount of graphitic layers, that lead to a higher
reinforcement, and, on the other side, of the long hydrocarbon
chains, that lead to lower mechanical properties. Said hydrocarbon
chains could favor the slippage of the GOIC on the polymer chains,
particularly as the strain increases.
The dynamic behavior of PIR nanocomposites containing
either GO/2HT-H or GO/2HT-L was preliminarily investigated
through strain sweep tests in torsion mode, determining dynamic
shear storage, G', and loss, G'', moduli in the strain amplitude range
from 0.1% to 10%.

124
Table 4.3. Dynamic storage modulus, G', and dynamic loss modulus, G'', obtained for PIR-based nanocomposites with GOICs of Table 4.1.
PIR PIR/
H-1
PIR/
H-3
PIR/
H-7
PIR/
L-3
PIR/
L-7
G'(0.1%) (MPa) 0.42 0.51 0.58 0.55 0.51 0.57
ΔG'(0.1%-10%) (MPa) 0.06 0.08 0.07 0.07 0.04 0.13
G'' (10%) 0.018 0.018 0.017 0.022 0.014 0.021
Values of G'(0.1%), ΔG' (0.1% – 10%), and G'' (10%) are
reported in Table 4.3: they are in narrow ranges, as expected in
consideration of the low amounts of the GOIC in the
nanocomposites. The addition of GO/2HT to the PIR matrix led
to the increase of G' (0.1%). In the case of GO/2HT-H, the G'
(0.1%) value does not increase passing from 3 to 7 phr as nanofiller
content. This finding could be attributed to the large amount of the
amphiphile that acts as plasticizer. For both GO/2HT samples, an
appreciable increase of G'' and of ΔG' (0.1% – 10%) is observed
only for 7 phr as the nanofiller content.
In conclusion GOICs with different content of 2HT cations
were evenly dispersed in the PIR matrix and were found to be
prevailingly exfoliated. The PIR properties were appreciably affected
by the GOICs. Stresses at given elongations, from tensile tests, and
dynamic storage and loss moduli increased by adding a GOIC to
PIR. However, in the case of GO/2HT-H, a larger amount of the
GOIC did not lead to a substantial increase of mechanical
reinforcement: the long hydrocarbon chains seem to act as
plasticizer, compensating the reinforcing effect of the GO layers.
GOICs with lipophilic ammonium cations in the interlayer space
appear very interesting nanofillers for the preparation of polymer
nanocomposites. They can be efficiently dispersed in the polymer
matrix, achieve a high degree of exfoliation and affect, to a large

125
extent, the polymer properties.
References
[1] L. Bokobza. Polymer 2007, 48, 4907–4920.
[2] G. Sui, W. H. Zhong, X. P. Yang, S. H. Zhao. Macromol.
Mater. Eng. 2007, 292, 1020–1026.
[3] C. Nah, J. Y. Lim, R. Sengupta, B. H. Cho, A. N. Gent. Polym.
Int. 2011, 60, 42–44.
[4] G. Sui, W. H. Zhong, X. P. Yang, Y. H. Yu, S. H. Zhao.
Polym. Adv. Technol. 2008, 19, 1543–1549.
[5] A. Das, K. W. Stöckelhuber, R. Jurk, M. Grenzer, J. Fritzsche,
H. Lorenz, M. Klüppel, G. Heinrich. Polymer 2008, 49, 5276–
5283.
[6] H. Kim, A. A. Abdala, C. W. Macosko. Macromolecules 2010,
43, 6515–6530.
[7] T. Kuilla, S. Bhadra, D. Yao, N. H. Kim, S. Bose, J. H. Lee.
Progr. Polym. Sci. 2010, 35, 1350–1375.
[8] R. Sengupta, M. Bhattacharya, S. Bandyopadhyay, A. K.
Bhowmick. Progr. Polym. Sci. 2011, 36, 638–670.
[9] J. R. Potts, D. R. Dreyer, C. W. Bielawski, R. S. Ruoff. Polymer
2011, 52, 5–25.
[10] N. Yan, H. Xia, J. Wu, Y. Zhan, G. Fei, C. Chen. J. Appl.
Polym. Sci. 2013, 127, 933–941.
[11] J. Yang, M. Tian, Q. X. Jia, L. Q. Zhang, X. L. Li. J. Appl.
Polym. Sci. 2006, 102, 4007–4015.
[12] A. Malas, C. K. Das, A. Das, G. Heinrich. Mater. Design 2012,
39, 410–417.
[13] M. M. de Hernández, M. Bernal, R. Verdejo, T. A. Ezquerra,
M. A. López-Manchado. Comp. Sci. Technol. 2012, 73, 40–46.
[14] S. H. Song, H. K. Jeong, Y. G. Kang. J. Ind. Eng. Chem. 2010,
16, 1059–1065.
[15] Q. H. Mu, S. Y. Feng. Thermochim. Acta 2007, 462, 70–75.

126
[16] J. Yang, M. Tian, Q. X. Jia, J. H. Shi, L. Q. Zhang, S. H. Lim,
Z. Z. Yu, Y. W. Mai. Acta Mater. 2007, 55, 6372–6382.
[17] L. Wang, L. Zhang, M. Tian. Wear 2012, 276, 85–93.
[18] C. M. Roland, in The Science and Technology of Rubber, 3rd
ed., Eds: J. E. Mark, B. Erman, F. R. Eirich, Elsevier Academic Press,
London, UK, 2005, p. 105.
[19] J. Carretero-Gonzalez, R. Verdejo, S. Toki, B. S. Hsiao, E. P.
Giannelis, M. A. Lopez-Manchado. Macromolecules 2008, 41,
2295–2298.

127
Section III
Metathesis Reactions in Rubber
Chemistry

128

129
Chapter 5
Olefin Metathesis
5.1 Introduction
In recent years, the olefin metathesis reaction has attracted
widespread attention as a versatile carbon-carbon bond-forming
method. The name metathesis was given for the first time to this
reaction by Calderon in 1967 [1] and the etymology of the word
metathesis derives from the Greek meta (change) and thesis
(position). In chemistry, olefin metathesis is a unique transition
metal–mediated transformation that rearranges the carbon atoms of
carbon-carbon double bonds (Scheme 5.1).[2]
Scheme 5.1. Principle of olefin metathesis.
The accepted mechanism, reported in Scheme 5.2, was
originally proposed by Chauvin [3] and supported by Grubbs.[4] It
involves olefin coordination to a transition metal–alkylidene
complex, followed by a [2+2]-cycloaddition reaction that generates
a new carbon-carbon bond and affords a metallacyclobutane
intermediate, and finally a [2+2]-cycloreversion reaction, which
regenerates a metal-alkylidene and a coordinated olefin product.

130
Scheme 5.2. General mechanism for olefin metathesis.
The individual steps in the catalytic cycle of the olefin
metathesis reaction are reversible and the substrate-product
equilibrium is governed by thermodynamic control. Therefore, most
protocols rely on a driving force, such as the formation of ethylene
or the release of ring strain, to favor the formation of a single
product.[5]
The classifications of olefin metathesis reactions are
summarized in Scheme 5.3, including cross metathesis (CM), ring-
closing metathesis (RCM), ring-opening metathesis (ROM), ring
opening metathesis polymerization (ROMP), and acyclic diene
metathesis polymerization (ADMET). Through the application of
these methodologies and others, olefin metathesis has become an
increasingly important and powerful reaction that is widely used in
both organic synthesis and polymer science.[6–8]

131
Scheme 5.3. Different types of olefin metathesis reactions commonly
employed.
Catalytic metathesis was discovered in the 1950s by Karl
Ziegler, following the observations concerning the polymerization of
ethylene.[9] The most important applications of olefin metathesis in
the field of petrochemicals were developed in the 1960s with the
Phillips Triolefin Process and in the 1970s with the Shell Higher
Olefins Process.[10] The discovery that metal alkylidene complexes
could act as single-component catalysts for olefin metathesis was the
first step towards the development of this reaction in organic
synthesis. With the advent of efficient catalysts, such as Schrock’s
and Grubbs’ catalysts and their derivatives, this reaction has emerged
as a powerful tool for the formation of C-C bonds in
chemistry.[11,12]

132
There are an extensive number of catalyst systems that can
initiate an olefin metathesis reaction and most of the early work was
based on the use of ill-defined multicomponent homogeneous and
heterogeneous catalyst complexes.[13] Some of the most commonly
used systems included WCl6/Bu4Sn, WOCl4/EtAlCl2, MoO3/SiO2,
and Re2O7/Al2O3, which consist of transition metal salts combined
with main group alkylating agents, or solid supports.[2] The utility
of these catalysts was limited, since the harsh conditions and strong
Lewis acids required are incompatible with most functional groups.
The isolation of the first well-defined metal alkylidene complexes in
the 1970s spurred great advances in catalyst design, leading to
titanium [14] and molybdenum complexes,[15] that are active in
olefin metathesis reactions (Fig. 5.1). The different metals impart
different reactivities to the alkylidenes, and small adjustments in the
ligand environment can cause large changes in catalyst behavior.
Fig. 5.1. Titanium and molybdenum olefin metathesis catalysts.
5.2 Grubbs Catalysts
In the late 1980s it was found that ruthenium chlorides,
RuCl3(H2O)n, were able to catalyze ring-opening metathesis
polymerization by the metal-alkylidene mechanism.[16] During the
1990s, Grubbs and co-workers synthesized and isolated ruthenium
vinylalkylidene complex of Fig. 5.2, which allowed the development
of well defined, low oxidation, late transition state metal complexes,

133
that catalyze olefin metathesis.[17]
Fig. 5.2. The first stable and active ruthenium alkylidene metathesis
catalysts.
The remarkable functional group tolerance and stability
towards air, acids and even water, made this class of catalyst
particularly attractive for practical applications. Further development
led to the so-called first generation Grubbs catalyst (G1),[18] which
contains two phosphine ligands, two chlorides and an alkylidene
ligand. Although this catalytic system showed high levels of
reactivity, the Grubbs second generation catalyst (G2),[19] where
one of the phosphine ligands is replaced by a N-heterocyclic
alkylidene (NHC) ligand, displayed increased reactivity and stability
(Fig. 5.3).
Fig. 5.3. First and second generation Ru-based olefin metathesis
catalysts.

134
The Grubbs catalysts are based on a X2L2Ru=CHR
platform comprised of a ruthenium alkylidene, two anionic, and two
neutral ligands. The other widely used and commercially available
ruthenium complexes were reported by Hoveyda (HG1 and
HG2),[20] where the isopropoxystyrene ligand on the alkylidene
unit replaces a phosphine ligand and stabilizes the complexes in their
resting state, but readily opens to provide a coordination site in the
presence of the substrate. The four ruthenium catalysts presented in
Fig. 5.3 are all pre-catalysts, meaning that the active species are
generated under the reaction conditions. The proposed mechanism
for Grubbs catalysts, reported in Scheme 5.4, involves the
dissociation of the phosphine ligand from 16-electrons metal
complex to form a 14-electrons complex, that is able to coordinate
an olefin. For the first generation Grubbs catalysts the loss of a
phosphine ligand is relatively facile, but the re-coordination of the
phosphine ligand competes with the coorination of the olefin and is
much faster than that of the olefin. Therefore the active species is
formed more readily but carries out fewer turnovers. For the second
generation Grubbs catalysts, both the dissociation and re-association
of the phosphine are slow processes, therefore the active species can
undergo a larger number of turnovers.[21]
Scheme 5.4. Proposed mechanism for Grubbs catalysts.

135
References
[1] N. Calderon. Tetrahedron Lett. 1967, 34, 3327–3329.
[2] R. H. Grubbs. Handbook of Metathesis; Wiley-
VCH:Weinheim, Germany, 2003.
[3] P. Jean-Louis Hérisson, Y. Chauvin. Die Makromolekulare
Chemie 1971, 141, 161–176.
[4] M. Scholl, S. Ding, C. W. Lee, R. H. Grubbs. Org. Lett. 1999,
1, 953–956.
[5] K. B. Wiberg. Angew. Chem. Int. Ed. 1986, 25, 312–322.
[6] A. H. Hoveyda, A. R. Zhugralin. Nature 2007, 450, 243–251.
[7] K. J. Ivin, J. C. Mol. Olefin Metathesis and Metathesis
Polymerization; Academic Press: San Diego, CA, 1997.
[8] K. C. Nicolaou, P. G. Bulger, D. Sarlah. Angew. Chem., Int. Ed.
2005, 44, 4490–4527.
[9] K. Ziegler, Angew. Chem. 1964, 76, 545–553.
[10] J. C. Mol. J. Mol. Cat. A 2004, 213, 39–45.
[11] R. H. Grubbs. Tetrahedron 2004, 60, 7117–7140.
[12] A. Fürstner. Angew. Chem. Int. Ed. 2000, 39, 3012–3043.
[13] R. H. Grubbs, S. Chang. Tetrahedron 1998, 54, 4413–4450.
[14] F. N. Tebbe, G. W. Parshall, D. W. Ovenall. J. Am. Chem.
Soc. 1979, 101, 5074–5075.
[15] R. R. Schrock, J. S. Murdzek, G. C. Bazan, J. Robbins, M.
DiMare, M. O’Regan. J. Am. Chem. Soc. 1990, 112, 3875–3886.
[16] B. M. Novak, R. H. Grubbs. J. Am. Chem. Soc. 1988, 110,
960–961.
[17] S. T. Nguyen, L. K. Johnson, R. H. Grubbs, J. W. Ziller. J.
Am. Chem. Soc. 1992, 114, 3974–3975.
[18] P. Schwab, M. B. France, J. W. Ziller, R. H. Grubbs. Angew.
Chem. Int. Ed. 1995, 34, 2039–2041.
[19] M. Scholl, S. Ding, C. W. Lee, R. H. Grubbs. Org. Lett. 1999,
1, 953–956.
[20] S. B. Garber, J. S. Kingsbury, B. L. Gray, A. H. Hoveyda. J. Am.

136
Chem. Soc. 2000, 122, 8168–8179.
[21] M. S. Sanford, J. A. Love, R. H. Grubbs. J. Am. Chem. Soc.
2001, 123, 6543–6554.

137
Chapter 6
Rubber-Scrambling Metathesis
Reactions
6.1 Macromolecular Cross-Metathesis
The macromolecular cross-metathesis (MCM) reactions are an
interesting class of cross-metathesis reactions, that provide a
powerful synthetic methodology for chain interchange (polymer
scrambling) between olefin-containing polymers, mediated by
metathesis catalysts.
As illustrated in Scheme 6.1, when two different types of
olefin-containing polymers are treated with a suitable metathesis
catalyst, the various chains will interchange and, at equilibrium,
result in a material with a random distribution of segments coming
from both base polymers.[1]

138
Scheme 6.1. Principle of macromolecular cross-metathesis. Each
productive Ru-catalyzed metathesis reaction promotes a chain
interchange between the base polymers.
Hence, the MCM of olefin-containing polymers, prepared
by different polymerization methods, such as step-growth
polymerization, chain-growth polymerization or others, allows to
prepare random multiblock copolymers (see Scheme 6.2), hardly
obtainable with conventional polymerization methodologies.[2]

139
Scheme 6.2. Production of random multiblock copolymers by
macromolecular cross-metathesis, starting from different olefin-
containing polymers.
A plausible MCM mechanism is here proposed, according
to the Chauvin mechanism of a common cross-metathesis reaction.
In the case of MCM, chain interchange occurs between olefin-
containing polymers (see Scheme 6.3).

140
Scheme 6.3. Plausible MCM mechanism.
The initiation step involves a metal-alkylidene species (or
more precisely metal-alkylidene), the coordination of the olefin onto
the metal atom of this species, followed by the shift of the
coordinated olefin to form the metallacyclobutane intermediate, and
finally the topologically identical shift of the new coordinated olefin
in the metallocyclobutane in a direction perpendicular to the initial
olefin shift. This forms a metal-alkylidene to which the new olefin is
coordinated, then liberated.
The new metal-alkylidene contains one of the two
alkylidenes of the starting olefin and it can re-enter into catalytic
cycles of the same type as the first one, during the propagation steps.
141
In fact, depending on the orientation of the coordinated olefin, the
new catalytic cycle can give different metallacyclobutanes, some of
which leading to productive metathesis steps and the other one
leading to degenerative metathesis steps, because the coordination of
internal double bonds to the metal-alkylidene species always
provides a productive step, while the coordination of a terminal
olefin to a Cl2LRu=CH2 species always provides a degenerative step.
Very few examples of MCM are reported in the literature,
in particular Wagner et al. prepared polycarbonate/polyethylene
random block copolymers by MCM, starting from polycarbonate
and polyethylene both with random backbone unsaturation.[3]
Otsuka et al. reported the MCM of 1,4-polybutadiene with an
olefin-containing polyester,[2] while Guan et al. demonstrated the
efficiency of MCM in making cross-linked and malleable
polybutadiene.[1] The great interest for MCM reactions is also
testified by recent patents.[4,5]
In this contest rubber-scrambling metathesis reactions by
MCM of high-cis polydienes, such as 1,4-cis-polybutadiene (PBR)
and 1,4-cis-polyisoprene (PIR) were deeply investigated and
discussed in the next paragraphs. High cis-1,4 PBR and PIR are
immiscible and miscibility is observed only when PBR has a high
vinyl-1,2 content.[6] The prepared random multiblock PBR-PIR
copolymers could have a potential application as compatibilizers for
PBR-PIR blends.
6.2 Multiblock Copolymers of High-cis Polybutadiene
and Polyisoprene by Macromolecular Cross-metathesis
The stereoselective polymerization of conjugated dienes, namely 1,3-
butadiene and isoprene, is a subject of both scientific and industrial
interest.[7–9]
High trans-1,4 copolymers of butadiene and isoprene are
obtained by vanadium,[10] anion,[11] alfin,[12] or supported

142
titanium [13] catalyst systems.
High cis-1,4 polydienes are important materials used,
mostly, for tires manufacturing and catalytic systems based on
lanthanides, especially neodymium, have attracted a great deal of
attention for the homo- and copolymerization of conjugated dienes,
due to their high catalytic activity and high cis -1,4 selectivity.[14–
18]
Due to the high oxophilicity of their metal centers, the main
drawback of the above mentioned catalyst systems is their high
sensitivity to oxygen and water or to the presence of polar functional
groups on the reacting substrates.
Ru-based metathesis catalysts, instead, combine excellent
activity with broad functional group tolerance and thermal
stability.[19] Moreover, the most interesting aspect of the MCM
catalyzed by first generation Ru-based catalysts is that they allow to
prepare random multiblock PBR-PIR copolymers, hardly obtainable
with the conventional methods, starting directly from the high
molecular weight homopolymers.[2,3]
The results presented in this paragraph deal with the
preparation and the characterization of high-cis random multiblock
PBR-PIR copolymers by MCM with G1 and HG1.
6.2.1 Characterization of the Starting Homopolymers
First of all, PBR and PIR homopolymers were characterized and the
results are reported below. Carbons and units, observed in 13C-
NMR spectra of PBR (see Fig. 6.1A–C) and PIR (see Fig. 6.2A–
C), are labelled according to Scheme 6.4. Main peaks in 13C-NMR
spectra were attributed according to the work of Matsuzaki et
al.[20]

143
Scheme 6.4. Butadiene and isoprene units observed in 13C-NMR
spectra of PBR and PIR reported in Figs 6.1A–C and 6.2A–C.

144
Fig. 6.1. 13C-NMR spectra (100 MHz, in CDCl3, TMS scale) of
PBR: (A) entire spectrum, (B) saturated and (C) olefinic carbon
regions.
PBR 13C NMR analysis (100 MHz, CDCl3, TMS scale):
δ/ppm 27.3 (1,4; BC), 32.5 (1,4; BT), 34.2 (1; BV), 43.6 (2; BV),

145
114.3 (4; BV), 129.5 (2,3; BC), 129.9 (2,3; BT), 142.4 (3; BV).

146
Fig. 6.2. 13C-NMR spectra (100 MHz, in CDCl3, TMS scale) of
PIR: (A) entire spectrum, (B) saturated and (C) olefinic carbon
regions.
PIR 13C NMR analysis (100 MHz, CDCl3, TMS scale):
δ/ppm 15.8 (5; IT), 23.3 (5; IC), 26.3 (4; IC), 28.3 (4; IT), 32.1 (1;
IC), 39.9 (1; IT), 124.9 (3; IC), 135.1 (2; IC).
On the basis of the 13C-NMR analysis of homopolymers, a
high content of 1,4-cis units, Bc = 97 %mol. (BT = 2 %mol.) and Ic
= 94.5 %mol. (IT = 5.5 %mol.), respectively and a content of 1,2
vinyl butadiene units, BV = 1 %mol., have been evaluated.
The DSC heating scans of PBR and PIR are shown in Fig.
6.3. The glass transition temperatures of PBR and PIR were
observed at -109 °C and -65 °C, respectively. A melting point due
to the melting of the crystalline part in PBR was observed at -8 °C
(melting enthalpy ΔHm = 15 J/g).
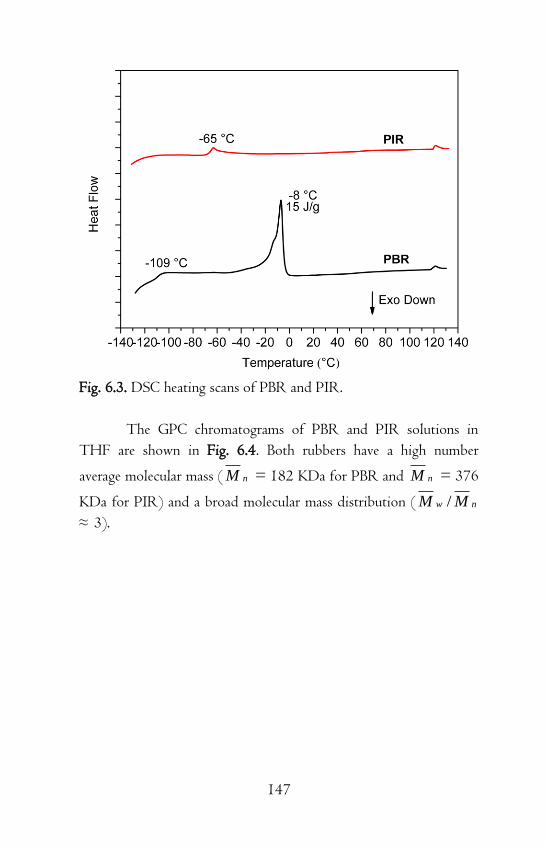
147
Fig. 6.3. DSC heating scans of PBR and PIR.
The GPC chromatograms of PBR and PIR solutions in
THF are shown in Fig. 6.4. Both rubbers have a high number
average molecular mass ( nM = 182 KDa for PBR and nM = 376
KDa for PIR) and a broad molecular mass distribution ( nw MM /
≈ 3).

148
Fig. 6.4. GPC chromatograms of PBR and PIR solutions in THF.
6.2.2 Characterization of the PBR-PIR Copolymers
Grubbs and Hoveyda-Grubbs first generation catalysts, G1 and
HG1 in Fig. 5.3, were found to promote the polymer-scrambling
reaction by MCM of PBR and PIR, providing, preferentially,
random PBR-PIR multiblock copolymers with high yields (for the
experimental procedure see paragraph 8.18 in Section IV). The
results of the characterization of PBR-PIR scrambled rubbers,
obtained by MCM in the presence of G1, are reported in the
following.
Tests were also performed on each homopolymer in
presence of G1 and it was verified that an appreciable degradation
occurred only for PBR after 3h (from GPC measurements).
The DSC heating scans of PBR-PIR 50:50 (%wt.) blend
and PBR-PIR scrambled rubbers at different times are shown in Fig.
6.5. In the case of PBR–PIR simple blend, the melting point of the

149
crystalline part in PBR (-8 °C; ΔHm = 15 J/g) and the Tgs of PBR
(-109 °C) and PIR (-65 °C) were observed, indicating a biphasic
mixture. After 1h, the melting endothermic peak of the PBR
crystallites strongly decreased and completely disappeared after 3h,
suggesting that the length of the main chain of PBR became shorter
than that of PBR before the reaction, and that the crystallite size of
PBR drastically decreased in the hybrid polymer. Additionally, as the
reaction proceeded from 1h to 3h, the glass transition temperatures
of PBR and PIR gradually approached the single Tg value of -87 °C,
between the Tgs of each homopolymer. These results indicate that
the polymer-scrambling reaction occurred to give a monophasic
random multiblock copolymer. DSC heating scans of PBR-PIR
scrambled rubbers at 8h and 24h remained substantially unaltered
and similar to the result at 3h.
Fig. 6.5. DSC heating scans of PBR-PIR 50:50 (%wt.) blend and
PBR-PIR scrambled rubbers prepared by MCM in presence of G1
at different times.
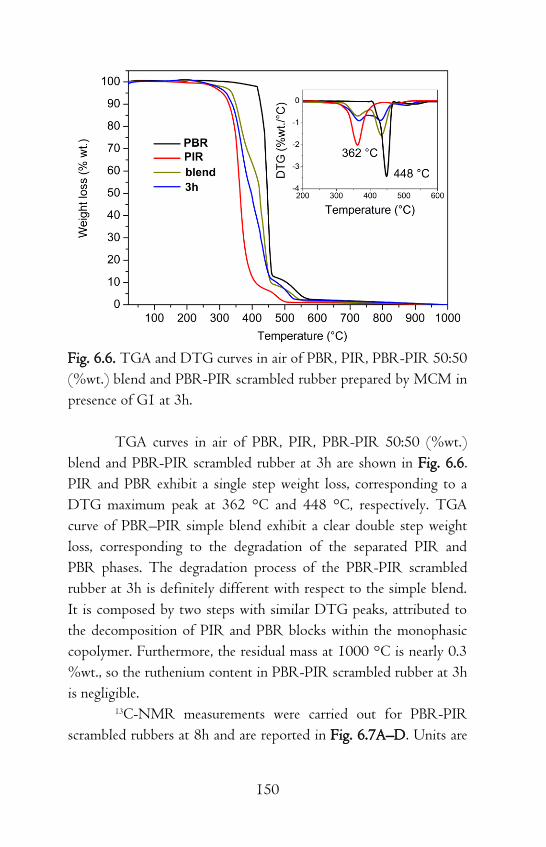
150
Fig. 6.6. TGA and DTG curves in air of PBR, PIR, PBR-PIR 50:50
(%wt.) blend and PBR-PIR scrambled rubber prepared by MCM in
presence of G1 at 3h.
TGA curves in air of PBR, PIR, PBR-PIR 50:50 (%wt.)
blend and PBR-PIR scrambled rubber at 3h are shown in Fig. 6.6.
PIR and PBR exhibit a single step weight loss, corresponding to a
DTG maximum peak at 362 °C and 448 °C, respectively. TGA
curve of PBR–PIR simple blend exhibit a clear double step weight
loss, corresponding to the degradation of the separated PIR and
PBR phases. The degradation process of the PBR-PIR scrambled
rubber at 3h is definitely different with respect to the simple blend.
It is composed by two steps with similar DTG peaks, attributed to
the decomposition of PIR and PBR blocks within the monophasic
copolymer. Furthermore, the residual mass at 1000 °C is nearly 0.3
%wt., so the ruthenium content in PBR-PIR scrambled rubber at 3h
is negligible. 13C-NMR measurements were carried out for PBR-PIR
scrambled rubbers at 8h and are reported in Fig. 6.7A–D. Units are
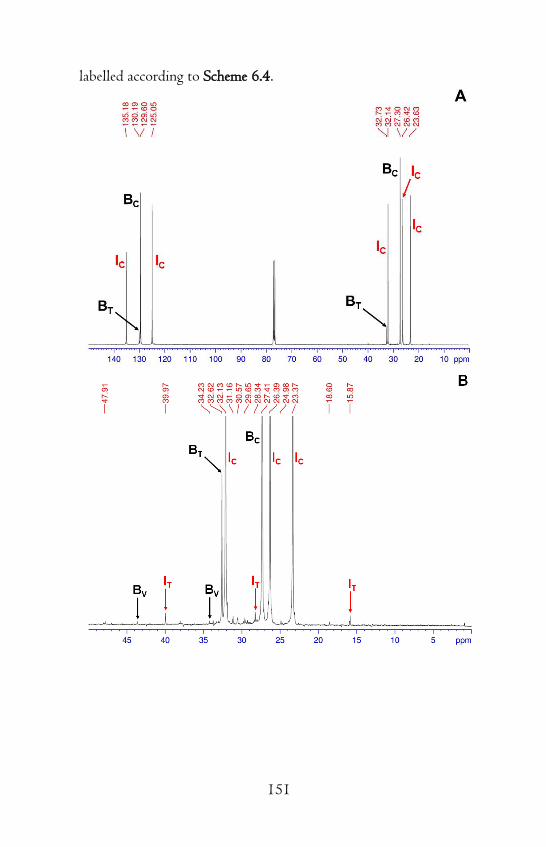
151
labelled according to Scheme 6.4.

152
Fig. 6.7. 13C-NMR spectra (100 MHz, in CDCl3, TMS scale) of
PBR–PIR scrambled rubber prepared by MCM in presence of G1 at
8h: (A) entire spectrum, (B) saturated and (C, D) olefinic carbon
regions.
On the basis of the 13C-NMR analysis of PBR-PIR

153
scrambled rubbers at 8h, a composition I/B = 60:40 (%mol.), with
a high content of 1,4-cis units, Bc = 35.8 %mol. (BT = 3.7 %mol.)
and Ic = 59.4 %mol. (IT = 0.6 %mol.), respectively and a modest
content of 1,2 vinyl butadiene units, BV = 0.5 %mol., have been
evaluated.
Scheme 6.5. Schematic representation of the observed 1,4-cis
butadiene-isoprene heterosquences indicated in Fig. 6.7D.
The observed 1,4-cis butadiene-isoprene heterosquences are
indicated in Fig. 6.7D and schematically represented in Scheme 6.5.
The signals relative to the BC and IC homosequences are at 129.5
ppm and 135.1 ppm, respectively and both differ of 0.3-0.4 ppm
with respect to the signals relative to the carbon in δ position at
129.9 ppm and 134.9 ppm, respectively. The signal at 129.3 ppm
was attributed to BC-BT homosequences (see Fig. 6.7D).
The GPC chromatograms of solutions in THF of PBR-PIR
50:50 (%wt.) mixture and of PBR-PIR scrambled rubbers at
different times are shown in Fig. 6.8. Bimodal profiles are obtained
at each time, in particular a high molecular weight fraction at 23 min
and a low molecular weight fraction at 34 min are observed. The
amount of the low molecular weight fraction is enhanced after 24h,
indicating that, as the metathesis reaction proceeded for long times,

154
degenerative steps became predominant.
Fig. 6.8. GPC chromatograms of solutions in THF of PBR-PIR
50:50 (%wt.) mixture and PBR-PIR scrambled rubbers prepared by
MCM in the presence of G1 at different times.
6.2.3 Extraction of PBR-PIR Copolymers with Solvent
In order to separate the high molecular weight fraction, the PBR-
PIR scrambled rubbers were treated in a Kumagawa extractor and
ethyl acetate was allowed to reflux for 12 hours to remove the
soluble low molecular weight components.
The GPC chromatograms of solutions in THF of PBR-PIR
scrambled rubber at 3h and of the insoluble residue and the soluble
extract after extraction in ethyl acetate for 12h are shown in Fig. 6.9.
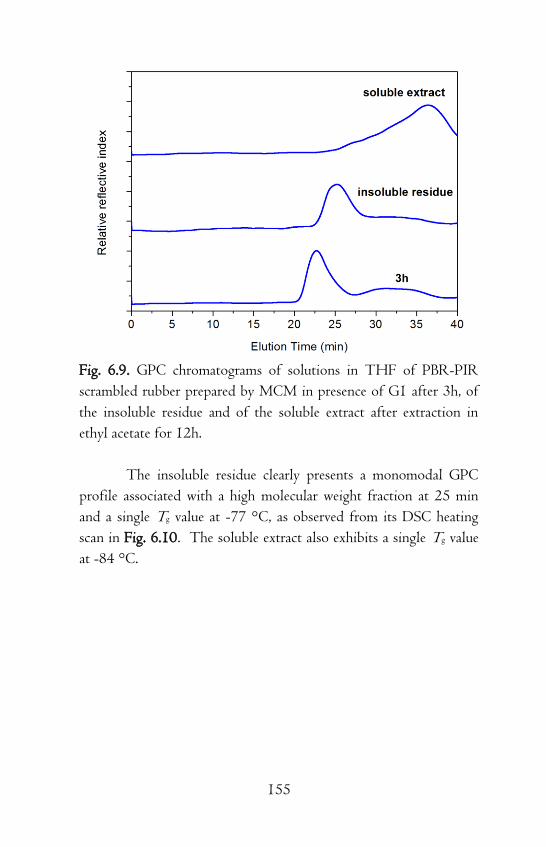
155
Fig. 6.9. GPC chromatograms of solutions in THF of PBR-PIR
scrambled rubber prepared by MCM in presence of G1 after 3h, of
the insoluble residue and of the soluble extract after extraction in
ethyl acetate for 12h.
The insoluble residue clearly presents a monomodal GPC
profile associated with a high molecular weight fraction at 25 min
and a single Tg value at -77 °C, as observed from its DSC heating
scan in Fig. 6.10. The soluble extract also exhibits a single Tg value
at -84 °C.

156
Fig. 6.10. DSC heating scans of PBR-PIR scrambled rubber
prepared by MCM in presence of G1 after 3h, of the insoluble
residue and of the soluble extract after extraction in ethyl acetate for
12h.
Olefinic carbon regions of the 13C-NMR spectra of the
insoluble residue (Fig. 6.11A) and of the soluble extract (Fig.
6.11B) after extraction in ethyl acetate for 12h of PBR-PIR
scrambled rubber, prepared by MCM in the presence of G1 at 3h.
The presence of long PBR and PIR homosequences at 124.8 ppm
(IC), 129.2 ppm (BC–BT), 129.4 ppm (BC), 129.9 ppm (BT), 135
ppm (IC) together with signals of junctions of 1,4-cis butadiene-
isoprene units at 129.8 ppm and 134.7 ppm are observed for both
the insoluble residue and the soluble extract. These results indicate
that, during the metathesis reaction in the presence of G1, high and
low molecular weight fractions of PBR-PIR scrambled rubber are
obtained. These fractions essentially differ for the content of IC
units.

157
Fig. 6.11. 13C-NMR spectra (100 MHz, in CDCl3, TMS scale) in
the olefinic carbon regions of (A) insoluble residue and (B) soluble
extract, after extraction in ethyl acetate for 12h of PBR-PIR
scrambled rubber, prepared by MCM in the presence of G1 at 3h.
158
High-cis random multiblock PBR-PIR copolymers were
successfully prepared by MCM with first generation Grubbs and
Hoveyda-Grubbs catalysts in dry hexane. From the viewpoint of
both science and technology, the methodology shown here has a
high content of innovation, infact it allows to prepare novel rubber
materials, starting directly from the suitable commercial rubbers.
6.3 Metathetic Degradation of Rubbers
The metathetic degradation of polydienes was extensively
investigated in the literature. Early pioneering studies by Alimuniar
et al. [21] and Wagener et al. [22] on the ethenolysis of
polyisoprenes noted the formation of ill-defined mixtures of
partially-depolymerized rubber using tungsten-based olefin
metathesis catalysts. Plenio and Wolf [23] reported the ethenolysis
of natural rubber with second generation Grubbs catalysts, while
several studies were conducted on the degradation of the natural
rubber in presence of a second generation Grubbs catalysts and of a
chain transfer agent, like cis-but-2-ene-1,4-diacetate [24] and
terpenes, such as d-limonene [25] and β-pinene.[26] The
degradation of polybutadiene by ADMET [27] and metathetic [28]
depolymerizations, as well as the degradation of copolymers
containing saturated and unsaturated units [29–32] were also
reported.
In this contest, Grubbs and Hoveyda-Grubbs second
generation catalysts, G2 and HG2 in Fig. 5.3, were found to
preferentially degradate PBR-PIR mixtures (for the experimental
procedure see paragraph 8.19 in Section IV). The results of the
characterization of the metathesis products, obtained in the presence
of G2, are reported in the following.
6.3.1 Degradation of Homopolymers
Degradation tests were first performed on each homopolymer in

159
presence of G2 and the GPC chromatograms of solutions in THF
of the metathesis products at different times are shown in Figs 6.12
and 6.13. In both cases, as the metathesis proceeded, the maxima of
the GPC profiles shifted to higher elution times, particularly in the
case of PBR (see Fig. 6.12), indicating a substantial reduction of the
molecular masses ( nM = 10 KDa for PBR and nM = 15 KDa for
PIR at 24 h). These results indicate that the kinetics of degradation
of PBR in presence of G2 is much faster than in the case of PIR.
Fig. 6.12. GPC chromatograms of solutions in THF of PBR and the
metathesis products, obtained in presence of G2, at different times.

160
Fig. 6.13. GPC chromatograms of solutions in THF of PIR and the
metathesis products, obtained in presence of G2, at different times.
6.3.2 Degradation of PBR-PIR Mixtures
A remarkable reduction of the molecular masses of the metathesis
products, obtained from the PBR-PIR 50:50 (%wt.) mixture in
presence of G2, is clearly noticeable from the GPC chromatograms
at different times presented in Fig. 6.14. In particular, starting from
a mixture of high molecular weight polymers ( nM = 182 KDa for
PBR and nM = 376 KDa for PIR, see also Fig. 6.4), oligomers
with a strongly reduced molecular mass are obtained (the metathesis
product at 24 h exhibits nM = 9 KDa).

161
Fig. 6.14. GPC chromatograms of solutions in THF of PBR-PIR
50:50 (%wt.) mixture and of the metathesis products, obtained in
the presence of G2, at different times.
A single value of Tg = -72 °C, close to the Tg value of PIR
(-65 °C), is observed, at each reaction time, from the DSC heating
scans of the metathesis products, obtained from the PBR-PIR 50:50
(%wt.) mixture in presence of G2 (see Fig. 6.15).

162
Fig. 6.15. DSC heating scans of PBR-PIR 50:50 (%wt.) blend and
of the metathesis products, obtained in presence of G2, at different
times.
A content of butadiene units of 14 %mol. was evaluated
from the 13C-NMR spectra of the PBR-PIR 50:50 (%wt.) mixture
after 30 min of metathesis reaction with G2 in Fig. 6.16A–B,
indicating that a considerable degradation of PBR occurs at
relatively short times.

163
Fig. 6.16. 13C-NMR spectra (100 MHz, in CDCl3, TMS scale) of
PBR-PIR 50:50 (%wt.) mixture after 30 min of metathesis reaction
with G2: (A) saturated and (B) olefinic carbon regions.
164
Hence, the use of second generation Grubbs and Hoveyda-
Grubbs catalysts was found to be detrimental for the obtainment of
random multiblock copolymers of PBR and PIR by MCM, in fact,
starting from mixtures of high molecular weight polymers, low
molecular weight oligomers are obtained, as a consequence of
metathetic degradative processes.
However, the importance of the metathetic degradation in
rubber chemistry could be very remarkable, when depolymerization
processes of high molecular weight rubbers are desidered, i. e.
degradation of rubber parts of end-of-life tires.
References
[1] Y. X. Lu, F. Tournilhac, L. Leibler, Z. Guan. J. Am. Chem. Soc.
2012, 134, 8424–8427.
[2] H. Otsuka, T. Muta, M. Sakada, T. Maeda, A. Takahara. Chem.
Commun. 2009, 1073–1075.
[3] N. L. Wagner, F. J. Timmers, D. J. Arriola, G. Jueptner, B. G.
Landes. Macromol. Rapid. Commun. 2008, 29, 1438–1443.
[4] D. J. Arriola et al. US 8048961 B2 Nov. 1, 2011.
[5] J. R. Hagadorn et al. US 0245290 A1 Sep. 27, 2012.
[6] J. L. White. Rubber Processing: Technology, Materials,
Principles Hanser/Gardner Publications, Inc., 1995.
[7] S. K. H. Thiele, D. R. Wilson, J. Macromol. Sci. Part C: Polym.
Rev. 2003, 43, 581–628.
[8] G. Ricci, A. Sommazzi, F. Masi, M. Ricci, A. Boglia, G. Leone.
Coord. Chem. Rev. 2010, 254, 661–676.
[9] A. Fischbach, R. Anwander. Adv. Polym. Sci. 2006, 204, 155–
281.
[10] G. Ricci, L. Zetta, E. Alberti, T. Motta, M. Canetti, F. Bertini.
J. Polym. Sci. Part A 2007, 45, 4635–4646.
[11] I. G. Hargis et al. US 4616065, 1986.
[12] R. G. Newberg, H. Greenberg, T. Sato. Rubb. Chem. Technol.

165
1970, 43, 333–355.
[13] A. He, B. Huang, S. Jiao, Y. Hu. J. Appl. Polym. Sci. 2003, 89,
1800–1807.
[14] Z. Shen, J. Ouyang, F. Wang, Z. Hu, F. Yu, B. Qian. J. Polym.
Sci. Polym. Chem. Ed. 1980, 18, 3345–3357.
[15] L. Friebe, O. Nuyken, W. Obrecht. Adv. Polym. Sci. 2006,
204, 1–154.
[16] L. Porri, G. Ricci, N. Shubin. Macromol. Symp. 1998, 128,
53–61.
[17] H. L. Hsieh, H. C. Yeh. Rubb. Chem. Technol. 1985, 58,
117–145.
[18] Y. Hu, W. Dong, T. Masuda. Macromol. Chem. Phys. 2013,
DOI:10.1002/macp.201300383.
[19] T. M. Trnka, R. H. Grubbs. Acc. Chem. Res. 2001, 34, 18–
29.
[20] K. Matsuzaki, T. Uryu, T. Asakura. NMR Spectroscopy and
Stereoregularity of Polymers. Japan Scientific Societies Press, pp.
41–50, 1996.
[21] A. Alimuniar, M. A. Yarmo, M. Z. A. Rahman, S. Kohjiya, Y.
Ikeda, S. Yamashita. Polym. Bull. 1990, 23, 119–126.
[22] K. B. Wagener, R. D. Puts, D. K. Smith. Makromol. Chem.
Rapid Commun. 1991, 12, 419–425.
[23] S. Wolf, H. Plenio. Green Chem. 2011, 13, 2008–2012.
[24] S. S. Solanky, I. Campistron, A. Laguerre, J. F. Pilard.
Macromol. Chem. Phys. 2005, 206, 1057–1063.
[25] A. Martínez, S. Gutiérrez, M. A. Tlenkopatchev. Molecules
2012, 17, 6001–6010.
[26] S. Gutiérrez, M. A. Tlenkopatchev. Polym. Bull. 2011, 66,
1029–1038.
[27] J. Marmo, K. Wagener. Macromolecules 1995, 28, 2602–
2606.
[28] M. Chasmawala, T. C. Chung. Macromolecules 1995, 28,
1333–1339.
166
[29] P. Thanki, D. Reyx, I. Campistron, A. Laguerre, R. P. Singh.
Eur. Polym. J. 2004, 40, 2611–2616.
[30] K. L. Sedransk, F. C. Kaminski, L. R. Hutchings, G. D.
Moggridge. Polym. Degrad. Stab. 2011, 96, 1074–1080.
[31] S. W. Craig, J. A. Manzer, E. B. Coughlin. Macromolecules
2001, 34, 7929–7931.
[32] F. Lucas, F. Peruch, S. Carlotti, A. Deffieux, A. Leblanc, C.
Boisson. Polymer 2008, 49, 4935–4941.
167
Chapter 7
Grafting of Rubbers to Graphene Oxide
Layers through Grubbs and Piers
Catalyst-Functionalized Graphite Oxides
7.1 Covalent and Non-Covalent Functionalization of
Graphene Oxide Layers with Grubbs and Piers Catalysts
The functionalization of graphene oxide layers using covalent or
non-covalent approaches improves the dispersion of graphene oxide
both in organic solvents and in bulk hydrophobic polymers, such as
rubbers.[1]
The non-covalent functionalization of MMT and GO by
intercalation of long-chain ammonium salts in their interlayer spaces
(see paragraphs 1.2 and 2.5 in Section I) was already discussed (see
Section II) to compatibilize such fillers with the rubber matrix.
A good filler dispersion within the polymer matrix generates
an extended polymer-filler interface and strong interfacial
interactions improve the stress transfer,[2] so the grafting of
graphene oxide layers functionalized with metathesis catalysts to
rubber chains is expected to combine the mechanical reinforcement
with the improved dispersibility.
Grubbs catalyst-functionalized graphene oxide layers were
prepared adapting the procedure reported by Longo et al. [3] for the
covalent functionalization of multi-wall carbon nanotubes with
Grubbs catalysts.
The covalent functionalization pathway of GO with G2 is
showed in Scheme 7.1 (for experimental details see paragraph 8.20

168
in Section IV). Carboxylic groups on GO sheets were first reacted
with thionyl chloride, resulting in the corresponding acid chloride
(GO-Cl), esterified with ethylene glycol (GO-Gly) and then reacted
with 5-acid chloride 2-norbornene (GO-Nor). The metathesis
reaction between GO-Nor and G2 produced Grubbs catalyst-
functionalized graphene oxide layers (GO-G2).
Scheme 7.1. Covalent functionalization pathway of graphite oxide
with G2.
The whole functionalization process was followed by
acquiring the FTIR spectra, presented in Fig. 7.1, of each
intermediate product, from L-GO, used as the starting material, to
the covalently functionalized graphene oxide layers with G2.

169
Fig. 7.1. FTIR spectra of: L-GO, the intermediate products of each
functionalization step (GO-Cl, GO-Gly and GO-Nor) and the
covalent functionalized graphene oxide layers with G2 (GO-G2).
The absorption peaks at 1090 cm-1 and 790 cm-1 (C-Cl
stretchings) and the carbonyl peak at 1720 cm-1 confirm the
formation of -COCl groups on graphene oxide layers. The shift of
the position of the absorption band of the carbonyl groups at 1743
cm-1 and the absorption peaks at 1260 cm-1 and 1116 cm-1 (C-O-C
stretching) confirm the esterification reactions with ethylene glycol
and with 5-acid chloride 2-norbornene. Similar absorption peaks are
present in the FTIR spectrum of GO-G2.
To give further insights regarding the structure of the
covalently functionalized products, X-ray diffraction analysis was
performed and the results are reported in Fig. 7.2.

170
Fig. 7.2. X-ray diffraction patterns (Cu Kα) of: L-GO, the
intermediate products of each functionalization step (GO-Cl, GO-
Gly and GO-Nor) and the covalent functionalized graphene oxide
sheets with G2 (GO-G2).
The treatment of L-GO with thionyl chloride causes the
complete exfoliation of GO particles, in fact the pattern of GO-Cl
in Fig. 7.2 shows a very broad halo, centered at d = 0.37 nm with a
correlation length of about 1 nm.
The reaction of GO-Cl with ethylene glycol, beside the
formation of ester bonds (see FTIR spectra in Fig. 7.1), generates an
ordered intercalate crystalline phase with periodicity d = 0.76 nm
and a correlation length of about 16 nm.
Further treatments of GO-Gly with 5-acid chloride 2-
norbornene (GO-Nor) and G2 (GO-G2), disturb the out-of-plane
order of the intercalate crystalline phase (D┴ = 8 nm in GO-G2),
while maintaining about the same periodicity. This results are
consistent with an intercalated structure with ethylene glycol,
covalently functionalized at the edges and on the surfaces of the
crystalline domains with G2.
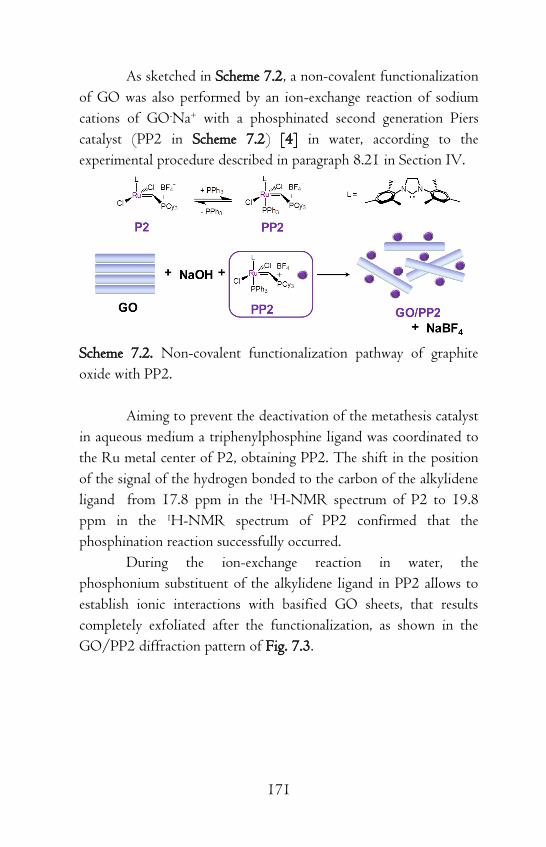
171
As sketched in Scheme 7.2, a non-covalent functionalization
of GO was also performed by an ion-exchange reaction of sodium
cations of GO-Na+ with a phosphinated second generation Piers
catalyst (PP2 in Scheme 7.2) [4] in water, according to the
experimental procedure described in paragraph 8.21 in Section IV.
Scheme 7.2. Non-covalent functionalization pathway of graphite
oxide with PP2.
Aiming to prevent the deactivation of the metathesis catalyst
in aqueous medium a triphenylphosphine ligand was coordinated to
the Ru metal center of P2, obtaining PP2. The shift in the position
of the signal of the hydrogen bonded to the carbon of the alkylidene
ligand from 17.8 ppm in the 1H-NMR spectrum of P2 to 19.8
ppm in the 1H-NMR spectrum of PP2 confirmed that the
phosphination reaction successfully occurred.
During the ion-exchange reaction in water, the
phosphonium substituent of the alkylidene ligand in PP2 allows to
establish ionic interactions with basified GO sheets, that results
completely exfoliated after the functionalization, as shown in the
GO/PP2 diffraction pattern of Fig. 7.3.

172
Fig. 7.3. X-ray diffraction patterns (Cu Kα) of: L-GO and the non-
covalent functionalized graphene oxide sheets with PP2 (GO/PP2).
The TGA curves in air of GO-G2 and GO/PP2, compared
with L-GO in Fig. 7.4, show a residual mass of 4.6 %wt. and 12.4
%wt. at 1000 °C, attributed to the formation of RuO2. The amount
of bonded ruthenium on GO-G2 and GO/PP2 was 3.5 %wt. and
9.4 %wt., as evaluated from simple stoichiometry calculations.
Fig. 7.4. TGA curves in air of L-GO, GO-G2 and GO/PP2.

173
The results in Figs 7.1–7.4 confirm that both, the covalent
and the non-covalent functionalization of GO were achieved.
7.2 Grafting Reactions of Polyisoprene to Graphene
Oxide Layers
Polymer nanocomposites containing graphene oxide or reduced
graphene oxide layers as fillers are commonly prepared by solution
blending,[5–8] melt blending [9,10] and in situ
polymerization.[11,12]
However, a very limited literature has investigated rubber
nanocomposites filled with graphene oxide or reduced graphene
oxide layers, prevailingly prepared by solution blending [13] or latex
blending.[14–17]
It is widely acknowledged in the literature that there are two
main methodologies for the covalent attachment of polymers to the
surface of fillers, which are defined as “grafting to” and “grafting
from” methods. The former relies on the covalent bond formation
between the functional groups of a preformed polymer and the
functionalities on the filler surface. The “grafting from” method,
instead, is based on the covalent immobilization of the polymer
precursors on the surface of the filler and subsequent propagation of
the polymerization in the presence of monomeric species.[18]
In this paragraph, novel rubber nanocomposites, based on
polyisoprene grafted to graphene oxide layers (PIR/GO), prepared
by reacting PIR with the previously described GO-G2 and GO/PP2
(see the experimental procedure described in paragraph 8.22 in
Section IV), are presented.
Plausible grafting mechanisms, according to the Chauvin
mechanism of a common cross-metathesis reaction, are proposed in
Schemes 7.3 and 7.4, for GO-G2 and GO/PP2 with a generic
olefin-containing polymer.

174
Scheme 7.3. Plausible grafting mechanism of an olefin-containing
polymer with graphene oxide sheets in presence of GO-G2.

175
Scheme 7.4. Plausible grafting mechanism of an olefin-containing
polymer with graphene oxide sheets in presence of GO/PP2.
After each reaction, the products were treated in a
Kumagawa extractor and hexane was allowed to reflux for 12 hours
to remove the free (soluble fraction) from the grafted polymer
fraction (insoluble residue). The yields of the dried insoluble
residues compared with the as prepared grafted rubbers were higher
than 95 %wt. and 97 %wt. for PIR/GO composites obtained from
GO-G2 and GO/PP2, respectively.
In the X-ray diffraction patterns of PIR/GO samples,
obtained from GO-G2 and GO/PP2 in Fig. 7.5, the reflections of
GO cannot be identified, suggesting that the graphene oxide layers
are exfoliated in the polymer matrix, as result of the grafting process.

176
Fig. 7.5. X-ray diffraction patterns (Cu Kα) of: PIR and of PIR
grafted to GO sheets (PIR/GO) obtained from PIR dispersions in
hexane with 3% wt. of GO-G2 and GO/PP2, respectively.
As shown by the TGA curves in air of PIR/GO samples,
obtained from GO-G2 and GO/PP2 in Fig. 7.6, the amount of
residual RuO2 at 1000 °C is negligible.
Fig. 7.6. TGA curves in air of: PIR and of PIR grafted to GO sheets
(PIR/GO) obtained from PIR dispersions in hexane with 3%wt. of
GO-G2 and GO/PP2, respectively.

177
Fig. 7.7. (A) Logarithm of the tensile storage modulus, logE' and
(B) loss tangent (tanδ) from -90 °C to 20 °C of: PIR and of PIR
grafted to GO sheets (PIR/GO) obtained from PIR dispersions in
hexane with 3% wt. of GO-G2 and GO/PP2, respectively. The
spectra were recorded in the tensile mode.

178
Dynamic-mechanical analysis (DMA) of PIR/GO
nanocomposites, compared with PIR, are shown in Fig. 7.7.
PIR/GO nanocomposites show large increases in tensile storage
moduli (logE') with respect to the neat PIR (Fig. 7.7A), particularly
at 20 °C.
The peak temperatures of tanδ (Fig. 7.7B) were associated
with the glass transition temperatures, in particular slight shifts of 2-
3 °C were observed for PIR/GO nanocomposites compared with
neat PIR. Moreover, PIR/GO nanocomposites show decreased tanδ
peak height and breadth, suggesting strong interfacial bonding
between the rubber matrix and graphene oxide layers. These results
indicate the restriction of the motion of PIR chains due to the
grafting reactions.
In summary, novel rubber nanocomposites, composed by
PIR grafted to graphene oxide sheets, were prepared by taking
advantage from the cross-metathesis reactions of PIR and
functionalized GO samples with Grubbs and Piers catalysts.
Hence, it was here demonstrated that olefin metathesis
represents a very powerful tool in rubber chemistry and more in
general in polymer chemistry. In fact, it allows to obtain not only
novel polymer-polymer materials, but also hybrid polymer-filler
nanocomposites with suitably functionalized fillers. In addition,
metathesis reactions are able to degradate polymers and copolymers
with unsaturated groups.
References
[1] R. Sengupta, M. Bhattacharya, S. Bandyopadhyay, A. K.
Bhowmick. Progr. Polym. Sci. 2011, 36, 638–670.
[2] J. N. Coleman, U. Khan, W.J. Blau, Y. K. Gun’ko. Carbon 2006,
44, 1624–1652.
[3] C. Costabile, F. Grisi, G. Siniscalchi, P. Longo, M. Sarno, D.

179
Sannino, C. Leone, P. Ciambelli. J. Nanosci. Nanotech. 2011, 11,
1–10.
[4] P. E. Romero, W. E. Piers, R. McDonald. Angew. Chem. Int.
Ed. 2004, 116, 6287–6291.
[5] Y. X. Xu, W. J. Hong, H. Bai, C. Li, G. Q. Shi. Carbon 2009,
47, 3538–3543.
[6] D. Y. Cai, M. Song. Nanotechnology 2009, 20, 315708.
[7] D. Y. Cai, K. Yusoh, M. Song. Nanotechnology 2009, 20,
085712.
[8] Q. Wu, Y. X. Xu, Z. Y. Yao, A. R. Liu, G. Q. Shi. ACS Nano
2010, 4, 1963–1970.
[9] H. B. Zhang, W. G. Zheng, Q. Yan, Y. Yang, J. W. Wang, Z.
H. Lu, G. Y. Ji, Z. Z. Yu. Polymer 2010, 51, 1191–1196.
[10] A. Dasari, Z. Z. Yu, Y. W. Mai. Polymer 2009, 50, 4112–
4121.
[11] A. P. Yu, P. Ramesh, M. E. Itkis, E. Bekyarova, R. C. Haddon.
J. Phys. Chem. C 2007, 111, 7565–7569.
[12] X. S. Zhou, T. B. Wu, B. J. Hu, G. Y. Yang, B. X. Han. Chem.
Commun. 2010, 46, 3663–3665.
[13] X. Bai, C. Wan, Y. Zhang, Y. Zhai. Carbon 2011, 49, 1608–
1613.
[14] Y. H. Zhan, J. K. Wu, H. S. Xia, N. Yan, G. X. Fei.
Macromol. Mater. Eng. 2011, 296, 590–602.
[15] J. S. Kim, J. H. Yun, I. Kim, S. E. Shim. J. Ind. Eng. Chem.
2011, 17, 325–330.
[16] J. R. Potts, O. Shankar, L. Du, R. S. Ruoff. Macromolecules
2012, 45, 6045−6055.
[17] J. R. Potts, O. Shankar, S. Murali, L. Dub, R. S. Ruoff.
Compos. Sci. Technol. 2013, 74, 166–172.
[18] D. Tasis, N. Tagmatarchis, A. Bianco, M. Prato. Chem. Rev.
2006, 106, 1105–1136.

180
181
Section IV
Experimental Part

182
183
Chapter 8
Materials and Preparation Procedures
8.1 Materials
Pristine sodium MMT was Dellite® HPS from Laviosa Chimica
Mineraria S.p.A., with cationic exchange capacity (CEC) equal to
128 mmol/100 g.
The ammonium salt di(hydrogenated tallow)-
dimethylammonium chloride was from Akzo Nobel, with Arquad®
HC Pastilles as the trade name. The alkyl chain distribution was as
follows (as %wt.): < C12 = 1, C14 = 4, C16 = 31, C18 = 64.
Dellite® 67G was based on MMT as inorganic silicate and
was reported in the technical data sheets to have 40 - 45 %wt. as the
organic modifier and an average dry particle size in the 7–9 µm
range.
Stearic acid and glyceryl tristearate were from Aldrich. 2-
stearamidoethyl stearate was from Abril with Abriflo 65 (Abril
Industrial Waxes Ltd) as trade name.
The syndiotactic polystyrene (sPS) used in this study was
manufactured by Dow Chemicals under the trademark Questra 101. 13C nuclear magnetic resonance characterization showed that the
content of syndiotactic triads [1] was over 98%. The mass average
molar mass obtained by gel permeation chromotography (GPC) in
trichlorobenzene at 135 °C was found to be wM = 3.2 × 10⁵ g
mol-1 with a polydispersity index nw MM / = 3.9.
The A-F graphitic samples, listed in Fig. 2.8 and Table 2.1,
are the following: A and B are graphites (trade names Timrex C -
Therm 011 / 012) from Timcal Graphite & Carbon; C is a ball-

184
milled graphite (trade name Synthetic Graphite 8427®) from Asbury
Graphite Mills Inc. D and E are coke and calcinated petroleum coke
from Asbury carbons, respectively; F is carbon black N326 obtained
from Cabot, with 30 nm as mean particle diameter of spherical
primary particles, cetyl trimethylammonium bromide (CTAB)
surface area of 85 m2/g, iodine adsorption number of 84 g/Kg and
dibutyl phthalate (DBP) adsorption number of 72 mL/100 g.
Synthetic 1,4-cis-polyisoprene was from
Nizhnekamskneftechim Export, with trade name SKI3. Synthetic
1,4-cis-polybutadiene was from EniChem, with trade name S-0129.
Ingredients for compound preparation were: ZnO (Zincol
Ossidi), stearic acid (Sogis), sulfur (Solfotecnica), N-
dicyclohexylbenzothiazol-2-sulfenamide (DCBS; Flexsys), N-(1,3-
dimethylbutyl)-N´-phenyl-1,4-benzenediamine (6PPD; Crompton),
3-octanoylthio-1-propyltriethoxysilane (NXT; Momentive) and
dicumylperoxide (DCUP; Aldrich).
Nitric acid, sulfuric acid, sodium nitrate, potassium chlorate,
potassium permanganate, hydrazine monohydrate (65 %), ascorbic
acid, sodium hydroxide, hydrochloric acid, 1,2-dichlorobenzene
(DCB), first and second generation Ru-based olefin metathesis
catalysts (G1, G2, HG1, HG2 and P2), triphenylphosphine, thionyl
chloride, dimethylformamide, triethylamine, ethylene glycol, 5-
norbornene-2-carboxylic acid, methanol, ethanol, ethyl-vinyl ether,
ethyl acetate, deuterated chloroform, deuterated dichloromethane,
hexane, tetrahydrofuran (THF), sodium, benzophenone,
dichloromethane (CH2Cl2), calcium hydride (CaH2) were purchased
from Sigma–Aldrich Company and were reagent quality. These
products were used without further purification.
Hexane and THF were distilled from
sodium/benzophenone. CH2Cl2 was dried on CaH2 and freshly
distilled before use.

185
8.2 Preparation of Organoclays
MMT was not dried prior to the synthesis of OC. The amount of
H2O in MMT was determined by TGA and it was taken into
account for comparing the values of organic content in OC,
theoretical and experimentally determined. The preparation of OCs
was performed by the group of Prof. Maurizio Galimberti at the
Polytechnic of Milan.
The solid state preparation of OCs, in absence or in
presence of polar guest molecules, such as stearic acid (SA) or 2-
stearamidoethyl stearate (SAES), was performed by the neat reaction
of MMT and 2HT in a Centrifugal ball mill S 100 at 380 rpm for
1 h, followed by rotation in a 250 mL flask in air, utilizing a
rotavapor at 100 °C. In any preparation the ammonium salt was
used in a molar amount corresponding to the CEC of the MMT,
while the polar guest substance was used in molar stechiometric
amount respect to the ammonium salt. Just as an example, 10 g of
MMT and 7.34 g of 2HT were ground in the ball milling to obtain
the MMT/2HT organoclay, while MMT/2HT/SA and
MMT/2HT/SAES organoclays were obtained by grinding the
same amounts of MMT and 2HT, using 3.64 g of SA and 7.59 g of
SAES, respectively.
8.3 Extraction of Organoclay with Ethyl Acetate
A standard procedure was adopted for the extraction of OC samples
in Fig. 1.7 with ethyl acetate. The extraction of commercial sample
Dellite® 67 G is reported as example. 3 g of Dellite® 67G were
placed in a Kumagawa extractor and ethyl acetate was allowed to
reflux for 1 hour. A small amount of OC was taken and analyzed
through TGA and WAXD analysis. The extraction was protracted
to 2, 3, 4, 5, 6 hours and, at each step, a small sample of OC was
taken and analyzed through TGA and WAXD analysis.

186
8.4 Clay Exfoliation by Supercritical CO2
Exfoliated clay samples were obtained by using a SFX 200
supercritical carbon dioxide extractor (ISCO Inc.). Organically
modified clays (typically 10 mg in a 20 mL stainless steel vessel)
were processed in scCO2 at 40 °C and 200 bar, for 16 h and 32h
under quiescent conditions, in order to promote the diffusion of the
supercritical fluid into the clay interlayer space. The system was then
rapidly depressurized to atmospheric pressure and the expansion of
the scCO2 between the layers caused the clay exfoliation. This
procedure was elaborated and performed in collaboration with Dr.
Simona Longo of the Department of Chemistry and Biology of the
University of Salerno.
8.5 Preparation of sPS/Clay Gels and Aerogels
Dispersions of the clays in DCB were obtained with both as received
and exfoliated samples. A clay dispersion was initially prepared by
adding the appropriate clay amount in 5 ml of DCB. The mixtures
were homogenized for 1 h under magnetic stirring and sonicated in a
5000 mL batch bath ultrasound (Badelin Sonorex RK 1028 H) for
1 h. The preparation of sPS/clay gels and aerogels was performed in
collaboration with Dr. Simona Longo of the Department of
Chemistry and Biology of the University of Salerno.
sPS/clay gels were prepared, in hermetically sealed test
tubes, by heating the clay dispersions above the boiling point of the
solvent until complete dissolution of the polymer and the
appearance of a transparent and homogeneous solution had
occurred. The hot solution was then cooled to room temperature,
where gelation occurred. For instance, 655 mg of sPS and 5 mL of 2
%wt. clay dispersion were mixed to obtain clay gels. The overall
amount of polymer and clay in the gels was generally fixed to 10
%wt.
Aerogels were obtained by treating sPS/clay gels with a SFX

187
200 supercritical carbon dioxide extractor (ISCO Inc.) using the
following conditions: 40 °C, 200 bar, extraction time 6 h. The
prepared s-PS/clay aerogels present a weight composition ranging
between 96/4 and 50/50. The aerogels, as prepared from gels with
an overall polymer-clay content of 10 %wt., present a porosity close
to 90 %.
For monolithic aerogels with a regular cylindrical shape, the
total porosity can be estimated from the mass/volume ratio of the
aerogel. Then, the percentage of porosity P of the aerogel samples
can be expressed as:
P = 100*[1 - (ρapp / ρpol)] (1)
where ρpol is the density of the polymer matrix and ρapp is the aerogel
apparent density calculated from the mass/volume ratio of the
monolithic aerogels.
8.6 Preparation of GO with Higher Content of
Oxygenated Groups
A 2000 mL three-neck round bottomed flask was flushed with
gaseous N2 and was then immersed into an ice bath.[2] 33 mL of
nitric acid and 67 mL of sulfuric acid were fed to the flask under
nitrogen and were then stirred obtaining a homogenous mixture.
After introducing 5 g of graphite powder under vigorous agitation,
42 g of potassium chlorate was then added very slowly, to minimize
the risk of explosion. The reaction mixturewas stirred for 120 h at
room temperature. The resulting dark green suspension was poured
into a large amount of a 5 %wt. HCl aqueous solution.
Centrifugation was then performed at 10000 rpm for 15 min using
a Hermle Z 323 K centrifuge. The isolated GO powder was washed
twice with 100 mL of a 5 %wt. HCl aqueous solution and
subsequently with deionized water. Finally, it was dried at 60 °C for

188
12 h in an oven.
8.7 Preparation of GO with Lower Content of
Oxygenated Groups
120 mL of sulfuric acid and 2.5 g of sodium nitrate were introduced
into a 2000 mL three-neck round bottomed flask immersed into an
ice bath and 5 g of graphite were added, under nitrogen, with a
magnetic stirring.[3] After obtaining a uniform dispersion of
graphite powder, 15 g of potassium permanganate were added very
slowly to minimize the risk of explosion. The reaction mixture was
thus heated to 35 °C and stirred for 24 h. The resulting dark green
slurry was first poured into a copious amount of deionized water,
and then centrifugated at 10000 rpm for 15 min with a Hermle
Z323 K centrifuge. The isolated GO powder was washed twice with
100 mL of a 5 %wt. HCl aqueous solution and subsequently with
deionized water. Finally, it was dried at 60 °C for 12 h in an oven.
8.8 Preparation of GOICs
Intercalates with 2HT were prepared in analogy with the procedure
reported by Matsuo et al. for graphite oxide intercalation
compounds with quaternary alkylammonium or alkylpyridinium
ions, containing one long hydrocarbon chain.[4] GO powders (100
mg) were dispersed in 0.05 M NaOH solution (20 mL), 2HT (420
mg; 100% CEC) aqueous solution (100 mL) was added in this
dispersion and the reaction mixture was stirred at 40 °C for 12 h.
The slurry was centrifugated at 10000 rpm for 15 min and the
precipitate was washed with deionized water and dried at 60 °C for
12 h in an oven. 280 mg of GO/2HT-L powders were obtained,
without any loss of GO.
Analogous intercalates were prepared by adding an excess of
2HT (typically 840 mg; 200% CEC) aqueous solution (100 mL).
320 mg of GO/2HT-H powders were obtained, without any loss

189
of GO.
Intercalates were also prepared by adding SAES (390 mg;
corresponding to molar ratio 2HT/SAES = 1:1) alcoholic solution
(100 mL ethanol) in the reaction mixture containing the GO
dispersion and the 2HT aqueous solution, as reported above. 430
mg of GO/2HT/SAES powders were obtained, without any loss of
GO.
More ordered intercalates were prepared by adding GTS
(640 mg; corresponding to molar ratio 2HT/GTS = 1:1) alcoholic
solution (100 mL ethanol) in the reaction mixture containing the
GO dispersion and the 2HT aqueous solution, as reported above.
440 mg of GO/2HT/GTS powders were obtained, without any
loss of GO.
8.9 Preparation of GO and GOIC films
Dispersions of GO in deionized water (5 mg/mL) and of GOIC in
a mixture of cyclohexane (5 mg/mL) were subjected to sonication in
10 L batches bath ultrasound (Badelin Sonorex RK 1028 H) for 30
min. The dispersions were cast in a Petri dish at 50 °C and ~ 30
μm thick films were obtained.
8.10 Preparation of Chemically Reduced Graphite Oxide
GO powders were chemically reduced using hydrazine monohydrate
as reducing agent.[5] 3g of GO were placed in a 4000 mL three-
neck flask and then 3000 mL of deionized water were added, till the
complete dispersion of the GO powders in water. 30 mL of
hydrazine monohydrate were added to the GO dispersion and the
mixture was allowed to react under agitation at 80 °C for 24 h. The
CRGO powders slowly precipitated as a black solid. This product
was, then, centrifugated, washed with deionized water (2x100 mL)
and finally dried at 60 °C for 12 h in an oven.
Chemical reduction of GO was also performed using

190
ascorbic acid.[6] 0.5 g of GO were placed in a 200 mL three-neck
flask and then 50 mL of deionized water were added, till the
complete dispersion of the GO powders in water. 0.5 g of ascorbic
acid were added to the GO dispersion and the mixture was allowed
to react under agitation at 100 °C for 24 h. The CRGO powders
slowly precipitated as a black solid. This product was, then,
centrifugated, washed with deionized water and finally dried at 60
°C for 12 h in an oven.
8.11 Graphite Oxide Exfoliation by Ball-Milling
GO powders were introduced in 125 mL ceramic jars (inner
diameter of 75 mm) together with stainless steel balls (10 mm in
diameter) and were dry-milled in a planetary ball mill (Retsch
GmbH 5657 Haan) for 2 h with a milling speed of 500 rpm and a
ball-to-powder mass ratio of 10 to 1.
8.12 Solvo-thermal Reduction of Graphite Oxide
Reduced graphite oxide (rGO) dispersions were obtained by adding
the appropriate GO amount in 5 mL of DCB, following by
solvothermal reduction of GO in a 5000 mL batch bath ultrasound
(Badelin Sonorex RK 1028 H) at 100 °C for 2h. This procedure
was elaborated and performed in collaboration with Dr. Simona
Longo of the Department of Chemistry and Biology of the
University of Salerno.
8.13 Preparation of sPS/rGO Gels and Aerogels
The preparation of sPS/rGO gels and aerogels was performed in
collaboration with Dr. Simona Longo of the Department of
Chemistry and Biology of the University of Salerno. sPS/rGO gels
were prepared, in hermetically sealed test tubes, by heating the rGO
dispersions above the boiling point of the solvent until complete
dissolution of the polymer and the appearance of a homogeneous
191
solution had occurred. The hot solution was then cooled to room
temperature, where gelation occurred. The overall amount of
polymer and rGO in the gels was generally fixed to 10 %wt.
Aerogels were obtained by treating sPS/rGO gels with a
SFX 200 supercritical carbon dioxide extractor (ISCO Inc.) using
the following conditions: 40 °C, 200 bar, extraction time 6 h. The
prepared sPS/rGO aerogels present a weight composition ranging
between 95/5 and 50/50. The aerogels, as prepared from gels with
an overall polymer-rGO content of 10 %wt., present a porosity
close to 90 %.
8.14 Preparation Organoclays in Rubber Medium
The preparation of OCs in rubber medium was performed by the
group of Prof. Maurizio Galimberti at the Polytechnic of Milan. A
Brabender with a 50 mL mixing chamber was used as the internal
mixer for the preparation of nanocomposites and the following
standard procedure was adopted. 37.5 grams of PIR were
introduced into the mixer at 80 °C and masticated for 1 min. 2.60
grams of MMT (6.92 phr hundred parts of rubber) and an amount
of 2HTCl corresponding to the CEC of MMT (5.08 phr per
hundred parts of rubber) were added, in presence of in absence of
SA or SAES equal to the molar amount of 2HTCl. Mixing was
carried out for 5 min, with rotors rotating at 60 rpm and with an
initial temperature of about 100 °C. Nanocomposites were finally
homogeneized by passing them 5 times on a two roll mill operating
at 50 °C, with the front roll rotating at 30 rpm and the back roll
rotating at 38 rpm, and 1 cm as the nip between the rolls.
8.15 Preparation of Rubber/Organoclay Nanocomposites
by Melt Blending
The preparation of rubber/OC nanocomposites by melt blending
was performed by the group of Prof. Maurizio Galimberti at the

192
Polytechnic of Milan. A Haake PolyLab with a 180 mL mixing
chamber was used as the internal mixer for the preparation of
nanocomposites. The following standard procedure was adopted for
the preparation of nanocomposites whose formulations are reported
in Table 3.1. Extracted OC, MMT/2HT and MMT/2HT/SA of
paragraph 8.2 were selected as the starting OCs and are renamed as
OC 2.5nm, OC 4nm and OC 6nm in the following. PIR was
introduced into the mixer at 80 °C and masticated for 1 min. The
nanofiller (either OC 2.5nm or OC 4nm or OC 6nm) was added
and mixing was carried out for 5 min. The masterbatch was
discharged at a temperature in a range from 110 °C to 115 °C and
fed again to the mixer after 16 h, leaving it in the mixer at 60 °C
and 30 rpm for 1 min. DCUP was then added, and mixing was
performed for further 2 min. Compounds were finally
homogeneized by passing them 5 times on a two roll mill operating
at 50 °C, with one roll rotating at 38 rpm and the other at 30 rpm,
and 1 cm as the nip between the rolls.
8.16 Preparation Rubber/Graphite Oxide Intercalation
Compound Nanocomposites by Melt Blending
The preparation of rubber/GOIC nanocomposites by melt blending
was performed by the group of Prof. Maurizio Galimberti at the
Polytechnic of Milan. PIR-based nanocomposites containing
different amounts of GO/2HT-H or GO/2HT-L were prepared in
an internal mixer Brabender type with a 50 mL mixing chamber.
Their formulations are reported in Table 4.1 and their acronyms
indicate both type and amount of filler; for example, in PIR/H-7
and in PIR/L-7, 7 parts per hundred parts of rubber (phr) of
GO/2HT-H and 7 phr of GO/2HT-L were used, respectively. A
standard procedure was adopted. PIR/H-7 of Table 4.1 is taken as
an example. 32.5 g of PIR were introduced into the mixer at 80 ° C
and masticated for 1 min. 2.3 g (7 phr) of GO/2HT-H and 0.23 g

193
of silane NXT, corresponding to 10 %wt. with respect to
GO/2HT-H, were added. Mixing was carried out for 5 min at 60
rpm and then the compound was discharged at about 100 °C. After
reaching room temperature, the compound was fed again to the
mixer, ZnO, SA, and 6PPD were then added, and mixing was
performed for further 2 min. Sulfur, DCBS, and CTP were finally
added and the compound was discharged at about 60 °C after 2
further min of mixing. Nanocomposites were finally homogeneized
by passing them five times on a two roll mill operating at 50 °C; one
roll rotated at 38 rpm, the other at 30 rpm, and 1 cm was the nip
between the rolls.
8.17 Crosslinking of Rubber Nanocomposites
All rubber nanocomposites were crosslinked by the group of Prof.
Maurizio Galimberti at the Polytechnic of Milan. Crosslinking
reaction was performed at 170 °C for 20 minutes, by compressing
samples in discs. MDR rheometric analysis was conducted using a
Monsanto MDR rheometer, the test being carried out at 170 °C,
for 20 minutes, at an oscillation frequency of 1.66 Hz (100
oscillations per minute) and an oscillation amplitude of ± 0.5°.
8.18 Macromolecular Cross-Metathesis of High-cis
Polybutadiene and Polyisoprene
Random multiblock PBR-PIR copolymers were prepared by
macromolecular cross-metathesis of high-cis PBR-PIR 50:50
(%wt.) mixtures in dry hexane, in presence of G1 and HG1
catalysts. Tests were also performed on each homopolymer in
presence of G1.
In a typical experiment, in glove box, equal amounts of PBR
(500 mg) and PIR (500 mg) were dissolved in 40 mL of dry hexane
in a septum-capped vial and G1 or HG1 catalysts (5 mg; 0.036
%mol. and 0.049 %mol. against the total double bond units in the

194
main chain of polymers, respectively) were dispersed in 2 mL of dry
hexane in a small vial.
The dispersion of the catalyst was then transferred to the
vial containing the polymers via syringe and vigorously stirred at 45
°C for G1 metathesis or 60 °C for HG1 metathesis. The metathesis
reaction was allowed to go for 5 min, 10 min, 15 min, 20 min, 30
min, 1h, 3h, 8h and 24h. Aliquots of the reacting mixture were
sampled by syringe at each time and the reaction was stopped by
adding 1 mL ethyl-vinyl ether. The obtained product was coagulated
in ethanol and, finally, it was vacuum dried at 50 °C overnight. The
yields of the scrambled polymers were higher than 95 %wt. from 5
min to 30 min, higher than 90 %wt. from 1h to 8h and
approximately 70 %wt. at 24h. The products were also treated in a
Kumagawa extractor and ethyl acetate was allowed to reflux for 12
hours to remove the soluble low molecular weight components. The
soluble extracts were coagulated in methanol, isolated and then
vacuum dried at 50 °C overnight. The insoluble residues were
directly vacuum dried at 50 °C overnight. The yields of the
insoluble residues compared with the as prepared scrambled
polymers were higher than 90 %wt. at 1h, 3h, 8h and approximately
50 %wt. at 24h.
8.19 Metathetic Degradations of Polybutadiene and
Polyisoprene and their Mixtures
Metathetic degradations of high-cis PBR-PIR 50:50 (%wt.)
mixtures in dry hexane were performed by using G2 and HG2
catalysts. Tests were also performed on each homopolymer in
presence of G2.
In a typical experiment, in glove box, equal amounts of PBR
(500 mg) and PIR (500 mg) were dissolved in 40 mL of dry hexane
in a septum-capped vial and G2 or HG2 catalysts (5 mg; 0.035
%mol. and 0.047 %mol. against the total double bond units in the

195
main chain of polymers, respectively) were dispersed in 2 mL of dry
hexane in a small vial. The dispersion of the catalyst was then
transferred to the vial containing the polymers via syringe and
vigorously stirred at 45 °C for G2 metathesis or 60 °C for HG2
metathesis. The metathesis reaction was allowed to go for 5 min, 10
min, 15 min, 20 min, 30 min, 1h, 3h, 8h and 24h. Aliquots of the
reacting mixture were sampled by syringe at each time and the
reaction was stopped by adding 1 mL ethyl-vinyl ether. The
obtained product was coagulated in ethanol and, finally, it was
vacuum dried at 50 °C overnight. The yields of the products were
slightly higher than 50 %wt. at 5 min and 10 min and always lower
than 35 %wt. at each time from 15 min to 24h.
8.20 Covalent Functionalization of Graphene Oxide
Layers with Grubbs Catalyst
The following procedure was elaborated and performed in
collaboration with Dr. Annaluisa Mariconda of the Department of
Chemistry and Biology of the University of Salerno. Grubbs
catalyst-functionalized graphite oxide powders were prepared in
analogy with the procedure reported by Longo et al. for Grubbs
catalyst-functionalized multiwalled carbon nanotubes.[7]
In a 500 mL flask, containing 6.2 g of GO powders, 300
mL of thionyl chloride were added under nitrogen and the resulting
suspension was stirred for 48 h at 70 °C. The excess of thionyl
chloride was evaporated under vacuum, obtaining GO-Cl powders.
20 mL of ethylene glycol and 250 mL of dry THF were
added in the same flask. The mixture was stirred for 36 h at 70 °C
under nitrogen. The solid product (GO-Gly) was filtered, washed
with 300 mL of methanol and dried at 60 °C for 12 h in an oven.
5-norbornene-2-carboxylic acid is converted in the
corresponding acid chloride. 10 mL of 5-norbornene-2-carboxylic
acid and 33 mL of thionyl chloride were added in a 100 mL flask.

196
The mixture was stirred at reflux for 24 h under nitrogen. The
excess of thionyl chloride was evaporated under vacuum.
In a 250 mL flask, containing 5.1 g of GO-Gly powders, 70
mL of dry CH2Cl2, 4 mL of dimethylformamide and 4 mL of
triethylamine were added. The mixture was stirred under nitrogen
for 48 h at reflux. The solid product (GO-Nor) was isolated by
filtration, washed with 300 mL of methanol an 200 mL of CH2Cl2
and dried at 60 °C for 12 h in an oven. 4.8 g of GO-Nor powders
were obtained.
For each covalent functionalization, 1.2 g of GO-Nor, 400
mg of G2 and 150 mL of dry hexane were added, under nitrogen, in
a 250 mL flask. The mixture was stirred for 16 h, at room
temperature, under nitrogen. The solid product (GO-G2) was
isolated by filtration, washed with CH2Cl2, until the disappearance
of the characteristic brownish color of the excess of G2 (roughly
500 mL of CH2Cl2) and dried at 60 °C for 12 h in an oven. 1.1 g
of GO-G2 active powders were obtained.
8.21 Non-Covalent Functionalization of Graphene Oxide
Layers with Piers Catalyst
The following procedure was elaborated and performed in
collaboration with Dr. Annaluisa Mariconda of the Department of
Chemistry and Biology of the University of Salerno. In a 100 mL
flask containing a solution of 32 mg of PPh3 in 30 mL of CH2Cl2
dry, 50 mg of second generation Piers catalyst (P2) were added under
nitrogen atmosphere and stirred overnight at room temperature.
Dichlorometane was then evaporated under vacuum, the phosphinated
product (PP2) powders, were finally washed with dry hexane to
eliminate the excess of PPh3.
2 g of GO powders were dispersed in 400 mL 0.05 M
NaOH aqueous solution and stirred for 1h at room temperature.
The slurry was centrifugated at 10000 rpm for 15 min and the

197
precipitate was washed with deionized water and dried at 60 °C for
12 h in an oven. 1 g of GO-Na+ powders were dispersed in 50 mL
of deionized water and directly added in the flask containing PP2.
The mixture was homogenized for 1h under magnetic stirring and
sonicated in a 5000 mL batch bath ultrasound (Badelin Sonorex RK
1028 H) for 2h at room temperature. The dispersion was
centrifugated at 10000 rpm for 15 min and the precipitate was
washed with deionized water and dried at 60 °C for 12 h in an
oven.
8.22 Grafting of Polyisoprene to Grubbs and Piers
Catalyst-Functionalized Graphene Oxides
1 g of PIR was dissolved in 40 mL of hexane, subsequently 3 %wt.
of GO-G2 or GO/PP2 powders were added to the PIR solution.
The mixture was stirred for 3 h at 45 °C, after it was coagulated in
ethanol and, finally, vacuum dried at 50 °C overnight. The products
were also treated in a Kumagawa extractor and hexane was allowed
to reflux for 12 hours to remove the free (soluble fraction) from the
grafted polymer fraction (insoluble residue). The soluble extracts
were coagulated in methanol, isolated and then vacuum dried at 50
°C overnight. The insoluble residues were directly vacuum dried at
50 °C overnight. The yields of the dried insoluble residues
compared with the as prepared grafted rubbers were higher than 95
%wt. and 97 %wt. for PIR/GO composites obtained from GO-G2
and GO/PP2, respectively.
References
[1] A. Grassi, C. Pellecchia, P. Longo, A. Zambelli. Gazzetta
Chimica Italiana 1987, 117, 249–250.
[2] L. Staudenmaier. Ber. Dtsch. Chem. Ges. 1898, 31, 1481–1487.
[3] W. S. Hummers, R. E. Offeman. J. Am. Chem. Soc. 1958, 80,
198
1339.
[4] Y. Matsuo, T. Niwa, Y. Sugie. Carbon 1999, 37, 897–901.
[5] S. Stankovich, D. A. Dikin, R. D. Piner, K. A. Kohlhaas, A.
Kleinhammes, Y. Jia, Y. Wu, S. T. Nguyen, R. S. Ruoff. Carbon
2007, 45, 1558–1565.
[6] R. Wissert, P. Steurer, S. Schopp, R. Thomann, R. Mülhaupt.
Macromol. Mater. Eng. 2010, 295, 1107–1115.
[7] C. Costabile, F. Grisi, G. Siniscalchi, P. Longo, M. Sarno, D.
Sannino, C. Leone, P. Ciambelli. J. Nanosci. Nanotech. 2011, 11,
1–10.
199
Chapter 9
Characterization Techniques
9.1 Wide Angle X-ray Diffraction
Wide-angle X-ray diffraction (WAXD) patterns were obtained by
an automatic Bruker D8 Advance diffractometer, in reflection, at 35
KV and 40 mA, using the nickel filtered Cu Kα radiation (1.5418
Å). The d-spacings were calculated using Bragg’s law and the
observed integral breadths (βobs) were determined by a fit with a
Lorentzian function of the intensity corrected diffraction patterns,
according to the procedure described by Iwashita et al. [1] The
instrumental broadening (βinst) was also determined by fitting of
Lorentzian function to line profiles of a standard silicon powder
325 mesh (99%). For each observed reflection, the corrected
integral breadths were determined by subtracting the instrumental
broadening of the closest silicon reflection from the observed
integral breadths, β = βobs - βinst. The correlation lengths
perpendicular to hkℓ planes (Dhkℓ) were determined using Scherrer’s
equation.
hkhk
hk
KD
cos
(1)
where λ is the wavelength of the incident X-rays and θhkℓ the
diffraction angle, assuming the Scherrer constant K = 1.
A more accurate WAXD analysis was carried out for
samples A-F of Fig. 2.8. The correlation lengths (D) and the lattice

200
strains (ε) were estimated by applying the Williamson and Hall
method,[2] which was successfully applied to carbon materials.[3–5]
sin22cos
)(
D
Kinstobs (2)
The out-of-plane correlation lengths (D┴) and lattice strains
(ε┴) were obtained using the 002, 004, 112 and 006 reflections,
while the in-plane correlation lengths (D║) and lattice strains (ε║)
were determined from the 100 and 110 reflections. The shape
anisotropy was determined by the ratio D║ / D┴, while the strain
anisotropy was evaluated by the ratio ε┴ / ε║.
WAXD measurements were also obtained with an automatic
Philips powder diffractometer, in transmission, by using a cylindrical
camera (radius = 57.3 mm). The WAXD patterns of GO and
GOIC films of Fig. 2.18 were recorded on a BAS-MS imaging plate
(FUJIFILM) and processed with a digital imaging reader (FUJIBAS
1800). In particular, to recognize the kind of crystalline orientation
present in films, photographic X-ray diffraction patterns were taken
by placing the film sample parallel to the axis of the cylindrical
camera and by sending the X-ray beam parallel (EDGE measure) to
the film surface.
The degree of the different kinds of uniplanar orientation of
the crystallites with respect to the film plane has been formalized on
a quantitative numerical basis using Hermans’ orientation functions,
in analogy to that one defined for the axial orientation:
2/)1cos3( 2 hklhkl xf (3)
by assuming hkl2cos as the squared average cosine value of the
angle, hklx , between the normal to the film surface and the normal

201
to the hkℓ crystallographic plane.[6–8]
Since, in our cases, a θhkℓ incidence of X-ray beam is used,
the quantity hkl2cos can be easily experimentally evaluated:
2/
0
2/
0
2
22
sin)(
sincos)(coscos
hklhklhkl
hklhklhklhkl
hklhkl
dI
dIx (4)
where )( hklI is the intensity distribution of a hkℓ diffraction on
the Debye ring and hkl is the azimuthal angle measured from the
equator.
The diffracted intensities )( hklI of eq. 4 were obtained by
EDGE patterns, as collected by using a cylindrical camera, by the
azimuthal profile at a constant 2θ value. Because the collection was
performed at constant 2θ values and in the equatorial geometry, the
Lorentz and polarization corrections were unnecessary.
In these assumptions, hklf is equal to 1 and -0.5 if hkℓ
planes of all crystallites are perfectly parallel and perpendicular to
the plane of the film, respectively.
9.2 Fourier Trasform Infrared Spectroscopy
Fourier transform infrared spectra (FTIR) spectra in transmission
mode with 2.0 cm-1 resolution, were recorded with a BRUKER
Vertex70 spectrometer equipped with a deuterated triglycine sulfate
(DTGS) detector and a KBr beam splitter. The powder specimens
were diluted with KBr of spectroscopic grade. The frequency scale
was internally calibrated to 0.01 cm-1 with a He-Ne laser and the
noise was reduced by signal averaging 32 scans.

202
9.3 Differential Scanning Calorimetry
The differential scanning calorimetry (DSC) was carried out under
nitrogen in the suitable temperature range for each material at a
heating or cooling rate of 10 °C/min on a TA instruments DSC
2920. Two heating and one cooling run were consecutively carried
out in a cycle and the peak maxima were considered as the transition
temperatures.
9.4 Thermogravimetric Analysis
Thermogravimetric analysis (TGA) of the layered nanofillers was
carried out on a TG 209 F1, manufactured by Netzsch Geraetebau,
from 20 to 800 °C, at a heating rate of 10 °C, under N2 flow. TGA
curves were also obtained for scrambled rubber samples, Grubbs
catalyst-functionalized graphene oxides and grafted rubbers to
graphene oxide sheets from 20 to 1000 °C, at a heating rate of 10
°C, under air flow.
9.5 Elemental Analysis
Elemental analysis was performed with a Thermo FlashEA 1112
Series CHNS-O analyzer, after pretreating samples in an oven at
100 °C for 12 h, in order to remove the absorbed water.
9.6 BET Surface Area Measurements Nitrogen adsorption at liquid nitrogen temperature (-196 °C) was
used to measure surface areas of the samples with a Nova
Quantachrome 4200e instrument. Before the adsorption
measurement, clay and carbon-based powders were degassed at 100
°C under nitrogen flow overnight to remove water, while polymeric
aerogels were degassed at 40 °C, in the same conditions. The surface
area values were determined by using 11-point Braunauer-Emmett-
Teller (BET) analysis.[9] All measures were performed in
collaboration with Dr. Simona Longo of the Department of

203
Chemistry and Biology of the University of Salerno.
9.7 Scanning Electron Microscopy
The morphology of the samples was characterized by means of a
scanning electron microscope (SEM, Zeiss Evo50 equipped with an
Oxford energy dispersive X-ray detector). Low energy was used (5
keV) to obtain the highest possible surface resolution. Before
imaging, all specimens were coated with gold using a VCR high
resolution indirect ion-beam sputtering system. The coating
procedure was necessary to prevent surface charging during
measurement and to increase the image resolution.
9.8 Trasmission Electron Microscopy
TEM analysis on rubber nanocomposites was performed by Dr.
Lucia Conzatti at the CNR, Institute for Macomolecular Studies
(ISMAC)-UOS Genova with a Zeiss EM 900 microscope applying
an accelerating voltage of 80 kV. Ultrathin sections (about 50 nm
thick) of cross-linked specimens were obtained by using a Leica EM
FCS cryo-ultramicrotome equipped with a diamond knife (sample
temperature: –130 °C). Before the TEM analysis, eGO samples
were dispersed and sonicated in isopropanol, then 10 μL of the
dispersion were were deposited on Assing copper grids coated with
carbon film.
9.9 Back Titration of Graphite Oxides
The cation-exchange-capacity of the GO samples (CEC) was
determined by the back titration of sodium hydroxide solution (0.05
M, 50 ml) of GO (100 mg) by 0.05 M hydrochloric acid solution,
according to the procedure reported by Matsuo et al. [10]
9.10 Gel Permeation Chromatography
Gel permeation chromatography (GPC) was performed with a

204
Waters Breeze GPC system was equipped with a refractive index
(RI) detector using a set consisting of four Styragel HT columns
with (102, 103, 104, and 105 Å pore size) and 10 µm (particle size).
THF was used as eluent at 35 °C at a flow rate of 1.0 mL min-1.
The calibration curve was established with polystyrene standards.
9.11 NMR Spectroscopy 13C-NMR spectra were recorded by using a Bruker AVANCE 400
spectrometer (400 MHz for 1H and 100 MHz for 13C). The
chemical shifts were referenced to tetramethylsilane (TMS) (δ = 0
ppm) using the residual proton impurities of the deuterated solvents
as internal standards. Rubber samples were prepared by dissolving
100 mg of compound in 2 mL of deuterated chloroform (CDCl3). 1H-NMR spectra of P2 and PP2 catalysts in deuterated
dichloromethane (CD2Cl2) were also recorded.
9.12 Raman Spectroscopy
The Raman characterization was performed by the group of Dr.
Pellegrino Musto at the CNR, Institute of Chemistry and
Technology of Polymers (ICTP) Pozzuoli. Raman spectra were
obtained by a confocal Raman (HORIBA Jobin Yvon LabRAM
Aramis) microscope, equipped with a He-Ne laser at a wavelenght
of 633 nm. Raman spectra of samples in Fig. 2.25 were fitted with
Lorentzian functions for the D, G and D'-band, in order to estimate
the full width at half maximum of the D-band (FWHMD), chosen
as the in-plane structural ordering parameter.[11]
9.13 Dynamic-Mechanical Analysis
Dynamic-mechanical properties of sPS/OC aerogels were studied
using a Triton dynamic-mechanical thermal analyzer. The spectra
were recorded in the three-point bending mode, on samples with the
following dimensions: length 15 mm, width 10 mm and thickness 2
205
mm. The storage modulus was obtained, as a function of
temperature, at a frequency of 1 Hz and an amplitude of 0.03 mm.
The heating rate was 2 °C/min in the range of 0, +100 °C.
The tensile storage modulus and the loss tangents of
PIR/GO nanocomposites were determined via dynamic-mechanical
analysis at a frequency of 1 Hz and an amplitude of 0.03 mm. The
spectra were recorded in the tensile mode from -90 °C to -20 °C,
with a heating rate of 2 °C/min.
9.14 Tensile Tests
Tensile tests were performed by the group of Prof. Maurizio
Galimberti at the Polytechnic of Milan with ISO 3 dumbbell.
Composites were homogeneized by passing them at the two roll mill
at 40 °C, for 10 times. Disks 2 mm thick and with 56 mm as the
diameter were obtained therefrom by vulcanizing the composites for
20 minutes at 170 °C with 150 bar pressure. Dumbbell, 2 mm
thick, 8.5 mm wide, 50 mm long and with 15 mm as the distance
between the grips were then taken from these disks. Tensile tests
were performed at Room Temperature by an Instron dynamometer
(model 3366) on three dumbbells at cross-head rate of 100
mm/min.
9.15 Strain Sweep Tests
A Monsanto R.P.A. 2000 rheometer was used to measure dynamic
mechanical properties of the rubber nanocomposites. All measures
were performed by the group of Prof. Maurizio Galimberti at the
Polytechnic of Milan. The adopted experimental procedure is
described as follows. Raw samples were kept in the instrument at 50
°C for 90 s, a strain sweep (0.1 - 100% strain) was then performed
at 50 °C. Afterwards, the curing was carried out at 170 °C for 20
min, with a frequency of 1.667 Hz and an angle of 6.98% (0.5 rad).
The cured samples were allowed to recover in the instrument for

206
180 min at 50 °C. Data were finally obtained with a strain sweep
(0.1 - 100% strain) performed at 50 °C with a frequency of 1 Hz.
9.16 Crosslinking Tests
The behavior of the crosslinking reaction of the rubber
nanocomposites was studied at 170 °C with a Monsanto oscillating
disc rheometer MDR 2000 (Alpha Technologies, Swindon, UK).
All measures were performed by the group of Prof. Maurizio
Galimberti at the Polytechnic of Milan.
References
[1] N. Iwashita, C. R. Park, H. Fujimoto, M. Shiraishi, M. Inagaki.
Carbon 2004, 42, 701–714.
[2] F. Williamson, W. Hall. Acta Metall. 1953, 1, 22–31.
[3] T. Ungár, J. Gubicza, G. Tichy, C. Pantea, T. W. Zerda.
Composites Part A 2005, 36, 431–436.
[4] D. Poirier, R. Gauvin, R. A. L. Drew. Composites Part A 2009,
40, 1482–1489.
[5] S. A. Manafi, M. H. Amin, M. R. Rahimipour, E. Salahi, A.
Kazemzadeh. Nanoscale Res. Lett. 2009, 4, 296–302.
[6] R. J. Samuels. In Structured polymer properties, New York:
John Wiley & Sons; 1971, Chapter 2, p. 28.
[7] M. Kakudo, N. Kasai. X-ray diffraction by polymers,
Amsterdam: Elsevier; 1972, Chapter 10, p. 252.
[8] L. E. Alexander. In X-ray diffraction methods in polymer
science, New York: Krieger RE, editor; 1979, Chapter 4, p. 210.
[9] S. Brunauer, P. H. Emmett , E. Teller. J. Am. Chem.
Soc., 1938, 60, 309–319.
[10] Y. Matsuo, T. Miyabe, T. Fukutsuka, Y. Sugie. Carbon 2007,
45, 1005–1012.
[11] J. M. Vallerot, X. Bourrat, A. Mouchon, G. Chollon. Carbon
2006, 44, 1833–1844.

207
Conclusions
In a nutshell, new layered nanofillers for rubber nanocomposites,
based on clays and graphitic materials, were prepared and deeply
characterized. Pristine MMT and a graphite G with high surface
area, also exhibiting a high shape anisotropy, were selected as the
starting materials. GO samples were obtained by oxidation of G
with both Staudenmaier and Hummers methods. A complete control
over the degree of order and the periodicity of the nanofiller
structures was achieved.
First of all, the intercalation chemistry of MMT and GO
with long-chain amphiphilic guest molecules was investigated in
order to obtain properly modified fillers with improved
compatibility with the rubber matrix. Two different procedures were
adopted: the solid state preparation of OCs was performed in a
centrifugal ball mill, while GOICs were prepared with the help of
water and ethanol. Ordered OC and GOIC structures with bulky
guest molecules and with large interlayer spacings, also exhibiting a
high crystalline order in the interlayer space were obtained, in
absence or in presence of polar long-chain co-intercalants.
Disordered structures were also obtained at the solid state
by using different methods. In particular, exfoliation of OCs was
induced by supercritical CO2 treatments, while chemically modified
graphenes were prepared in bulk quantities by chemical, mechanical
and solvo-thermal treatments of GO powders. Furthermore,
monolithic sPS aerogels filled with exfoliated clays or graphenes
were found to preserve the exfoliation state of the fillers and, due to
their thermoplastic nature, are proposed as masterbatches for
composite processing.
Rubber nanocomposites were prepared by melt blending
PIR with OCs or GOICs. Results obtained for rubber/OC
nanocomposites confirmed that only low molecular mass substances,

208
such as the compensating cations and, optionally, further polar
molecules, are intercalated in the clay interlayer space, being the
intercalation of hydrophobic polymer chains highly unlikely to
occur. The GOICs were evenly dispersed in the PIR matrix and were
found to be prevailingly exfoliated. OCs and GOICs exhibited
reversible thermal transitions, both at the solid state and in the
rubber matrix, corresponding to the recovery and the loss of the
order in the packing of long hydrocarbon tails of the compensating
cation associated to each lamella. Tensile and dynamic-mechanical
properties of the nanocomposites were appreciably affected by the
nanofiller structures, namely by the interlayer distance. However, a
larger amount of the long hydrocarbon chains did not lead to a
substantial increase of mechanical reinforcement: the long
hydrocarbon chains seem to act as plasticizer, compensating the
reinforcing effect of the nanofiller layers.
Metathesis reactions were used to prepare innovative
polymer-polymer and filler-polymer materials, containing rubber
macromolecules. High-cis random multiblock PBR-PIR copolymers
were successfully prepared by MCM with first generation Grubbs
and Hoveyda-Grubbs catalysts in dry hexane, while second
generation Grubbs and Hoveyda-Grubbs catalysts were found to
preferentially degradate rubbers. Finally, novel rubber
nanocomposites, composed by PIR grafted to graphene oxide sheets,
were prepared by taking advantage from the cross-metathesis
reactions of PIR and functionalized GO samples with Grubbs and
Piers catalysts.

209
Acknowledgements
These three years I have spent at the University of Salerno have been
a wonderful part of my life and here, I would like to distinguish and
express my special thanks:
To my tutor Prof. Gaetano Guerra, for the effective
guidance, support and encouragement during the entire work. He
always taught me how much imagination and willfulness can be
important to get good results, I will never forget his passion for one
of the most beautiful jobs ever existed, the scientific research.
To Prof. Pasquale Longo, Prof. Maurizio Galimberti, Dr.
Luca Giannini, Dr. Thomas Hanel and Dr. Angela Lostritto for
generously giving precious advices and for sharing ideas and research
activities.
To my family, who guided me in all my choices, enjoying all
my successes. I owe a great deal to them for the person that I'm
today.
To Sheila for the love that we share everyday of our lives.
She came into my life as a hurricane, filling my days with her
brightness, intelligence and beauty. She has always supported me in
good and bad times, giving me the strength and the motivations to
go on and to make my best.
To Mario Maggio and Simona Daniele for the commitment
and dedication that they have shown during their graduation thesis
under my supervision.
I truly thank all the guys of my research group, Antonio
Avallone, Simona Longo, Graziella Ianniello, M. Rosaria Acocella,
with whom I have established a friendship beyond the employment
relationship and all the people I have met in the laboratories,
Alessandra Perfetto, Annaluisa Mariconda, Antonio Buonerba and
Carmen Talotta, particularly Annarita Noschese and Assunta De
Nisi for the funny lunch times.

210
Finally, I would like to thank the guys from the Polytechnic
of Milan, Valeria Cipolletti, Sara Musto and Vineet Kumar for
useful discussions.

211
A dreamer is one who can only find his way by moonlight, and
his punishment is that he sees the dawn before the rest of the world.
Oscar Wilde
Recommended