Nigel Milner
APEM Ltd
Monitoring and Assessment. Or, “if you can’t measure it you can’t
manage it”

Content 1. What is it?
2. Why do it?
3. What to do and Where to do it?
4. Who does it?
Universal Topics1. Standards (expectations)
2. Scale (space and time)
3. Effectiveness (fit for purpose? How uncertain can we be? How little can we get away with?)

What is Monitoring and Assessment?
Forget definitions…what might “it” do in the Eden FMPlan?
MONITORING ASSESSMENT
MON&ASS – interdependent parts of fishery management

Fisheries Management CycleLaw , policy,
events resources
MANAGEMENT OBJECTIVES
Set management TARGETS
ASSESS Diagnose and evaluate limiting factors
SELECT ACTIONS
MONITORING and
INDICATORSe.g. Fisheries
StocksHabitat
OUTCOMESStakeholdersStock conservationSustainable fisheriesGood Ecological healthSocio-economics
Fishery development
Catch control
Habitat & barriers
Stocking & movements
Predator and disease control
Environmental improvement, via River basin Plans
IMPLEMENTATION
PURPOSE OF MON&ASS
•Measure status and trends of “fisheries”•Identify problems•Find solutions•Measure results of management and modify, if necessary•Must have an aim and a plan for the data

“Fishery” Monitoring
Fishery = a fish stock + people
•Catch number•Catch per effort•Composition•Location•Season•Value
•Location•Abundance•Composition•Population (genetic) structure•Growth •Mortality•Timing•HABITAT (water, channel, banks, land)•Food•Predators•Environmental limiting factors
•Fishing effort•Demand•Satisfaction•Participation•Ownership•Costs
Monitoring options & indicators

Incubation•Gravel quality•Egg survival
Fry emergence•Nos, dispersal•food availability•temp/growth rate
Juveniles•Juvenile density•Standing stock•NB PLUS HABITAT•food availability•Temperature and water quality
Smolts•Numbers•Timing•flow/temp stimulus•free passage
Spawning•Redds•Effective distribution•Egg deposition
Adult Fishery•Catches•Season/age•Effort•Catch per effort
Passage and Movements
Monitoring around the life cycleOceanic life
•Post-smolt survival•Migration routes
Because of internal regulation in young stages, adult numbers can vary greatly for comparatively little change in juvenile abundance… so, what is the purpose?

Scale matters
SPAWNING & EGGSLocalised distribution, but
widely distributed
FRY-PARRSome redistribution life stage /spp dependent.
Highly habitat dependentSo, Habitat inventory + stratified design if stock
assesst is aim
ADULTSNB population structuring,
genetics, catches are usually whole river-
specific, Pinch points-critical.
local Q needs
SMOLTS Starts local, becomes whole catchment, NB barriers, predation.

Adult salmon sampling - Catch
• (1) Measure of fishery performance• (2) Index of stock (run size)• Nets & rods (in-river)
SOURCES• Environment Agency Licence returns • Annual published statistics• Private fishery records, Log books, Census
DATA TYPES...• Catch, effort, C per E, location, season• NB errors (recording, environmental factors
especially river flow)
0
500
1,000
1,500
2,000
2,500
3,000
3,500
4,000
1970 1975 1980 1985 1990 1995 2000 2005 2010
Rod
catc
h (a
dj)
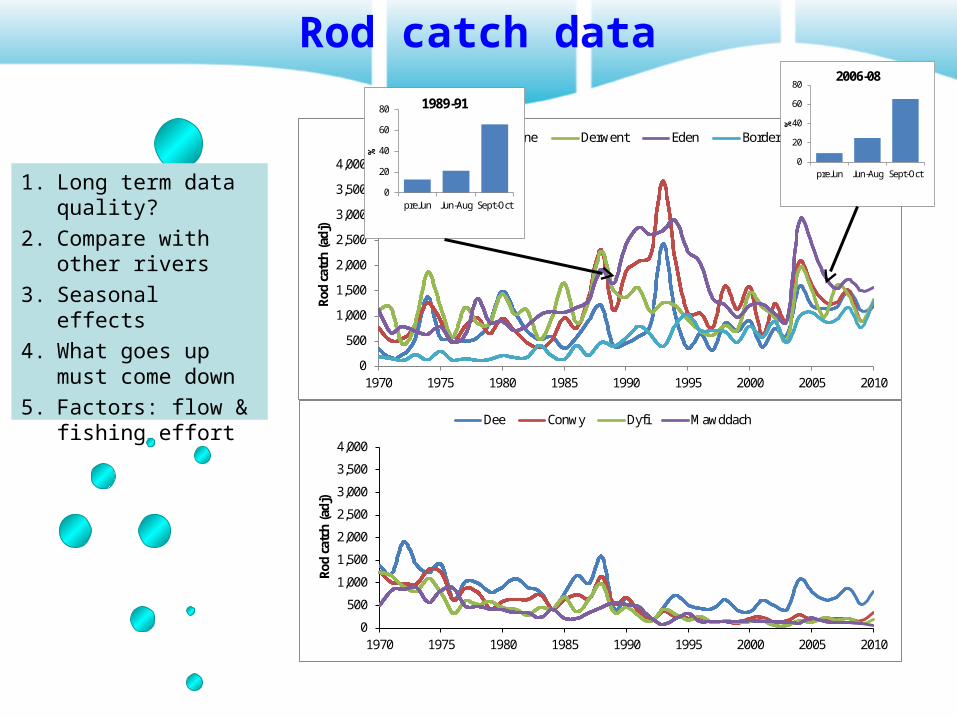
Ribble Lune Derwent Eden Border Esk
0
500
1,000
1,500
2,000
2,500
3,000
3,500
4,000
1970 1975 1980 1985 1990 1995 2000 2005 2010
Rod
catc
h (a
dj)
Dee Conwy Dyfi Mawddach
Rod catch data
0
20
40
60
80
preJun Jun-Aug Sept-Oct
%
1989-91
0
20
40
60
80
preJun Jun-Aug Sept-Oct
%
2006-08
1. Long term data quality?
2. Compare with other rivers
3. Seasonal effects
4. What goes up must come down
5. Factors: flow & fishing effort

-2.0
-1.0
0.0
1.0
2.0
3.0
1994 1996 1998 2000 2002 2004 2006 2008 2010
CPLD
(sta
ndar
ddis
ed,z
sco
re)
SalmonRibble Lune Derwent Eden Esk (Border)
-3.0
-2.0
-1.0
0.0
1.0
2.0
3.0
1994 1996 1998 2000 2002 2004 2006 2008 2010
CPLD
(sta
ndar
dise
d)
Sea TroutLune Ribble Border Esk Derwent Eden
1. Species diffs
2. Comparisons to show patterns
3. Common patterns may mean common factors

Adult in-river run estimation
• INDIRECT (Catch)• Run (R), catch (C), exploitation rate
(U) is proportion of annual run taken by fishery; then:
• Run = Catch /exploitation rate (U)• (U is estimated independently)• Catch per effort• Catch-stock relationship obscure and
variable• Can be taken on to egg deposition
• DIRECT• Resistivity counters• Acoustic counters• Video• Visual count (tally)• Traps• Tagging Marking• Biological data• Index rivers

Sampling juveniles in Fresh Water
By Electro-fishing• Fry, parr, and resident adults Distribution & abundance Growth and survival, Environmental problems• Semi-quant vs quant.
• NB Coupled with habitat surveys...why is this important?
Environment Agency’s juvenile fish electro-fishing monitoring programme

Why Evaluate Habitat ?• Interpretation of population surveys
- habitat always affects carry capacity- need to put observed results into context- removal of habitat ‘effects’ (saves £ in surveys)
• Identifying potential impacts (water quality)- pristine sites used for calibration- predictions assume no water quality problems

Sampling smolt runs
• Runs are seasonal & flow/temp. dependent• Diurnal migration• Traps, trib specific only • Give direct counts or mark-recapture ests• Value for money?
Wolf trap: filters smolts from stream flow, led into storage tank
Screw trap: same principle but moveable, self cleaning and protects fish better

Reference Points and Targets: juveniles
2. EA National Fisheries Classification System Classifies (typical) fish densities F E D C B A Salmon 0+ none recorded 0.1-9.0 9.1-22.9 23.0-44.9 45.0-85.9 ≥86.0 Salmon 1+ none recorded 0.1-2.9 3.0-4.9 5.0-9.9 10.0-18.9 ≥19.0
1. HABSCORE: genuine “target” and statistical model
3. WFD NFCS2 predicted salmonid densities for Water Body class. May allow estimation of potential benefits of environmental improvements
y(salmon) = 0.5935x - 0.5414R² = 0.982
y(trout) = 0.5104x + 1.3565R² = 0.815
0.0
1.0
2.0
3.0
4.0
0 1 2 3 4
ln(D
+1)
Water Body NFSC class (1=Poor, 2=Mod, 3=Good, 4=High)
SALMON TROUT
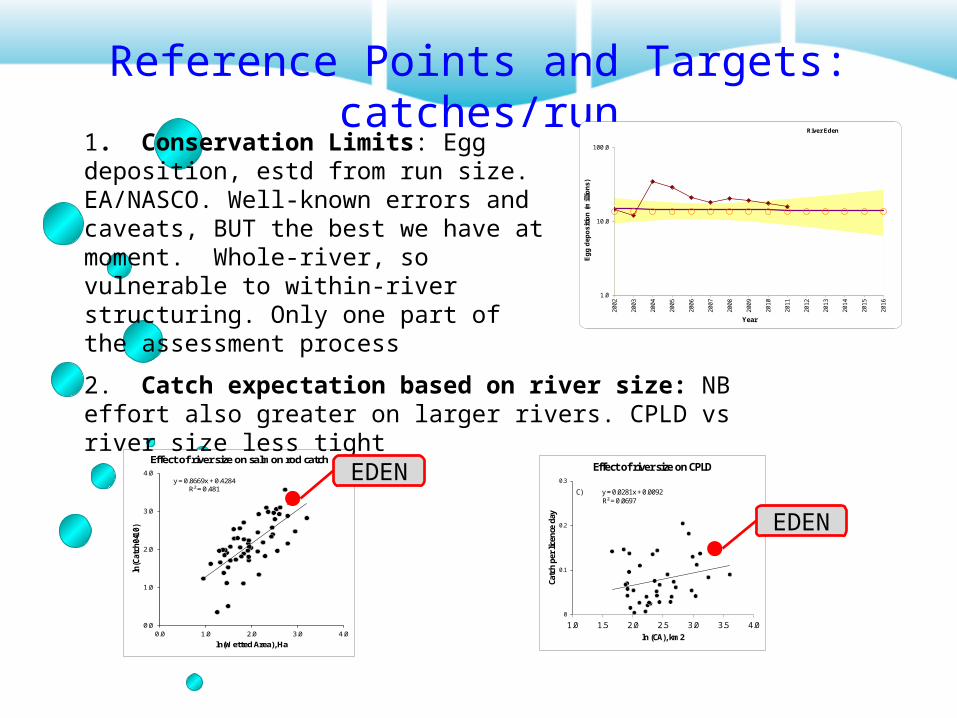
Reference Points and Targets: catches/run
y = 0.8669x + 0.4284R² = 0.481
0.0
1.0
2.0
3.0
4.0
0.0 1.0 2.0 3.0 4.0
ln(C
atch
04-10
)
ln(Wetted Area), Ha
Effect of river size on salmon rod catch
2. Catch expectation based on river size: NB effort also greater on larger rivers. CPLD vs river size less tight
EDENC) y = 0.0281x + 0.0092
R² = 0.0697
0
0.1
0.2
0.3
1.0 1.5 2.0 2.5 3.0 3.5 4.0
Catc
h pe
r lic
ence
day
ln (CA), km2
Effect of river size on CPLD
EDEN
1. Conservation Limits: Egg deposition, estd from run size. EA/NASCO. Well-known errors and caveats, BUT the best we have at moment. Whole-river, so vulnerable to within-river structuring. Only one part of the assessment process 1.0
10.0
100.0
20
02
20
03
20
04
20
05
20
06
20
07
20
08
20
09
20
10
20
11
20
12
20
13
20
14
20
15
20
16
Eg
g d
epo
siti
on
(m
illio
ns)
Year
River Eden

Monitoring for RTs on the Eden?
• NB Capacity: resources, skills; avoid duplication, bring added value• ADULT salmonids: local catches/logbooks NB trout Improve return and recording levels Scale collection: design; reading is specialist, but Hutton was an “amateur” Local small stream trapping (to assess adult use, genetics, sea trout) Redd counting
• JUVENILE salmonids: intensive timed surveys, for distribution, relative recruitment level. Survival v difficult; growth feasible? HABITAT: walkover, for habitat inventory
• Smolt trap manning (samples easy, stock stassessment difficult…intensive, great care needed). NB check vs objectives
• Flylife surveys• Constructive challenge and use of EA data

Monitoring and Assessment Summary
1. 2 sides of same coin: support each other
2. Purpose: to help fishery management: status, trends, target actions, develop solutions, demonstrate success or failure of management.
3. Scope: fish stocks, habitat, fish food, people & socio-economics
4. Fish Life Cycle: shows which stages are most relevant for different MON&ASS purposes. NB pre and post regulatory phases.
5. Features of good MON&ASS: relevant to mgmt aims & targets, understandable, taken up, cost-effective, consistent and long term (OR, time limited OK if that’s the plan)
6. Who does what: resources, skills, collaboration
MONITORING ASSESSMENT
Recommended