High level International Round Table on Literacy “Reaching the 2015 Literacy Target: Delivering on the promise”
UNESCO, Paris, 6-7 September 2012
Action Plan
Nigeria
UNESCO, Paris
6-7 September 2012
1
High-Level International Round Table on Literacy, UNESCO, Paris, 6-7
September 2012
National Literacy Action Plan for 2012 – 2015
NIGERIA
1.0 CONTEXT/JUSTIFICATION
Nigeria is the most populous country in Africa with a population of over 150 million. Out
of the total population, about 39 percent are children aged below 15 years while adults
constitute the remaining 61 per cent. Nigeria’s Constitution, (1999) the Vision 20-2020
document and the National Economic Empowerment and Development Strategy
(NEEDS) underline the importance of education as a vehicle of both individual
empowerment and national development. This is further elaborated and made more
focused in the National Policy on Education (NPE), cementing the country’s commitment
to EFA and education-related MDGs through the provision of free and compulsory 9-
year basic education programme, comprising 6 years of primary education and 3 years
of junior secondary education. The country is made up of 36 States and a Federal
Capital Territory (FCT) and it is further subdivided into 774 local government areas in
six geo-political zones.
1.1 Literacy Status, challenges and needs
A National Literacy Survey (2010) conducted by the National Bureau of Statistics in
Nigeria estimates the adult literacy rate as 56.9 percent, with huge variations between
states (Lagos 92.0 % and Borno only 14.5%), regions (urban 74.6 % and rural 48.7%,)
and sex (male 65.1% and female 48.6%). More importantly, statistics from the Federal
Ministry of Education indicate that only 500,000 of the 40 million adult illiterates are
enrolled in adult learning classes. There are also 3.5 million nomadic school-aged
children with only 450,000 of them accessing any form of schooling. Nigeria is further
saddled with the largest number of out-of-school-children estimated at over 7 million
(10 percent of the global total). The Nigerian Government recognizes that literacy
education will help equip individuals with the knowledge, skills and attitudes needed for
economic self-sufficiency, poverty reduction and sustainable development, and is
therefore making efforts to address the illiteracy challenge. Below is the distribution of
population and literacy rate by State and sex.
2
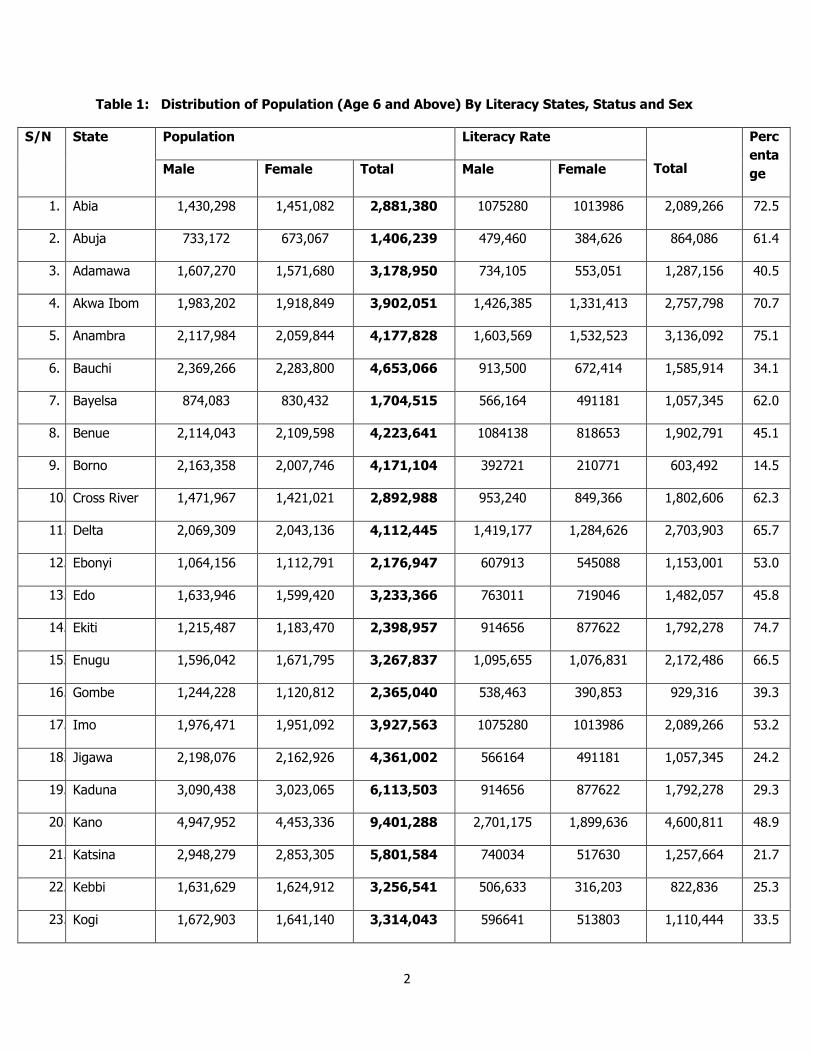
Table 1: Distribution of Population (Age 6 and Above) By Literacy States, Status and Sex
S/N
State Population Literacy Rate
Total
Perc
enta
ge Male Female Total Male Female
1. Abia 1,430,298 1,451,082 2,881,380 1075280 1013986 2,089,266 72.5
2. Abuja 733,172 673,067 1,406,239 479,460 384,626 864,086 61.4
3. Adamawa 1,607,270 1,571,680 3,178,950 734,105 553,051 1,287,156 40.5
4. Akwa Ibom 1,983,202 1,918,849 3,902,051 1,426,385 1,331,413 2,757,798 70.7
5. Anambra 2,117,984 2,059,844 4,177,828 1,603,569 1,532,523 3,136,092 75.1
6. Bauchi 2,369,266 2,283,800 4,653,066 913,500 672,414 1,585,914 34.1
7. Bayelsa 874,083 830,432 1,704,515 566,164 491181 1,057,345 62.0
8. Benue 2,114,043 2,109,598 4,223,641 1084138 818653 1,902,791 45.1
9. Borno 2,163,358 2,007,746 4,171,104 392721 210771 603,492 14.5
10. Cross River 1,471,967 1,421,021 2,892,988 953,240 849,366 1,802,606 62.3
11. Delta 2,069,309 2,043,136 4,112,445 1,419,177 1,284,626 2,703,903 65.7
12. Ebonyi 1,064,156 1,112,791 2,176,947 607913 545088 1,153,001 53.0
13. Edo 1,633,946 1,599,420 3,233,366 763011 719046 1,482,057 45.8
14. Ekiti 1,215,487 1,183,470 2,398,957 914656 877622 1,792,278 74.7
15. Enugu 1,596,042 1,671,795 3,267,837 1,095,655 1,076,831 2,172,486 66.5
16. Gombe 1,244,228 1,120,812 2,365,040 538,463 390,853 929,316 39.3
17. Imo 1,976,471 1,951,092 3,927,563 1075280 1013986 2,089,266 53.2
18. Jigawa 2,198,076 2,162,926 4,361,002 566164 491181 1,057,345 24.2
19. Kaduna 3,090,438 3,023,065 6,113,503 914656 877622 1,792,278 29.3
20. Kano 4,947,952 4,453,336 9,401,288 2,701,175 1,899,636 4,600,811 48.9
21. Katsina 2,948,279 2,853,305 5,801,584 740034 517630 1,257,664 21.7
22. Kebbi 1,631,629 1,624,912 3,256,541 506,633 316,203 822,836 25.3
23. Kogi 1,672,903 1,641,140 3,314,043 596641 513803 1,110,444 33.5

3
24. Kwara 1,193,783 1,171,570 2,365,353 627,636 539,436 1,167,072 49.3
25. Lagos 4,719,125 4,394,480 9,113,605 4341595 4042922 8,384,517 92.0
26. Nasarawa 943,801 925,576 1,869,377 441,859 340,875 782,734 41.9
27. Niger 2,004,350 1,950,422 3,954,772 763011 719046 1,482,057 37.5
28. Ogun 1,864,907 1,886,233 3,751,140 1,218,209 1,138,043 2,356,252 62.8
29. Ondo 1,745,057 1,715,820 3,460,877 1,192,117 1,101,163 2,293,280 66.3
30. Osun 1,734,149 1,682,810 3,416,959 137563 135242 272,805 80.0
31. Oyo 2,802,432 2,778,462 5,580,894 1,819,804 1,691,955 3,511,759 62.9
32. Plateau 1,598,998 1,607,533 3,206,531 810,148 683,329 1,493,477 46.6
33. Rivers 2,673,026 2,525,690 5,198,716 1,978,446 1,804,143 3,782,589 72.8
34. Sokoto 1,863,713 1,838,963 3,702,676 660,204 453,582 1,113,786 30.1
35. Taraba 1,171,931 1,122,869 2,294,800 348781 185815 534,596 23.3
36. Yobe 1,205,034 1,116,305 2,321,339 380,274 237,400 617,674 26.6
37. Zamfara 1,641,623 1,637,250 3,278,873 596641 513803 1,110,444 33.9
71,315,488 69,122,302 140,437,790 38,094,541 32,976,373 71,071,014 50.6
Source (NMEC, 2011)
The statistics above indicate that seventeen states (17) out of thirty seven (37) are at risk of
not achieving EFA goal 4 by 2015 as they have youth and adult literacy rates between 14.5 to
49.3% These States have concurrently experienced very low enrolment rates in primary
education. These are Northern and Eastern states which have majority Muslim and pastoralist
population. In order to remedy the situation and accelerate literacy in Nigeria a two pronged
approach to literacy which involves a significant advocacy and investment in both formal basic
education and youth and adult literacy and non formal education is envisioned in order to
ensure that children, youth and adults have access to adequate educational opportunities which
help them develop their literacy skills.
4
1.2 Governance system and institutional settings for literacy
The National Policy on Education (2004) lays emphasis on Mass Literacy, Adult and Non-Formal
Education. There are Federal agencies that are responsible for formulation and implementation
of adult and non-formal education policies. These include the Federal Ministry of Education,
National Commission for Mass Literacy, Adult and Non-Formal Education, National Commission
for Nomadic Education and the Universal Basic Education Commission. The adoption of the six
goals of Education for All (EFA) in Dakar brought a significant shift in the position of Nigeria on
Adult and Non-Formal Education. Adult literacy was accorded recognition in the Universal Basic
Education Act of 2004. The Act in Section 15, defines Basic Education as “Universal Basic
Education” including early childhood care and education, the nine years of formal schooling,
adult literacy and non-formal education, skills acquisition programmes and the education of
special groups such as nomads and migrants, girl-child and women, almajiri, street children and
disabled groups.
The National Commission for Mass Literacy, Adult and Non-Formal Education is responsible for
the organisation, monitoring and assessment of the adult literacy practices in the country. The
Commission adopted the decentralisation of its activities by the establishment of offices in the
six geo-political zones of the country, the thirty-six States (including the Federal Capital
Territory, Abuja) and all the seven hundred and seventy-four local government areas.
Coordination and supervision of literacy classes are the sole responsibility of the local adult
education officers, supervisors and literacy instructors. The minimum number of literacy classes
expected in any local government is ten. In addition, non-governmental organisations support
government efforts by establishing as many as they could manage and finance. Examinations
are conducted on the basic learning competencies, reading, writing and numeracy. The
agencies run different adult and non-formal education programmes like Adult Basic Literacy
Programme, Post Literacy Programme, Women Adult Education Programme, Distance Education
Programme, Sandwich Programme, and Nomadic Education Programme.

5
1.3 Funding for Literacy from 2002 – 2012
The sources of funding for literacy are many and varied including:
• Regular allocation by the Federal Government through its annual budget;
• Annual allocation by the States and FCT;
• MDGs intervention fund;
• Donor agencies; and Civil Society
Table 2: Federal Budgetary Allocations to the National Commission for Mass Literacy, Adult
and Non-Formal Education
YEAR 2007 -N 2008-N 2009-N
RECURRENT 242,974,824.00 242,974,824.00 242,974,824.00
CAPITAL 264,500,000.00 1,029,600,000.00 567,390,502.00
TOTAL 507,474,824.00 1,272,574,824.00 810,365,326.00
Source: Department of Finance, NMEC. 2009
Table 3: Financial Allocations to Education Sector and Non-formal Education Sub- Sector in the
States.
Year Total state budget on education Total budget for ALE %
2002 21,679,423,606.00 1,260,244,332.12 5.81
2003 23,959,727,517.00 751,600,634.00 3.14
2004 35,703,543,524.00 926,663,921.00 2.60
2005 49,663,888,029.00 1,064,097,092.00 2.14
2006 66,364,320,370.00 950,559,117.00 1.43
2007 68,869,593,714.43 1,385,750,731.00 2.01
2008 69,905,384,917.00 983,833,350.00 1.41
Source: National Report on Adult and Non-formal Education 2008
6
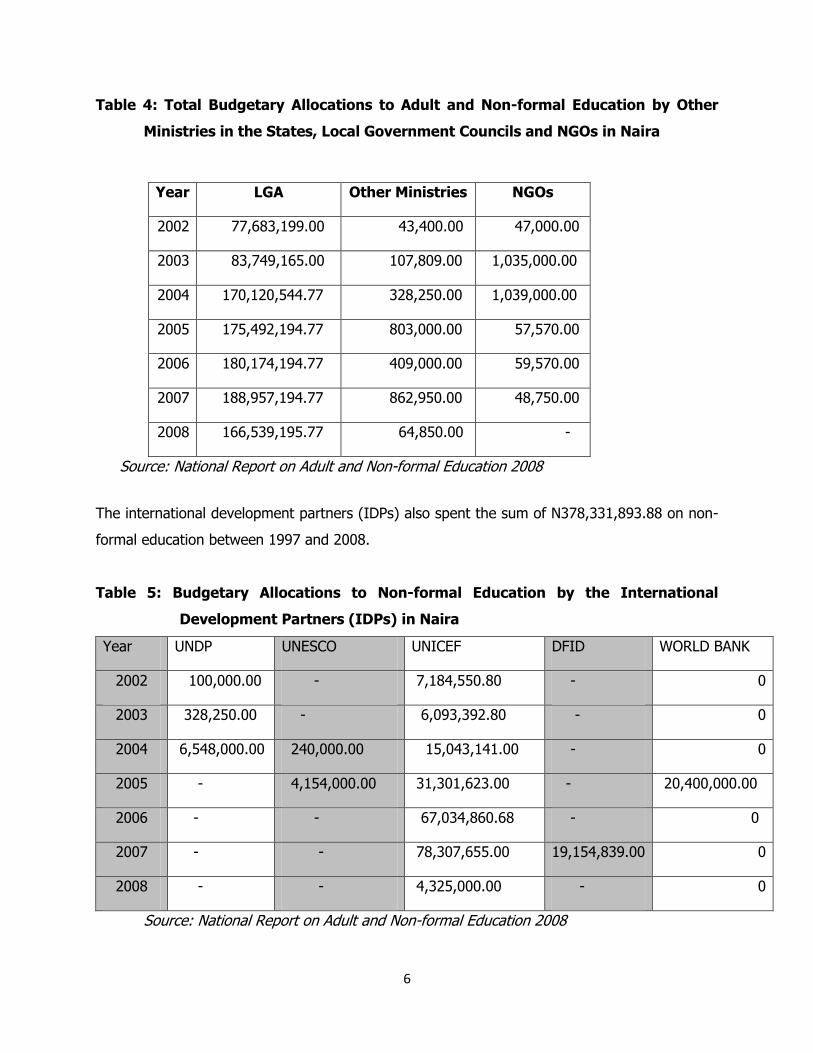
Table 4: Total Budgetary Allocations to Adult and Non-formal Education by Other
Ministries in the States, Local Government Councils and NGOs in Naira
Year LGA Other Ministries NGOs
2002 77,683,199.00 43,400.00 47,000.00
2003 83,749,165.00 107,809.00 1,035,000.00
2004 170,120,544.77 328,250.00 1,039,000.00
2005 175,492,194.77 803,000.00 57,570.00
2006 180,174,194.77 409,000.00 59,570.00
2007 188,957,194.77 862,950.00 48,750.00
2008 166,539,195.77 64,850.00 -
Source: National Report on Adult and Non-formal Education 2008
The international development partners (IDPs) also spent the sum of N378,331,893.88 on non-
formal education between 1997 and 2008.
Table 5: Budgetary Allocations to Non-formal Education by the International
Development Partners (IDPs) in Naira
Year UNDP UNESCO UNICEF DFID WORLD BANK
2002 100,000.00 - 7,184,550.80 - 0
2003 328,250.00 - 6,093,392.80 - 0
2004 6,548,000.00 240,000.00 15,043,141.00 - 0
2005 - 4,154,000.00 31,301,623.00 - 20,400,000.00
2006 - - 67,034,860.68 - 0
2007 - - 78,307,655.00 19,154,839.00 0
2008 - - 4,325,000.00 - 0
Source: National Report on Adult and Non-formal Education 2008
7
It can be concluded from the above that funding of non-formal education from public, private,
IDPs and NGOs has improved in the last ten years. However, in view of the current illiteracy
rate in Nigeria, there is need to further improve the funding of non-formal education.
2.0 OVERARCHING VISION FOR THE NATIONAL LITERACY ACTION PLAN
The target of the National Literacy Action Plan is to make 4 to 5 million adults and youth
acquire basic literacy skills by 2015.
3.0 Objectives of the Action Plan
The developmental goal of the programme is to accelerate and underpin national efforts to
achieve EFA goals, in particular goals 3, 4 and 5 and ultimately contribute to the achievement of
the national development goals of empowerment of people, wealth creation and economic
growth.
The main objective is to strengthen the national capacity for designing, delivering, and
evaluating and monitoring quality literacy programmes by focusing on the following strategic
areas of action: policy review and analysis, advocacy and communication, addressing the
persistent gaps in capacity, innovations and good practices, and effective partnerships in
support of literacy.
4.0 Beneficiaries
The ultimate beneficiaries will be those who have not been reached, or the marginalized
and/or excluded by the education system, mainly young girls and women, youth and out-of-
school children, and vulnerable populations and groups who have suffered from decades of
prejudice, marginalization, discrimination and even exclusion, particularly in urban slums and
rural areas.
The immediate beneficiaries will be the policy makers, adult literacy planners, programme
managers, curriculum developers, facilitators and those responsible for quality assurance at
federal and state levels. Their skills and capabilities will be enhanced through a wide range of
capacity development interventions in the areas of policy formulation, programme design,
management and delivery, quality assurance, resource mobilisation, and building partnerships.
5.0 Proposed activities (with expected outputs, outcomes and indicators)
Programme delivery improved to make four to five million adults and youth acquire basic
literacy skills by 2015. Non-Formal pathways developed to provide opportunities for out-of-
school children, youth and adults.
(See table on pages 11 – 24 for activities, expected outputs, outcomes and indicators).
8
6.0 Implementation management
The following Agencies/ institutions would be involved in implementation:
Federal Ministry of Education, National Mass Education Commission (NMEC), State Agencies for
Mass Education (SAMEs), National Commission for Nomadic Education (NCNE), National
Teachers’ Institute (NTI), National Open University of Nigeria (NOUN), National Bureau of
Statistics (NBS), National Planning Commission (NPC), Nigerian National Council on Adult
Education (NNCAE), Civil Society Action Coalition on Education for All (CSACEFA), Non-
governmental Association for Literacy Support Services (NOGALSS), Reading Association of
Nigeria (RAN), UNESCO Institute for Statistics (UIS), Action Aid, and UNICEF (Nigeria).
7.0 Existing Resource Institutions
Facilities exist at the National Centre for Mass Literacy, Adult and Non Formal Education in
Kano, and the Bauchi State Adult and Non Formal Education Training Institute including the
Centre for Literacy Training and Development for West Africa, (CLTDWA).
8.0 Main Partners:
The Federal Government,
Office of the Special Assistant to the President on the MDGs
Federal Ministry of Education
Federal Ministry of Finance
National Planning Commission
Federal Ministry of Women Affairs
Federal Ministry of Agriculture
IDPs
State and Local Education Authorities
National Directorate of Employment /Small and Medium Enterprise Development
Agency of Nigeria
Philanthropic organizations and foundations
The Private sector
Civil Society Organizations (CSOs)
Individual contributions through regular annual fund-raising events.
The States and the Federal Capital Territory (FCT) are expected to make budgetary allocation
for the implementation of the programme, and especially to make financial contributions for the
rehabilitation/establishment of Resource Centres, Literacy Centres, and for the payment of
literacy teachers.
9.0 Reporting, Monitoring and Evaluation
The monitoring and evaluation activities will be anchored in the National Centre for Mass
Literacy in Kano and NMEC’s 6 zonal offices. There will be routine monitoring visits by the

9
Federal Inspectorate Service (FIS) NMEC, and SAME officials followed by a participatory end-of-
year evaluation. A mid-term evaluation of programme implementation will be carried out half-
way the programme period while an external evaluation will be conducted at the end of
programme implementation. The project management and steering committees will conduct
routine monitoring of the programme implementation through regular visits by FIS, NMEC and
SAME officials.
10.0 Potential risks
Political commitment
Timely release of funds
Inadequate number of facilitators
Availability of credible data
Availability of experts
Community involvement
Adequate funding
Effective inter-sectoral collaboration and cooperation
Adequate articulation of international development support and interventions
Effective inter-sectoral collaboration and cooperation
All stakeholders buy-in
11.0 Estimated Budget for 2012-2015:
Funds-in-Trust with UNESCO = $6,468,233
Potential Funding sources:
-Government’s annual budgetary allocation;
-Financial support from IDPs, Private sector, CSOs and NGOs.
12.0 Calendar for implementation of proposed Activities: 2012-2015 (See pages 11 – 24)

10

11
NATIONAL STRATEGIC FRAMEWORK FOR ADULT AND YOUTH LITERACY
Expected Result 1: Program delivery improved to make 4-5millions adults and youth acquire basic literacy skills by 2015
Activities Performance
Indicators
Means of Verification Cost Time Frame Responsible
(Institution,
Focal Person…)
Risks and
Assumptions
1. Enhance the
pedagogical and
managerial
capacities of
facilitators
200,000 trained Reports from training
institutions & NMEC
CBMC
April- Sept.
2012 before
the Launch)
Training
institutions
NMEC/
SAME
Inadequate
number of
facilitators
Adequate funding
2. Produce and
distribute
multilingual
learning/teaching
materials
including audio
visuals materials,
primers/text
books, facilitators
guide, reading for
pleasure and post
10,000,000
primers/text books
& 200,000
facilitators guide
NME C
SAME
Learners
CBMC
As above
NMEC
Adequate funding
Funds
Timely release of
budgetary funds
Delay in supply to
states Safety &
security challenges

12
literacy
3. Capacity building
of facilitators for
proper
management,
record keeping
and
documentation to
ensure
accountability
200,000 facilitators
keeping proper
records
NMEC
SAME
CBMC
April –SEPT
2012
NMEC
SAME
CBMC
4. Establish and
institutionalize
Centre-Base
Management
Committee to
ensure quality of
literacy
programme,
efficiency and
effectiveness of
centres
No of functional
CBMC in Place/
State /LGA
NMEC
SAME
CBMC
April-May
2012
NMEC
SAME
NGOs, CBOs,
FBOs
Non commitment
of some members
5. Provide ICT and
small generators
in the selected
model centre in all
7,740 computers NMEC
SAME
April-May
2012
NMEC
SAME
Maintenance
Security challenge
Inadequate power
13
LGAs
CBMC
Learners
CBMC
Learners
supply
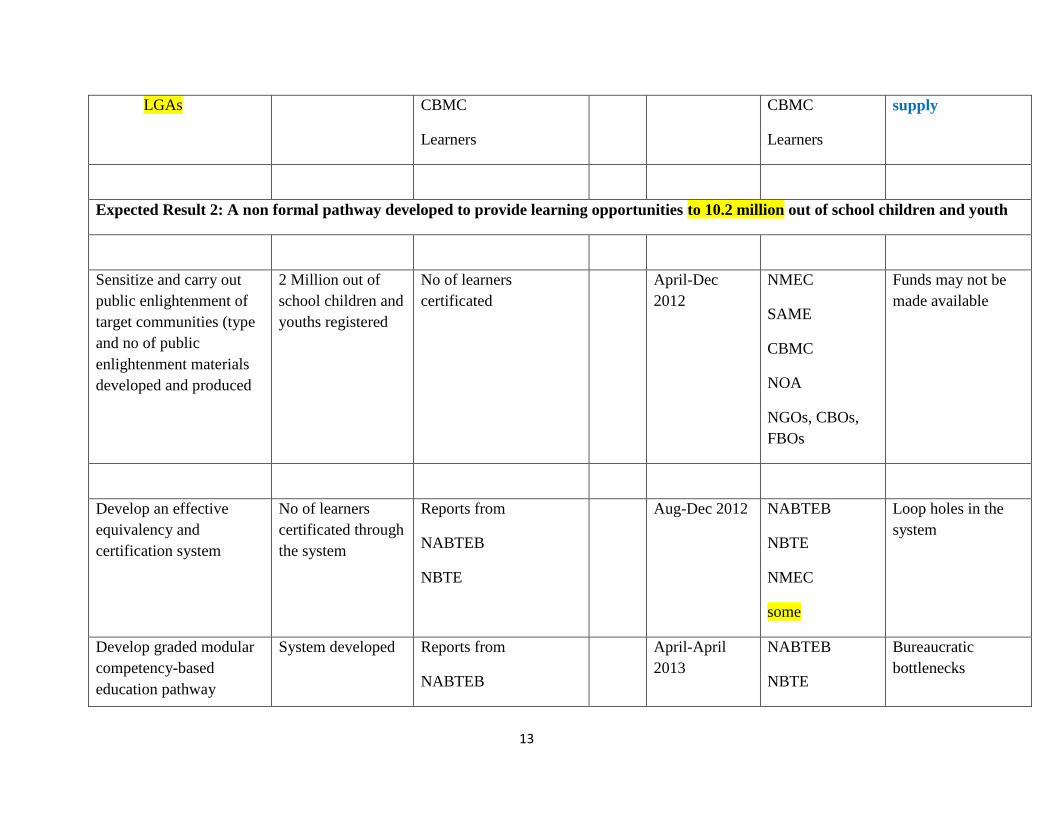
Expected Result 2: A non formal pathway developed to provide learning opportunities to 10.2 million out of school children and youth
Sensitize and carry out
public enlightenment of
target communities (type
and no of public
enlightenment materials
developed and produced
2 Million out of
school children and
youths registered
No of learners
certificated
April-Dec
2012
NMEC
SAME
CBMC
NOA
NGOs, CBOs,
FBOs
Funds may not be
made available
Develop an effective
equivalency and
certification system
No of learners
certificated through
the system
Reports from
NABTEB
NBTE
Aug-Dec 2012 NABTEB
NBTE
NMEC
some
Loop holes in the
system
Develop graded modular
competency-based
education pathway
System developed Reports from
NABTEB
April-April
2013
NABTEB
NBTE
Bureaucratic
bottlenecks

14
starting with basic
education module to
technical /vocation
module
NBTE
NMEC
SAME
NERDC
NMEC
SAME
NERDC
Link learners with the
mentors/facilitators
No of out-of-school
children and youths
enrolled at the
centres/LGA/CEN
TRES
Reports from
CBMC
SAME
NMEC
Learners
CBMC
SAME
NMEC
NGOs, CBOs,
FBOs
Community not
sufficiently
sensitized
increased
interest from the
Community will
Withdrawers
Expected Result 3: Capacities of institutions developed in: facilitators training, curriculum design & development, program delivery,
M&E, action research and learning from effective practices
Identify resource
institutions to conduct
sensitization, trainings
and orientation
programme matching
their core competencies
with identified gaps in
their capacity
Capacities of NFE
training institutions
, NMEC, SAME,
NERDC developed
Report of trainings from
Training institute to
NMEC
Increased rate of
enrolment, retention and
completion
July 2012-
2013
Revitalisatio
n Committee
NMEC
Poor responses/turn
out

15
Train more facilitators at
NFE Institutes nation
wide
Additional 50,000
facilitators trained
annually
No of people trained and
certified
Reports from NMEC
SAME
Jan 2013- Dec
2014
NMEC
SAME
Training
Institutes
Lack of interest may be
shown
Organise seminars and
workshops for facilitator.
No. of facilitators
and teachers trained
Reports of Seminars and
workshops.
Jan 2013-
SEPT
NMEC. Possible attrition of
participation
Develop training module Variety of training
modules developed
Report from
Develop capacity on
learning best practices
across the globe
Meeting of Report of best practice
in place
NMEC/SAM
E
Expected Result 4: Post Literacy Policy clearly formulated and mechanism developed for enriching Literate Environment (books,
digital, newspapers, etc)
Conduct a Baseline
survey to determine
Learners mainstreaming
from basic to post
Literacy
Percentage of Adult
disaggregated
Percentage of
Youth
disaggregated
Survey Report by
NBS/NMEC
Jan-March
2013
NMEC, NPC,
NCNE
NBS, NPopC ,
NERDC, SAME
Non Compliance
by the relevant
stakeholder
Sensitize Stakeholders on
the need to implement
post literacy Policy
Number of
sensitization
programmes
carried out.
Report and Attendance
list.
6 months FME, NPSC,
NMEC, NCNE,
SAME, NOA,
FMYD, FMWA,
Strong Political
will, Timely
Release of Fund,

16
Number of
stakeholders
sensitized.
CSOs, The
Media.
Evolve a Literate
Environment strategy for
Post- Literacy
Number of strategy
tools developed
The Strategic tools
developed.
6 months FME , SMoE,
NMEC,
Universities,
CSOs,
other
stakeholders
Transfer of
Personnel,
Decrease in Budget
Allocation,
Politicization of the
activity, Instability
Train Facilitators/ for
Adult and Youth Literacy
Number of
Facilitators/Teacher
s trained
disaggregated
Attendance list,
Training Manuals,
Certificates of
Attendance,
Pictures, Reports
12months NMEC Inadequate
response/attrition
of participants
Establish more literacy
centres, with E- learning
facilities and Mobile
Libraries( for Homes,
Schools and Community
use )
Number of centres
established with E-
Learning facilities
Number of Mobile
libraries
Number of Literacy
centres established.
Number of pilot centres
with E-Learning
facilities established.
Number of Mobile
Libraries
3 years NMEC, SAME,
UNESCO
Provide more Post
Literacy Materials
Number of
Materials
developed.
Number of
Curriculum,
Textbooks,
Primers
Readers,
12-36 months NERDC, NMEC
SAME,
NABTEP
NINLAN, RAN,
Inadequate supply
of materials
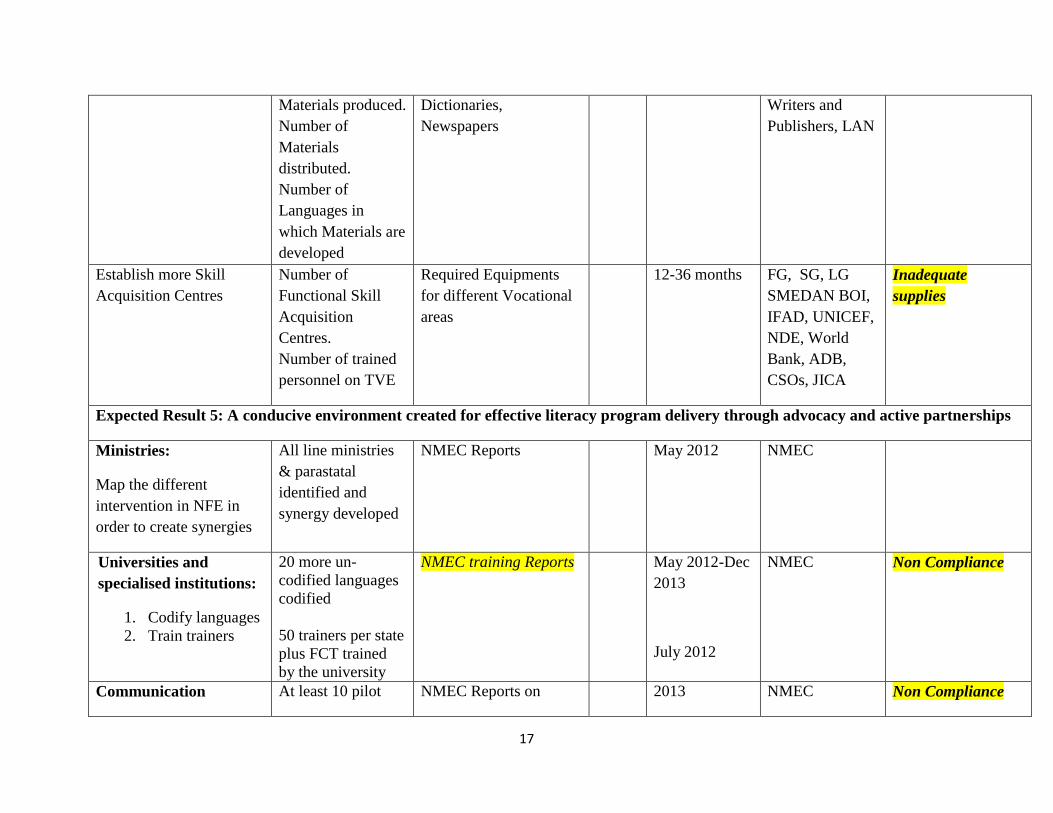
17
Materials produced.
Number of
Materials
distributed.
Number of
Languages in
which Materials are
developed
Dictionaries,
Newspapers
Writers and
Publishers, LAN
Establish more Skill
Acquisition Centres
Number of
Functional Skill
Acquisition
Centres.
Number of trained
personnel on TVE
Required Equipments
for different Vocational
areas
12-36 months FG, SG, LG
SMEDAN BOI,
IFAD, UNICEF,
NDE, World
Bank, ADB,
CSOs, JICA
Inadequate
supplies
Expected Result 5: A conducive environment created for effective literacy program delivery through advocacy and active partnerships
Ministries:
Map the different
intervention in NFE in
order to create synergies
All line ministries
& parastatal
identified and
synergy developed
NMEC Reports May 2012 NMEC
Universities and
specialised institutions:
1. Codify languages
2. Train trainers
20 more un-
codified languages
codified
50 trainers per state
plus FCT trained
by the university
NMEC training Reports May 2012-Dec
2013
July 2012
NMEC Non Compliance
Communication At least 10 pilot NMEC Reports on 2013 NMEC Non Compliance

18
companies: Promote
literacy through digital
devices (mobile phones,
internet) & instructional
materials.
centres per state
plus FCT use
mobile phones to
support literacy
skill development.
literacy provision
sources
Communities:
Support advocacy,
monitoring and feedback.
Provide learning centres/
spaces
At least 50%
increase of
Learning centres &
60:40% increase in
Female & male
enrolment
respectively.
NMEC M&E Reports Continuous NMEC
Media:
Support
Advocacy/sensitization,
Use broadcast/print media
as literacy tool.
Provide production
facilities for learning
At least 80% of
programmes
developed had been
Broadcast
NMEC Reports Continuous NMEC
Civil society
organisations and IDPs:
Develop collaborations
with C SO in running of
At least 2 active
NGOs or coalition
of NGOs per state
has been involved
in the
NMEC Reports Continuous NMEC

19
literacy classes. implementation
Publishers &
manufacturers of
electronic devices:
Produce learning
Materials
Learning Materials
(Digital and
physical forms)
exist in all codified
languages
NMEC Reports May 2012 and
continuous
NMEC
NMEC & SAME:
Ensure overall M & E,
capacity & primer
development for literacy
Programs from
Government platform
Training of 65
facilitators per
LGA trained by the
trainers on M&E
and primer
development
NMEC Reports Continuous NMEC
Expected Result 6: Policy dialogue strengthened for more support to Literacy & Non Formal Education.(LNFE)
Undertake Situation
Analysis:
i. Data collection
ii. Data entry
iii. Validation
iv. Analysis (by
urban, rural,
location and
gender)
v. Reporting
Reliable data on
Literacy and
NFE
disaggregated by
different
parameters and
levels of
government
Statistical digest of
literacy and NFE at
LGA, State, FCT and
National levels
Situation Analysis report
April – May
2012
FME, UNESCO
(implementing
partners NMEC,
SAME, SMoE,
LGEAs)
RISKS
i. Difficult
terrain
ii. Security
situation
ASSUMPTIONS
iii. Adequate
analytical
capacity
iv. Political will

20
and
commitment
v. Adequate
funding
from all
stakeholders
vi. Willingness
to
participate
vii. Attitudinal
or
behavioural
change
towards
literacy
programme
Undertake Stakeholder
Dialogue at the Local,
State and National level
through:
i. Workshop at
LGA level
ii. Workshop at
State level
iii. Workshop at
National level
iv. Policy
proposals from
recommendatio
ns
v. Media coverage
i. Number of
participants
at the 3 fora
ii. Percentage
increase in
support for
literacy
programmes
iii. Reduced
Drop-out
rate
iv. Reduced
crime rates
in the target
areas
i. List of
participants/attendan
ce at the dialogue
sessions
ii. Stakeholders report
iii. Survey reports
including those of
IDPs and
iv. NGO/CSOs
M&E reports
June 2012 FME/ NMEC,
SAME, SMoE,
LGEAs
21
(print and
electronic
media)
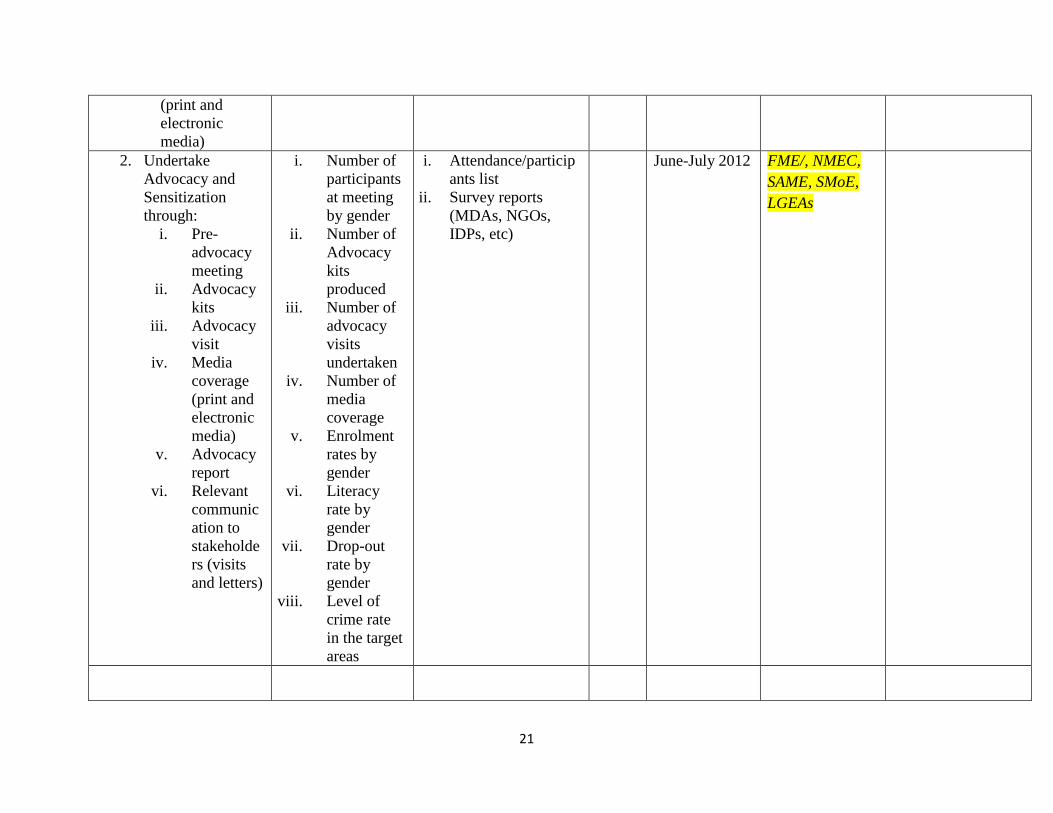
2. Undertake
Advocacy and
Sensitization
through:
i. Pre-
advocacy
meeting
ii. Advocacy
kits
iii. Advocacy
visit
iv. Media
coverage
(print and
electronic
media)
v. Advocacy
report
vi. Relevant
communic
ation to
stakeholde
rs (visits
and letters)
i. Number of
participants
at meeting
by gender
ii. Number of
Advocacy
kits
produced
iii. Number of
advocacy
visits
undertaken
iv. Number of
media
coverage
v. Enrolment
rates by
gender
vi. Literacy
rate by
gender
vii. Drop-out
rate by
gender
viii. Level of
crime rate
in the target
areas
i. Attendance/particip
ants list
ii. Survey reports
(MDAs, NGOs,
IDPs, etc)
June-July 2012 FME/, NMEC,
SAME, SMoE,
LGEAs
22
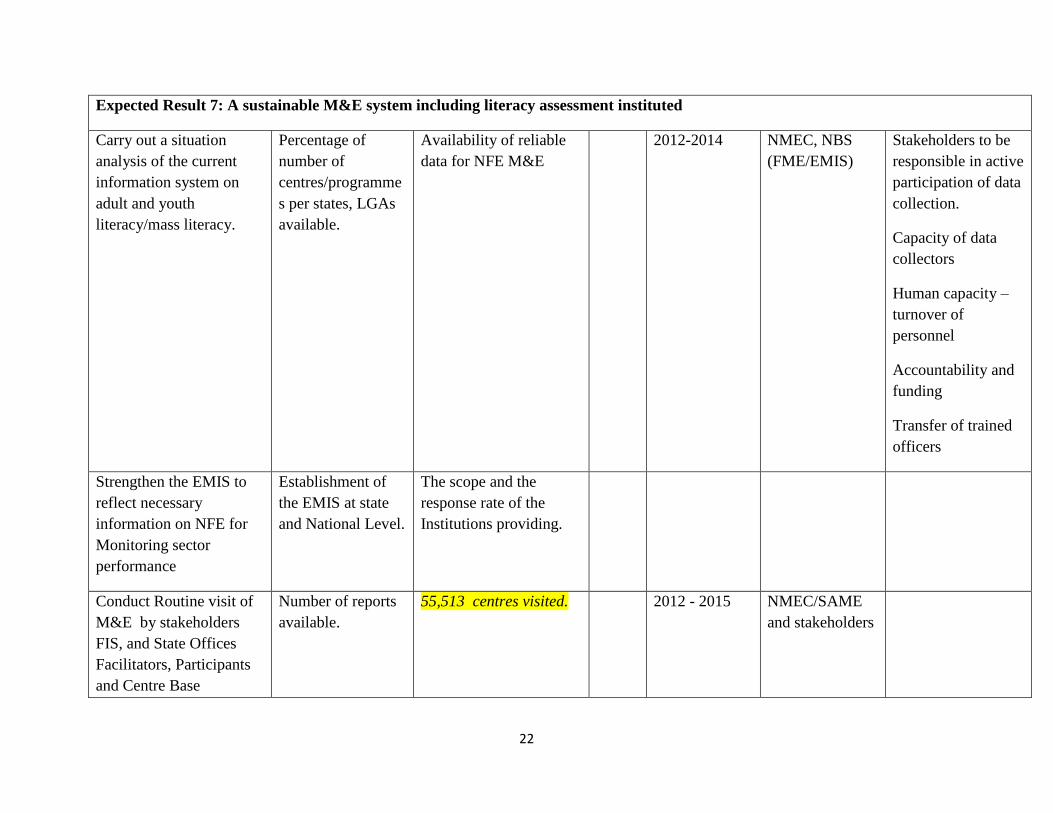
Expected Result 7: A sustainable M&E system including literacy assessment instituted
Carry out a situation
analysis of the current
information system on
adult and youth
literacy/mass literacy.
Percentage of
number of
centres/programme
s per states, LGAs
available.
Availability of reliable
data for NFE M&E
2012-2014 NMEC, NBS
(FME/EMIS)
Stakeholders to be
responsible in active
participation of data
collection.
Capacity of data
collectors
Human capacity –
turnover of
personnel
Accountability and
funding
Transfer of trained
officers
Strengthen the EMIS to
reflect necessary
information on NFE for
Monitoring sector
performance
Establishment of
the EMIS at state
and National Level.
The scope and the
response rate of the
Institutions providing.
Conduct Routine visit of
M&E by stakeholders
FIS, and State Offices
Facilitators, Participants
and Centre Base
Number of reports
available.
55,513 centres visited. 2012 - 2015 NMEC/SAME
and stakeholders

23
Management
Carryout Monthly,
quarterly, midterm and
yearly evaluation of
programme
implementation
Number of
meetings held
March 2013 NMEC/SAME
and stakeholders
Conduct participatory
midterm and final
evaluation
Availability of
report
Conduct of stakeholders
meetings
June 2014 NMEC/SAME
and stakeholders
Carry out a Literacy
survey based on the same
methodology as the NLS
2010 with additional
variable and analysis of
impact.
Availability of
survey result
NBS publication on
National Literacy
Survey 2010.
2015 NMEC/SAME
and stakeholders
Expected Result 8: LNFE policy reviewed to make it more inclusive and enabling (incorporating gender and language concerns, etc)
Engage in High level
Policy dialogue at:
LGA
State
National level
Number of
participants at
dialogue
Enrolment Rate by
gender
Policy briefs
Dialogue report
2012-2014
(evolving)
FME/ NMEC,
SAME, SMoE,
LGEAs,
legislative house
state and
national )
Inadequate
stakeholder buy in
Adequate funding
Political
commitment
Informed policy

24
review
Research on similar
issues of concern at
Local, National and
Global levels
Develop Policy briefs,
policy dialogue kits
Research on best
practices
synthesised
Summary of best
practices report/policy
briefs
Carry out Policy review
when necessary
(curriculum, facilitators
status etc)
Number of policy
items reviewed to
engender enabling
environments
Policy document
Recommended