No .. 2 NRRI SOFTWARE BULLETIN August 1985
National Regulatory Research Institute
SURVEY OF STATE COMMISSION NEEDS FOR COMPUTER SOFTWARE
An NRRI survey to assess the computer modeling needs of state commissions was completed in May 1985.. The survey found that regulatory software is currently used most extensively in the electric utility sector, followed by the telecommunications, gas, and water sectors, in that order. The survey also found that ,commissions want to increase their level of use of computer software in all utility sectors. Further, the survey results show, that across all utility sectors:
* Software packages related to the general areas of rate design and revenue requirements are needed the most.
* Among individual applications, cost-of-service is in most demand ..
* There is a substantial need for data/information management and financial/accounting programs.
Copies of the report may be ordered from the NRRI Publications Office.
AVAILABILITY OF PUBLIC DOMAIN SOFTWARE FROM STATE COMMISSIONS
The NRRI has acquired 8 computer programs from 3 state commissions, namely, California, Florida, and Illinois. These programs are nonproprietary and NRRI is making them available, free of charge, to state commissions. The following is a summary list of these programs.
Developed Name Under Function/PurEose DeveloEed by
FORMATRS dBASE II Case Processing California PUC ADVICLOG dBASE II Tariff Filings Processing California PUC TELCARS dBASE II Mailing Lis ts California PUC COSTOFCA Lotus 1-2-3 Cost-of-Capital Florida PSC FERC 423 System dBASE III Fuel Cost Data Base Florida PSC WATER & SEWER AUDIT Lotus 1-2-3 Accounting Florida PSC RRSPREAD Lotus 1-2-3 Accounting Florida PSC EXHIBIT 1 Lotus 1-2-3 Revenue Requirements Illinois CC
NRRI COMPUTER MODELS UPDATE
In the first issue of the NRRI SOFTWARE BULLETIN, we announced the availability of three microcomputer programs, namely, PROC, LOAD, and COST. PROC has cu+rently been updated to resolve memory mapping problems that may

occur when run on some IBM compatible microcomputers. The NRRI also has a number of mainframe models. The following is a summary list of all the NRRI programs.
Name
BENCOST CERES COST FACOS FRED IPUC LOAD MARGINALCOST PCS-A2 PROC RAm-II
Function/Purpose
Cost/benefit analysis of TOD rates Generating capacity expansion planning Electric cost-of-service Electric cost-of-service Electric load analysis Utility COMPUSTAT interface Electric load analysis Marginal cost of electricity calculation Electric production cost simulation Electric production cost Simulation Financial analysis (electric)
INTEGRATED SOFTWARE
Host System
Mainframe Mainframe Microcomputers Mainframe Mainframe Mainframe Microcomputers Mainframe Mainframe Microcomputers Mainframe
The NRRI is completing development of an integration procedure that links together the capabilities of individual microcomputer programs. This will enable users to perform more efficiently analyses that require the use of several programs. At the nucleus of this procedure is a database management program that maintains a commOn database which is accessible to )ndLividual application programs. The three NRRI programs (PROC, LOAD, and (COST)iare being integrated using this procedure to fonn an integrated \sof/tware package for electric load and cost analyses. The package is expected to be available by the end of September 1985.
. WASHINGTON UTe. TELEPHONE DISCONNECTION STUDY
The Washington UTC has completed a statistical study of . telephone disconnections. The data collected for this study may be useful to other commissions. At the request of the Washington UTG, the NRRI is making this data set available to anyone interested in acquiring it. For more information on the contents of the data set, contact Mr. Steven King of the· Washington UTG at (206) 753-1454.
IPlease write M. Harunuzzaman, NRRI, 2130 Neil Ave-, Columbus, Ohio 43210 or call (614) 422-6774 for further information.
STATE COHHISSION NEEDS FOR COHPUTER SOFTWARE
M. Harunuzzama n Graduate Research Associate
Jeffrey Shih Institute Researcher in Engineering
THE NATIONAL REGULATORY RESEARCH INSTITUTE 2130 Neil Avenue
Columbus, Ohio 43210
May 1985
This report was prepared by The Na tional Regula tory Research Institute (NRRI) with funding provided by participating member commissions of the National Association of Regulatory Utility Commissioners (NARUC). The views and opinions of the authors do not
I'
necessarily state or reflect the views, opinions, or policies of the NRRI, the NARUC, or NARUC member commissions ..

TABLE OF CONTENTS
Section
Ie Introduction . .. . . . . . .. .. .,
II. State Commission Needs for Computer Software ..
III. Difficulties of Software Utilization .........
Appendix
Page
1
2
13
Commentary on Fulfilling Software Needs.. .. .. .. .. • .. • .. .. .. .... 18
ii


Ie Introduction
Becanse of its ahility to rapidly process large amounts of informa
tion and to accurately simulate and analyze the behavior of many diverse
systems, the computer can greatly aid state commissions in regulatory
ratemaking.. It also serves as a tool for regulatory decision-making.
Computer software has been used by some state commissions for at least a
decade and its use continues to expand.
The National Regulatory Research Institute (NRRI) has been providing
assistance to state commissions in the use of computer programs with
regulatory applications. This activity consists of developing software,
transferring it to state commissions and assisting them in running such
programs.. In order to assist the state commissions more effectively, it is
necessary to determine their software needs more precisely. The survey
reported on here was undertaken by the NRRI to achieve this objective.
Objective of the Study
Since both the computer hardware resources currently available and the
areas of application vary widely among commissions, so do their software
needs. It is intended that the findings of this study will provide both a
broad information base and a general framework, which can be used by
individual state commissions, the NRRI, and the regulatory community as a
whole to make computer software a more effective decision-making tool in
public utility regulation.
Preparation and Distribution of a Survey Form
In order to determine the software needs of state commissions, a
survey form was prepared. It was designed to gather information in the
f ollowi ng areas.
(1) The general levels of software utilization by state commissions at present.
(2) The anticipated or desired levels of software utilization by state commissions in the near future.
1


(3) Areas where new or better software is neerled.
(4) Comments from state commission staff on the difficulties of software utilization, and suggestions on how they can be addressed"
Ninety-six survey forms were mailed to the senior staff member of
every state commission, a few key individuals in regulatory areas, and
members of the NARUC Staff Subcommittee on Computers. In all, 74 responses
from commissions in 45 states and the District of Columbia were received.
Compilation of the Responses
The responses to the survey regarding soft'Y'are needs were collected
and classified according to utility sector (e.g., electric, gas,
telecommunications), and application area (e.g., cost-of-service, financial
analysis, generation planning). Also, observable patterns with respect to
software needs and software utilization difficulties were investigated and
significant ones were noted.
The Organization of This Report
This report summarizes the findings of the survey. In section 2,
state commissions' needs for software are summarized. The summary
identifies these needs by utility sector and by application area. Section
3 describes the reported difficulties associated with software utilization.
Finally, some possible approaches that may be used to improve software
utilization in order to fulfill state commissions' needs are discussed in
the appendix"
II. State Commission Needs for Computer Software
The software needs of a state commission depend on the number and
sizes of the utility companies under its jurisdiction, and the relative
complexity of its regulatory methodology and procedures. For example, one
state commission may use computer models extensively in the electric
2


sector, moderately in the telecommunications sector, and not at all in the
gas sector. The pattern may be completely reversed for another state
commission. Because of the functional differences among utility sectors,
the programming logic and data requirements of individual application
programs may vary from one sector to another. This may require application
programs to be sector-specific, although it is sometimes possible to
develop multi-utility applic~tion programs ..
In the current study, the survey responses were classified by utility
sector. Within each utility sector, they were further divided into broad
functional categories and individual application areas. For example, the
rate design category within the electric utility sector includes cost of
service and fuel adjustment analysis. It should be mentioned here that the
broad functional categories are neither independent nor mutually exclusive,
and are only chosen to provide an easy, understandable ordering of the
application areas.
In the following sections, the results of the survey are reported.
Results on the current and the desired future usage levels of regulatory
software by utility sector are presented first. This is followed by the
results for regulatory software needs organized by utility sector,
functional category, and application area.
Levels of Software Utilization
One important indicator of the software needs of a state commission is
its current levels of use of software. Current usage reflects the relative
volume of regulatory tasks being supported by computer software in various
utility sectors. Table 2-1 shows the current levels of software utiliza
tion by utility sector. Regulatory software appears to be most extensively
used in the electric utility sector, followed by telecommunications, gas,
and w.ater utility sectors, respectively_
The respondents were also asked to indicate the level of desired
future use of computer softw.are in each utility sector, and the responses
are summarized in table 2-2. It shows significant increases from current
usage levels in all sectors, especially in the telecommunications and gas
3


TABLE 2-1
NUMBER OF COMMISSIONS (OUT OF 46 RESPONDING) THAT USE COHPUTE R SOFTWARE FO R REGULA TO RY ANAL YS IS, BY LEVEL OF US E
AND BY UTILITY SECTOR
Number of Commissions at the Level of Use Utility Sector Heavy Moderate Light Total
Electric 21 12 4 37
Telecommunications 5 15 11 31
Gas 10 13 6 29
Water 4 8 12 27
Other 5 4 2 11
TABLE 2-2
Nill1BER OF COMMISSIONS (OUT OF 46 RESPONDING) THAT WANT TO USE COMPUTER SOFT'(.JARE, BY DESIRED LEVEL OF USE
AND UTILITY SECTOR
Number of Commissions at the Level of Use Utility Sector Heavy Moderate Light Total
Electric '1'1 7 1 41 J.J
Telecommunications 22 17 2 41
Gas 20 14 5 39
Water 11 11 7 29
Other 7 4 0 11
4


sectors in terms of percentage increases. There is also an obvious shift
in usage levels from the moderate and light categories to the heavy
category across all utility sectors. While the above results are based on
subjective perceptions 'of software users in the regulatory community, they
correspond well to the current trend of proliferation of software and
penetration of its usage in the information management and analytical
functions of almost every sector of business and industry.
Regulatory Software Needs
Respondents to the survey were asked to indicate their needs for new
or better software and the results are shown in the following five tables.
Each table summarizes the results for a given utility sector. As mentioned
in section 1, there were 74 respondents from 46 commissions. While tables
2-1 and 2-2 deal with numbers of commissions, the remaining tables concern
the number of respondents. In each table, the number of respondents ex
pressing a need in each application area is reported. Respondents had the
option of indicating needs in more than one application area; therefore,
the total number of expressions of need for software usually exceeds the
number of respondents. This number is shown in a footnote to each table
where appropriate. The following is a summary of results obtained for each
utility sector.
Electric Utility Sector
By far the largest number of respondents (45 out of 74) expressed a
need for electric utility-related software (table 2-3). A~ong the broad
categories, rate design scored the highest on the number of responses,
which is 33. ~~ithin the rate design category as well as among all
individual application areas, the highest number of responses (i.e., 20)
was received in the cost-of-service area. A close second to the rate
design category is the revenue requirements category, with the highest
demand for a production costing program (11 responses). Among individual
application areas, cost of service is followed by load forecasting (16
5


TABLE 2-3
STATE COMMISSION NEEDS FOR NEW OR BETTER SOFTWARE IN THE ELECTRIC UTILITY SECTOR
Rate Design General
Application Area
Billing Analysis Cost of Service Fuel Adjus tment Small Power Producer Rates
Revenue Requirements General Depreciation Fixed Charge Computation Fuel Cost Rate Ba.$e Production Costing Income Tax Analysis
Forecasting General Fuel Price Forecasting Fuel Supply Forecasting Load Forecasting
Financial/Accounting General Accounting Audits Capital Structures Cost of Capital/Rate of Return Stock Analysis
Planning . Capacity Planning Corporate Planning Utility Resource Planning
Data/Information Management General Legal Decisions Data Base Rate Case Management Utility Data Base Statistical Analysis
Monitoring/t-Ianagement Construction Monitoring/Management Load Analysis Power Plant Performance Capacity Utilization Job Scheduling Safety Analysis Fuel Inventory
Number of Responses 1
7 4
20 1 1
D
7 4 1 2 1
13 1
29
7 1 1
16 E
7 3 2 1 8 1
22
14 1 2
IT
8 1 2 3 1
15
3 4 1
1 4
15
10f the respondents, 45 expressed a need for electric utility-related software. Individual respondents may have software needs in more thaq one application area, i.e., more than one response.
6


responses) and capacity planning (14 responses) underscoring the importance
of the forward-looking component of regulatory decision-making.
Gas Utility Sector
Twenty-three of the respondents expressed a need for gas utility
related software (table 2-4). As in the electric utility sector, the
highest number of responses was received in the rate design category (21
responses). It was followed by revenue requirements, which received 15
responses. Cost of service received the highest number of responses (11
responses) among individual application areas. It was followed by the
cost-of-capital/rate-of-return area (7 responses).
Telecommunications Utility Sector
Thirty-two of the respondents expressed a need for telecommunications
utility-related software (table 2-5). Again, the highest demanded category
was rate design (30 responses). In this sector, however, the revenue
requirements category scored lower (14 responses) than the financial/
accounting category (18 responses). Among individual application areas,
cost of service again scored the highest (18 responses).
Water Utility Sector
Sixteen of the respondents expressed a need for water utility-related
software (table 2-6). Among the broad categories, roughly equal numbers of
responses were received for financial/accounting (9 responses), rate design
(9 responses), and revenue requirements (10 responses).
Multi-Utility and Other Sectors
A very small number of responses (less than 4) called for application
areas in multi-utility or other utility sectors. They are presented,
without further discussion, in table 2-7.
7

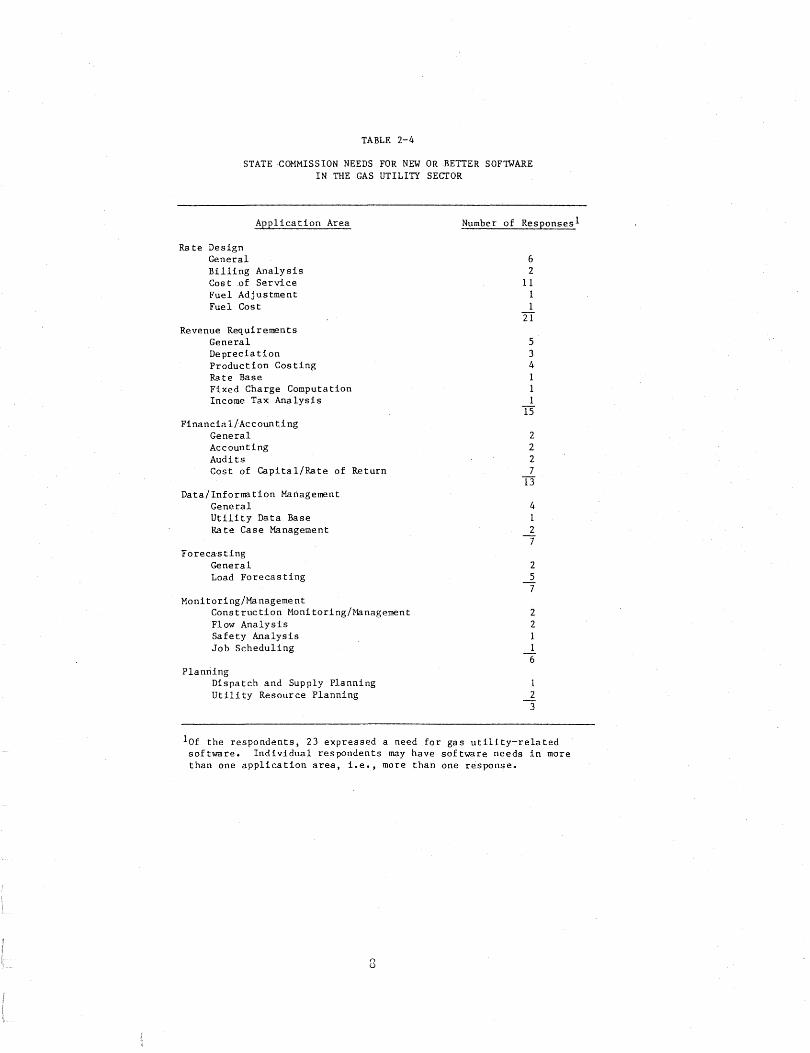
TABLE 2-4
STATE COMMISSION NEEDS FOR NEW OR BETTER SOFTWARE IN THE GAS UTILITY SECTOR
Ra te Design General
Application Area
Billing Analysis Cos tof Service Fuel Adjustment Fuel Cost
Revenue Requirements General De precia tion Production Costing Rate Base Fixed Charge Computation Income Tax Analysis
Financial/Accounting General Accounting Audits Cost of Capital/Rate of Return
Data/Information Management General Utility Data Base Rate Case Management
Forecasting General Load Forecasting
Monitoring/Management Construction Monitoring/Management Flow Analysis Safety Analysis Job Scheduling
Planning Dispatch and Supply Planning Utility Resource Planning
Number of Responses 1
6 2
11 1 1
TI
5 3 4 1 1 1
15
2 2 2 7
13
4 1 2
7"
2 5
7"
2 2 1 1
(;
1 2
"3
lOf the respondents, 23 expressed a need for gas utility-related software. Individual respondents may have software needs in more than one application area, i.e., more than one response.
[3


TABLE 2-5
STATE COMMISSION NEEDS FOR NEW OR BETTER SOFTWARE IN THE TELECOMMUNICATIONS UTILITY SECTOR
Application Area
Rate Design General Access Charge Analysis Billing Analysis Cost of Service Separations Model
Financial/Accounting General Accounting Audits Cost of Capital/Rate of Return Stock Analysis
Data/Information Management General Legal Decisions Data Base Rate Case Management Tariff Computerization Survey Questionnaire Analysis
Revenue Requirements General Depreciation Fixed Charge Computation Income Tax Analysis
Forecasting General Load Forecasting
Monitoring/Management
Other
Cons truction }1oni toring/Ma nagement Field Engineering Load Analysis Quality of Service
Independent Settlements Territorial Boundaries
Number of Responses l
8 1 1
18 2
30
5 2 2 8 1
18
8 1 3 1 1
14
7 5 1 1
14
2 5
7
2 1 2 1
6"
1 2"
10f the respondents, 32 expressed a need for telecommunications utility-related software. Individual respondents may have software needs in more than one application area, i.e., more than one response.
9


TABLE 2-6
STATE COMMISSION NEEDS FOR NEW OR BETTER SOFTWARE IN THE WATER UTILITY SECTOR
Application Area
Revenue Requirements General Depreciation Fixed Charge Computation Income Tax Analysis Production Costing
Financial/Accounting General Accounting Cost of Capital/Rate of Return
Rate Design General Billing Analysis Cost of Service
Data/Information Management General Legal Decisions Data Base Rate Case Management Utility Data Base
Honitoring/Managernent Construction Monitoring/Management Pressure Flow Analysis Weather Program Water System Analysis Utility Comparative Analysis
Number of Responses 1
5 1 1 1 2
TO
2 4 3
9"
2 3 4 9
3 1 2 1 7
2 1 1 1 1 6
10f the respondents, 16 expressed a need for water utility-related software. Individual respondents may have software needs in more than one application area, i.e., more than one response.
10

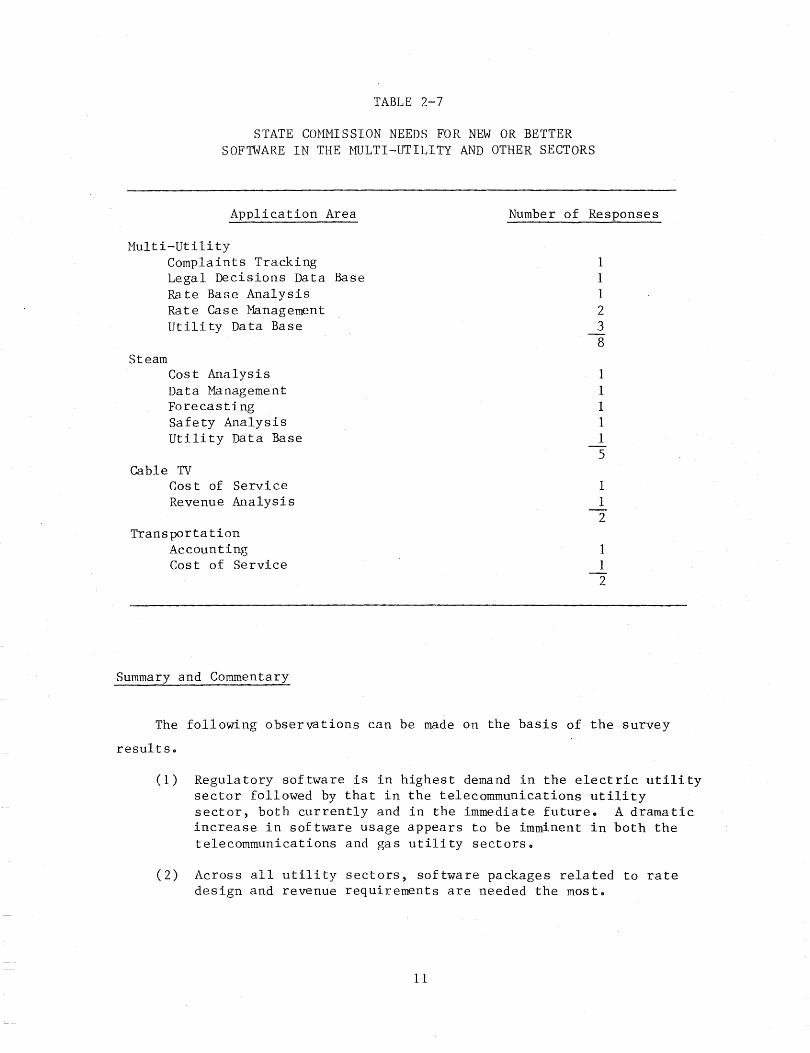
TABLE 2-7
STATE COHHISSION NEEDS FOR NEW OR BETTER SOFTWARE IN THE :tvIDLTI-UTILITY AND OTHER SECTORS
Application Area Number of Responses
Multi-Utility
Steam
Complaints Tracking Legal Decisions Data Base Rate Base Analysis Rate Case Management Utility Data Base
Cost Analysis Data Management Forecasting Safety Analysis Utility Data Base
Cable TV Cos t of Service Revenue Analysis
Trans porta tion Accounting Cost of Service
Summary and Commentary
1 1 1 2 3 8
1 1 1 1 1 5
1 1 2
1 1 2
The following observations can be made on the basis of the survey
results"
(1) Regulatory software is in highest demand in the electric utility sector followed by that in the telecommunications utility sector, both currently and in the immediate future" A dramatic increase in software usage appears to be imminent in both the telecommunications and gas utility sectors"
(2) Across all utility sectors, software packages related to rate design and revenue requirements are needed the most"
11


(3) Across all utility sectors, cost of service is the most demanded application area for computer software.
(4) Across all utility sectors, there is a substantial need for data/information management and financial/accounting programs.
In addition, a majority of survey respondents indicated that they
either have or are in the process of acquiring microcomputers and would
prefer to see the development of new microcomputer-based application
programs and the conversion of existing mainframe programs for use on
microcomputers. This suggests that the microcomputer is emerging as the
preferred hardware tool for regulatory software use.
The state commissions' software needs, as presented in the preceding
sections, should be viewed in the light of several interrelated factors.
Two such factors are discussed here.
The availability of computer resources may indirectly influence the
perception of need. Such computer resources can include internal
resources, such as computer hardware installed and application programs
developed at the commission, as well as external resources such as software
packages available from commercial vendors. For example, suppose that a
state commission selected a particular computer system for use at a par
ticular division. The decision may have been dictated by conditions and
resources available then. This particular commission may now wish to
acquire only software compatible with the existing computer system because
the cost of replacing it would be prohibitive. In addition, since the
staff maybe more experienced in using this computer, the assessment of
software needs of the commission may be slanted toward those of that
division. This hypothetical example reflects a case in which a completely
objective assessment of needs may be difficult because of historical
factors and practical constraints.
This leads to another factor that is important in the evaluation of
software needs of state commissions, namely, that these needs change over
time. This is because (1) regulatory policies, methods, and procedures are
subject to change in individual utility sectors and (2) data processing
12


technology continues to make significant advances leading to vastly
increased storage capabilities and processing speeds on the hardware side,
and enhanced user interface and programming flexibility on the software
side ..
III.. Difficulties of Software Utilization
In spite of its extensive use by state commissions, the full potential
of computer software as a tool for regulatory decision-making is far from
being realized.. Certain difficulties hinder development, dissemination,
and implementation of computer software from being truly responsive to the
regulatory needs of state commissions. These difficulties, as reported by
survey respondents, are listed insummELry -tn.rID.in table 3-1 and are_
discussed in the following sections.
TABLE 3-1
DIFFICULTIES WITH SOFTWARE UTILIZATION IN PUBLIC UTILITY REGULATION
Difficulty
Internal Resources Acquisition Applicabili ty User Interface Compatibility Cost Reliability Communication
Number of Responses 1
28 20 12
8 7 6 5 3
1A total of 74 respondents returned the completed survey questionnaire.
13

Internal Resources
By far the largest number of respondents (28) cited lack of internal
resources as an obstacle to software utilization. The perceived problem
consisted of lack of trained personnel, insufficient time allocation for
computer jobs, and lack of computer equipment. This set of constraints
hinders the efficient 'use and proper maintenance of regulatory software.
They also make the in-house development of software particularly
difficult ..
Acquisition
Due to funding and administrative constraints that may be present in a
state commission, the process of acquiring computer software and useful
data can be significantly hindered.. Among those surveyed, 20 cited
acquisition as a major problem of computer software utilization.
Applicability
Among those surveyed, 12 cited lack of applicability_as a difficulty
in software utilization.. A given software package is usually developed on
the basis of a chosen set of assumptions and uses an appropriate analytical
scheme. Also, the input and output features of the package may also be
chosen according to some criterion. All of the above choices may be dic
tated by the particular needs of a state commission at a given time. If
another state commission chooses to USe the same software package, it may
run into difficulties. The basic assumptions of the model may not hold
equally for another state commission due to different regulatory policies,
standards, and practices. Examples of such intercommission policy differ
ences exist in the areas of cost-of-service analysis (e.g., marginal vs.
embedded costs) and rate base determination (e.g., CWIP vs. AFUDC).
Further, the level of analytical sophistication incorporated into the model
may be inadequate to suit the needs of other commissions. Finally, the
14


input requirements and desired output features may also be different among
state commissions. The choice of output features is especially important
when these outputs are used in regulatory proceedings. Therefore, two
state commissions may not be able to use the same application prog~am even
if it is based on the same regulatory principle because other features of
the package do not match their needs equally_
The problem of inapplicable methodology may be avoided by carefully
pre screening the related documentation before acquiring any program--and
should be done at all instances. Some of the problems regarding data
requirements and output features can also be avoided by the same practice.
However, inadequate documentation can obstruct a clear understanding of how
to operate the program and what to expect from its outputs, and thus make
all attempts at prescreening ineffective.
User Interface
One problem, perhaps most widely discussed in the software community,
is the unacceptably high amounts of time, effort, and skills needed by
users of a new program to learn its features, to make it operational, and
to produce meaningful outputs. This problem of insufficient user interface
was cited as an obstacle by 8 respondents.. This problem is usually caused
by hard-to-follow programming structures, lack of user options, too high a
req uirement for input prepara tion, and poor documentation. Among the 8
respondents who cited inadequate user interface as a problem, 6 identified
poor documentation as a major cause. It can lead to improper understanding
of the methodology, programming structure, input requirements, and output
features of the program.
Compatibility
The last decade has seen a dramatic proliferation of operating
systems, programming languages, and application software, especially for
microcomputers. The resulting diversity presents a rather significant
15


problem of program compatibility, such as those between different operating
systems~ There are other, more subtle forms of incompatibility, which are
not discovered until after attempting to use a program. For example, so
called "IBM compatible" computer hardware usually requires special
interfaces before it can support IBU software.. Similarly, much of the "IBM
compatible" software may not run on either IBM or "IBM compatible" machines
without some conversions because of minor differences in coding detail
(e.g., special characters) between them and original IBH software. The new
users, and in many cases even experienced users, are caught by surprise by
such incompatibilities and their work may be delayed considerably by such
unanticipated problems. Among those surveyed, 7 cited compatibility as a
problem in software utilization.
Cost
Regulatory software can often be purchased from commercial vendors ..
Six of the respondents cited the relatively high cost of commercial
software as a significant problem.
Reliability
One significant roadblock to software utilization in public utility
regulation is the lack of validation or bench-marking of application
programs. Commission staff are often surprised by unanticipated "bugs"
during the operation of a program. One respondent even complained of -
problems during installation (copying programs, data files, etc.) of a
program. Reliability was cited as a problem by 5 of the respondents.
Communication
Three of the respondents complained of ineffective communication
between the users and suppliers of software. Two different kinds of
communication problems were cited. One is the lack of follow-up assistance
16


from the suppliers to the users. The other is the lack of published
information on available software. (The latter problem should be partly
alleviated by the publication of the 1984 NARUC Catalog of Computer
Programs and Data Bases.)
17


APPENDIX
Commentary on Fulfilling Software Needs
It is apparent from the results presented in section 2 that there are
several areas where many state commissions have common software needs. It
would, therefore, be expedient to devise a common strategy to fulfill many
of these needs. One approach, of course, is to purchase the needed
software, if it is already commercially available.. Some other possible
approaches are discussed below. It should be understood that these
approaches are by no means mutually exclusive and may have to be combined
in a fashion chosen according to the needs of each state commission.
Sharing of Existing Software
Many state commissions have either developed or acquired public domain
software for various applications and have used them successfully. Other
state commissions that have a need for such software can acquire them by
contacting commissions that have them.. This approach may be helpful in the
following ways ..
(1) It saves the cost and effort of developing software packages that might already exist at other commissions.
(2) Software acquired from another commission has been already tested and "debugged," and the time and cost involved in those efforts could be saved.
(3) The communication between two commissions on the use of software is usually more effective because of their common perspective than that between a commission and a software developer such as a commercial vendor.
There are already three resources that can be very helpful in such
sharing.. The first is the 1984 NARUC Catalog of Computer Programs and Data
Bases. This catalog lists software packages by application area, utility
sector, and supporting hardware system. It also contains brief descrip
tions of the function and input-output features of each software package
18

and provides the name, address, and phone number of the contact person.
For copies of the catalog, interested users should contact the NARUC
publication office. The second is the NARUC Subcommittee on Computers.
Commission staff may wish to actively communicate their needs and concerns
to the subcommittee so that these are taken into account in its meetings ..
These meetings are held periodically to discuss problems of software
utilization in state commissions and to plan future actions. The third
resource is the NRRI.
Enhancement of Existing Software
There are software packages, either available in-house at a commis
sion or available from other sources, that could be useful if some needed
features were added. Possible features include improved user interface,
increased range of options for "what if" type analyses, improved compu
tational efficiency, added analytical capability (e.g., adding financial
analysis capability to a generation planning program), and improved output
features (e.g., graphic presentation). Because of the current popularity
of microcomputers, another and perhaps a significantly more drastic form of
enhancement, is the conversion of a mainframe program for use on a micro
computer. Such enhancements can be performed in-house by the state commis
sion or by hired software developers. In some cases, if the intended
software package is not proprietory, the NRRI may be able to perform the
needed enhancements.
Development of New Software
In some cases, development of a new software package may be needed by
a commission for any of the following reasons. One, new areas of regula
tory analysis may emerge requiring completely new software. Good examples
are the growing needs for telephone separations models and cogeneration
models. Two, a completely new analytical method with significant advan
tages over the old one may develop. In this case, modification of the
related software may be unable to incorporate the new method, which may
19


require the development of completely new software. Three, there are cases
where the total effort and cost of improving a software package may be
comparable to that of developing a completely new one incorporating the
intended features.
NRRI intends to playa role in developing new software to meet state
commission needs8
20

Recommended