Buckets of Water into the ocean:
Non-Public Revenue in Public Charter and
Traditional Public Schools
Meagan BatdorffAlbert Cheng
Larry MaloneyJay F. May
Patrick J. Wolf
June 2015
Buckets of Water into the Ocean:Non-Public Revenue in Public Charter and
Traditional Public Schools
Meagan Batdorff
Albert Cheng
Larry Maloney
Jay F. May
Patrick J. Wolf
June 2015
School Choice Demonstration Project Department of Education Reform
University of Arkansas 201 Graduate Education Building
Fayetteville, AR 72701479-575-6345
http://uaedreform.org/non-public-revenue-in-public-charter-and-traditional-public-schools
The University of Arkansas
was founded in 1871 as the flagship institution
of higher education for the state of Arkansas.
Established as a land grant university, its mandate was threefold: to teach students, conduct
research, and perform service and outreach.
The College of Education and Health Professions established the Department of Education
Reform in 2005. The department’s mission is to advance education and economic development
by focusing on the improvement of academic achievement in elementary and secondary
schools. It conducts research and demonstration projects in five primary areas of reform:
teacher quality, leadership, policy, accountability, and school choice.
The School Choice Demonstration Project (SCDP), based within the Department of Education
Reform, is an education research center devoted to the non-partisan study of the effects of
school choice policy and is staffed by leading school choice researchers and scholars. Led by
Dr. Patrick J. Wolf, Professor of Education Reform and Endowed 21st Century Chair in School
Choice, SCDP’s national team of researchers, institutional research partners and staff are
devoted to the rigorous evaluation of school choice programs and other school improvement
efforts across the country. The SCDP is committed to raising and advancing the public’s
understanding of the strengths and limitations of school choice policies and programs by
conducting comprehensive research on what happens to students, families, schools and
communities when more parents are allowed to choose their child’s school.

Buckets of Water into the Ocean: Non-Public Revenue in Public Charter and Traditional Public Schools
ContentsExecutive Summary . . . . . . . . . . . . . . . . . . . . . . . . . . . . . . . . . . . 5
Non-Public Revenue in Public Charter and Traditional Public Schools . . . . . . . . . . . . . . . . . . . . . . . . . . . . . . .7
Appendix A . . . . . . . . . . . . . . . . . . . . . . . . . . . . . . . . . . . . . . . . . . 26
Appendix B . . . . . . . . . . . . . . . . . . . . . . . . . . . . . . . . . . . . . . . . . . .32
About the Authors . . . . . . . . . . . . . . . . . . . . . . . . . . . . . . . . . . . 35
Buckets of Water Into the Ocean: Non-Public Revenue in Public Charter and Traditional Public Schools5
Executive SummaryPublic education funding relies on revenues from a variety of sources, from local taxpayers to federal programs
targeting students with specific needs. The vast sum of funding collected—in excess of $600 billion annually—
often masks which entities fund the education of our nation’s youth. Questions of funding adequacy and equity
across school sectors, school districts and individual schools are prominent in discussions of how to improve
educational outcomes, especially for students from disadvantaged backgrounds. A year ago, our research team
published the third in a series of national studies that uncovered a general lack of equity in the funding of the
public charter school sector compared to the traditional public school (TPS) sector (Batdorff et al. 2014; Batdorff
et al. 2010; Thomas B. Fordham Institute 2005). We found major discrepancies in the funding of all public
schools, including traditional and charter. Nationally in academic year 2010-11, charter schools received a total
of $3,814 less in per-pupil revenues from all sources than did TPS—a funding gap of 28.4% that has grown
larger over time (Batdorff et al. 2014).
The funding of K-12 education comes from local, state and federal public sources, but TPS and public charter
schools also generate funding from private and philanthropic sources (see Table 2 below). In the majority of
cases, TPS received slightly more revenue ($571 per pupil) from non-public sources than did public charter
schools ($552 per pupil). Based on our 2014 national study, non-public revenue in general does not allow the
public charter school sector to close the revenue gap with traditional public schools. In fact, it makes the gap
larger (Batdorff et al. 2014).
In this follow-up to our 2014 report, we analyzed the non-public revenue received by public charter schools and
TPS in the 15 states with both substantial charter school sectors and reliable data regarding the specific sources
of non-public revenue. This is the first school funding study we know of that examines the categories of non-
public revenues in the charter and TPS sectors and the extent to which non-public revenues vary across states
and schools. We have five key findings:
1. Public schools receive large sums of money from non-public sources: almost $6.4 billion for the TPS and nearly $400 million for the public charter schools in the 15 states in our study;
2. Whether TPS or charters receive more non-public revenues on a per-pupil basis varies by state, with 12 of our states reporting more such revenue for public charter schools while three show more for TPS;
Buckets of Water into the Ocean: Non-Public Revenue in Public Charter and Traditional Public Schools

Buckets of Water Into the Ocean: Non-Public Revenue in Public Charter and Traditional Public Schools6
3. Traditional public schools receive most of their identifiable non-public revenues from food service and investment revenue, while charter schools receive most of theirs from philanthropy;
4. Philanthropic revenue varies dramatically within the charter school sector, with one-third of the charter students in our study receiving nearly 95% of all recorded charter school philanthropy and 34% of charter schools in the study reporting no philanthropic support of any kind;
5. Although charitable funds from philanthropies make up almost half of the non-public revenue in the charter sector, they account for only 2.5% of total charter revenues nationally and therefore cannot be expected to close the 21.7% total funding gap between charters and TPS in these 15 states.
Our findings reveal that both TPS and charters receive the lion’s share of their revenue from public sources –
further evidence that they are merely two different governance structures for public schools. At the same time,
both TPS and charters are involved in the private-sector economy by selling meals to their students, reaping
profits from their investments of reserve funds and competing for charitable funds. Although some charter
school networks and individual schools receive non-public revenue that covers 10-15% of the per-pupil cost of
education at their schools, no charter schools are more dependent on private funds than they are on public
funds and more than a third of charter schools receive no revenue at all from private philanthropy.
The findings of the study reveal that private philanthropy alone cannot be relied upon to close the charter
school funding gap in the U.S. Therefore, if children in public charter schools are to receive funding levels that
are equitable to their peers in TPS, significant changes will have to be made in the public school funding laws
in many states.
Acknowledgements
This study benefited significantly from our previous collaborations with Sheree T. Speakman of CIE Learning.
We are grateful to Keith Bardsley for research assistance and Marlo Crandall of Remedy Creative for excellent
graphic design and formatting enhancements. This work was made possible by a grant from the Walton Family
Foundation. We thank them for their support and acknowledge that the content of the report is entirely the
responsibility of the research team and does not necessarily reflect the positions of the Foundation or the
University of Arkansas.
Buckets of Water Into the Ocean: Non-Public Revenue in Public Charter and Traditional Public Schools7
The funding of K-12 education remains a contentious
public policy issue. Questions of funding adequacy
and equity across school sectors, school districts and
individual schools are prominent in discussions of
how to improve educational outcomes, especially for
students from disadvantaged backgrounds (Downes
& Stiefel 2008; Ladd 2008). Although scholars
are divided regarding the extent to which money
affects student outcomes in K-12 education (Jackson,
Johnson, & Persico 2015; Hanushek, 1997; Burtless
1996), there is basic agreement that more education
revenue is better so long as the increased resources
are directed towards productive educational activities
and programs (Murnane & Levy 1996). If you ask
education practitioners, the majority will say that
more resources will make their schools better.
Disputes over school funding are especially
heated when they involve public charter schools.
Charters are public schools that operate based on a
performance contract and not as part of a traditional
school district hierarchy. They often are free to
enroll students from outside of any strict geographic
boundary and to use innovative approaches in
hiring practices and instruction. Charter schools
periodically face performance reviews, and if their
performance is deemed to be unsatisfactory, they are
closed. As public schools, charters receive most of
their revenue from government sources, though most
states have separate school funding laws that apply
to charters as opposed to traditional public schools
(TPS).
Because funding laws are different for charters and
TPS, it is also possible that these two forms of public
schools receive different amounts of funding to
educate their students. To explore whether charters
or TPS receive more per-pupil revenues than the
other, three members of our research team (Batdorff,
May, and Maloney) participated in a pioneering
2005 study called Charter School Funding: Inequity’s
Next Frontier (Thomas B. Fordham Institute 2005).
Comparing charter school funding with the funding
of district schools in 27 districts in 17 states, they
found that charters received less revenue per-pupil
than TPS in 26 of the districts and 16 of the states,1
1 The only district with higher funding for charter schools was Albuquerque and the only state with a charter school funding advantage was Minnesota, the first state to establish charters. In both cases the funding differences were small and linked to special one-time grant programs for charters.
Non-Public Revenue in Public Charter and Traditional Public Schools
Buckets of Water Into the Ocean:
Introduction
Buckets of Water Into the Ocean: Non-Public Revenue in Public Charter and Traditional Public Schools8
with the charter funding gap averaging $1,801 per
student or 21.7% of total funding.
Was this finding a statistical aberration? Charter
schools were relatively new to most of the states
in that first revenue study, which was based on
financial data from the 2002-03 school year. As
charters have matured – operating for more than
20 years in some states –and have increased in
number, is it possible that the charter school
funding gap has disappeared or at least markedly
attenuated?
To determine if the charter funding gap was
fleeting, the same three members of our research
team participated in a second revenue study in
2010 called Charter School Funding: Inequity Persists
(Batdorff et al. 2010). As the title suggests, they
found that public charter schools continued to
receive less average revenue per-pupil than did
TPS. They collected revenue data from the charter
and district sectors in 24 states for the 2006-07
school year, finding that charters were funded on
average 19.2% less than TPS. The average gap was
larger in the individual districts they examined,
most of which were in urban areas, as charters
received 27.8% less revenue than TPS in those
districts.
One year ago, our research team published the
third in this series of national studies of the
funding of the public charter sector compared
to the TPS sector (Batdorff et al. 2014). We titled
that study Charter School Funding: Inequity Expands
since we found that, nationally, charter schools
received a total of $3,814 less in per-pupil revenues
from all sources compared to TPS. The charter
school funding gap that was around 20% in 2002-
Some researchers dispute our findings, claiming that charters receive less money than TPS simply because they enroll fewer low-income students and students with disabilities. TPS consequently receive more funding to provide food service, special education programs, transportation and other extra services to educate these students (Miron & Urschel, 2010). However, data from the National Center for Education Statistics (NCES) show that, nationally, public charter schools enroll a higher percentage of students who qualify for free- or reduced-price lunch than do TPS (Wolf et al., 2014). Although charter schools do enroll somewhat fewer students with disabilities (9%) than TPS (12%), each of those “missing” charter school students with disabilities would have to cost an average of $100,000 to educate in order for the small discrepancy in the enrollment of students with disabilities to completely explain the funding gap.
Other critics of our report counter that our methodology is flawed because we count as district revenue the funds received by districts that pass through the district to area charters. Traditional public schools often receive funds that are, in turn, given to charter schools. Failing to account for this funding mechanism would overstate the amount of revenue TPS receive. Critics also argue that charters might enroll a higher proportion of reduced-price lunch students than TPS but that TPS enroll a higher proportion of the very poor students who qualify for free lunch (Baker 2014). This charge that we count pass-through charter revenue as district revenue is false. We count all revenue based on where it ultimately ended up, as documented in audited financial statements, not based on where it was sent originally (see our methodology section below). The claim that charters enroll a lower proportion of free-lunch eligible students than TPS is also incorrect based on NCES data (Wolf et al., 2014).
Some researchers have additionally criticized our school revenue study for not focusing on school expenditures (Baker 2014). We maintain that a revenue study should focus on revenue, as the total revenue that an educational organization receives represents the actual amount of resources that are committed to that organization, regardless of how those resources are subsequently spent.* If one were interested in the total amount of federal taxes paid by Americans in a given year, one should not look at the total amount of federal government expenditures in that year because revenues are not the same as expenditures.
* The one source of funds that we excluded from the total for both charters and TPS is revenue from bond issuances, since those funds have to be repaid. We also excluded revenues for adult and preschool education because our study focused on revenues for K-12 education only.
Some Researchers Dispute Our Findings

Buckets of Water Into the Ocean: Non-Public Revenue in Public Charter and Traditional Public Schools9
03 and 2006-07 had grown to 28.4% in 2010-11, the
last year for which data were available (Batdorff et al.
2014). After a decade of research on charter school
funding, the data are conclusive that public charter
schools, in general and under most circumstances,
receive substantially less revenue than traditional
public schools, and the gap is increasing.
To ensure that our research captures 100% of the
dollars supporting public education, all three studies
have included non-public sources of revenue, or
what we refer to as “other.” The general label “other”
captures all of the revenue that did not clearly
belong in the federal, state, local, public-indeterminate,
or indeterminate categories.2 In our 2014 study,
“other” revenue, or what we now refer to as non-
public revenue, for TPS averaged $571 per-pupil,
slightly more than the $552 average for charters in
non-inflation adjusted dollars. Non-public revenue
made up 4.5% of total revenue for TPS and 5.7% of
total revenue for charters. What were the specific
sources of the non-public funds received by TPS and
charters? Were they similar across these two types
of sectors? These are some of the questions that
motivate this study.
Traditional public schools and public charter
schools generate revenue from sources that
do not rely on public support, such as school
lunches, transportation, returns from investments,
and most importantly for charter schools,
philanthropy. Philanthropic giving has contributed
to the expansion of charter schools in important
ways (Cohen 2007; Scott & DiMartino 2008).
2 The proportion of revenue in the “indeterminate” category was small, averaging 0.2% for TPS and 4.0% for charters. The proportion in “public-indeterminate” was even smaller, essentially 0 for TPS and 1.2% for charters.
Philanthropies provide funds to scale up and
replicate successful charter models in hopes of
improving educational opportunities for traditionally
underserved students (Lake 2007; Scott 2009). Such
activity has generated a widespread perception that
charter schools receive large amounts of revenue
from philanthropic giving, but how much of the
non-public revenue of charters is actually from
philanthropies? How evenly is that philanthropy
spread across the entire population of public charter
schools?
Some researchers have suggested that philanthropic
giving offsets discrepancies in the funding of
charter schools. In other words, charter schools
are adequately and fairly funded despite lower
investments of public dollars than TPS because
the substantial amount of philanthropic revenues
compensates for any shortfall (Baker & Ferris
2011; Forman 2007; Miron et al 2015). This report
sheds new light on this claim by examining data to
determine the extent philanthropic funds, as a type of
non-public revenue, close the charter school funding
gap. Our hope is that this report will help to clarify
how non-public revenues finance charters and TPS.
For the remainder of the report, we proceed as
follows: First, we present our research sample and
methodology. Second, we present the total amounts
of non-public revenue received by the charters and
TPS in our 15-state sample during the 2010-11 school
year. Third, we break out the non-public revenue
totals by individual state and compare the charter
and TPS sectors regarding the average amount of
non-public revenues they each receive on a per-pupil
basis. Fourth, we describe the specific sources of
non-public revenue in the charter and TPS sectors,
nationally and for individual states in our study.

Buckets of Water Into the Ocean: Non-Public Revenue in Public Charter and Traditional Public Schools10
Fifth, we look more carefully at philanthropy as a
specific source of non-public revenue for public
charter schools, especially the extent to which the
amount of philanthropic revenue varies across
schools in the charter sector. We conclude by
discussing the policy implications of our findings.
Research Methodology The goal in these education revenue studies is to
document and compare the revenue provided to
public charter schools and traditional public schools
in states and localities with a substantial presence
of charters. The aim is to collect and analyze actual
revenue data received by charters and TPS. To
accomplish this, we rely on official state sources of
K – 12 revenue data – what historians call “primary
sources.” In some states, revenues are distributed
directly to charter schools. State accounting
systems for these revenues are separate, clean and
transparent. In many other states, charter school
revenues are included in TPS total revenues after
which funds are passed through to the charter school
where students are enrolled.
When funding passes through a TPS to a public
charter school, we take extra care to identify these
pass-through government revenues and deduct them
from traditional district totals. Audited financial
statements of individual public charter schools help
us to consistently account for pass-through funds.
Whenever we can’t be certain if district revenues
passed through to charters or not, we credit the
revenue to charters. With this process, we avoid
double counting revenues within a state, as well as
inflating (TPS) or deflating (public charter schools)
the revenue received to educate students, though we
likely underestimate the total amount of revenues
received by TPS.
We acknowledge that TPS and charters sometimes
engage in different activities in support of
their students, such as providing extra meals,
transportation or tutoring. Our revenue studies
simply establish how much money has been
provided to TPS and charter schools in a given
jurisdiction, in total and on a per-pupil basis, and
where those funds came from. Questions regarding
how those resources ultimately were spent are
separate issues that are distinct from our purposes
here. We are of the school of thought that revenue
studies should be about revenues, not expenditures.
We seek to be comprehensive in our identification
of all the revenue received by both TPS and charters
that could be spent on supporting students. The only
revenues we exclude from our calculations are the
proceeds from bond issuances, since those amounts
must be repaid, as well as revenues associated
with Pre-K and adult education, since our work is
concerned with K – 12 education.
We also avoid excluding certain batches of revenue
that are spent on particular activities, such as school
lunches, transportation, or special education services.
We have adopted our comprehensive revenue
documentation methodology for three important
reasons: First, it is the only way to establish, with
validity, the total amount of revenues received by
different types of public schools. Total revenues
received, net of any pass-through funds that go to the
other sector, are descriptively accurate and reflect
the resources directed to the schools in our studies.
In that sense, our comprehensive measure of school
revenue has prima facie validity.
Buckets of Water Into the Ocean: Non-Public Revenue in Public Charter and Traditional Public Schools11
Second, we avoid excluding other specific types of
revenue besides Pre-K and adult education because
doing so easily can introduce bias in the analysis. For
example, some education funding researchers will
exclude transportation expenses from comparisons
between TPS and charter schools, since most
TPS are required by law or regulation to provide
transportation to their students while many charters
are free to do so or not. Because charters often
are not required to provide transportation, when
they do so the expenditures can be hidden within
spending line-items that are not obviously related
to transportation, such as “miscellaneous student
support services.” Under such circumstances, which
are reasonably common in the education funding
field, analysts would exclude actual transportation
expenses from the TPS side of the comparison
but not from the charter side of the comparison,
generating bias. To avoid bias, in our comprehensive
revenue comparisons we instead include all sources
of revenue for both TPS and charters.
Third, we make no subjective judgments about what
is acceptable revenue and what is unacceptable
revenue. Other researchers make such subjective
judgments, excluding large amounts of revenue from
their comparisons because they fund large school
expenditures — such as central office administration,
food service, etc. — that are larger in the TPS sector
than in the charter school sector. Our approach, pure
and simple, is to count all of the funds that charters
and TPS actually receive, regardless of how they are
expended. The fact that revenue was spent on central
office administration does not, in our view, change
the fact that it was revenue received by a school
system.
However, our detailed study of the non-public
sources of school revenue in charters and TPS has
one important limitation: Only a subset of states with
a substantial charter school population have financial
documentation that is clear and specific enough
for us to assign non-public revenue to particular
categories such as “food service”, “transportation”,
“philanthropy”, etc. Since the unpacking of the
general “non-public revenue” category is a core
function of this study, we are forced by circumstances
to exclude from the report half of the 30 states and
the District of Columbia that we included in our 2014
revenue study (see Table 1). Thus, in the bulk of this
report, we provide more fine-grained analysis of the
non-public revenue received by charters and TPS
within the smaller sample of U.S. states that permits
us to do so. Figure 1 is a map depicting states included
in our study sample.
Buckets of Water Into the Ocean: Non-Public Revenue in Public Charter and Traditional Public Schools12
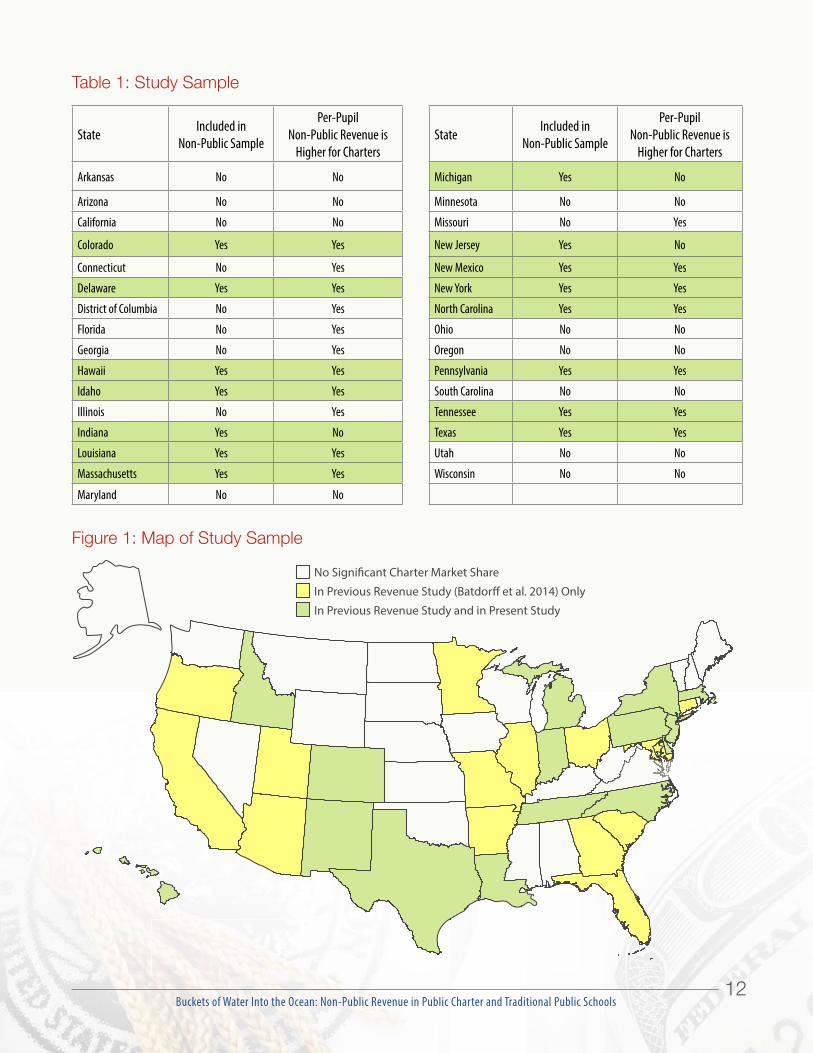
Table 1: Study Sample
State Included in Non-Public Sample
Per-Pupil Non-Public Revenue is
Higher for ChartersState Included in
Non-Public Sample
Per-Pupil Non-Public Revenue is
Higher for Charters
Arkansas No No Michigan Yes No
Arizona No No Minnesota No No
California No No Missouri No Yes
Colorado Yes Yes New Jersey Yes No
Connecticut No Yes New Mexico Yes Yes
Delaware Yes Yes New York Yes Yes
District of Columbia No Yes North Carolina Yes Yes
Florida No Yes Ohio No No
Georgia No Yes Oregon No No
Hawaii Yes Yes Pennsylvania Yes Yes
Idaho Yes Yes South Carolina No No
Illinois No Yes Tennessee Yes Yes
Indiana Yes No Texas Yes Yes
Louisiana Yes Yes Utah No No
Massachusetts Yes Yes Wisconsin No No
Maryland No No
Figure 1: Map of Study Sample
No Signi�cant Charter Market Share
In Previous Revenue Study (Batdor� et al. 2014) Only
In Previous Revenue Study and in Present Study

Buckets of Water Into the Ocean: Non-Public Revenue in Public Charter and Traditional Public Schools13
An important feature of the 15 states in our
non-public revenue report sample is that they
disproportionately tend to be states in which the
charter sector receives more non-public revenue on a
per-pupil basis than the TPS sector. Of the 15 states
in our sample, 12 (80%) of them have charter sectors
that receive more per-pupil revenue specifically
from non-public sources than their TPS sectors.
Only three (20%) of them have charter sectors that
receive less non-public revenue per-pupil than their
TPS. Conversely, of the 16 jurisdictions (15 states
and the District of Columbia) excluded from our
study due to insufficient data clarity, six of them
(37.5%) have charter sectors that receive more non-
public revenue on a per-pupil basis than their
TPS while ten of them (62.5%) are states where the
charter sector receives less non-public revenue per
student than the TPS sector. Because our sample is
unrepresentative of the total population of states with
charter schools, readers should interpret our findings
as applying mainly to states where charters receive
proportionately more non-public revenue than TPS
and not necessarily to the many states in which TPS
receive proportionately more non-public revenue
than charters.
As we dug deeper into non-public sources of
funding, we found some revenue items that had
conflicting information. The data at a higher level
of aggregation used for the 2014 revenue study
indicated that some items had a non-public source
of revenue so we had classified them as non-public
revenue. However, lower levels of coding or notes
indicated the source likely was public in origin. For
example, one item in Colorado showed coding for
non-public but included a reference note for the
federal Individuals with Disabilities Education
Act. In an abundance of caution for this deeper dive
on non-public funding, we excluded those dollars
from this analysis. The exclusion is not to state that
these are not revenues, so the overall totals from
the 2014 revenue study are not affected. We wanted
to make sure for this report that we only dealt with
funds that we could identify beyond a shadow of a
doubt as non-public funds. That is why some of the
non-public revenue totals you will see for states in
this study differ from the non-public revenue totals
we reported in our earlier study. 3
Finally, we report most of our comparisons on a
per-pupil basis to control for the different enrollment
sizes in the charter and TPS sectors. We exercised
the same care in analyzing student enrollment data
as we did with revenues. We used state-provided fall
count day enrollments for all schools. Depending on
a state’s particular method of reporting enrollment,
the official count could be either Average Daily
Attendance (ADA) or Average Daily Membership
(ADM). Given that we excluded Pre-K and Adult
education revenues from our analysis, we excluded
any Pre-K and Adult education counts from our
enrollment analysis. Also, we examined TPS
enrollments to determine if those files included
public charter school students. If that were the case,
we excluded the public charter school enrollments
from the TPS enrollment counts to avoid deflating
TPS revenues on a per pupil basis.
Having established the specific source of much of the
non-public revenue received by TPS and charters,
and the student enrollments in each sector, we were
ready to perform our non-public revenue study. In
the next sections, we present the findings from these
analyses.
3 Ultimately, we excluded only 5.4% of the revenue that was categorized as nonpublic in the previous report.
Buckets of Water Into the Ocean: Non-Public Revenue in Public Charter and Traditional Public Schools14
ResultsOverview
The purpose of this report is to document the sources
of non-public funding in a more detailed manner
and to compare them between charter schools and
TPS. We also pay particular attention to the role that
philanthropic giving plays in funding both types of
schools.
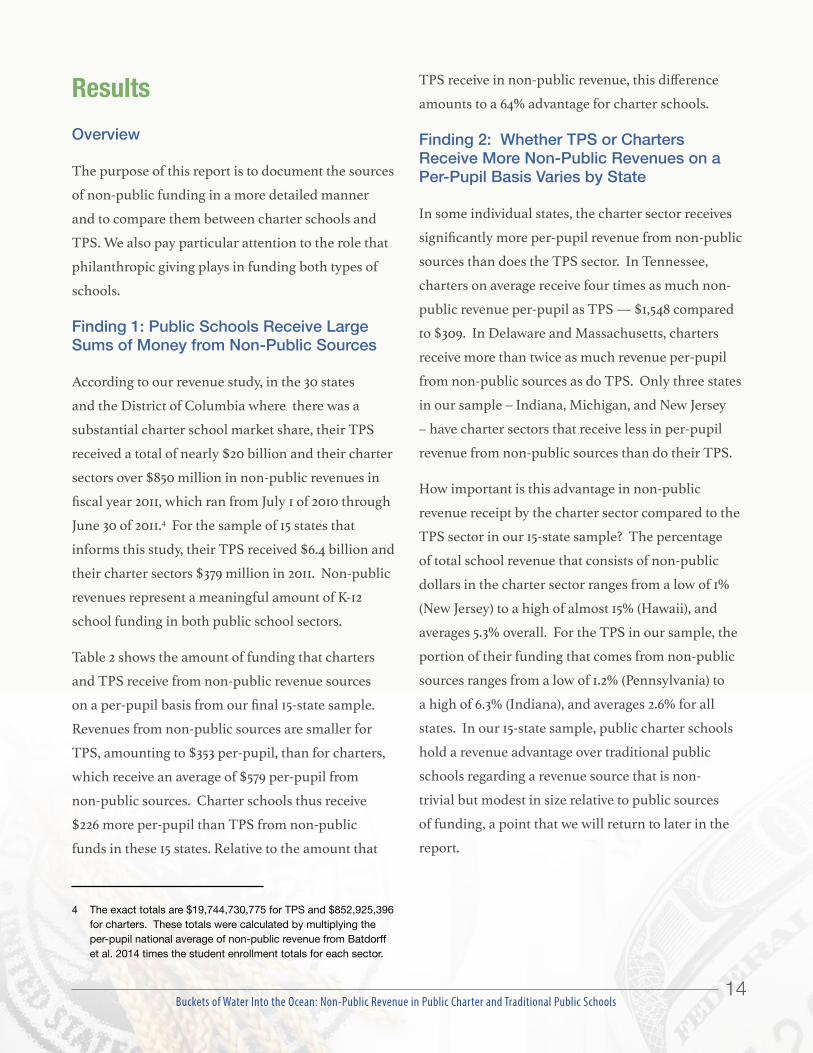
Finding 1: Public Schools Receive Large Sums of Money from Non-Public Sources
According to our revenue study, in the 30 states
and the District of Columbia where there was a
substantial charter school market share, their TPS
received a total of nearly $20 billion and their charter
sectors over $850 million in non-public revenues in
fiscal year 2011, which ran from July 1 of 2010 through
June 30 of 2011.4 For the sample of 15 states that
informs this study, their TPS received $6.4 billion and
their charter sectors $379 million in 2011. Non-public
revenues represent a meaningful amount of K-12
school funding in both public school sectors.
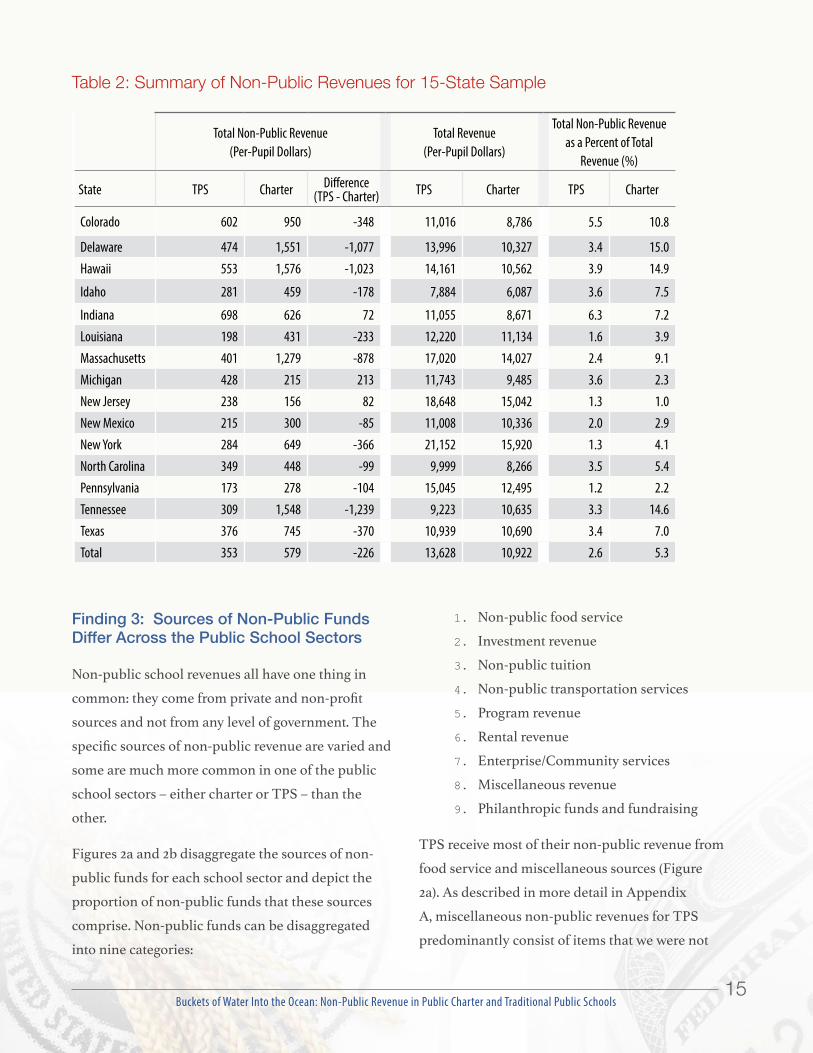
Table 2 shows the amount of funding that charters
and TPS receive from non-public revenue sources
on a per-pupil basis from our final 15-state sample.
Revenues from non-public sources are smaller for
TPS, amounting to $353 per-pupil, than for charters,
which receive an average of $579 per-pupil from
non-public sources. Charter schools thus receive
$226 more per-pupil than TPS from non-public
funds in these 15 states. Relative to the amount that
4 The exact totals are $19,744,730,775 for TPS and $852,925,396 for charters. These totals were calculated by multiplying the per-pupil national average of non-public revenue from Batdorff et al. 2014 times the student enrollment totals for each sector.
TPS receive in non-public revenue, this difference
amounts to a 64% advantage for charter schools.
Finding 2: Whether TPS or Charters Receive More Non-Public Revenues on a Per-Pupil Basis Varies by State
In some individual states, the charter sector receives
significantly more per-pupil revenue from non-public
sources than does the TPS sector. In Tennessee,
charters on average receive four times as much non-
public revenue per-pupil as TPS — $1,548 compared
to $309. In Delaware and Massachusetts, charters
receive more than twice as much revenue per-pupil
from non-public sources as do TPS. Only three states
in our sample – Indiana, Michigan, and New Jersey
– have charter sectors that receive less in per-pupil
revenue from non-public sources than do their TPS.
How important is this advantage in non-public
revenue receipt by the charter sector compared to the
TPS sector in our 15-state sample? The percentage
of total school revenue that consists of non-public
dollars in the charter sector ranges from a low of 1%
(New Jersey) to a high of almost 15% (Hawaii), and
averages 5.3% overall. For the TPS in our sample, the
portion of their funding that comes from non-public
sources ranges from a low of 1.2% (Pennsylvania) to
a high of 6.3% (Indiana), and averages 2.6% for all
states. In our 15-state sample, public charter schools
hold a revenue advantage over traditional public
schools regarding a revenue source that is non-
trivial but modest in size relative to public sources
of funding, a point that we will return to later in the
report.
Buckets of Water Into the Ocean: Non-Public Revenue in Public Charter and Traditional Public Schools15
Table 2: Summary of Non-Public Revenues for 15-State Sample
Total Non-Public Revenue(Per-Pupil Dollars)
Total Revenue(Per-Pupil Dollars)
Total Non-Public Revenue as a Percent of Total
Revenue (%)
State TPS Charter Difference(TPS - Charter) TPS Charter TPS Charter
Colorado 602 950 -348 11,016 8,786 5.5 10.8
Delaware 474 1,551 -1,077 13,996 10,327 3.4 15.0Hawaii 553 1,576 -1,023 14,161 10,562 3.9 14.9
Idaho 281 459 -178 7,884 6,087 3.6 7.5
Indiana 698 626 72 11,055 8,671 6.3 7.2Louisiana 198 431 -233 12,220 11,134 1.6 3.9Massachusetts 401 1,279 -878 17,020 14,027 2.4 9.1Michigan 428 215 213 11,743 9,485 3.6 2.3New Jersey 238 156 82 18,648 15,042 1.3 1.0New Mexico 215 300 -85 11,008 10,336 2.0 2.9New York 284 649 -366 21,152 15,920 1.3 4.1North Carolina 349 448 -99 9,999 8,266 3.5 5.4Pennsylvania 173 278 -104 15,045 12,495 1.2 2.2Tennessee 309 1,548 -1,239 9,223 10,635 3.3 14.6Texas 376 745 -370 10,939 10,690 3.4 7.0Total 353 579 -226 13,628 10,922 2.6 5.3
Finding 3: Sources of Non-Public Funds Differ Across the Public School Sectors
Non-public school revenues all have one thing in
common: they come from private and non-profit
sources and not from any level of government. The
specific sources of non-public revenue are varied and
some are much more common in one of the public
school sectors – either charter or TPS – than the
other.
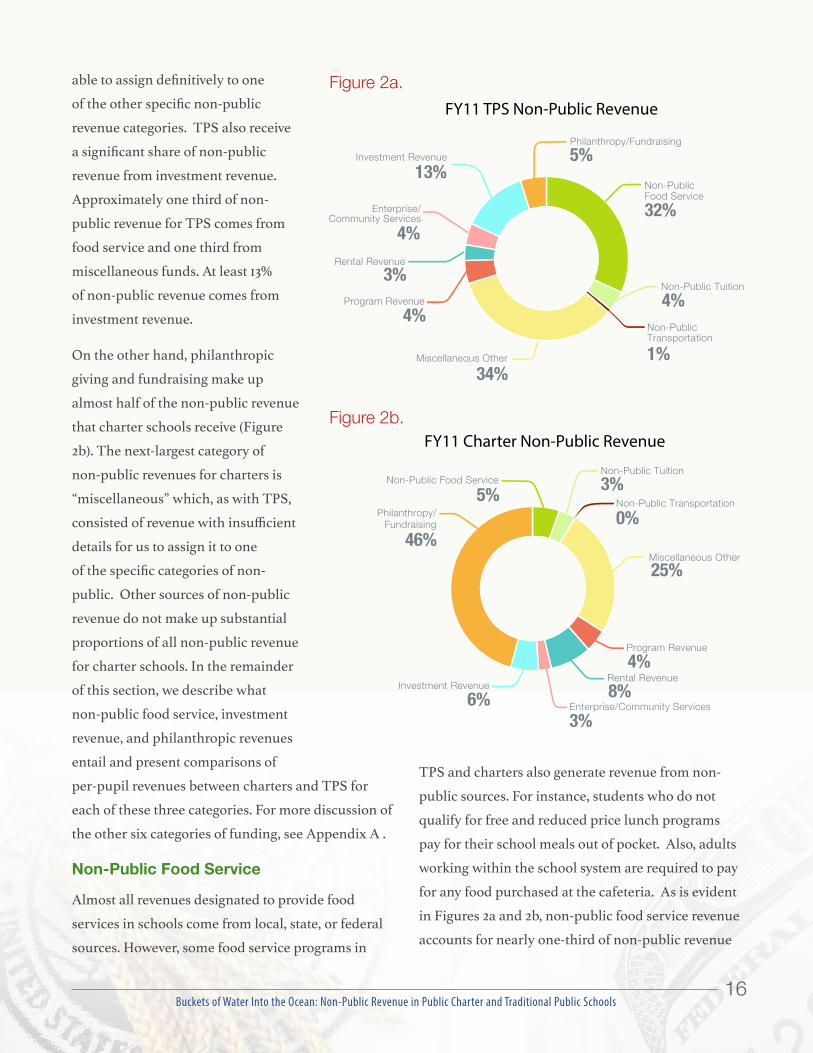
Figures 2a and 2b disaggregate the sources of non-
public funds for each school sector and depict the
proportion of non-public funds that these sources
comprise. Non-public funds can be disaggregated
into nine categories:
1. Non-public food service
2. Investment revenue
3. Non-public tuition
4. Non-public transportation services
5. Program revenue
6. Rental revenue
7. Enterprise/Community services
8. Miscellaneous revenue
9. Philanthropic funds and fundraising
TPS receive most of their non-public revenue from
food service and miscellaneous sources (Figure
2a). As described in more detail in Appendix
A, miscellaneous non-public revenues for TPS
predominantly consist of items that we were not
Buckets of Water Into the Ocean: Non-Public Revenue in Public Charter and Traditional Public Schools16
able to assign definitively to one
of the other specific non-public
revenue categories. TPS also receive
a significant share of non-public
revenue from investment revenue.
Approximately one third of non-
public revenue for TPS comes from
food service and one third from
miscellaneous funds. At least 13%
of non-public revenue comes from
investment revenue.
On the other hand, philanthropic
giving and fundraising make up
almost half of the non-public revenue
that charter schools receive (Figure
2b). The next-largest category of
non-public revenues for charters is
“miscellaneous” which, as with TPS,
consisted of revenue with insufficient
details for us to assign it to one
of the specific categories of non-
public. Other sources of non-public
revenue do not make up substantial
proportions of all non-public revenue
for charter schools. In the remainder
of this section, we describe what
non-public food service, investment
revenue, and philanthropic revenues
entail and present comparisons of
per-pupil revenues between charters and TPS for
each of these three categories. For more discussion of
the other six categories of funding, see Appendix A .
Non-Public Food Service
Almost all revenues designated to provide food
services in schools come from local, state, or federal
sources. However, some food service programs in
TPS and charters also generate revenue from non-
public sources. For instance, students who do not
qualify for free and reduced price lunch programs
pay for their school meals out of pocket. Also, adults
working within the school system are required to pay
for any food purchased at the cafeteria. As is evident
in Figures 2a and 2b, non-public food service revenue
accounts for nearly one-third of non-public revenue
Figure 2a.
Philanthropy/Fundraising
Philanthropy/Fundraising
Investment Income
Investment Income
Enterprise/Community Services
Enterprise/Community Services
Rental Income
Rental Income
Program IncomeProgram Income
Miscellaneous Other
Miscellaneous Other
Non-Public $ Transportation
Non-Public $Transportation
Non-Public $ Tuition
Non-Public $ Tuition
Non-Public Food Service
Non-Public Food Service
32%
4%
1%34%
4%
3%
4%
13%5% 5% 3%
0%
25%
4%
3%6%
46%
8%
FY11 District Non-Public Revenue FY11 Charter Non-Public Revenue
Philanthropy/Fundraising
Philanthropy/Fundraising
Investment Revenue
Investment Revenue
Enterprise/Community Services
Enterprise/Community Services
Rental Revenue
Rental Revenue
Program Revenue
Program Revenue
Miscellaneous Other
Miscellaneous Other
Non-Public Transportation
Non-PublicTransportation
Non-Public Tuition
Non-Public Tuition
Non-Public Food Service
Non-Public Food Service
32%
4%
1%34%
4%
3%
4%
13%5%
5% 3%
0%
25%
4%
3%6%
46%
8%
FY11 TPS Non-Public Revenue
FY11 Charter Non-Public RevenueFigure 2b.
Philanthropy/Fundraising
Philanthropy/Fundraising
Investment Income
Investment Income
Enterprise/Community Services
Enterprise/Community Services
Rental Income
Rental Income
Program IncomeProgram Income
Miscellaneous Other
Miscellaneous Other
Non-Public $ Transportation
Non-Public $Transportation
Non-Public $ Tuition
Non-Public $ Tuition
Non-Public Food Service
Non-Public Food Service
32%
4%
1%34%
4%
3%
4%
13%5% 5% 3%
0%
25%
4%
3%6%
46%
8%
FY11 District Non-Public Revenue FY11 Charter Non-Public Revenue
Philanthropy/Fundraising
Philanthropy/Fundraising
Investment Revenue
Investment Revenue
Enterprise/Community Services
Enterprise/Community Services
Rental Revenue
Rental Revenue
Program Revenue
Program Revenue
Miscellaneous Other
Miscellaneous Other
Non-Public Transportation
Non-PublicTransportation
Non-Public Tuition
Non-Public Tuition
Non-Public Food Service
Non-Public Food Service
32%
4%
1%34%
4%
3%
4%
13%5%
5% 3%
0%
25%
4%
3%6%
46%
8%
FY11 TPS Non-Public Revenue
FY11 Charter Non-Public Revenue
Buckets of Water Into the Ocean: Non-Public Revenue in Public Charter and Traditional Public Schools17
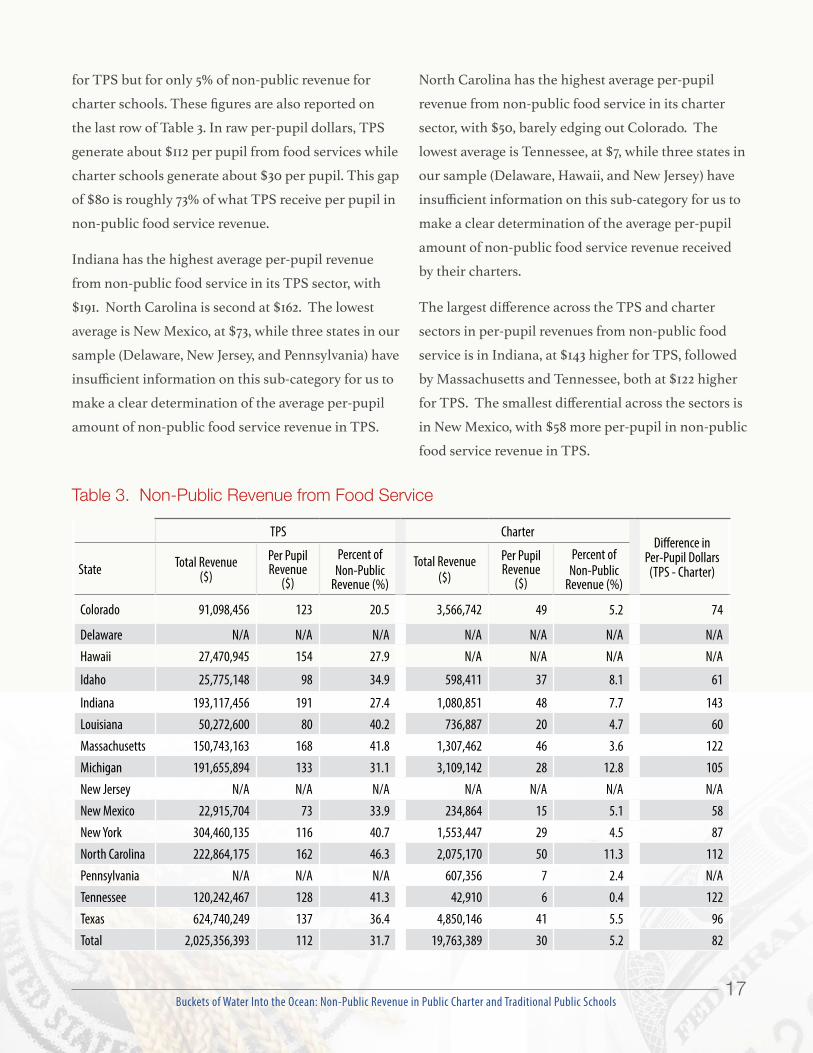
Table 3. Non-Public Revenue from Food Service
TPS CharterDifference in
Per-Pupil Dollars(TPS - Charter)State Total Revenue
($)Per Pupil Revenue
($)
Percent of Non-Public
Revenue (%)
Total Revenue($)
Per Pupil Revenue
($)
Percent of Non-Public
Revenue (%)
Colorado 91,098,456 123 20.5 3,566,742 49 5.2 74
Delaware N/A N/A N/A N/A N/A N/A N/AHawaii 27,470,945 154 27.9 N/A N/A N/A N/A
Idaho 25,775,148 98 34.9 598,411 37 8.1 61
Indiana 193,117,456 191 27.4 1,080,851 48 7.7 143Louisiana 50,272,600 80 40.2 736,887 20 4.7 60Massachusetts 150,743,163 168 41.8 1,307,462 46 3.6 122Michigan 191,655,894 133 31.1 3,109,142 28 12.8 105New Jersey N/A N/A N/A N/A N/A N/A N/ANew Mexico 22,915,704 73 33.9 234,864 15 5.1 58New York 304,460,135 116 40.7 1,553,447 29 4.5 87North Carolina 222,864,175 162 46.3 2,075,170 50 11.3 112Pennsylvania N/A N/A N/A 607,356 7 2.4 N/ATennessee 120,242,467 128 41.3 42,910 6 0.4 122Texas 624,740,249 137 36.4 4,850,146 41 5.5 96Total 2,025,356,393 112 31.7 19,763,389 30 5.2 82
for TPS but for only 5% of non-public revenue for
charter schools. These figures are also reported on
the last row of Table 3. In raw per-pupil dollars, TPS
generate about $112 per pupil from food services while
charter schools generate about $30 per pupil. This gap
of $80 is roughly 73% of what TPS receive per pupil in
non-public food service revenue.
Indiana has the highest average per-pupil revenue
from non-public food service in its TPS sector, with
$191. North Carolina is second at $162. The lowest
average is New Mexico, at $73, while three states in our
sample (Delaware, New Jersey, and Pennsylvania) have
insufficient information on this sub-category for us to
make a clear determination of the average per-pupil
amount of non-public food service revenue in TPS.
North Carolina has the highest average per-pupil
revenue from non-public food service in its charter
sector, with $50, barely edging out Colorado. The
lowest average is Tennessee, at $7, while three states in
our sample (Delaware, Hawaii, and New Jersey) have
insufficient information on this sub-category for us to
make a clear determination of the average per-pupil
amount of non-public food service revenue received
by their charters.
The largest difference across the TPS and charter
sectors in per-pupil revenues from non-public food
service is in Indiana, at $143 higher for TPS, followed
by Massachusetts and Tennessee, both at $122 higher
for TPS. The smallest differential across the sectors is
in New Mexico, with $58 more per-pupil in non-public
food service revenue in TPS.
Buckets of Water Into the Ocean: Non-Public Revenue in Public Charter and Traditional Public Schools18
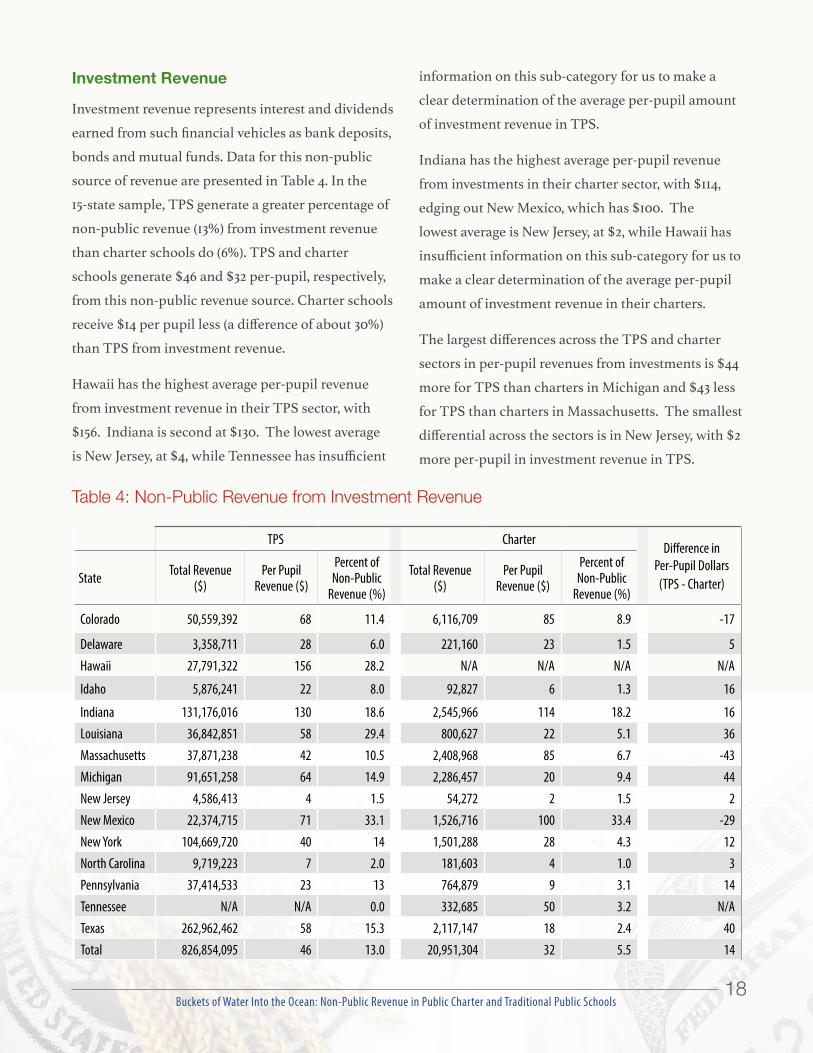
Investment Revenue
Investment revenue represents interest and dividends
earned from such financial vehicles as bank deposits,
bonds and mutual funds. Data for this non-public
source of revenue are presented in Table 4. In the
15-state sample, TPS generate a greater percentage of
non-public revenue (13%) from investment revenue
than charter schools do (6%). TPS and charter
schools generate $46 and $32 per-pupil, respectively,
from this non-public revenue source. Charter schools
receive $14 per pupil less (a difference of about 30%)
than TPS from investment revenue.
Hawaii has the highest average per-pupil revenue
from investment revenue in their TPS sector, with
$156. Indiana is second at $130. The lowest average
is New Jersey, at $4, while Tennessee has insufficient
information on this sub-category for us to make a
clear determination of the average per-pupil amount
of investment revenue in TPS.
Indiana has the highest average per-pupil revenue
from investments in their charter sector, with $114,
edging out New Mexico, which has $100. The
lowest average is New Jersey, at $2, while Hawaii has
insufficient information on this sub-category for us to
make a clear determination of the average per-pupil
amount of investment revenue in their charters.
The largest differences across the TPS and charter
sectors in per-pupil revenues from investments is $44
more for TPS than charters in Michigan and $43 less
for TPS than charters in Massachusetts. The smallest
differential across the sectors is in New Jersey, with $2
more per-pupil in investment revenue in TPS.
Table 4: Non-Public Revenue from Investment Revenue
TPS CharterDifference in
Per-Pupil Dollars(TPS - Charter)State Total Revenue
($)Per Pupil
Revenue ($)
Percent of Non-Public
Revenue (%)
Total Revenue($)
Per Pupil Revenue ($)
Percent of Non-Public
Revenue (%)
Colorado 50,559,392 68 11.4 6,116,709 85 8.9 -17
Delaware 3,358,711 28 6.0 221,160 23 1.5 5Hawaii 27,791,322 156 28.2 N/A N/A N/A N/A
Idaho 5,876,241 22 8.0 92,827 6 1.3 16
Indiana 131,176,016 130 18.6 2,545,966 114 18.2 16Louisiana 36,842,851 58 29.4 800,627 22 5.1 36Massachusetts 37,871,238 42 10.5 2,408,968 85 6.7 -43Michigan 91,651,258 64 14.9 2,286,457 20 9.4 44New Jersey 4,586,413 4 1.5 54,272 2 1.5 2New Mexico 22,374,715 71 33.1 1,526,716 100 33.4 -29New York 104,669,720 40 14 1,501,288 28 4.3 12North Carolina 9,719,223 7 2.0 181,603 4 1.0 3Pennsylvania 37,414,533 23 13 764,879 9 3.1 14Tennessee N/A N/A 0.0 332,685 50 3.2 N/ATexas 262,962,462 58 15.3 2,117,147 18 2.4 40Total 826,854,095 46 13.0 20,951,304 32 5.5 14
Buckets of Water Into the Ocean: Non-Public Revenue in Public Charter and Traditional Public Schools19
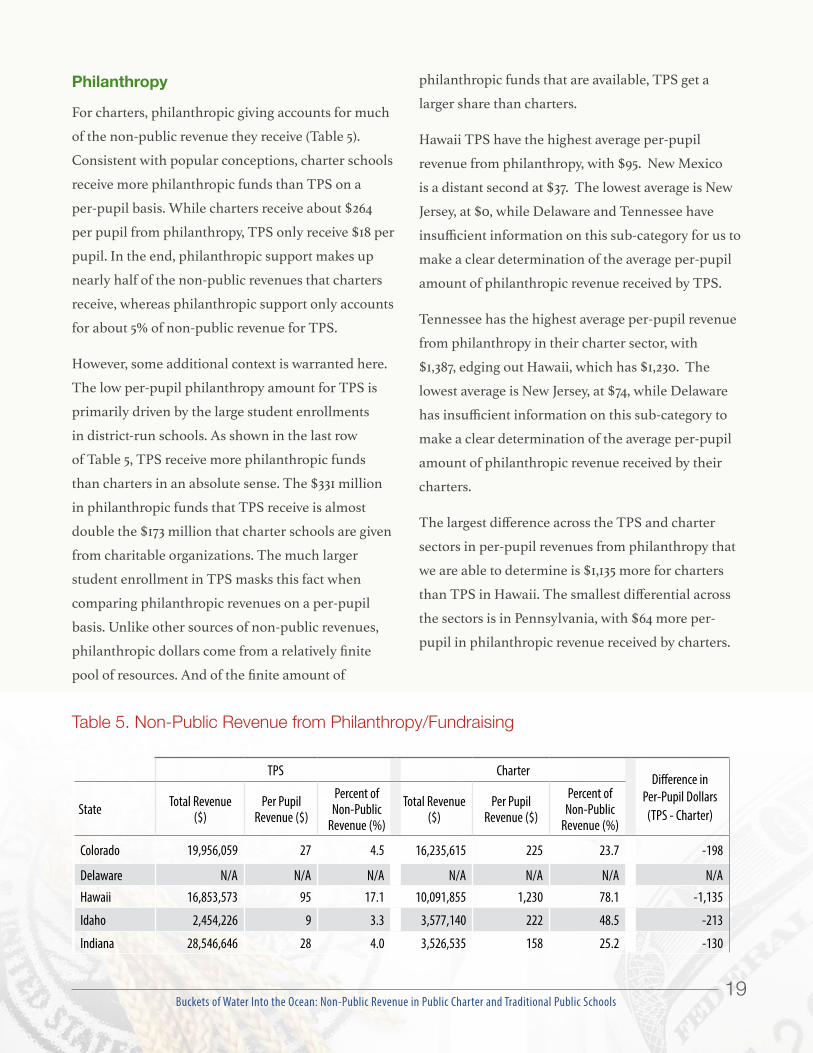
Philanthropy
For charters, philanthropic giving accounts for much
of the non-public revenue they receive (Table 5).
Consistent with popular conceptions, charter schools
receive more philanthropic funds than TPS on a
per-pupil basis. While charters receive about $264
per pupil from philanthropy, TPS only receive $18 per
pupil. In the end, philanthropic support makes up
nearly half of the non-public revenues that charters
receive, whereas philanthropic support only accounts
for about 5% of non-public revenue for TPS.
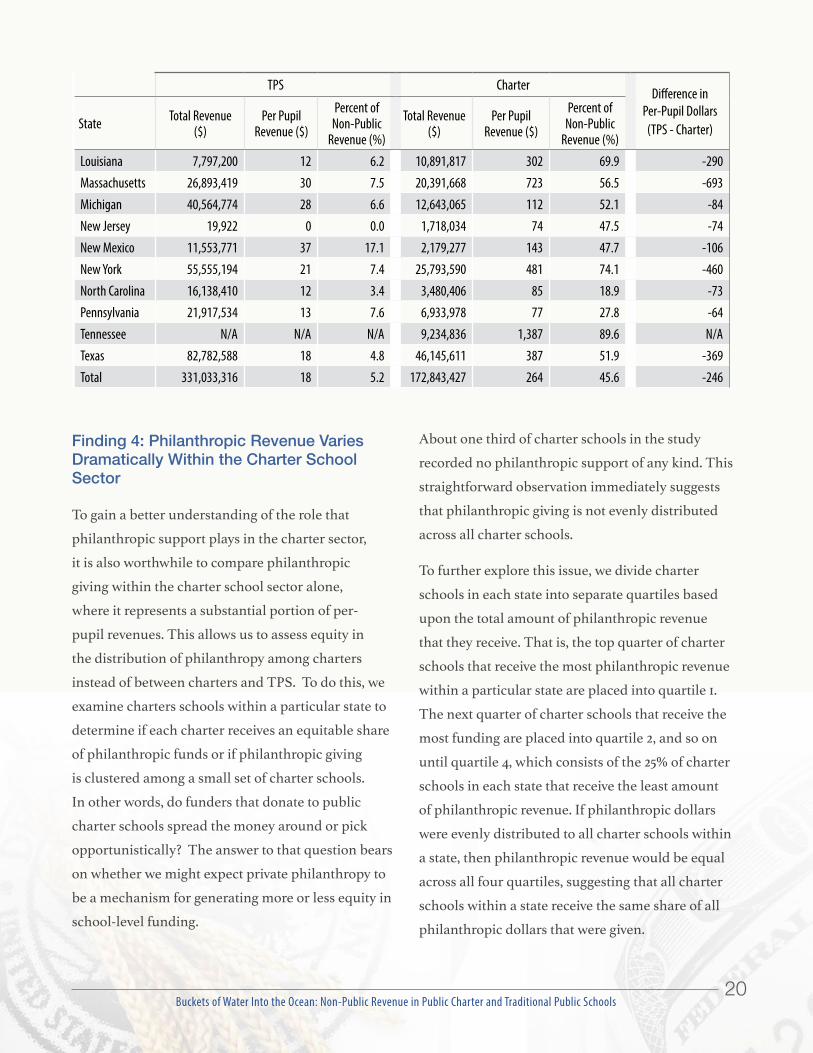
However, some additional context is warranted here.
The low per-pupil philanthropy amount for TPS is
primarily driven by the large student enrollments
in district-run schools. As shown in the last row
of Table 5, TPS receive more philanthropic funds
than charters in an absolute sense. The $331 million
in philanthropic funds that TPS receive is almost
double the $173 million that charter schools are given
from charitable organizations. The much larger
student enrollment in TPS masks this fact when
comparing philanthropic revenues on a per-pupil
basis. Unlike other sources of non-public revenues,
philanthropic dollars come from a relatively finite
pool of resources. And of the finite amount of
philanthropic funds that are available, TPS get a
larger share than charters.
Hawaii TPS have the highest average per-pupil
revenue from philanthropy, with $95. New Mexico
is a distant second at $37. The lowest average is New
Jersey, at $0, while Delaware and Tennessee have
insufficient information on this sub-category for us to
make a clear determination of the average per-pupil
amount of philanthropic revenue received by TPS.
Tennessee has the highest average per-pupil revenue
from philanthropy in their charter sector, with
$1,387, edging out Hawaii, which has $1,230. The
lowest average is New Jersey, at $74, while Delaware
has insufficient information on this sub-category to
make a clear determination of the average per-pupil
amount of philanthropic revenue received by their
charters.
The largest difference across the TPS and charter
sectors in per-pupil revenues from philanthropy that
we are able to determine is $1,135 more for charters
than TPS in Hawaii. The smallest differential across
the sectors is in Pennsylvania, with $64 more per-
pupil in philanthropic revenue received by charters.
Table 5. Non-Public Revenue from Philanthropy/Fundraising
TPS CharterDifference in
Per-Pupil Dollars(TPS - Charter)State Total Revenue
($)Per Pupil
Revenue ($)
Percent of Non-Public
Revenue (%)
Total Revenue($)
Per Pupil Revenue ($)
Percent of Non-Public
Revenue (%)
Colorado 19,956,059 27 4.5 16,235,615 225 23.7 -198
Delaware N/A N/A N/A N/A N/A N/A N/AHawaii 16,853,573 95 17.1 10,091,855 1,230 78.1 -1,135
Idaho 2,454,226 9 3.3 3,577,140 222 48.5 -213
Indiana 28,546,646 28 4.0 3,526,535 158 25.2 -130
Buckets of Water Into the Ocean: Non-Public Revenue in Public Charter and Traditional Public Schools20
TPS CharterDifference in
Per-Pupil Dollars(TPS - Charter)State Total Revenue
($)Per Pupil
Revenue ($)
Percent of Non-Public
Revenue (%)
Total Revenue($)
Per Pupil Revenue ($)
Percent of Non-Public
Revenue (%)Louisiana 7,797,200 12 6.2 10,891,817 302 69.9 -290Massachusetts 26,893,419 30 7.5 20,391,668 723 56.5 -693Michigan 40,564,774 28 6.6 12,643,065 112 52.1 -84New Jersey 19,922 0 0.0 1,718,034 74 47.5 -74New Mexico 11,553,771 37 17.1 2,179,277 143 47.7 -106New York 55,555,194 21 7.4 25,793,590 481 74.1 -460North Carolina 16,138,410 12 3.4 3,480,406 85 18.9 -73Pennsylvania 21,917,534 13 7.6 6,933,978 77 27.8 -64Tennessee N/A N/A N/A 9,234,836 1,387 89.6 N/ATexas 82,782,588 18 4.8 46,145,611 387 51.9 -369Total 331,033,316 18 5.2 172,843,427 264 45.6 -246
Finding 4: Philanthropic Revenue Varies Dramatically Within the Charter School Sector
To gain a better understanding of the role that
philanthropic support plays in the charter sector,
it is also worthwhile to compare philanthropic
giving within the charter school sector alone,
where it represents a substantial portion of per-
pupil revenues. This allows us to assess equity in
the distribution of philanthropy among charters
instead of between charters and TPS. To do this, we
examine charters schools within a particular state to
determine if each charter receives an equitable share
of philanthropic funds or if philanthropic giving
is clustered among a small set of charter schools.
In other words, do funders that donate to public
charter schools spread the money around or pick
opportunistically? The answer to that question bears
on whether we might expect private philanthropy to
be a mechanism for generating more or less equity in
school-level funding.
About one third of charter schools in the study
recorded no philanthropic support of any kind. This
straightforward observation immediately suggests
that philanthropic giving is not evenly distributed
across all charter schools.
To further explore this issue, we divide charter
schools in each state into separate quartiles based
upon the total amount of philanthropic revenue
that they receive. That is, the top quarter of charter
schools that receive the most philanthropic revenue
within a particular state are placed into quartile 1.
The next quarter of charter schools that receive the
most funding are placed into quartile 2, and so on
until quartile 4, which consists of the 25% of charter
schools in each state that receive the least amount
of philanthropic revenue. If philanthropic dollars
were evenly distributed to all charter schools within
a state, then philanthropic revenue would be equal
across all four quartiles, suggesting that all charter
schools within a state receive the same share of all
philanthropic dollars that were given.
Buckets of Water Into the Ocean: Non-Public Revenue in Public Charter and Traditional Public Schools21
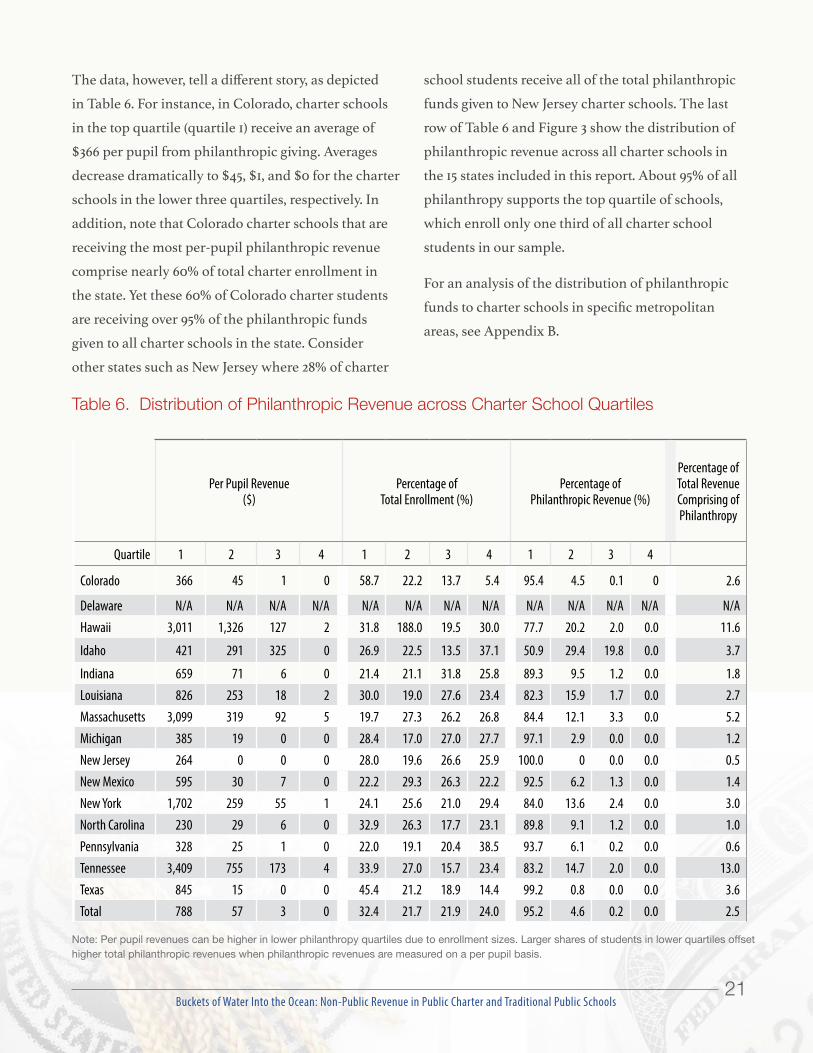
Table 6. Distribution of Philanthropic Revenue across Charter School Quartiles
Per Pupil Revenue($)
Percentage of Total Enrollment (%)
Percentage of Philanthropic Revenue (%)
Percentage of Total Revenue Comprising of Philanthropy
Quartile 1 2 3 4 1 2 3 4 1 2 3 4
Colorado 366 45 1 0 58.7 22.2 13.7 5.4 95.4 4.5 0.1 0 2.6
Delaware N/A N/A N/A N/A N/A N/A N/A N/A N/A N/A N/A N/A N/AHawaii 3,011 1,326 127 2 31.8 188.0 19.5 30.0 77.7 20.2 2.0 0.0 11.6
Idaho 421 291 325 0 26.9 22.5 13.5 37.1 50.9 29.4 19.8 0.0 3.7
Indiana 659 71 6 0 21.4 21.1 31.8 25.8 89.3 9.5 1.2 0.0 1.8Louisiana 826 253 18 2 30.0 19.0 27.6 23.4 82.3 15.9 1.7 0.0 2.7Massachusetts 3,099 319 92 5 19.7 27.3 26.2 26.8 84.4 12.1 3.3 0.0 5.2Michigan 385 19 0 0 28.4 17.0 27.0 27.7 97.1 2.9 0.0 0.0 1.2New Jersey 264 0 0 0 28.0 19.6 26.6 25.9 100.0 0 0.0 0.0 0.5New Mexico 595 30 7 0 22.2 29.3 26.3 22.2 92.5 6.2 1.3 0.0 1.4New York 1,702 259 55 1 24.1 25.6 21.0 29.4 84.0 13.6 2.4 0.0 3.0North Carolina 230 29 6 0 32.9 26.3 17.7 23.1 89.8 9.1 1.2 0.0 1.0Pennsylvania 328 25 1 0 22.0 19.1 20.4 38.5 93.7 6.1 0.2 0.0 0.6Tennessee 3,409 755 173 4 33.9 27.0 15.7 23.4 83.2 14.7 2.0 0.0 13.0Texas 845 15 0 0 45.4 21.2 18.9 14.4 99.2 0.8 0.0 0.0 3.6Total 788 57 3 0 32.4 21.7 21.9 24.0 95.2 4.6 0.2 0.0 2.5
Note: Per pupil revenues can be higher in lower philanthropy quartiles due to enrollment sizes. Larger shares of students in lower quartiles offset higher total philanthropic revenues when philanthropic revenues are measured on a per pupil basis.
The data, however, tell a different story, as depicted
in Table 6. For instance, in Colorado, charter schools
in the top quartile (quartile 1) receive an average of
$366 per pupil from philanthropic giving. Averages
decrease dramatically to $45, $1, and $0 for the charter
schools in the lower three quartiles, respectively. In
addition, note that Colorado charter schools that are
receiving the most per-pupil philanthropic revenue
comprise nearly 60% of total charter enrollment in
the state. Yet these 60% of Colorado charter students
are receiving over 95% of the philanthropic funds
given to all charter schools in the state. Consider
other states such as New Jersey where 28% of charter
school students receive all of the total philanthropic
funds given to New Jersey charter schools. The last
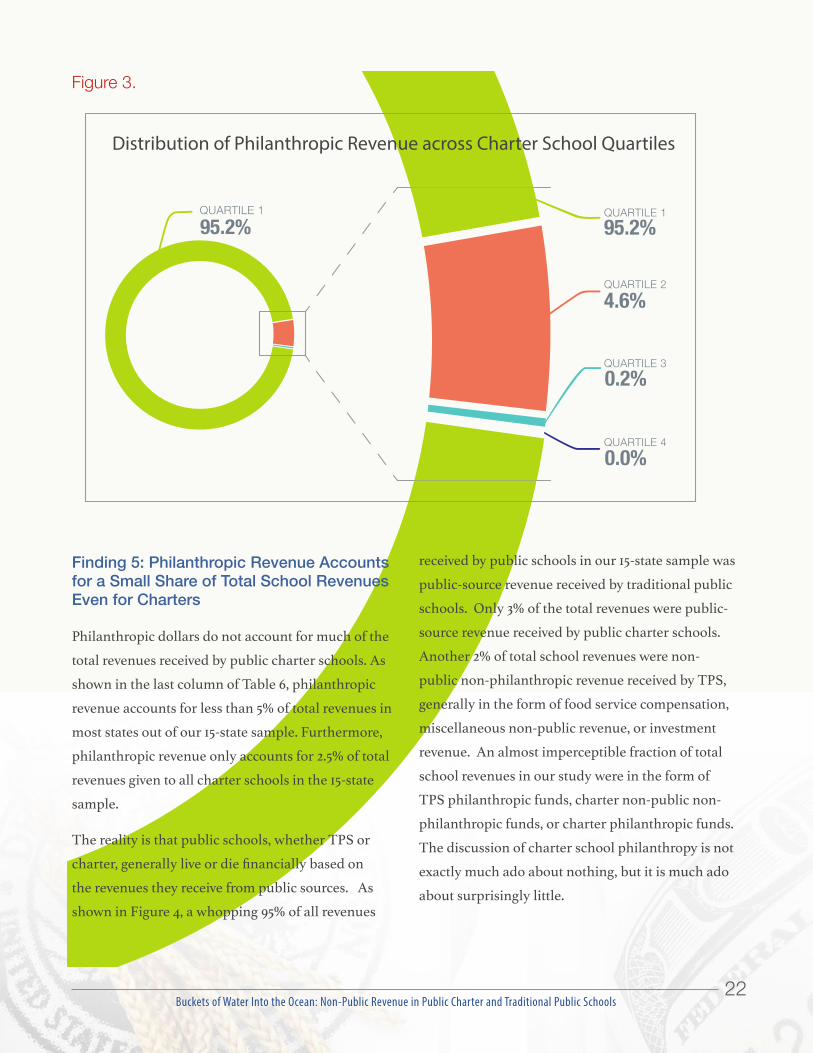
row of Table 6 and Figure 3 show the distribution of
philanthropic revenue across all charter schools in
the 15 states included in this report. About 95% of all
philanthropy supports the top quartile of schools,
which enroll only one third of all charter school
students in our sample.
For an analysis of the distribution of philanthropic
funds to charter schools in specific metropolitan
areas, see Appendix B.
Buckets of Water Into the Ocean: Non-Public Revenue in Public Charter and Traditional Public Schools22
0.2%
0.0%
4.6%QUARTILE 2
95.2%QUARTILE 1
QUARTILE 3
QUARTILE 4
95.2%QUARTILE 1
Distribution of Philanthropic Revenue across Charter School Quartiles
Figure 3.
Finding 5: Philanthropic Revenue Accounts for a Small Share of Total School Revenues Even for Charters
Philanthropic dollars do not account for much of the
total revenues received by public charter schools. As
shown in the last column of Table 6, philanthropic
revenue accounts for less than 5% of total revenues in
most states out of our 15-state sample. Furthermore,
philanthropic revenue only accounts for 2.5% of total
revenues given to all charter schools in the 15-state
sample.
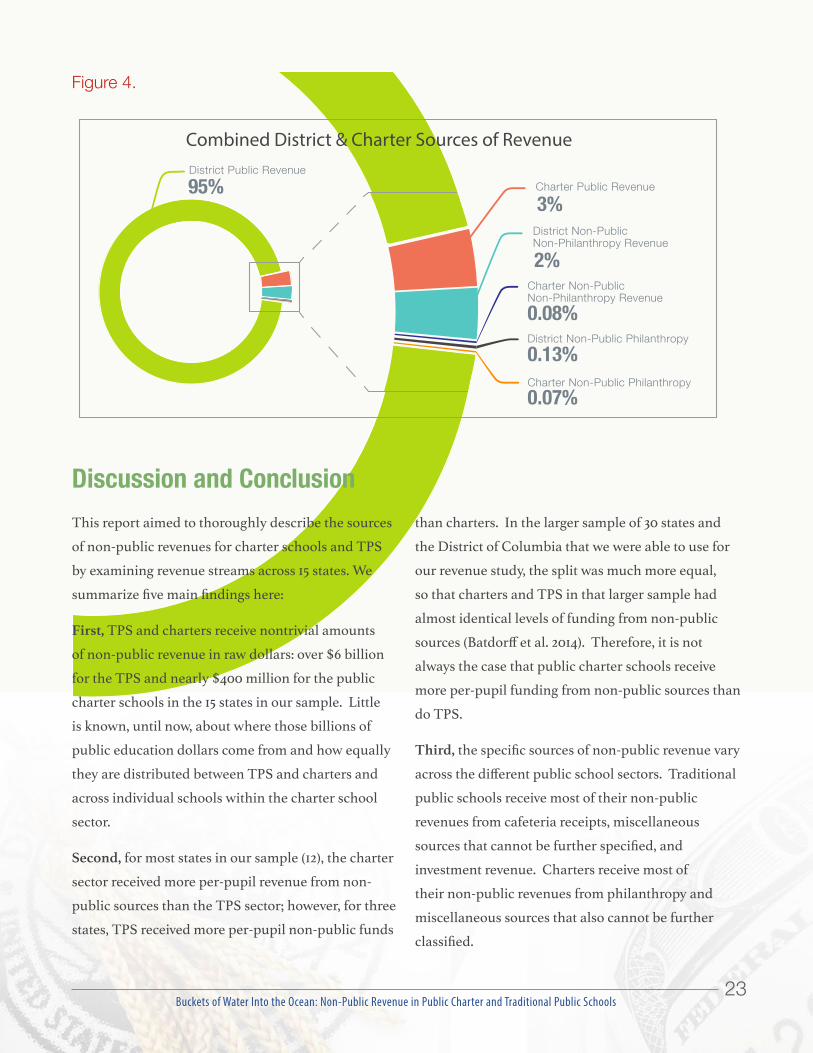
The reality is that public schools, whether TPS or
charter, generally live or die financially based on
the revenues they receive from public sources. As
shown in Figure 4, a whopping 95% of all revenues
received by public schools in our 15-state sample was
public-source revenue received by traditional public
schools. Only 3% of the total revenues were public-
source revenue received by public charter schools.
Another 2% of total school revenues were non-
public non-philanthropic revenue received by TPS,
generally in the form of food service compensation,
miscellaneous non-public revenue, or investment
revenue. An almost imperceptible fraction of total
school revenues in our study were in the form of
TPS philanthropic funds, charter non-public non-
philanthropic funds, or charter philanthropic funds.
The discussion of charter school philanthropy is not
exactly much ado about nothing, but it is much ado
about surprisingly little.
Buckets of Water Into the Ocean: Non-Public Revenue in Public Charter and Traditional Public Schools23
95%3%
0.08%
0.13%
0.07%
Combined District & Charter Sources of RevenueDistrict Public Revenue
Charter Public Revenue
2%District Non-Public Non-Philanthropy Revenue
Charter Non-Public Non-Philanthropy Revenue
District Non-Public Philanthropy
Charter Non-Public Philanthropy
Figure 4.
Discussion and ConclusionThis report aimed to thoroughly describe the sources
of non-public revenues for charter schools and TPS
by examining revenue streams across 15 states. We
summarize five main findings here:
First, TPS and charters receive nontrivial amounts
of non-public revenue in raw dollars: over $6 billion
for the TPS and nearly $400 million for the public
charter schools in the 15 states in our sample. Little
is known, until now, about where those billions of
public education dollars come from and how equally
they are distributed between TPS and charters and
across individual schools within the charter school
sector.
Second, for most states in our sample (12), the charter
sector received more per-pupil revenue from non-
public sources than the TPS sector; however, for three
states, TPS received more per-pupil non-public funds
than charters. In the larger sample of 30 states and
the District of Columbia that we were able to use for
our revenue study, the split was much more equal,
so that charters and TPS in that larger sample had
almost identical levels of funding from non-public
sources (Batdorff et al. 2014). Therefore, it is not
always the case that public charter schools receive
more per-pupil funding from non-public sources than
do TPS.
Third, the specific sources of non-public revenue vary
across the different public school sectors. Traditional
public schools receive most of their non-public
revenues from cafeteria receipts, miscellaneous
sources that cannot be further specified, and
investment revenue. Charters receive most of
their non-public revenues from philanthropy and
miscellaneous sources that also cannot be further
classified.
Buckets of Water Into the Ocean: Non-Public Revenue in Public Charter and Traditional Public Schools24
Fourth, charter school philanthropy follows a
highly skewed distribution. One third of the charter
schools in our study received no philanthropic funds
whatsoever. A total of 95% of all charter school
philanthropy was directed at schools that enrolled
just one-third of all charter students in our 15-state
sample. As we might expect, philanthropic dollars
are attracted to particular public charter
schools and are not spread at all evenly
across the charter sector. Whether that
is a good thing or a bad thing, surprising
or logical, depends upon one’s normative
views on school funding equity and the
role of private foundations.
Finally, though philanthropy accounts
for nearly half of all non-public revenues
for charter schools, it only accounts for
2.5% of all charter revenues. Thus, charter
schools are overwhelmingly dependent
on public revenue to operate and most
of them cannot count on charitable
donations to make up discrepancies in
the public funding of charters and TPS such as those
that we have documented in our revenue studies
(Thomas B. Fordham Institute 2005; Batdorff et al.
2010; Batdorff et al. 2014).
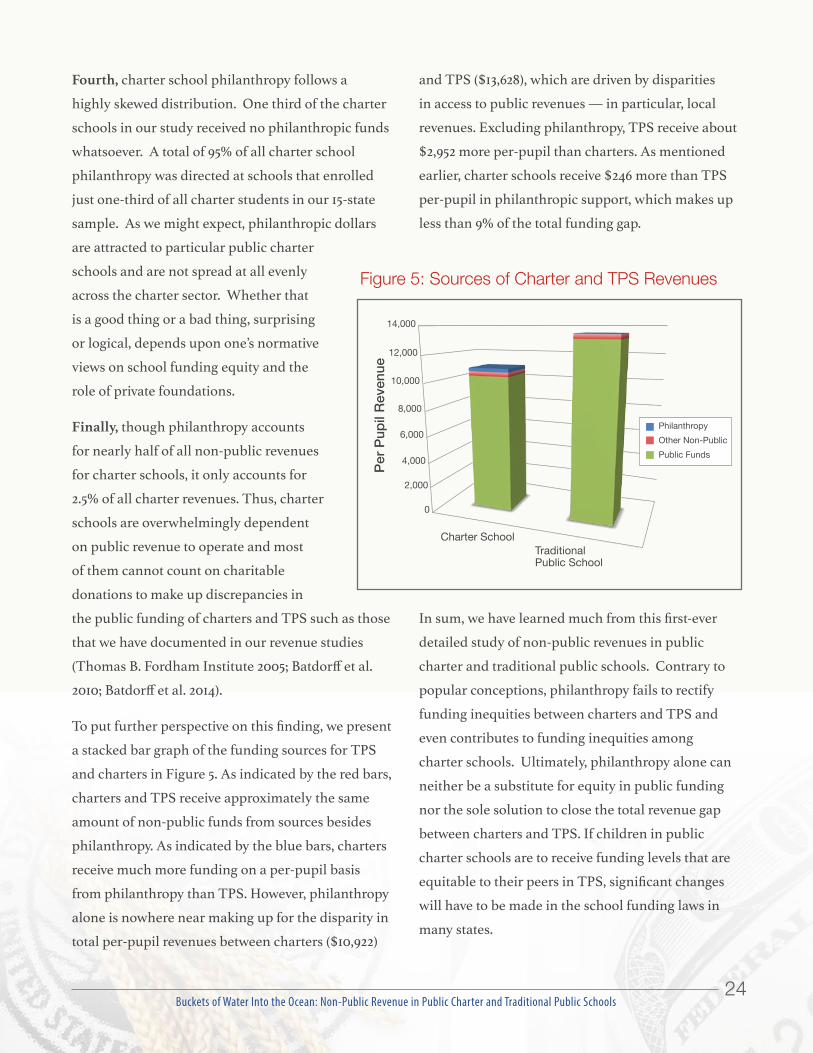
To put further perspective on this finding, we present
a stacked bar graph of the funding sources for TPS
and charters in Figure 5. As indicated by the red bars,
charters and TPS receive approximately the same
amount of non-public funds from sources besides
philanthropy. As indicated by the blue bars, charters
receive much more funding on a per-pupil basis
from philanthropy than TPS. However, philanthropy
alone is nowhere near making up for the disparity in
total per-pupil revenues between charters ($10,922)
and TPS ($13,628), which are driven by disparities
in access to public revenues — in particular, local
revenues. Excluding philanthropy, TPS receive about
$2,952 more per-pupil than charters. As mentioned
earlier, charter schools receive $246 more than TPS
per-pupil in philanthropic support, which makes up
less than 9% of the total funding gap.
In sum, we have learned much from this first-ever
detailed study of non-public revenues in public
charter and traditional public schools. Contrary to
popular conceptions, philanthropy fails to rectify
funding inequities between charters and TPS and
even contributes to funding inequities among
charter schools. Ultimately, philanthropy alone can
neither be a substitute for equity in public funding
nor the sole solution to close the total revenue gap
between charters and TPS. If children in public
charter schools are to receive funding levels that are
equitable to their peers in TPS, significant changes
will have to be made in the school funding laws in
many states.
Figure 5: Sources of Charter and TPS Revenues
Charter School
Per P
upil
Reve
nue
Traditional Public School
14,000
12,000
10,000
8,000
6,000
4,000
2,000
0
PhilanthropyOther Non-PublicPublic Funds
Buckets of Water Into the Ocean: Non-Public Revenue in Public Charter and Traditional Public Schools25
Baker B.D. (2014). Review of “Charter Funding: Inequity Expands.” Boulder, CO: National Education Policy Center
Baker, B.D. & Ferris, R. (2011). Adding Up the Spending: Fiscal Disparities and Philanthropy among New York City Charter Schools. Boulder, CO: National Education Policy Center.
Batdorff, M., Maloney, L., May, J., Doyle, D., & Hassel, B. (2010). Charter school funding: Inequity persists. Muncie, IN: Ball State University.
Batdorff, M., Maloney, L., May, J., Speakman, S., Wolf, P. J., & Cheng, A. (2014). Charter school funding: Inequity increases. School Choice Demonstration Project, University of Arkansas, Fayetteville, AR.
Burtless, G. (ed.), 1996. Does money matter? The effect of school resources on student achievement and adult success. Washington, DC: Brookings
Cohen, R. (2007). Strategic grantmaking: Foundations and the school privatization movement. Washington, DC. National Committee for Responsive Philanthropy.
Downes, Thomas, and Leanna Stiefel. (2008). Measuring equity and adequacy in school finance. In Handbook of research on education finance and policy, edited by H. F. Ladd and E. B. Fiske, pp. 222–37. New York, NY: Routledge.
Forman, J. (2007). Do charter schools threaten public education? Emerging evidence from fifteen years of a quasi-market for schooling. University of Illinois Law Review, 839-880.
Hanushek, E.A. (1997). Assessing the effects of school resources on student performance: An update. Educational Evaluation and Policy Analysis, 19(2), 131-164.
Jackson, C.K., Johnson, R.C., & Persico, C. (2015). Boosting educational attainment and adult earnings: Does school spending matter after all? Education Next, 15(4), retrieved on May 30, 2015, from http://educationnext.org/boosting-education-attainment-adult-earnings-school-spending/
Ladd, H.F. (2008). Reflections on Equity, Adequacy, and Weighted Student Funding. Education Finance and Policy, 3(4), 402-423.
Lake, R. (2007, May). Identifying and replicating the “DNA” of successful charter schools: Lessons from the private sector (Research Brief). Seattle, Washington : The National Charter School Research Project, Center on Reinventing Public Education, University of Washington.
Miron, G., Mathis, W., & Welner K. (2015). Review of separating fact and fiction. Boulder, CO: National Education Policy Center.
Miron, G. & Urschel, J.L. (2010). Equal or fair? A study of revenues and expenditure in American charter schools. Boulder and Tempe: Education and the Public Interest Center & Education Policy Research Unit.
Murnane, R.J., & Levy, F. (1996). Teaching the new basic skills: Principles for educating children to thrive in a changing economy. New York, NY: The Free Press.
Scott, J. (2009). The politics of venture philanthropy in charter policy and advocacy. Educational Policy, 23(1), 106-136.
Scott, J., & DiMartino, C.C. (2010). Hyberdized, Franchised, Duplicated, and Replicated: Charter Schools and Management Organizations. In C. Lubienski & P.C. Weitzel (Eds.) The Charter School Experiment: Expectations, Evidence, and Implications, pp. 171-196. Cambridge, Massachusetts: Harvard Education Press.
Stover, D. (2012). Money Talks. American School Board Journal, 199(2), 12-21.
Thomas B. Fordham Institute. (2005). Charter School Funding: Inequity’s Next Frontier. Washington, DC.
References
Buckets of Water Into the Ocean: Non-Public Revenue in Public Charter and Traditional Public Schools26
Appendix A: Other Sources of Non-public RevenuesThis appendix details other sources of non-public revenues for TPS and charters. We choose to present them here rather than in the main body of the report as they make up a smaller share of non-public revenue sources. Though miscellaneous revenue for TPS and charters make up large proportions of non-public revenue sources for each sector, much of the miscellaneous revenue consists of investment revenue, philanthropy, and other categories that we have already and in all likelihood disaggregated.
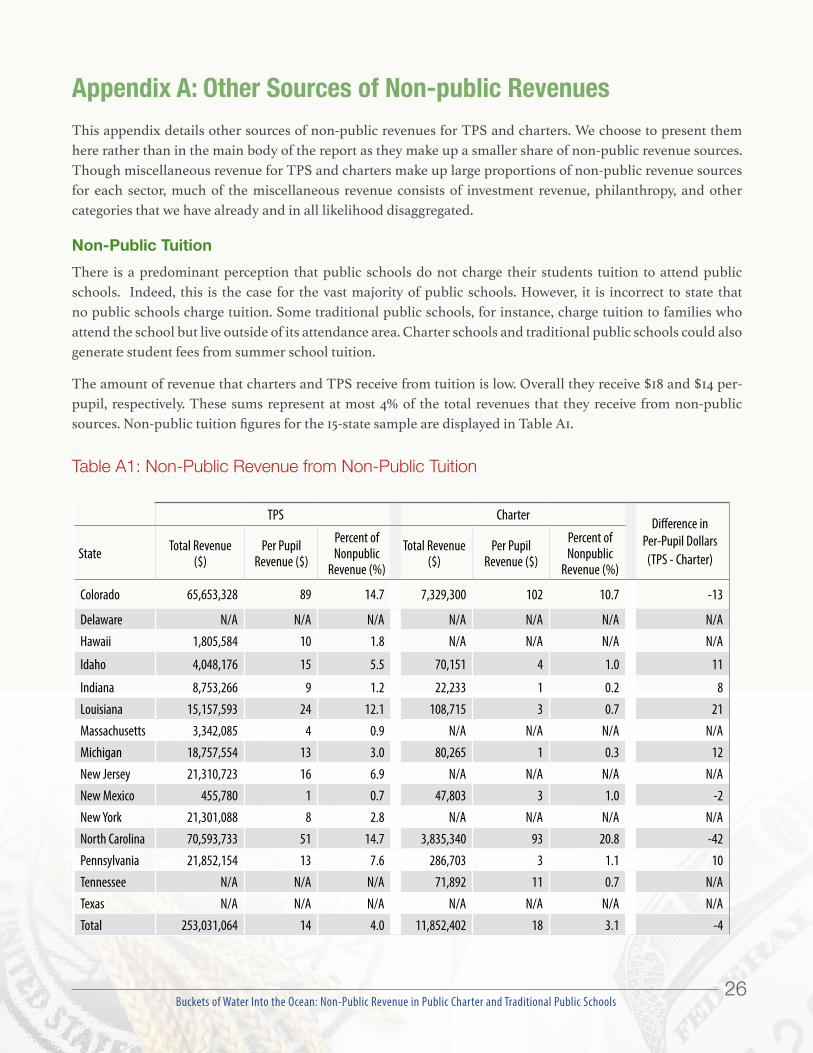
Non-Public TuitionThere is a predominant perception that public schools do not charge their students tuition to attend public schools. Indeed, this is the case for the vast majority of public schools. However, it is incorrect to state that no public schools charge tuition. Some traditional public schools, for instance, charge tuition to families who attend the school but live outside of its attendance area. Charter schools and traditional public schools could also generate student fees from summer school tuition.
The amount of revenue that charters and TPS receive from tuition is low. Overall they receive $18 and $14 per-pupil, respectively. These sums represent at most 4% of the total revenues that they receive from non-public sources. Non-public tuition figures for the 15-state sample are displayed in Table A1.
Table A1: Non-Public Revenue from Non-Public Tuition
TPS CharterDifference in
Per-Pupil Dollars(TPS - Charter)State Total Revenue
($)Per Pupil
Revenue ($)
Percent of Nonpublic
Revenue (%)
Total Revenue($)
Per Pupil Revenue ($)
Percent of Nonpublic
Revenue (%)
Colorado 65,653,328 89 14.7 7,329,300 102 10.7 -13
Delaware N/A N/A N/A N/A N/A N/A N/AHawaii 1,805,584 10 1.8 N/A N/A N/A N/A
Idaho 4,048,176 15 5.5 70,151 4 1.0 11
Indiana 8,753,266 9 1.2 22,233 1 0.2 8Louisiana 15,157,593 24 12.1 108,715 3 0.7 21Massachusetts 3,342,085 4 0.9 N/A N/A N/A N/AMichigan 18,757,554 13 3.0 80,265 1 0.3 12New Jersey 21,310,723 16 6.9 N/A N/A N/A N/ANew Mexico 455,780 1 0.7 47,803 3 1.0 -2New York 21,301,088 8 2.8 N/A N/A N/A N/ANorth Carolina 70,593,733 51 14.7 3,835,340 93 20.8 -42Pennsylvania 21,852,154 13 7.6 286,703 3 1.1 10Tennessee N/A N/A N/A 71,892 11 0.7 N/ATexas N/A N/A N/A N/A N/A N/A N/ATotal 253,031,064 14 4.0 11,852,402 18 3.1 -4
Buckets of Water Into the Ocean: Non-Public Revenue in Public Charter and Traditional Public Schools27
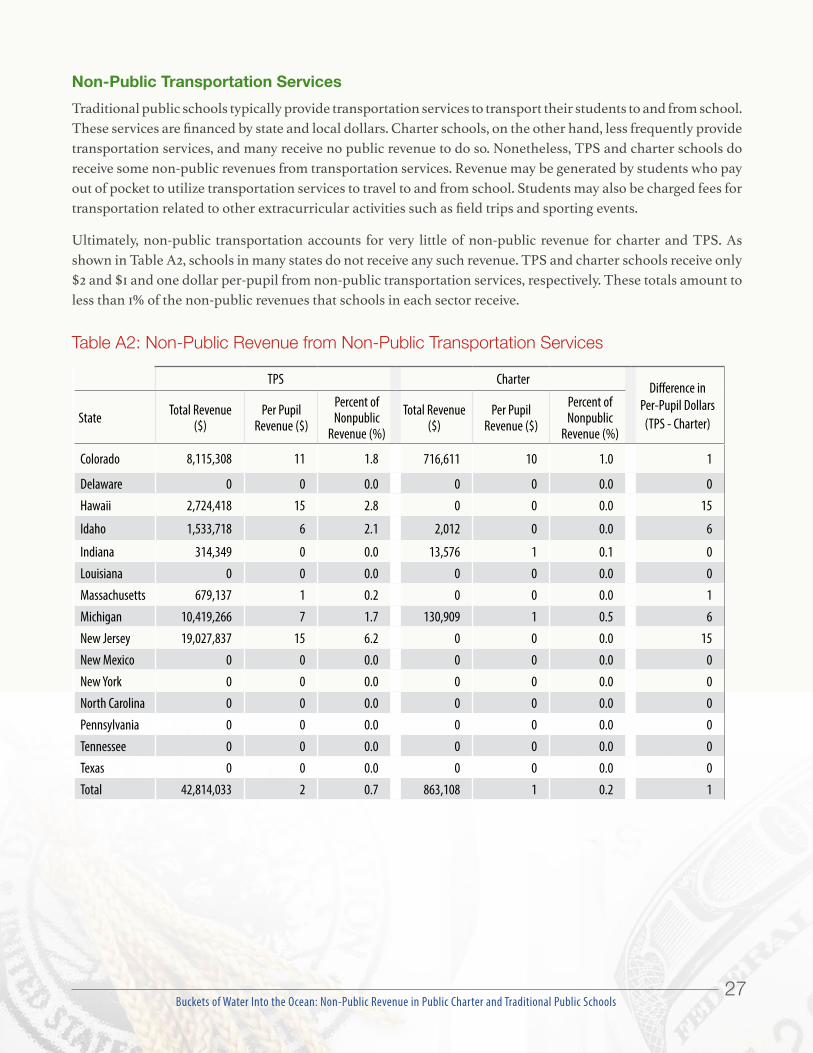
Non-Public Transportation Services Traditional public schools typically provide transportation services to transport their students to and from school. These services are financed by state and local dollars. Charter schools, on the other hand, less frequently provide transportation services, and many receive no public revenue to do so. Nonetheless, TPS and charter schools do receive some non-public revenues from transportation services. Revenue may be generated by students who pay out of pocket to utilize transportation services to travel to and from school. Students may also be charged fees for transportation related to other extracurricular activities such as field trips and sporting events.
Ultimately, non-public transportation accounts for very little of non-public revenue for charter and TPS. As shown in Table A2, schools in many states do not receive any such revenue. TPS and charter schools receive only $2 and $1 and one dollar per-pupil from non-public transportation services, respectively. These totals amount to less than 1% of the non-public revenues that schools in each sector receive.
Table A2: Non-Public Revenue from Non-Public Transportation Services
TPS CharterDifference in
Per-Pupil Dollars(TPS - Charter)State Total Revenue
($)Per Pupil
Revenue ($)
Percent of Nonpublic
Revenue (%)
Total Revenue($)
Per Pupil Revenue ($)
Percent of Nonpublic
Revenue (%)
Colorado 8,115,308 11 1.8 716,611 10 1.0 1
Delaware 0 0 0.0 0 0 0.0 0Hawaii 2,724,418 15 2.8 0 0 0.0 15
Idaho 1,533,718 6 2.1 2,012 0 0.0 6
Indiana 314,349 0 0.0 13,576 1 0.1 0Louisiana 0 0 0.0 0 0 0.0 0Massachusetts 679,137 1 0.2 0 0 0.0 1Michigan 10,419,266 7 1.7 130,909 1 0.5 6New Jersey 19,027,837 15 6.2 0 0 0.0 15New Mexico 0 0 0.0 0 0 0.0 0New York 0 0 0.0 0 0 0.0 0North Carolina 0 0 0.0 0 0 0.0 0Pennsylvania 0 0 0.0 0 0 0.0 0Tennessee 0 0 0.0 0 0 0.0 0Texas 0 0 0.0 0 0 0.0 0Total 42,814,033 2 0.7 863,108 1 0.2 1

Buckets of Water Into the Ocean: Non-Public Revenue in Public Charter and Traditional Public Schools28
Program RevenueCharter schools and TPS frequently sponsor extracurricular activities such as sports and performing arts. These activities often generate revenue from participation fees or admission fees for events associated with them. Customary events such as prom and school dances also charge admission fees.
Revenues from program revenue are shown in Table A3. Like investment revenue, some states report no program revenue, but this does not signify that these states have no program revenue. Rather, program revenue is reported under the miscellaneous revenue category per the revenue reporting requirements for each state. Charter schools receive $26 per pupil in program revenue, while TPS receive $10 less or $16 per pupil. Program revenue comprises about 4% of non-public revenue for both charters and TPS.
Table A3: Non-Public Revenue from Program Income
TPS CharterDifference in
Per-Pupil Dollars(TPS - Charter)State Total Revenue
($)Per Pupil
Revenue ($)
Percent of Nonpublic
Revenue (%)
Total Revenue($)
Per Pupil Revenue ($)
Percent of Nonpublic
Revenue (%)
Colorado 159,157,642 215 35.7 5,999,359 83 8.8 132
Delaware N/A N/A N/A N/A N/A N/A N/AHawaii 472,575 3 0.5 N/A N/A N/A N/A
Idaho N/A N/A N/A 412,406 26 5.6 N/A
Indiana N/A N/A N/A N/A N/A N/A N/ALouisiana N/A N/A N/A N/A N/A N/A N/AMassachusetts 2,421,193 3 0.7 4,090,041 145 11.3 -142Michigan N/A N/A N/A N/A N/A N/A N/ANew Jersey N/A N/A N/A N/A N/A N/A N/ANew Mexico 3,938,675 13 5.8 219,306 14 4.8 -1New York N/A N/A N/A N/A N/A N/A N/ANorth Carolina 7,341,582 5 1.5 N/A N/A N/A N/APennsylvania 25,617,340 15 8.9 2,625,411 29 10.5 -14Tennessee N/A N/A N/A N/A N/A N/A N/ATexas 93,744,490 21 5.5 3,370,559 28 3.8 -7Total 292,693,497 16 4.6 16,717,082 26 4.4 -10
Buckets of Water Into the Ocean: Non-Public Revenue in Public Charter and Traditional Public Schools29
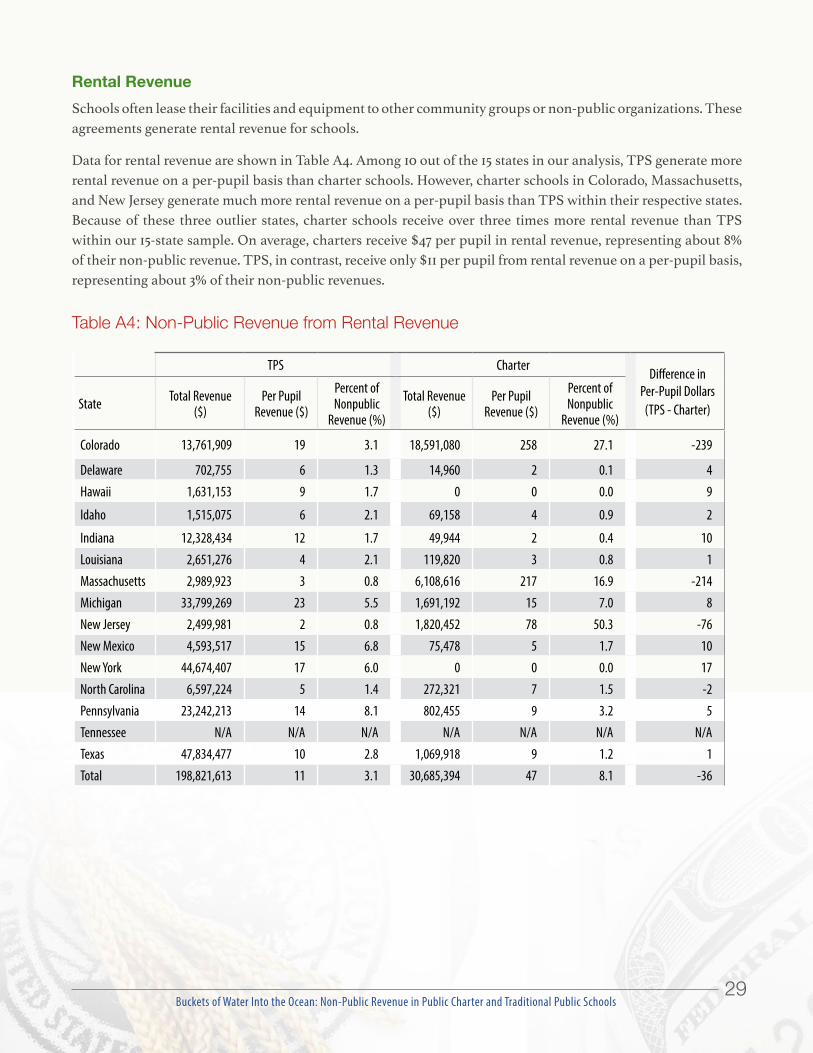
Rental Revenue Schools often lease their facilities and equipment to other community groups or non-public organizations. These agreements generate rental revenue for schools.
Data for rental revenue are shown in Table A4. Among 10 out of the 15 states in our analysis, TPS generate more rental revenue on a per-pupil basis than charter schools. However, charter schools in Colorado, Massachusetts, and New Jersey generate much more rental revenue on a per-pupil basis than TPS within their respective states. Because of these three outlier states, charter schools receive over three times more rental revenue than TPS within our 15-state sample. On average, charters receive $47 per pupil in rental revenue, representing about 8% of their non-public revenue. TPS, in contrast, receive only $11 per pupil from rental revenue on a per-pupil basis, representing about 3% of their non-public revenues.
Table A4: Non-Public Revenue from Rental Revenue
TPS CharterDifference in
Per-Pupil Dollars(TPS - Charter)State Total Revenue
($)Per Pupil
Revenue ($)
Percent of Nonpublic
Revenue (%)
Total Revenue($)
Per Pupil Revenue ($)
Percent of Nonpublic
Revenue (%)
Colorado 13,761,909 19 3.1 18,591,080 258 27.1 -239
Delaware 702,755 6 1.3 14,960 2 0.1 4Hawaii 1,631,153 9 1.7 0 0 0.0 9
Idaho 1,515,075 6 2.1 69,158 4 0.9 2
Indiana 12,328,434 12 1.7 49,944 2 0.4 10Louisiana 2,651,276 4 2.1 119,820 3 0.8 1Massachusetts 2,989,923 3 0.8 6,108,616 217 16.9 -214Michigan 33,799,269 23 5.5 1,691,192 15 7.0 8New Jersey 2,499,981 2 0.8 1,820,452 78 50.3 -76New Mexico 4,593,517 15 6.8 75,478 5 1.7 10New York 44,674,407 17 6.0 0 0 0.0 17North Carolina 6,597,224 5 1.4 272,321 7 1.5 -2Pennsylvania 23,242,213 14 8.1 802,455 9 3.2 5Tennessee N/A N/A N/A N/A N/A N/A N/A Texas 47,834,477 10 2.8 1,069,918 9 1.2 1Total 198,821,613 11 3.1 30,685,394 47 8.1 -36
Buckets of Water Into the Ocean: Non-Public Revenue in Public Charter and Traditional Public Schools30
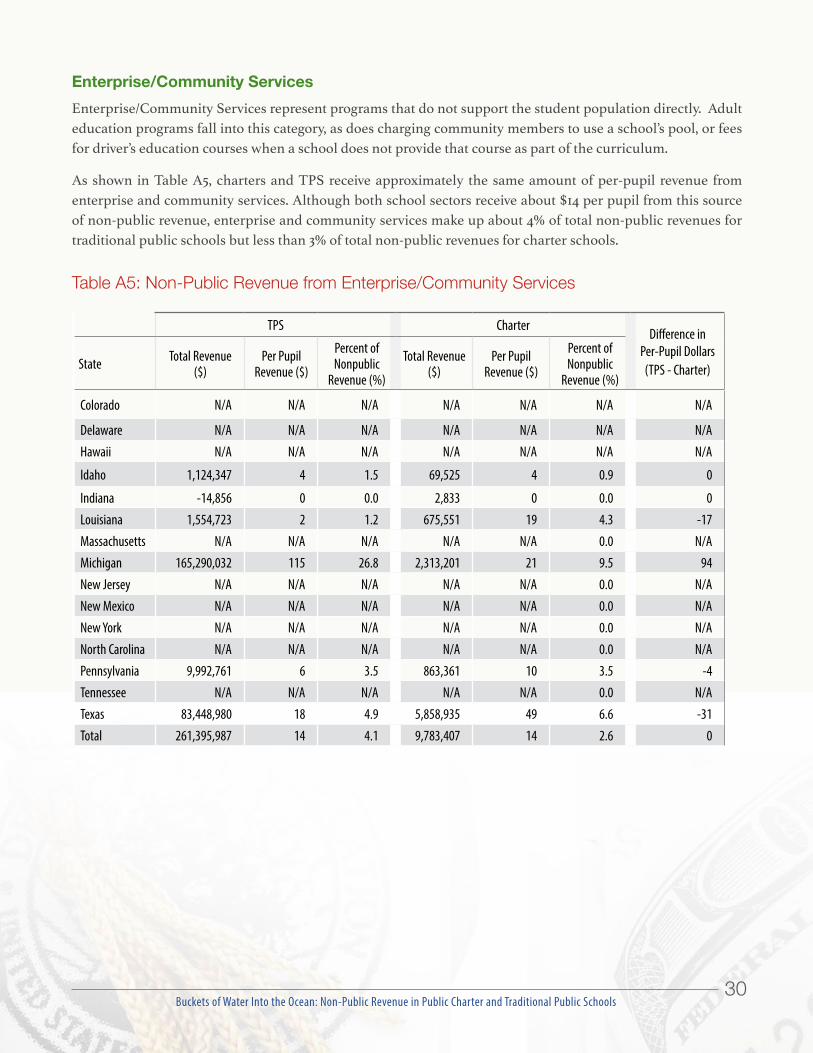
Enterprise/Community ServicesEnterprise/Community Services represent programs that do not support the student population directly. Adult education programs fall into this category, as does charging community members to use a school’s pool, or fees for driver’s education courses when a school does not provide that course as part of the curriculum.
As shown in Table A5, charters and TPS receive approximately the same amount of per-pupil revenue from enterprise and community services. Although both school sectors receive about $14 per pupil from this source of non-public revenue, enterprise and community services make up about 4% of total non-public revenues for traditional public schools but less than 3% of total non-public revenues for charter schools.
Table A5: Non-Public Revenue from Enterprise/Community Services
TPS CharterDifference in
Per-Pupil Dollars(TPS - Charter)State Total Revenue
($)Per Pupil
Revenue ($)
Percent of Nonpublic
Revenue (%)
Total Revenue($)
Per Pupil Revenue ($)
Percent of Nonpublic
Revenue (%)
Colorado N/A N/A N/A N/A N/A N/A N/A
Delaware N/A N/A N/A N/A N/A N/A N/A Hawaii N/A N/A N/A N/A N/A N/A N/A
Idaho 1,124,347 4 1.5 69,525 4 0.9 0
Indiana -14,856 0 0.0 2,833 0 0.0 0Louisiana 1,554,723 2 1.2 675,551 19 4.3 -17Massachusetts N/A N/A N/A N/A N/A 0.0 N/AMichigan 165,290,032 115 26.8 2,313,201 21 9.5 94New Jersey N/A N/A N/A N/A N/A 0.0 N/ANew Mexico N/A N/A N/A N/A N/A 0.0 N/ANew York N/A N/A N/A N/A N/A 0.0 N/ANorth Carolina N/A N/A N/A N/A N/A 0.0 N/APennsylvania 9,992,761 6 3.5 863,361 10 3.5 -4Tennessee N/A N/A N/A N/A N/A 0.0 N/ATexas 83,448,980 18 4.9 5,858,935 49 6.6 -31Total 261,395,987 14 4.1 9,783,407 14 2.6 0
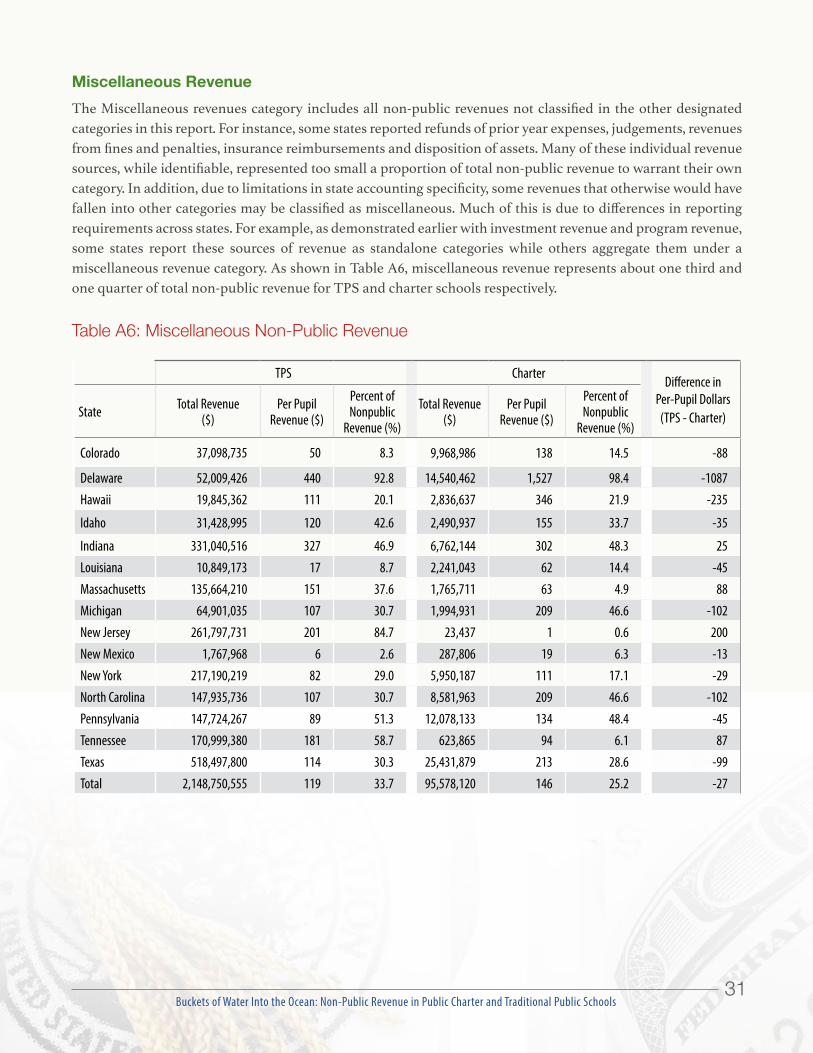
Buckets of Water Into the Ocean: Non-Public Revenue in Public Charter and Traditional Public Schools31
Miscellaneous RevenueThe Miscellaneous revenues category includes all non-public revenues not classified in the other designated categories in this report. For instance, some states reported refunds of prior year expenses, judgements, revenues from fines and penalties, insurance reimbursements and disposition of assets. Many of these individual revenue sources, while identifiable, represented too small a proportion of total non-public revenue to warrant their own category. In addition, due to limitations in state accounting specificity, some revenues that otherwise would have fallen into other categories may be classified as miscellaneous. Much of this is due to differences in reporting requirements across states. For example, as demonstrated earlier with investment revenue and program revenue, some states report these sources of revenue as standalone categories while others aggregate them under a miscellaneous revenue category. As shown in Table A6, miscellaneous revenue represents about one third and one quarter of total non-public revenue for TPS and charter schools respectively.
Table A6: Miscellaneous Non-Public Revenue
TPS CharterDifference in
Per-Pupil Dollars(TPS - Charter)State Total Revenue
($)Per Pupil
Revenue ($)
Percent of Nonpublic
Revenue (%)
Total Revenue($)
Per Pupil Revenue ($)
Percent of Nonpublic
Revenue (%)
Colorado 37,098,735 50 8.3 9,968,986 138 14.5 -88
Delaware 52,009,426 440 92.8 14,540,462 1,527 98.4 -1087Hawaii 19,845,362 111 20.1 2,836,637 346 21.9 -235
Idaho 31,428,995 120 42.6 2,490,937 155 33.7 -35
Indiana 331,040,516 327 46.9 6,762,144 302 48.3 25Louisiana 10,849,173 17 8.7 2,241,043 62 14.4 -45Massachusetts 135,664,210 151 37.6 1,765,711 63 4.9 88Michigan 64,901,035 107 30.7 1,994,931 209 46.6 -102New Jersey 261,797,731 201 84.7 23,437 1 0.6 200New Mexico 1,767,968 6 2.6 287,806 19 6.3 -13New York 217,190,219 82 29.0 5,950,187 111 17.1 -29North Carolina 147,935,736 107 30.7 8,581,963 209 46.6 -102Pennsylvania 147,724,267 89 51.3 12,078,133 134 48.4 -45Tennessee 170,999,380 181 58.7 623,865 94 6.1 87Texas 518,497,800 114 30.3 25,431,879 213 28.6 -99Total 2,148,750,555 119 33.7 95,578,120 146 25.2 -27

Buckets of Water Into the Ocean: Non-Public Revenue in Public Charter and Traditional Public Schools32
Appendix B: The Distribution of Philanthropic Revenue to Charters in Specific Metropolitan Areas We also analyze philanthropic giving to charters within 22 major metropolitan areas. Appendix Table B1 first provides some context. The first two columns depict what percentage of the state’s charter schools and charter-school enrollment is located in each respective metropolitan area. For instance, 50% of Colorado charter schools are located in the Denver area and serve about 12% of all Colorado charter school students. As shown in the last column, these metropolitan areas, on average, consist of 50% of their respective state’s charter schools and serve nearly 50% of their respective state’s charter school students. Table B1 also shows the amount of philanthropic revenue received by each metropolitan area as a percentage of all philanthropic revenue received by charters within the state. Consider again Denver, CO. Per column 3 of the table, charter schools in Denver receive 10% of all philanthropic revenues provided to the state of Colorado. These philanthropic revenues represent approximately 0.3% of all revenue that Denver charter schools receive. In all, charter schools in these metropolitan areas receive, on average, about two-thirds of all (67.6%) of all philanthropic revenues directed to their respective states. This philanthropic revenue represents about 1.7% of all revenues that these charter schools receive. Overall, only two out of the 22 metropolitan areas in this analysis have charter schools where philanthropic giving makes up over 3% of total revenue.
Table B1. Metropolitan Area Summary Statistics
AreaPercentage of State’s Charter
Schools Located in Area (%)
Percentage of State’s Charter School Enrollment
(%)
Philanthropy Received as a Percentage of Total
Philanthropy Received by the State’s Charters (%)
Percent of Total Revenue comprising of
Philanthropy (%)
Albany, NY 6.8 4.6 4.9 0.1
Albuquerque, NM 59.3 65.6 50.9 0.7Boise, ID 20.5 34.4 30.6 1.1
Boston, MA 25.4 19.7 68.2 3.5
Buffalo, NY 8.1 10.2 1.4 0.0Dallas, TX 17.9 22.0 11.9 0.4Davidson, TN 14.3 14.8 15.0 2.0Denver, CO 50.0 11.8 10.4 0.3Detroit, MI 22.9 31.1 42.7 0.5East Baton Rouge, LA 17.6 11.1 14.9 0.4Gary, IN 11.7 19.8 9.2 0.2Houston, TX 20.7 25.6 51.8 1.9Indianapolis, IN 43.3 47.0 72.7 0.6Jersey City, NJ 9.7 11.0 4.8 0.2New Orleans, LA 67.0 76.2 82.2 2.2New York City, NY 72.7 70.3 90.5 2.7Newark, NJ 20.8 27.8 94.1 0.5

Buckets of Water Into the Ocean: Non-Public Revenue in Public Charter and Traditional Public Schools33
AreaPercentage of State’s Charter
Schools Located in Area (%)
Percentage of State’s Charter School Enrollment
(%)
Philanthropy Received as a Percentage of Total
Philanthropy Received by the State’s Charters (%)
Percent of Total Revenue comprising of
Philanthropy (%)
Philadelphia, PA 58.5 63.5 82.2 0.5Pittsburgh, PA 12.7 17.2 11.6 0.1Shelby, TN 75.0 78.1 62.6 8.2Trenton, NJ 5.6 3.9 1.0 0.0Wake County, NC 12.2 11.5 9.7 0.1Total 50.0 48.9 67.6 1.7
Appendix Table B2 provides a sense of the distribution of philanthropic revenues across charter schools within each metropolitan area. Appendix Table B2 is analogous to Table 6 in the main report. Results based upon major metropolitan areas mirror the results based upon states. That is, philanthropic revenues received by charter schools are not equally distributed across charters within each metropolitan area. Certain charter school students are receiving most or, in some cases, all of the philanthropic dollars given to charter schools. For example, in Denver, Colorado, about 20% of all charter school students receive about 90% of all philanthropic support. Overall, as shown in the last row of Appendix Table B2, an average of 35% of charter school students in these metropolitan areas receive about 90% of all philanthropic revenues given to charter schools in those same respective areas.
Table B2. Distribution of Philanthropic Revenue across Charter School Quartiles by Metropolitan Area
Philanthropic Revenue(Per-Pupil $) Percent of Total Enrollment (%) Percent of Nonpublic Revenue (%)
Quartile 1 2 3 4 1 2 3 4 1 2 3 4
Albany, NY 4,640 243 60 1 10.0 10.9 44.7 34.4 89.7 5.1 5.2 0.0
Albuquerque, NM 522 28 6 0 19.1 33.4 25.0 22.5 90.0 8.6 1.5 0.0
Boise, ID 932 186 0 0 15.2 29.9 0.0 54.9 71.8 28.2 0.0 0.0
Boston, MA 3,091 417 0 32 78.2 20.6 0.0 1.2 96.6 3.4 0.0 0.0
Buffalo, NY 0 235 77 1 0.0 22.4 18.4 59.2 0.0 78.2 21.2 0.6
Dallas, TX 557 9 0 0 37.1 26.0 27.5 9.4 98.9 1.1 0.0 0.0
Davidson, TN 2,088 $0 77 0 66.0 0.0 34.0 0.0 98.1 0.0 1.9 0.0
Denver, CO 871 87 0 0 20.6 21.4 19.1 39.0 90.6 9.4 0.0 0.0
Detroit, MI 321 17 0 0 47.4 10.7 2.9 39.0 98.8 1.2 0.0 0.0
East Baton Rouge, LA 1,562 804 26 1 19.7 10.9 35.4 33.9 76.0 21.7 2.2 0.1
Gary, IN 852 t0 2 0 8.5 0.0 42.2 49.3 98.5 0.0 1.3 0.2
Houston, TX 1,220 18 0 0 63.9 12.3 14.9 8.9 99.7 0.3 0.0 0.0
Indianapolis, IN 794 52 6 0 28.5 29.7 22.9 18.9 93.0 6.4 0.6 0.0
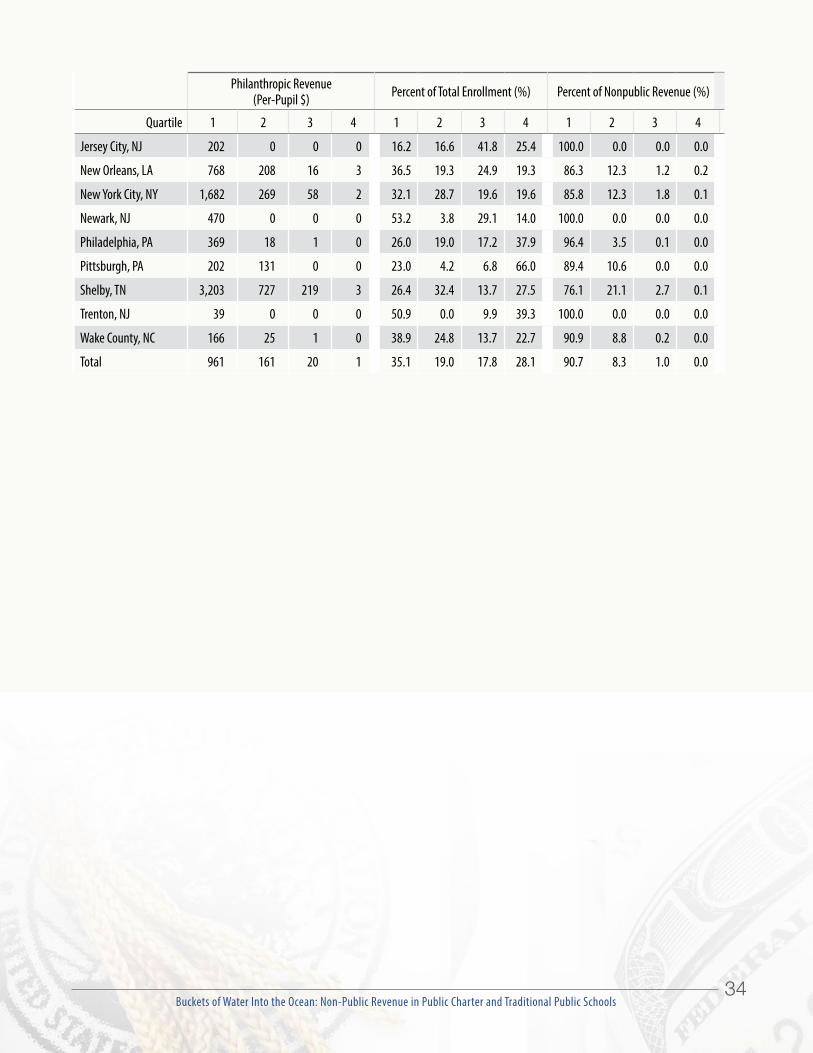
Buckets of Water Into the Ocean: Non-Public Revenue in Public Charter and Traditional Public Schools34
Philanthropic Revenue(Per-Pupil $) Percent of Total Enrollment (%) Percent of Nonpublic Revenue (%)
Quartile 1 2 3 4 1 2 3 4 1 2 3 4
Jersey City, NJ 202 0 0 0 16.2 16.6 41.8 25.4 100.0 0.0 0.0 0.0
New Orleans, LA 768 208 16 3 36.5 19.3 24.9 19.3 86.3 12.3 1.2 0.2
New York City, NY 1,682 269 58 2 32.1 28.7 19.6 19.6 85.8 12.3 1.8 0.1
Newark, NJ 470 0 0 0 53.2 3.8 29.1 14.0 100.0 0.0 0.0 0.0
Philadelphia, PA 369 18 1 0 26.0 19.0 17.2 37.9 96.4 3.5 0.1 0.0
Pittsburgh, PA 202 131 0 0 23.0 4.2 6.8 66.0 89.4 10.6 0.0 0.0
Shelby, TN 3,203 727 219 3 26.4 32.4 13.7 27.5 76.1 21.1 2.7 0.1
Trenton, NJ 39 0 0 0 50.9 0.0 9.9 39.3 100.0 0.0 0.0 0.0
Wake County, NC 166 25 1 0 38.9 24.8 13.7 22.7 90.9 8.8 0.2 0.0
Total 961 161 20 1 35.1 19.0 17.8 28.1 90.7 8.3 1.0 0.0
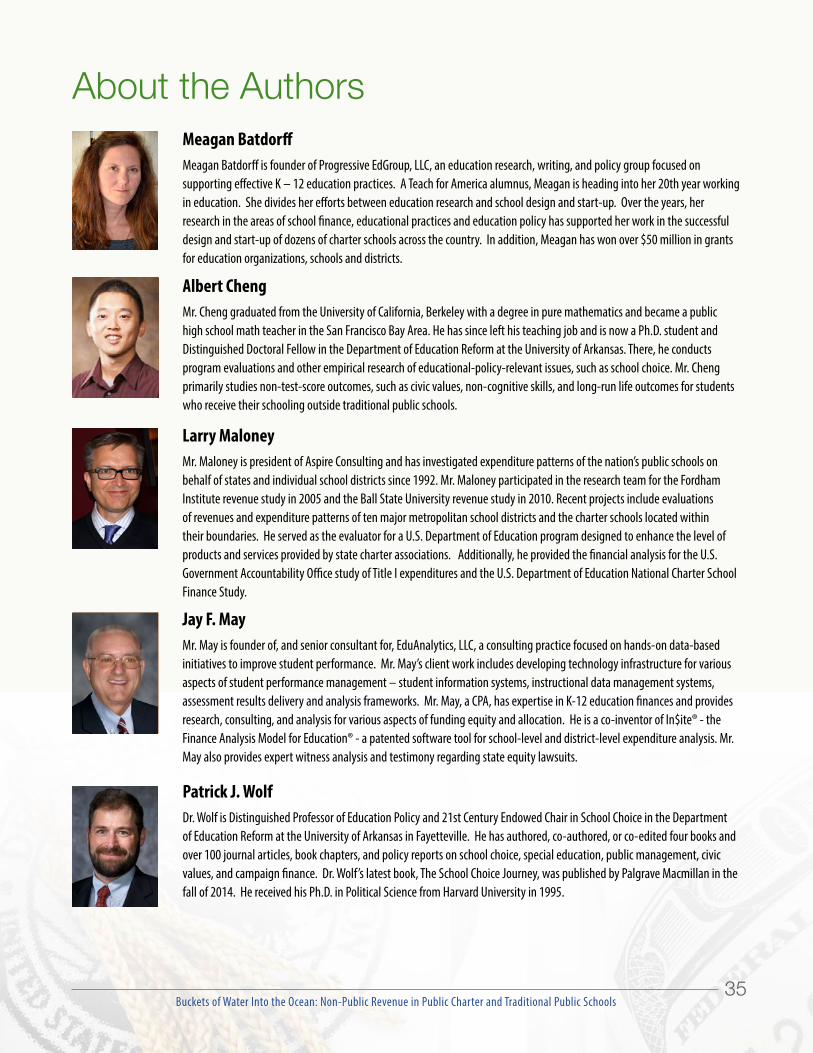
Buckets of Water Into the Ocean: Non-Public Revenue in Public Charter and Traditional Public Schools35
About the Authors
Patrick J. WolfDr. Wolf is Distinguished Professor of Education Policy and 21st Century Endowed Chair in School Choice in the Department of Education Reform at the University of Arkansas in Fayetteville. He has authored, co-authored, or co-edited four books and over 100 journal articles, book chapters, and policy reports on school choice, special education, public management, civic values, and campaign finance. Dr. Wolf’s latest book, The School Choice Journey, was published by Palgrave Macmillan in the fall of 2014. He received his Ph.D. in Political Science from Harvard University in 1995.
Jay f. MayMr. May is founder of, and senior consultant for, EduAnalytics, LLC, a consulting practice focused on hands-on data-based initiatives to improve student performance. Mr. May’s client work includes developing technology infrastructure for various aspects of student performance management – student information systems, instructional data management systems, assessment results delivery and analysis frameworks. Mr. May, a CPA, has expertise in K-12 education finances and provides research, consulting, and analysis for various aspects of funding equity and allocation. He is a co-inventor of In$ite® - the Finance Analysis Model for Education® - a patented software tool for school-level and district-level expenditure analysis. Mr. May also provides expert witness analysis and testimony regarding state equity lawsuits.
Meagan BatdorffMeagan Batdorff is founder of Progressive EdGroup, LLC, an education research, writing, and policy group focused on supporting effective K – 12 education practices. A Teach for America alumnus, Meagan is heading into her 20th year working in education. She divides her efforts between education research and school design and start-up. Over the years, her research in the areas of school finance, educational practices and education policy has supported her work in the successful design and start-up of dozens of charter schools across the country. In addition, Meagan has won over $50 million in grants for education organizations, schools and districts.
albert chengMr. Cheng graduated from the University of California, Berkeley with a degree in pure mathematics and became a public high school math teacher in the San Francisco Bay Area. He has since left his teaching job and is now a Ph.D. student and Distinguished Doctoral Fellow in the Department of Education Reform at the University of Arkansas. There, he conducts program evaluations and other empirical research of educational-policy-relevant issues, such as school choice. Mr. Cheng primarily studies non-test-score outcomes, such as civic values, non-cognitive skills, and long-run life outcomes for students who receive their schooling outside traditional public schools.
Larry MaloneyMr. Maloney is president of Aspire Consulting and has investigated expenditure patterns of the nation’s public schools on behalf of states and individual school districts since 1992. Mr. Maloney participated in the research team for the Fordham Institute revenue study in 2005 and the Ball State University revenue study in 2010. Recent projects include evaluations of revenues and expenditure patterns of ten major metropolitan school districts and the charter schools located within their boundaries. He served as the evaluator for a U.S. Department of Education program designed to enhance the level of products and services provided by state charter associations. Additionally, he provided the financial analysis for the U.S. Government Accountability Office study of Title I expenditures and the U.S. Department of Education National Charter School Finance Study.
Recommended