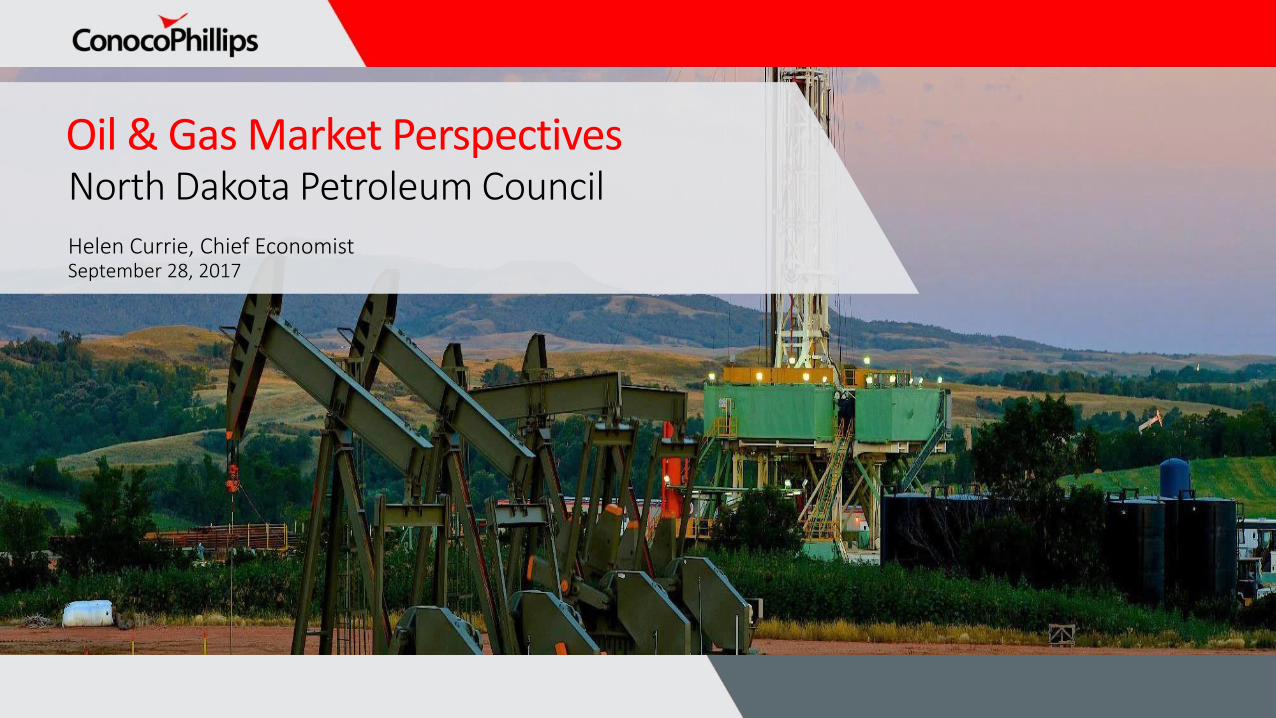
Oil & Gas Market Perspectives
Helen Currie, Chief EconomistSeptember 28, 2017
North Dakota Petroleum Council
Cautionary Statement
The following presentation includes forward-looking statements. These statements relate to future events, such as anticipated revenues, earnings, business strategies, competitive position or other aspects of our operations, operating results or the industries or markets in which we operate or participate in general. Actual outcomes and results may differ materially from what is expressed or forecast in such forward-looking statements. These statements are not guarantees of future performance and involve certain risks, uncertainties and assumptions that may prove to be incorrect and are difficult to predict such as our ability to complete the sale of our announced dispositions on the timeline currently anticipated, if at all; the possibility that regulatory approvals for our announced dispositions will not be received on a timely basis, if at all, or that such approvals may require modification to the terms of of our announced dispositions or our remaining business; business disruptions during or following the sale of our announced dispositions, including the diversion of management time and attention; our ability to liquidate the common stock issued to us by Cenovus Energy Inc. as part of our sale of assets in western Canada at prices we deem acceptable, or at all; the ability to deploy net proceeds from our announced dispositions in the manner and timeframe we currently anticipate, if at all; operational hazards and drilling risks; potential failure to achieve, and potential delays in achieving expected reserves or production levels from existing and future oil and gas development projects; unsuccessful exploratory activities; unexpected cost increases or technical difficulties in constructing, maintaining or modifying company facilities; international monetary conditions and exchange controls; potential liability for remedial actions under existing or future environmental regulations or from pending or future litigation; limited access to capital or significantly higher cost of capital related to illiquidity or uncertainty in the domestic or international financial markets; general domestic and international economic and political conditions, and changes in tax, environmental and other laws applicable to ConocoPhillips’ business; and other economic, business, competitive and/or regulatory factors affecting ConocoPhillips’ business generally as set forth in ConocoPhillips’ filings with the Securities and Exchange Commission (SEC). We caution you not to place undue reliance on our forward-looking statements, which are only as of the date of this presentation or as otherwise indicated, and we expressly disclaim any responsibility for updating such information
2
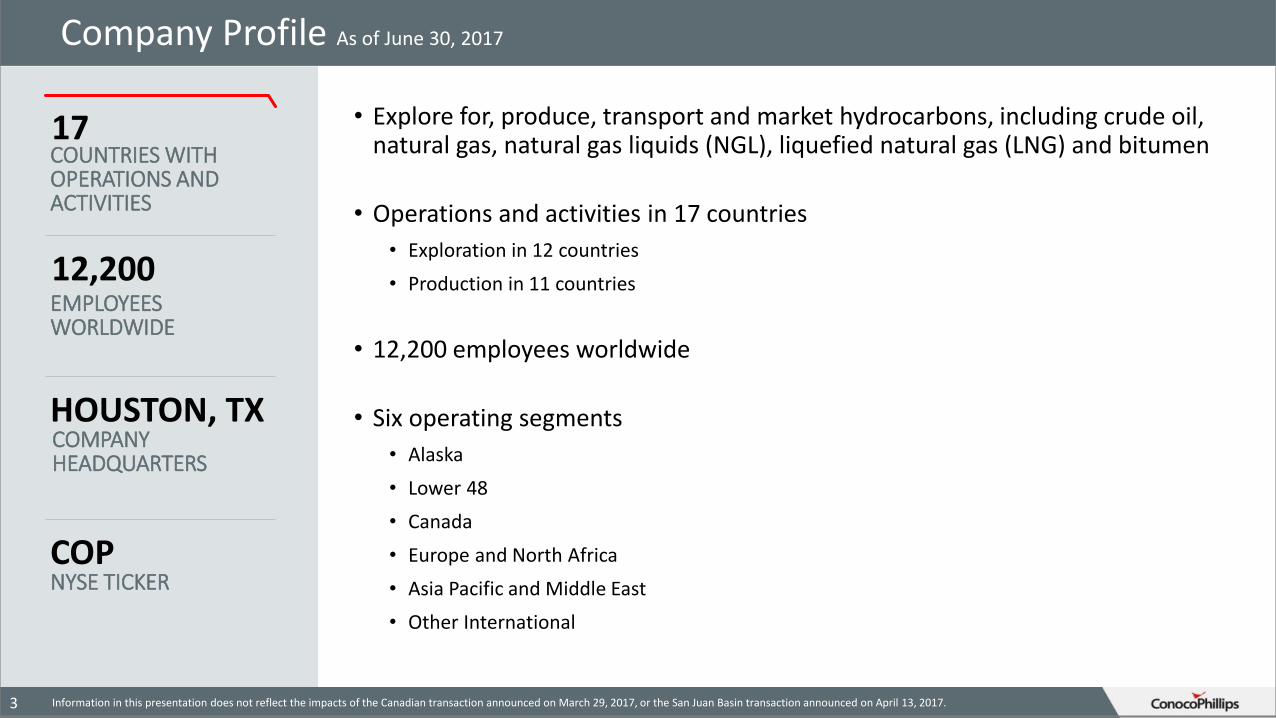
• Explore for, produce, transport and market hydrocarbons, including crude oil, natural gas, natural gas liquids (NGL), liquefied natural gas (LNG) and bitumen
• Operations and activities in 17 countries
• Exploration in 12 countries
• Production in 11 countries
• 12,200 employees worldwide
• Six operating segments
• Alaska
• Lower 48
• Canada
• Europe and North Africa
• Asia Pacific and Middle East
• Other International
Company Profile As of June 30, 2017
17COUNTRIES WITH OPERATIONS AND ACTIVITIES
HOUSTON, TXCOMPANY HEADQUARTERS
COPNYSE TICKER
12,200EMPLOYEES WORLDWIDE
3 Information in this presentation does not reflect the impacts of the Canadian transaction announced on March 29, 2017, or the San Juan Basin transaction announced on April 13, 2017.
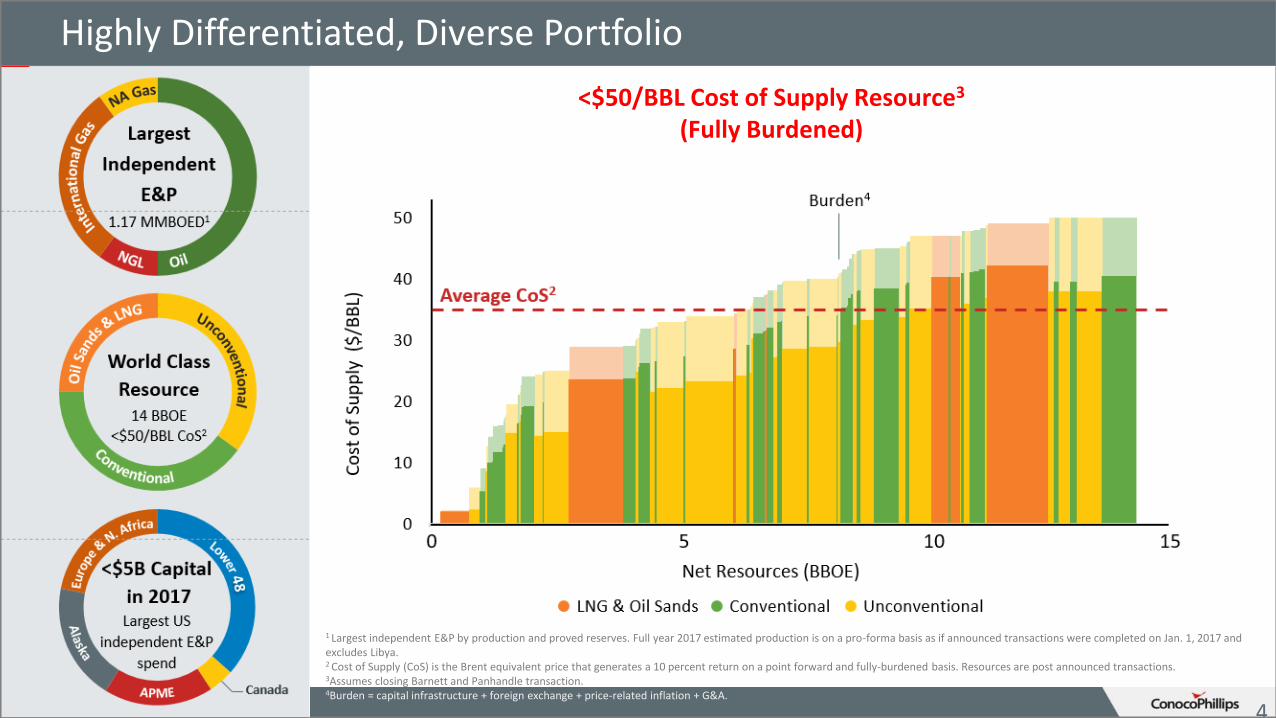
Highly Differentiated, Diverse Portfolio
4
1 Largest independent E&P by production and proved reserves. Full year 2017 estimated production is on a pro-forma basis as if announced transactions were completed on Jan. 1, 2017 and excludes Libya.2 Cost of Supply (CoS) is the Brent equivalent price that generates a 10 percent return on a point forward and fully-burdened basis. Resources are post announced transactions.3Assumes closing Barnett and Panhandle transaction.4Burden = capital infrastructure + foreign exchange + price-related inflation + G&A.
<$50/BBL Cost of Supply Resource3
(Fully Burdened)
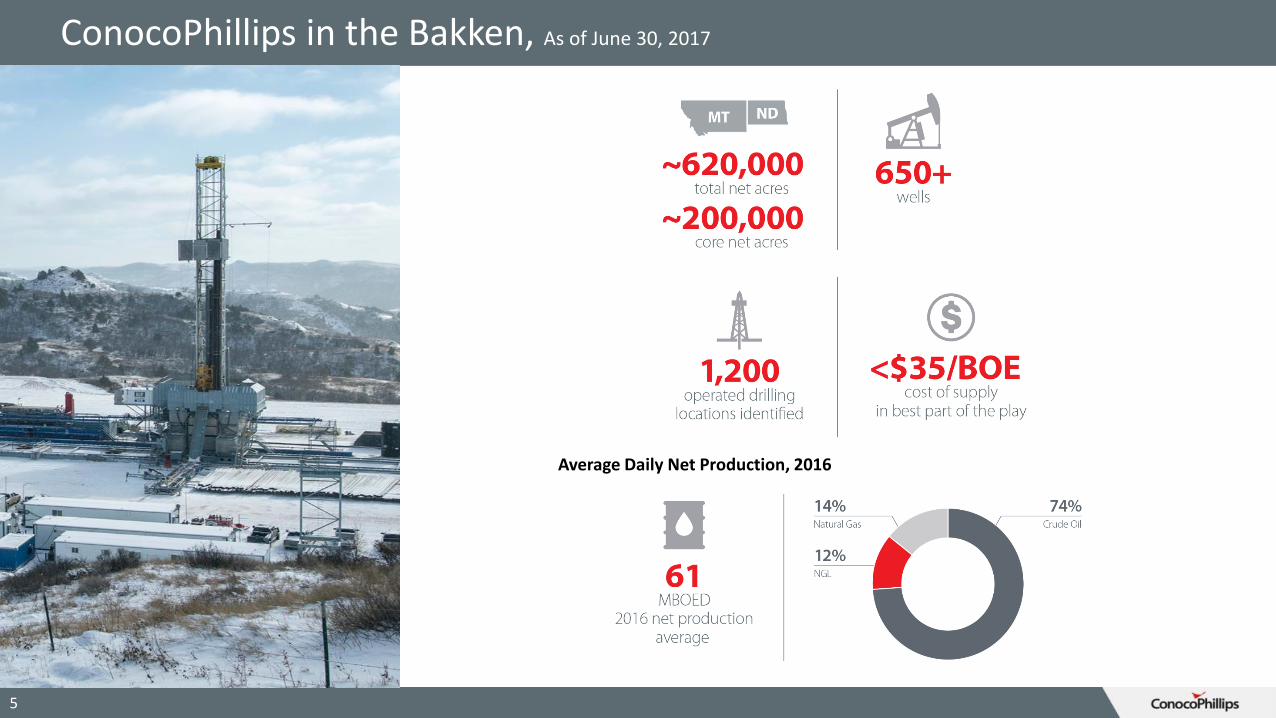
ConocoPhillips in the Bakken, As of June 30, 2017
Average Daily Net Production, 2016
5
6
Crude Oil Market Outlook
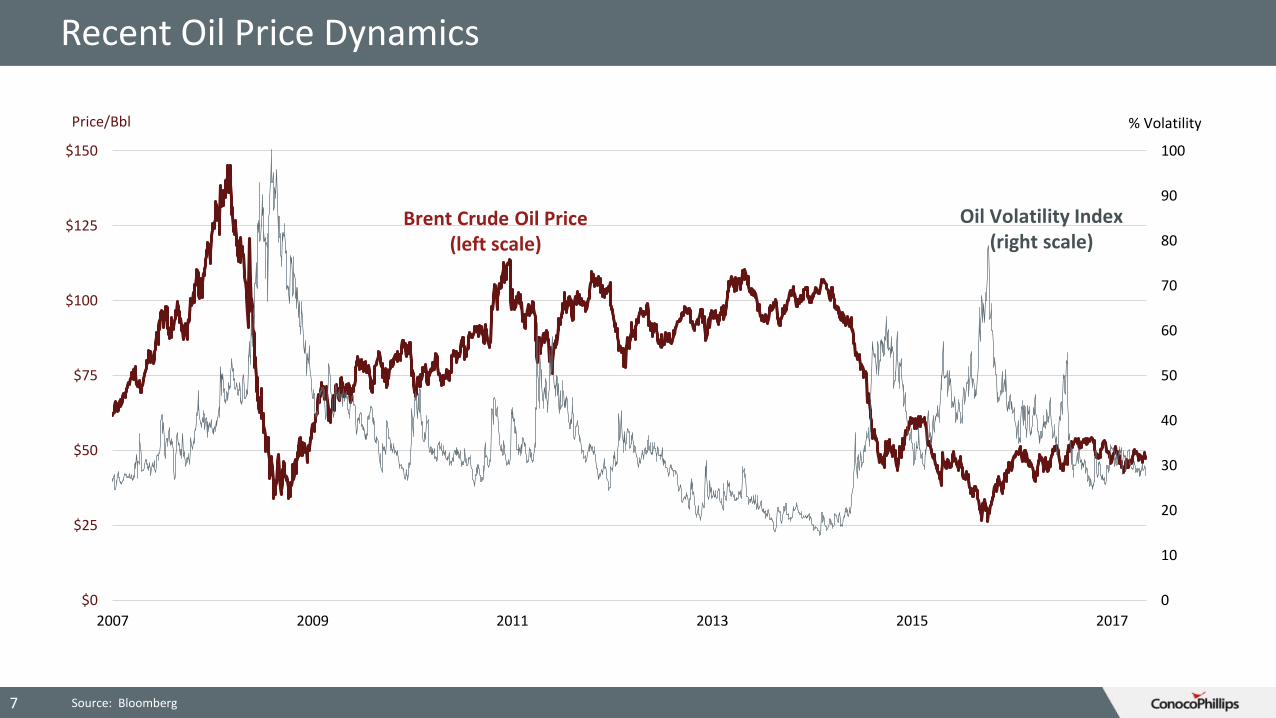
Recent Oil Price Dynamics
0
10
20
30
40
50
60
70
80
90
100
$0
$25
$50
$75
$100
$125
$150
2007 2009 2011 2013 2015 2017
Brent Crude Oil Price(left scale)
Oil Volatility Index(right scale)
Price/Bbl % Volatility
7 Source: Bloomberg
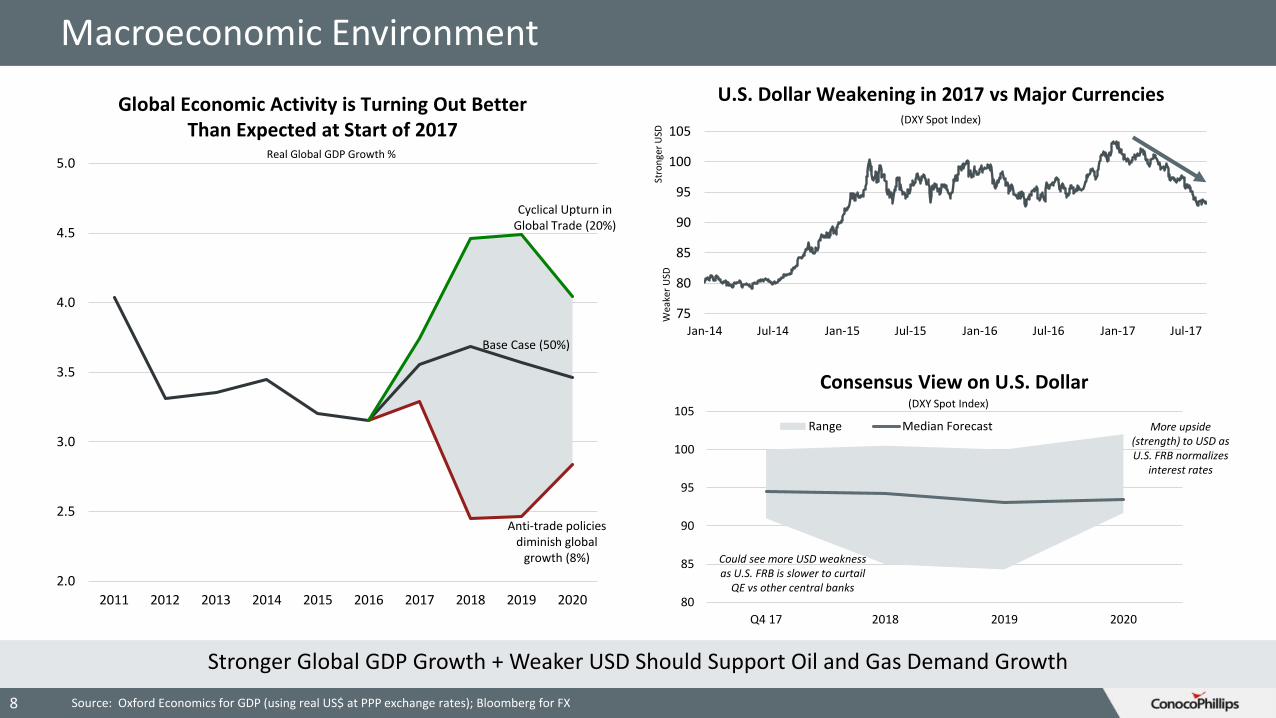
Macroeconomic Environment
8
2.0
2.5
3.0
3.5
4.0
4.5
5.0
2011 2012 2013 2014 2015 2016 2017 2018 2019 2020
Global Economic Activity is Turning Out Better Than Expected at Start of 2017
Real Global GDP Growth %
Cyclical Upturn in Global Trade (20%)
Anti-trade policies diminish global
growth (8%)
Base Case (50%)
Source: Oxford Economics for GDP (using real US$ at PPP exchange rates); Bloomberg for FX
75
80
85
90
95
100
105
Jan-14 Jul-14 Jan-15 Jul-15 Jan-16 Jul-16 Jan-17 Jul-17
U.S. Dollar Weakening in 2017 vs Major Currencies(DXY Spot Index)
Wea
ker
USD
Stro
nge
r U
SD
80
85
90
95
100
105
Q4 17 2018 2019 2020
Range Median Forecast
Consensus View on U.S. Dollar(DXY Spot Index)
Could see more USD weakness as U.S. FRB is slower to curtail
QE vs other central banks
More upside (strength) to USD as U.S. FRB normalizes
interest rates
Stronger Global GDP Growth + Weaker USD Should Support Oil and Gas Demand Growth
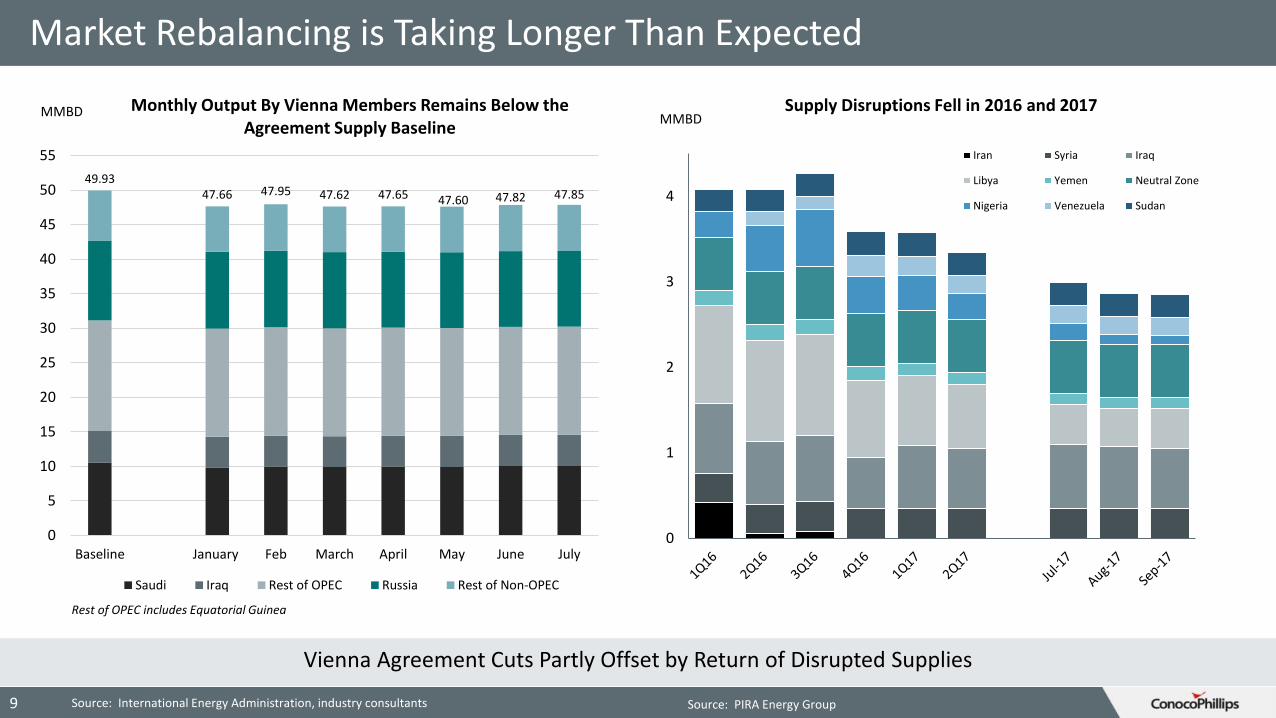
Market Rebalancing is Taking Longer Than Expected
9
0
1
2
3
4
Iran Syria Iraq
Libya Yemen Neutral Zone
Nigeria Venezuela Sudan
Supply Disruptions Fell in 2016 and 2017MMBD
Vienna Agreement Cuts Partly Offset by Return of Disrupted Supplies
49.9347.66 47.95 47.62 47.65 47.60 47.82 47.85
0
5
10
15
20
25
30
35
40
45
50
55
Baseline January Feb March April May June July
Monthly Output By Vienna Members Remains Below the Agreement Supply Baseline
Saudi Iraq Rest of OPEC Russia Rest of Non-OPEC
MMBD
Rest of OPEC includes Equatorial Guinea
Source: International Energy Administration, industry consultants Source: PIRA Energy Group
$0
$20
$40
$60
$80
$100
$120
$140
$160
$180
$0 $20 $40 $60 $80 $100 $120
Fisc
al B
reak
-Eve
n P
rice
s ($
/bb
l)
Current Account Break-Even Prices ($/bbl)
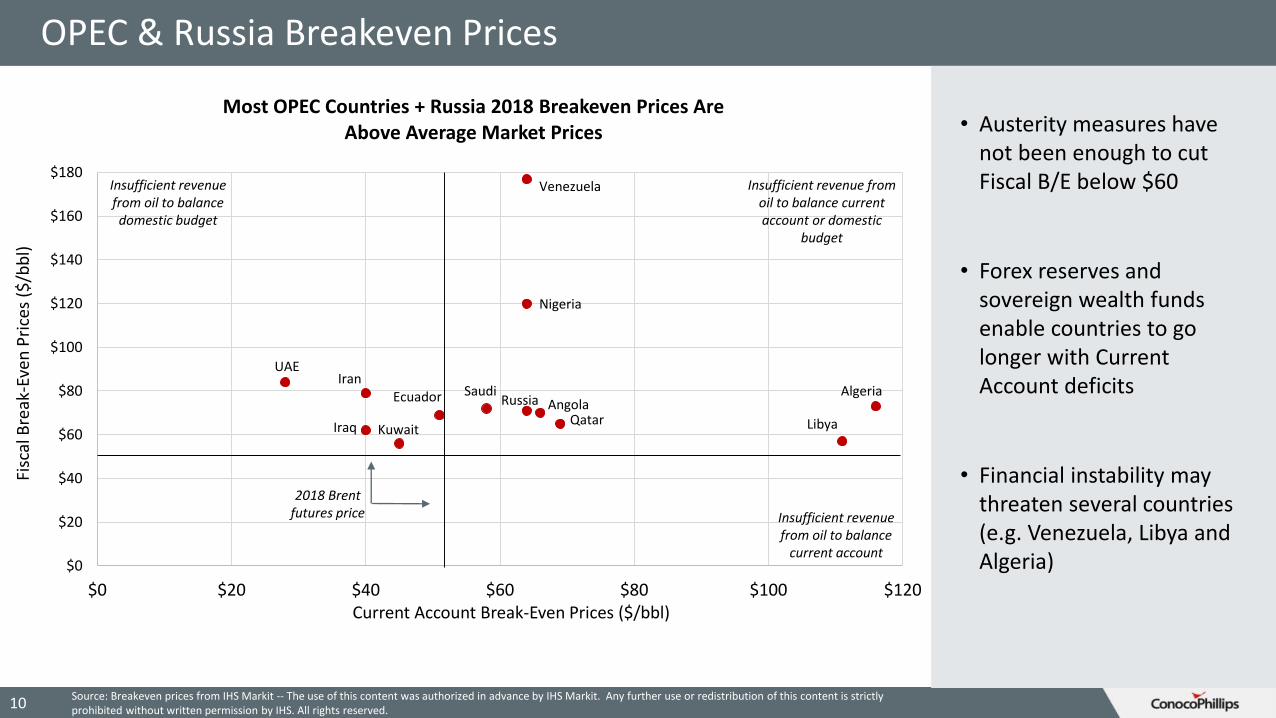
Most OPEC Countries + Russia 2018 Breakeven Prices Are Above Average Market Prices
Venezuela
Nigeria
Algeria
LibyaQatarAngola
SaudiEcuador
Kuwait
Iran
Iraq
UAE
Russia
OPEC & Russia Breakeven Prices
• Austerity measures have not been enough to cut Fiscal B/E below $60
• Forex reserves and sovereign wealth funds enable countries to go longer with Current Account deficits
• Financial instability may threaten several countries (e.g. Venezuela, Libya and Algeria)
10
Insufficient revenue from oil to balance current account or domestic
budget
2018 Brent futures price
Insufficient revenue from oil to balance domestic budget
Insufficient revenue from oil to balance
current account
Source: Breakeven prices from IHS Markit -- The use of this content was authorized in advance by IHS Markit. Any further use or redistribution of this content is strictly prohibited without written permission by IHS. All rights reserved.
(2.0)
(1.5)
(1.0)
(0.5)
0.0
0.5
1.0
1.5
2.0
94
95
96
97
98
99
100
101
102
2015 2016 2017 2018 2019 2020
Inventory Change (right axis)
Supply (left axis)
Demand (left axis)
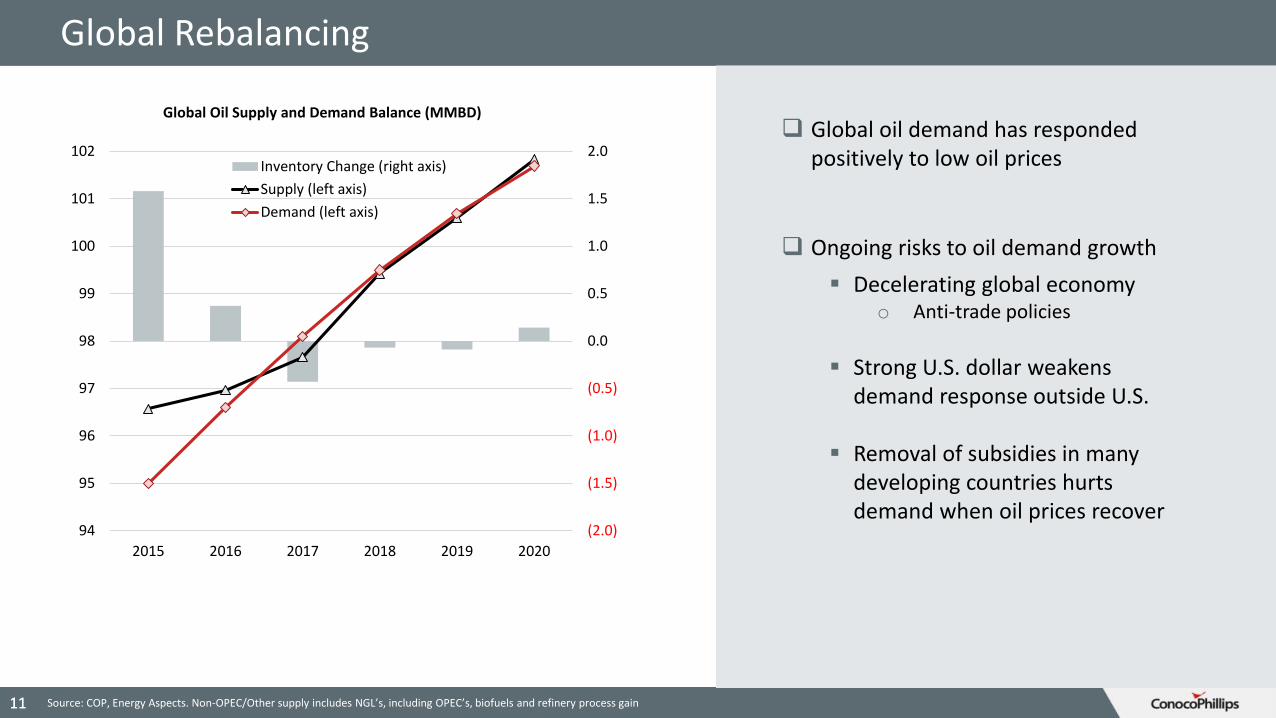
Global Oil Supply and Demand Balance (MMBD)
1111 Source: COP, Energy Aspects. Non-OPEC/Other supply includes NGL’s, including OPEC’s, biofuels and refinery process gain
Global Rebalancing
Global oil demand has responded positively to low oil prices
Ongoing risks to oil demand growth
▪ Decelerating global economyo Anti-trade policies
▪ Strong U.S. dollar weakens demand response outside U.S.
▪ Removal of subsidies in many developing countries hurts demand when oil prices recover
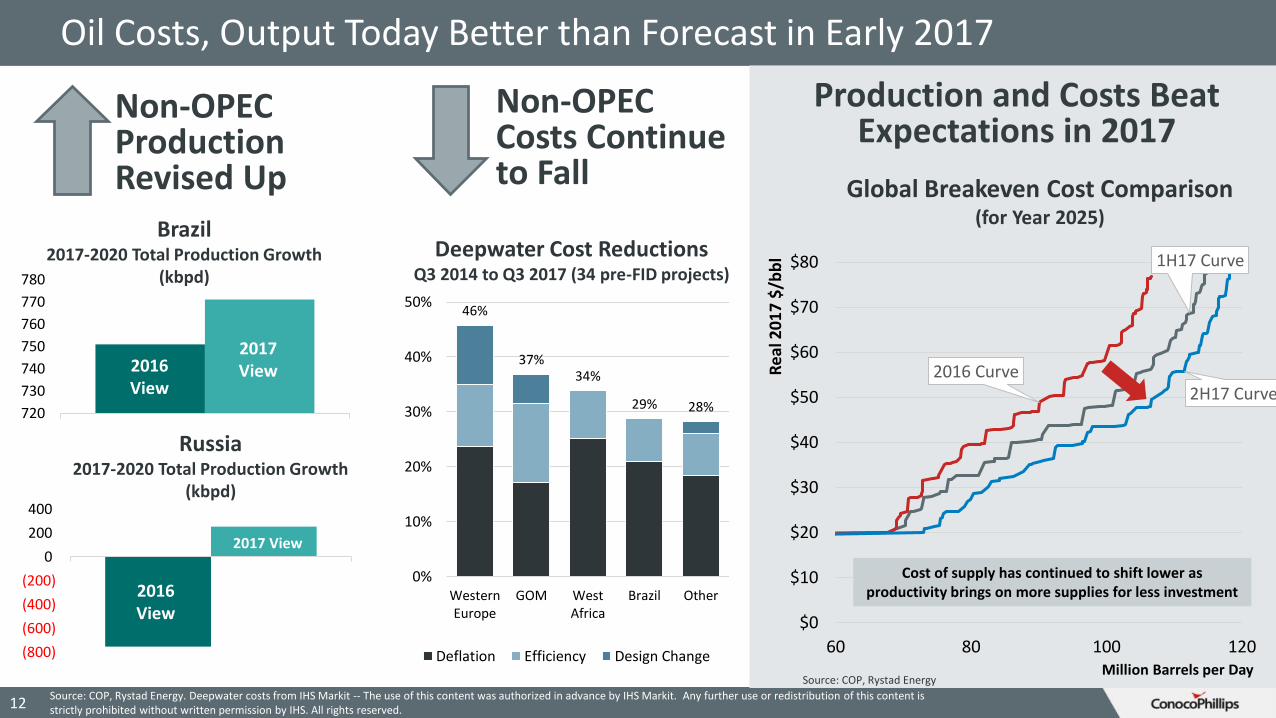
Oil Costs, Output Today Better than Forecast in Early 2017
12
1H17 Curve
2016 Curve2H17 Curve
$0
$10
$20
$30
$40
$50
$60
$70
$80
60 80 100 120
Global Breakeven Cost Comparison (for Year 2025)
Million Barrels per Day
Cost of supply has continued to shift lower as productivity brings on more supplies for less investment
Re
al 2
01
7 $
/bb
l
Source: COP, Rystad Energy. Deepwater costs from IHS Markit -- The use of this content was authorized in advance by IHS Markit. Any further use or redistribution of this content is strictly prohibited without written permission by IHS. All rights reserved.
(800)
(600)
(400)
(200)
0
200
400
2017 View
2016 View
720
730
740
750
760
770
780
2017 View2016
View
Russia2017-2020 Total Production Growth
(kbpd)
Non-OPEC Production Revised Up
46%
37%34%
29% 28%
0%
10%
20%
30%
40%
50%
WesternEurope
GOM WestAfrica
Brazil Other
Deflation Efficiency Design Change
Non-OPEC Costs Continue to Fall
Deepwater Cost Reductions Q3 2014 to Q3 2017 (34 pre-FID projects)
Brazil2017-2020 Total Production Growth
(kbpd)
Production and Costs Beat Expectations in 2017
Source: COP, Rystad Energy
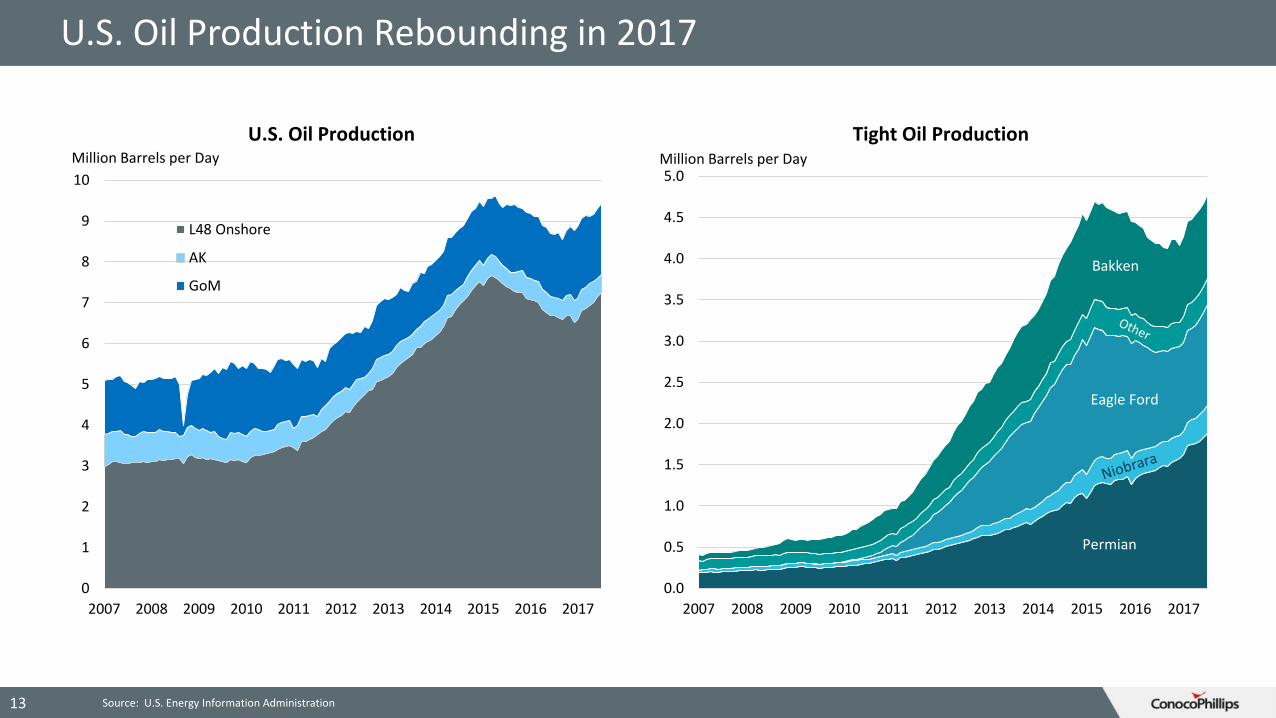
U.S. Oil Production Rebounding in 2017
0
1
2
3
4
5
6
7
8
9
10
2007 2008 2009 2010 2011 2012 2013 2014 2015 2016 2017
L48 Onshore
AK
GoM
Million Barrels per Day
U.S. Oil Production
13 Source: U.S. Energy Information Administration
0.0
0.5
1.0
1.5
2.0
2.5
3.0
3.5
4.0
4.5
5.0
2007 2008 2009 2010 2011 2012 2013 2014 2015 2016 2017
Million Barrels per Day
Tight Oil Production
Permian
Eagle Ford
Bakken
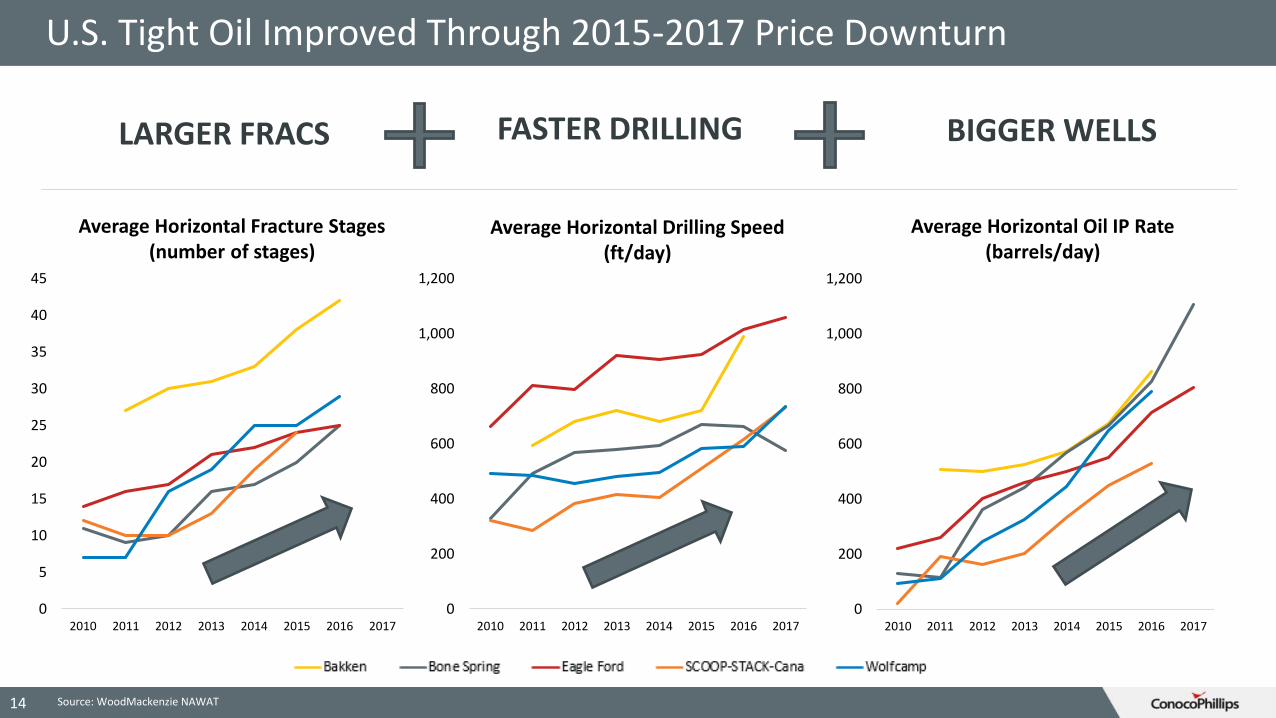
U.S. Tight Oil Improved Through 2015-2017 Price Downturn
14
0
200
400
600
800
1,000
1,200
2010 2011 2012 2013 2014 2015 2016 2017
Source: WoodMackenzie NAWAT
Average Horizontal Drilling Speed (ft/day)
0
200
400
600
800
1,000
1,200
2010 2011 2012 2013 2014 2015 2016 2017
Average Horizontal Oil IP Rate (barrels/day)
0
5
10
15
20
25
30
35
40
45
2010 2011 2012 2013 2014 2015 2016 2017
Average Horizontal Fracture Stages (number of stages)
LARGER FRACS FASTER DRILLING BIGGER WELLS
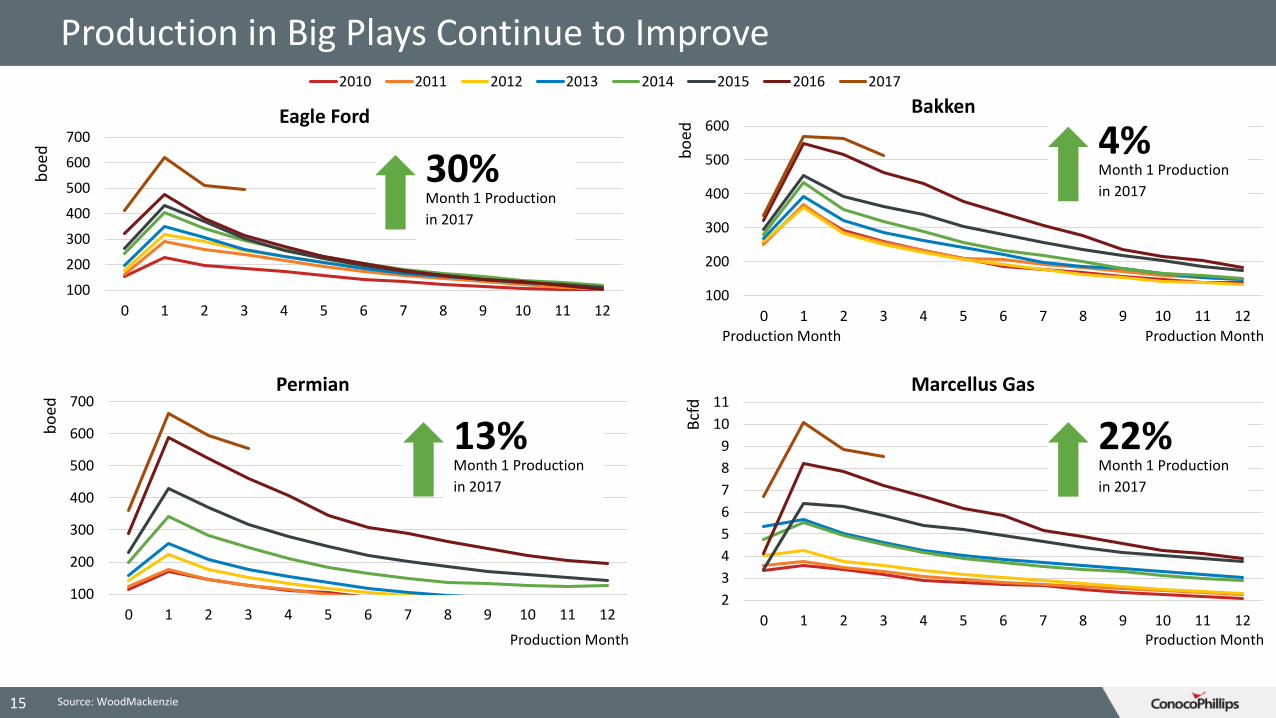
Production in Big Plays Continue to Improve
15
100
200
300
400
500
600
700
0 1 2 3 4 5 6 7 8 9 10 11 12
bo
ed
Production Month
Eagle Ford
2010 2011 2012 2013 2014 2015 2016 2017
100
200
300
400
500
600
0 1 2 3 4 5 6 7 8 9 10 11 12
bo
ed
Production Month
Bakken
100
200
300
400
500
600
700
0 1 2 3 4 5 6 7 8 9 10 11 12
bo
ed
Production Month
Permian
2
3
4
5
6
7
8
9
10
11
0 1 2 3 4 5 6 7 8 9 10 11 12
Bcf
d
Production Month
Marcellus Gas
22% Month 1 Production
in 2017
4% Month 1 Production
in 201730% Month 1 Production
in 2017
13% Month 1 Production
in 2017
Source: WoodMackenzie
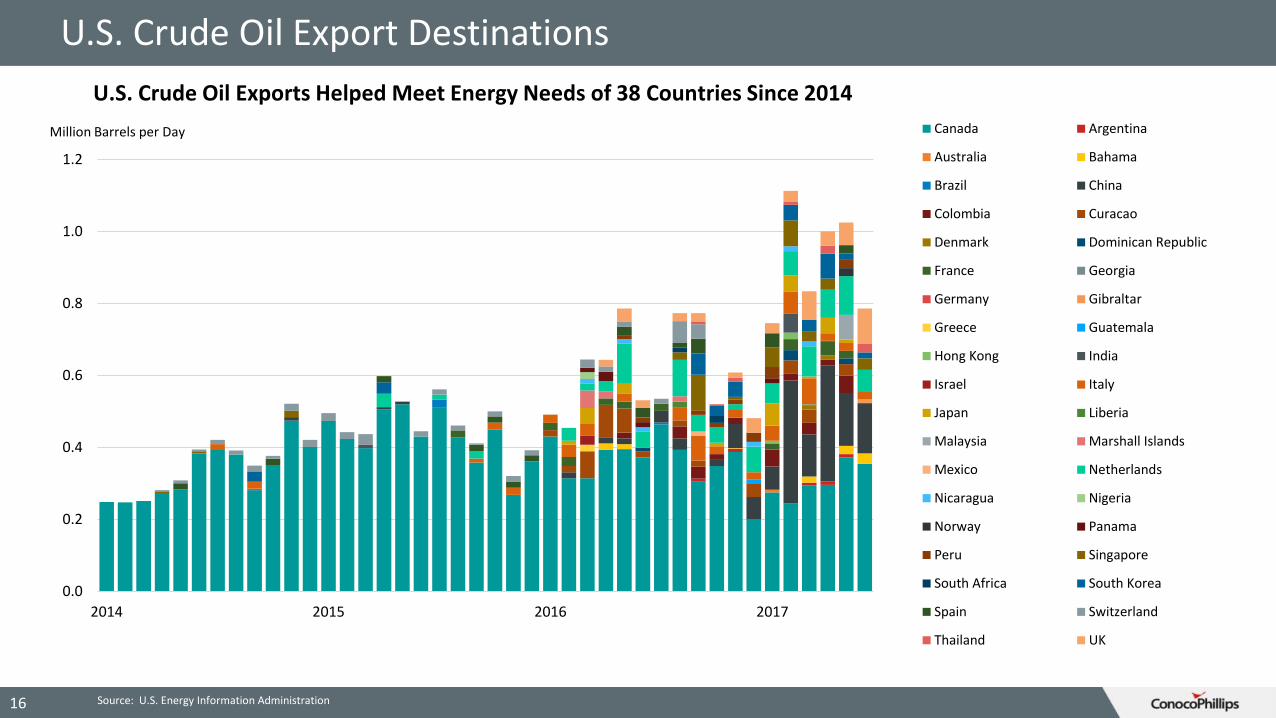
U.S. Crude Oil Export Destinations
0.0
0.2
0.4
0.6
0.8
1.0
1.2
2014 2015 2016 2017
Canada Argentina
Australia Bahama
Brazil China
Colombia Curacao
Denmark Dominican Republic
France Georgia
Germany Gibraltar
Greece Guatemala
Hong Kong India
Israel Italy
Japan Liberia
Malaysia Marshall Islands
Mexico Netherlands
Nicaragua Nigeria
Norway Panama
Peru Singapore
South Africa South Korea
Spain Switzerland
Thailand UK
Million Barrels per Day
U.S. Crude Oil Exports Helped Meet Energy Needs of 38 Countries Since 2014
16 Source: U.S. Energy Information Administration
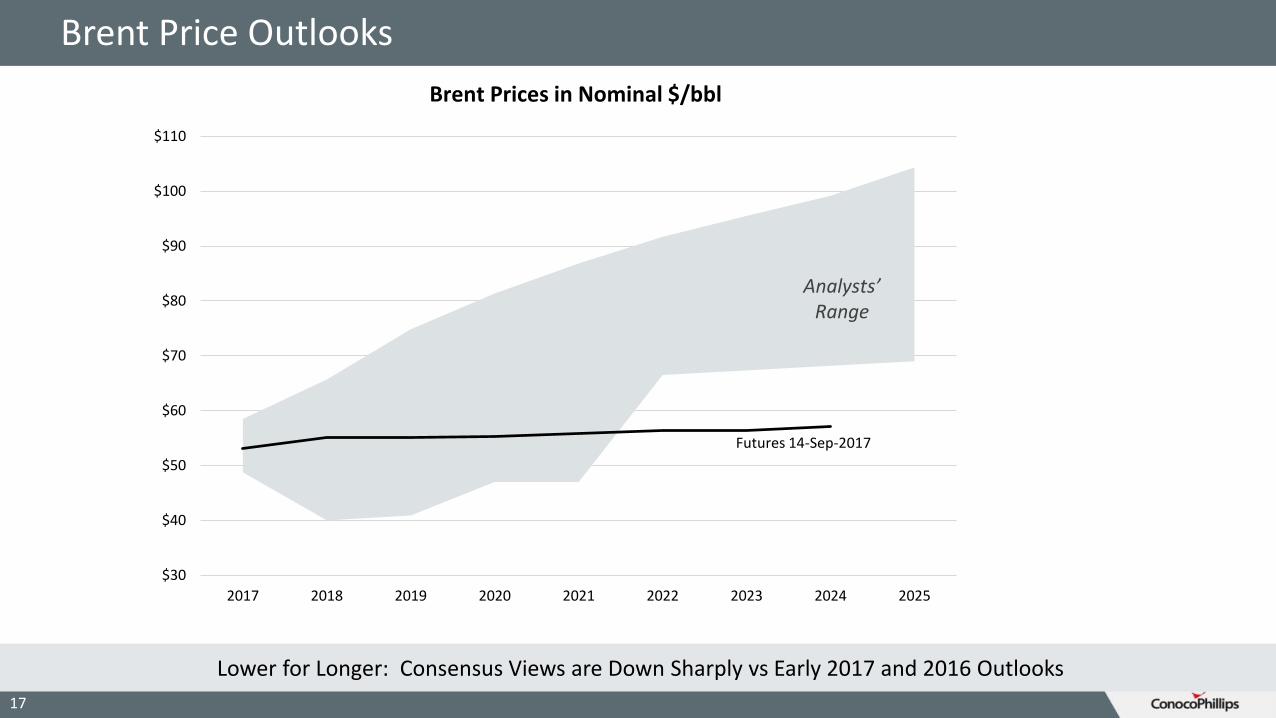
Brent Price Outlooks
17
$30
$40
$50
$60
$70
$80
$90
$100
$110
2017 2018 2019 2020 2021 2022 2023 2024 2025
Brent Prices in Nominal $/bbl
Analysts’ Range
Futures 14-Sep-2017
Lower for Longer: Consensus Views are Down Sharply vs Early 2017 and 2016 Outlooks
18
Natural Gas Markets Outlook
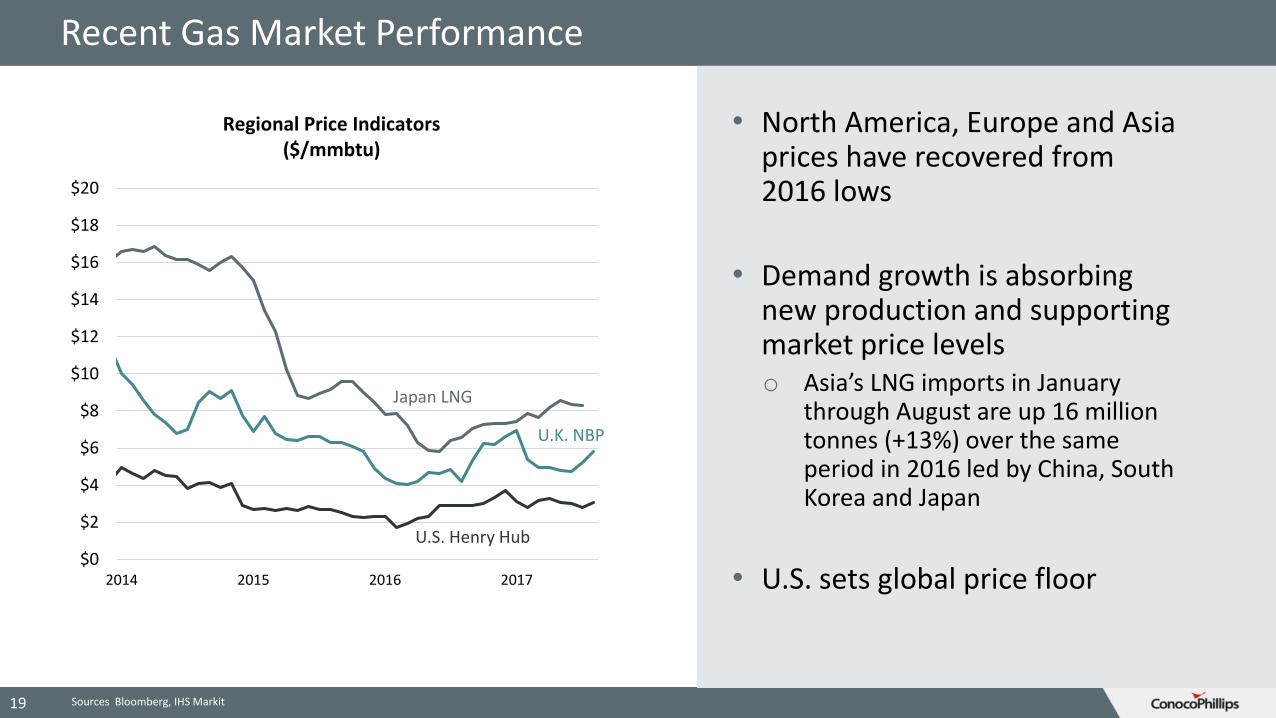
Recent Gas Market Performance
Japan LNG
U.K. NBP
U.S. Henry Hub$0
$2
$4
$6
$8
$10
$12
$14
$16
$18
$20
2014 2015 2016 2017
Regional Price Indicators ($/mmbtu)
19
• North America, Europe and Asia prices have recovered from 2016 lows
• Demand growth is absorbing new production and supporting market price levelso Asia’s LNG imports in January
through August are up 16 million tonnes (+13%) over the same period in 2016 led by China, South Korea and Japan
• U.S. sets global price floor
Sources Bloomberg, IHS Markit
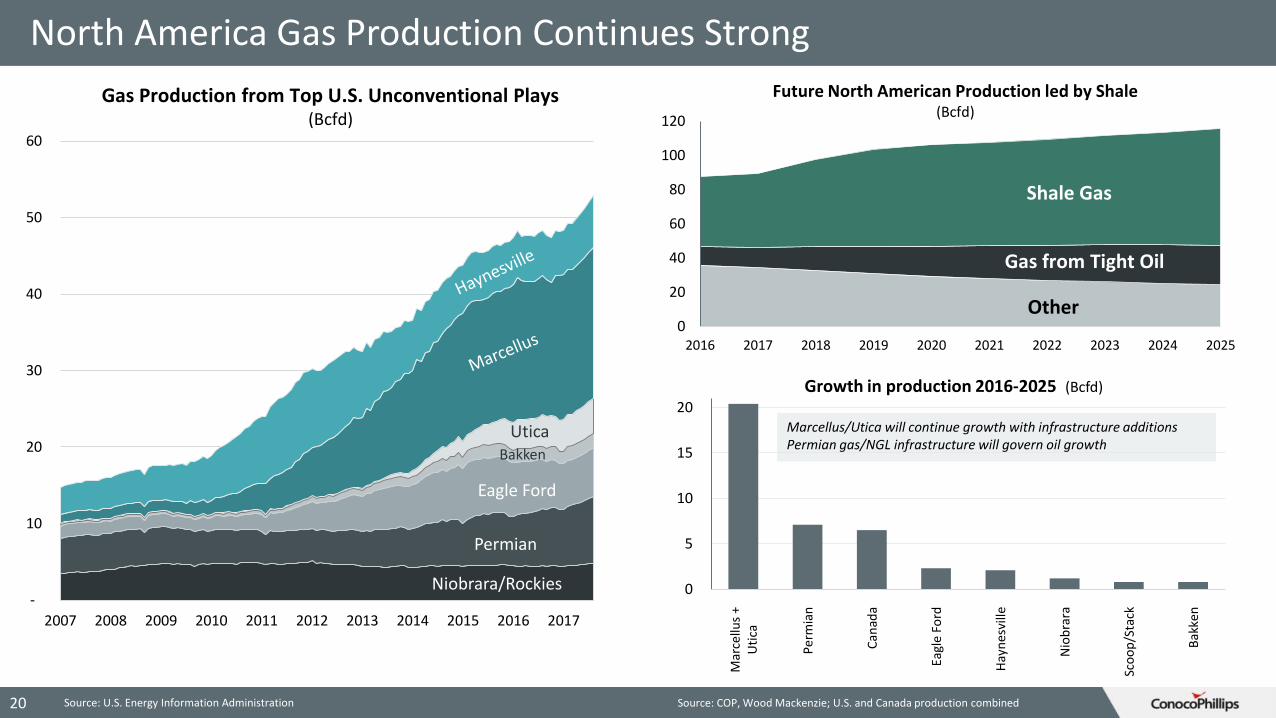
North America Gas Production Continues Strong
-
10
20
30
40
50
60
2007 2008 2009 2010 2011 2012 2013 2014 2015 2016 2017
Gas Production from Top U.S. Unconventional Plays(Bcfd)
20
Utica
Eagle Ford
Permian
Niobrara/Rockies
Bakken
Source: U.S. Energy Information Administration
0
20
40
60
80
100
120
2016 2017 2018 2019 2020 2021 2022 2023 2024 2025
Future North American Production led by Shale(Bcfd)
Shale Gas
Other
Gas from Tight Oil
0
5
10
15
20
Mar
cellu
s +
Uti
ca
Per
mia
n
Can
ada
Eagl
e Fo
rd
Hay
nes
ville
Nio
bra
ra
Sco
op
/Sta
ck
Bak
ken
Marcellus/Utica will continue growth with infrastructure additionsPermian gas/NGL infrastructure will govern oil growth
Growth in production 2016-2025 (Bcfd)
Source: COP, Wood Mackenzie; U.S. and Canada production combined
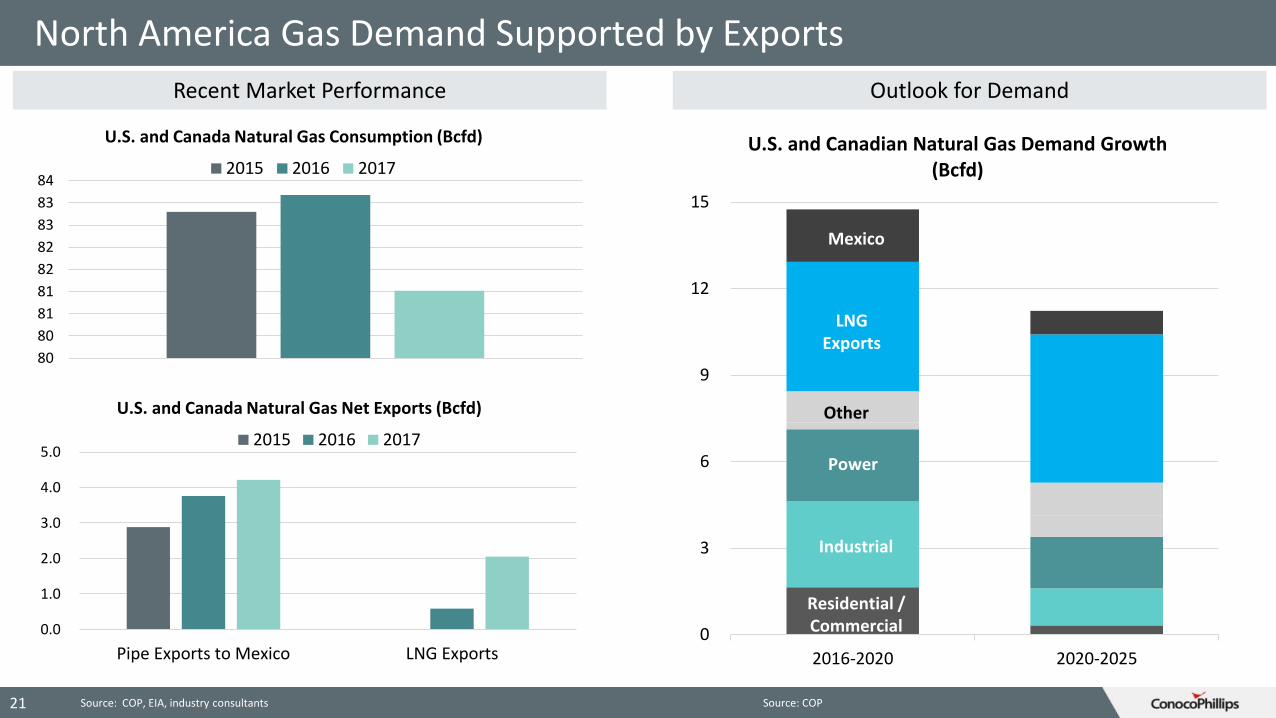
North America Gas Demand Supported by Exports
21
80
80
81
81
82
82
83
83
842015 2016 2017
U.S. and Canada Natural Gas Consumption (Bcfd)
Source: COP, EIA, industry consultants
0
3
6
9
12
15
2016-2020 2020-2025
U.S. and Canadian Natural Gas Demand Growth (Bcfd)
Industrial
Power
Residential / Commercial
Other
LNG Exports
Mexico
Source: COP
0.0
1.0
2.0
3.0
4.0
5.0
Pipe Exports to Mexico LNG Exports
2015 2016 2017
U.S. and Canada Natural Gas Net Exports (Bcfd)
Recent Market Performance Outlook for Demand
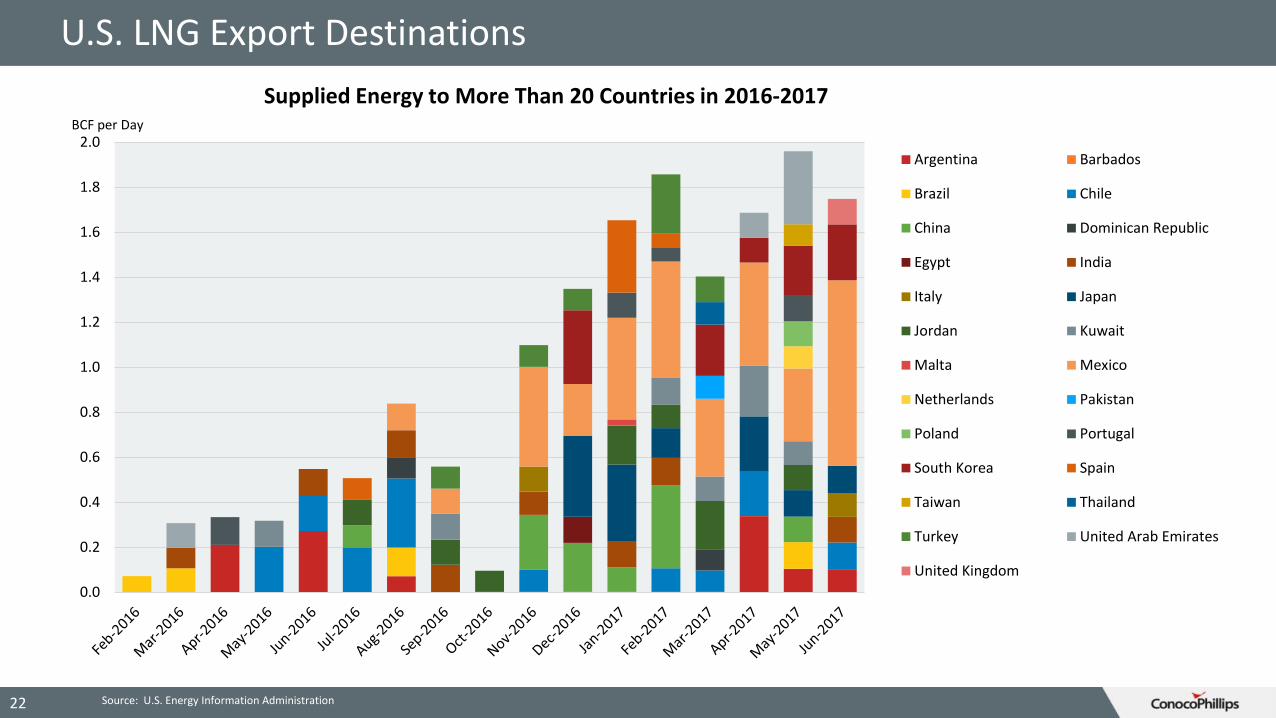
U.S. LNG Export Destinations
0.0
0.2
0.4
0.6
0.8
1.0
1.2
1.4
1.6
1.8
2.0Argentina Barbados
Brazil Chile
China Dominican Republic
Egypt India
Italy Japan
Jordan Kuwait
Malta Mexico
Netherlands Pakistan
Poland Portugal
South Korea Spain
Taiwan Thailand
Turkey United Arab Emirates
United Kingdom
BCF per Day
Supplied Energy to More Than 20 Countries in 2016-2017
22 Source: U.S. Energy Information Administration
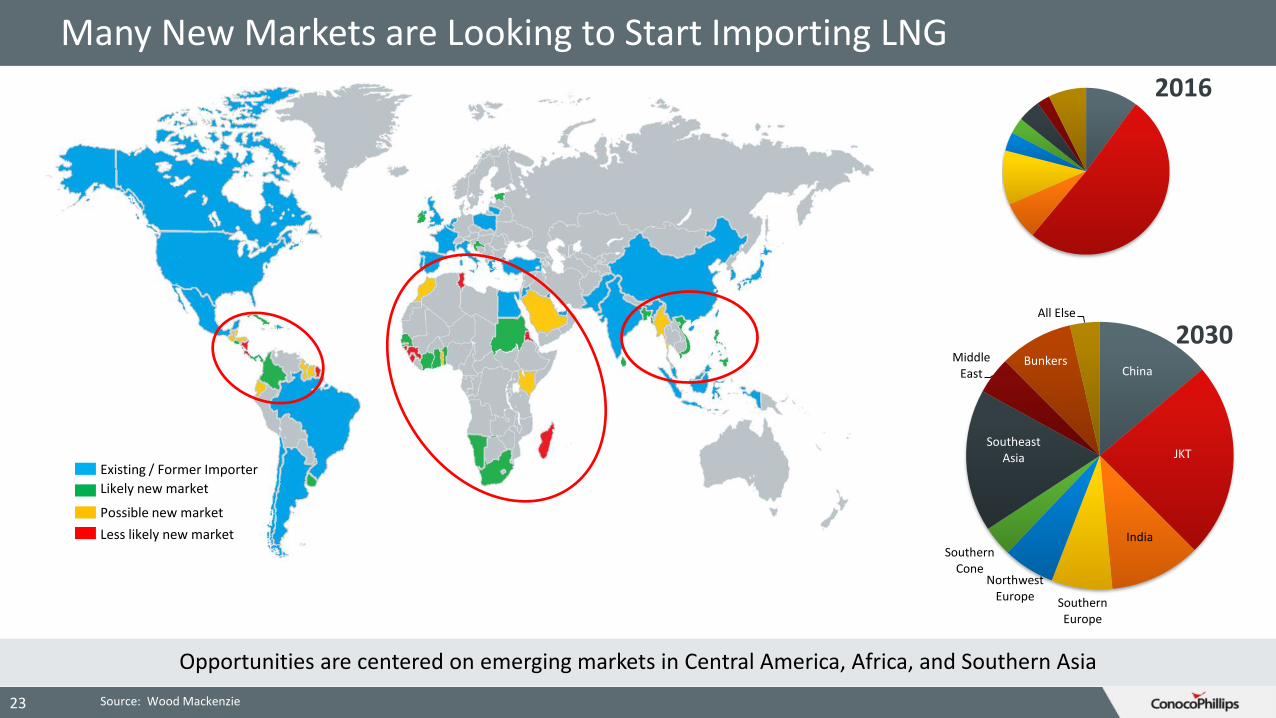
Many New Markets are Looking to Start Importing LNG
23 Source: Wood Mackenzie
Existing / Former Importer
Likely new market
Possible new market
Less likely new market
Opportunities are centered on emerging markets in Central America, Africa, and Southern Asia
2016
China
JKT
India
Southern Europe
Northwest Europe
Southern Cone
Southeast Asia
Middle East
Bunkers
All Else
2030
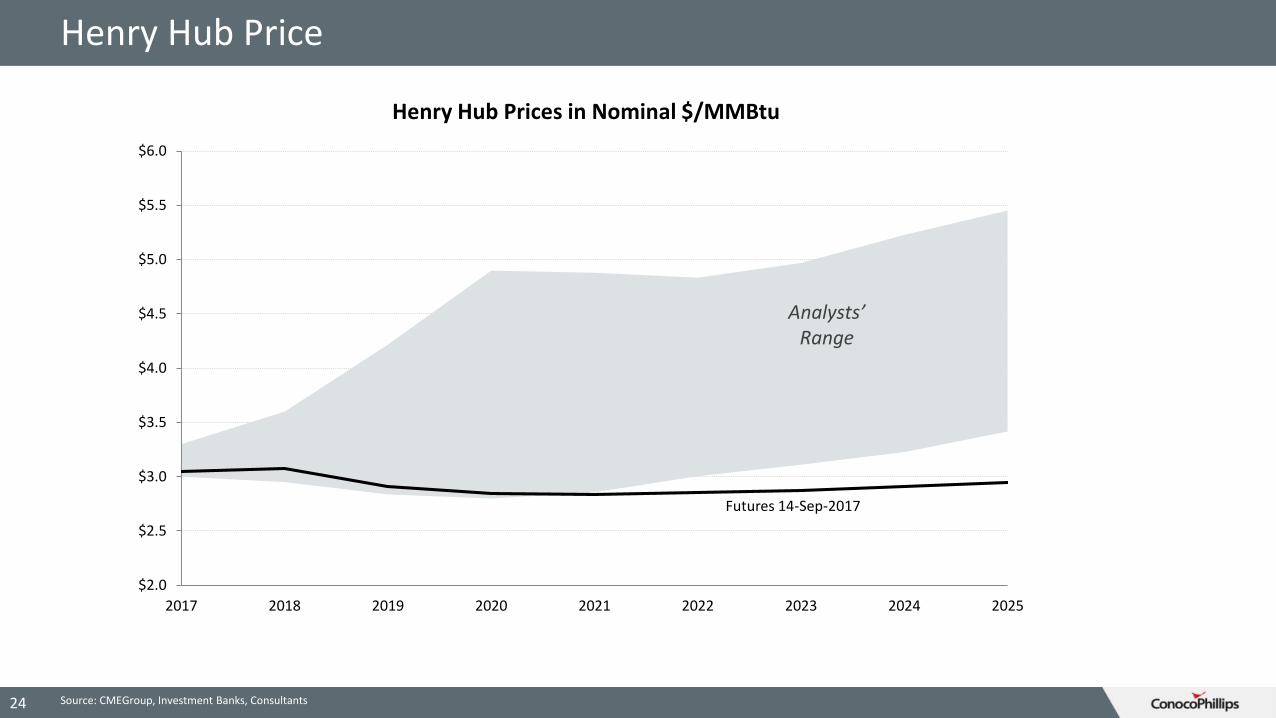
Henry Hub Price
24 Source: CMEGroup, Investment Banks, Consultants
$2.0
$2.5
$3.0
$3.5
$4.0
$4.5
$5.0
$5.5
$6.0
2017 2018 2019 2020 2021 2022 2023 2024 2025
Analysts’ Range
Futures 14-Sep-2017
Henry Hub Prices in Nominal $/MMBtu
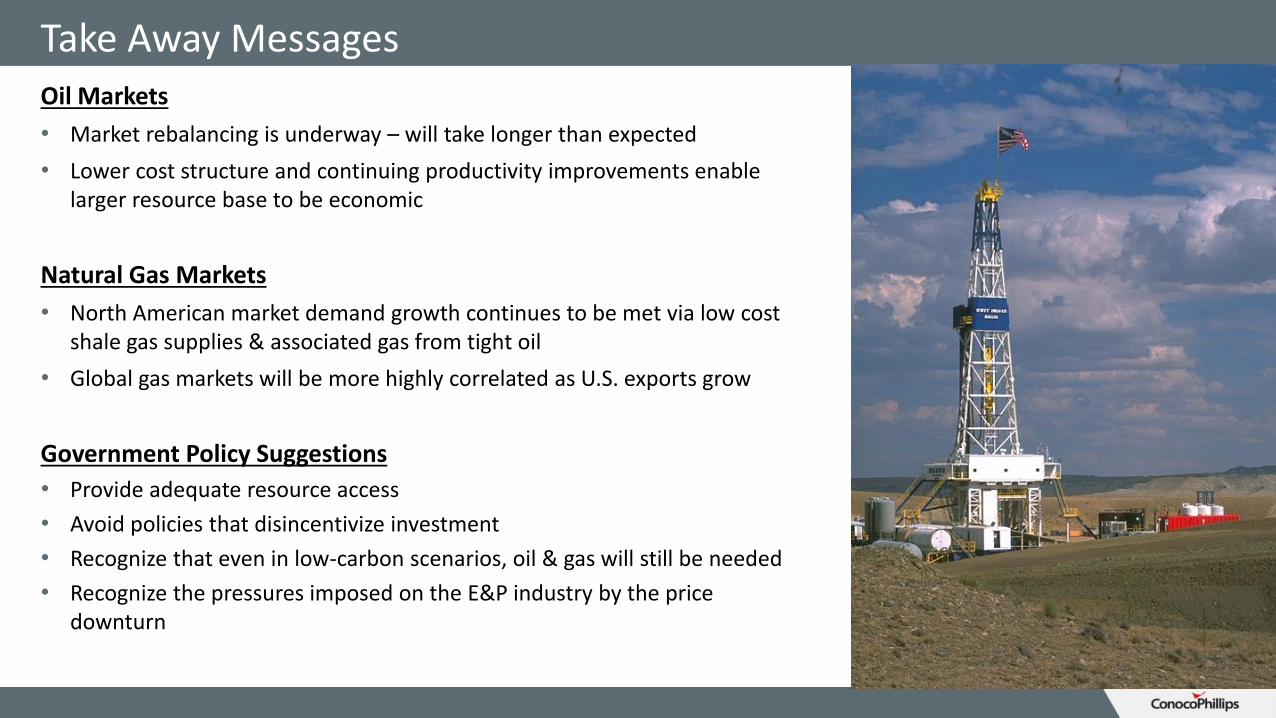
Take Away MessagesOil Markets
• Market rebalancing is underway – will take longer than expected
• Lower cost structure and continuing productivity improvements enable larger resource base to be economic
Natural Gas Markets
• North American market demand growth continues to be met via low cost shale gas supplies & associated gas from tight oil
• Global gas markets will be more highly correlated as U.S. exports grow
Government Policy Suggestions
• Provide adequate resource access
• Avoid policies that disincentivize investment
• Recognize that even in low-carbon scenarios, oil & gas will still be needed
• Recognize the pressures imposed on the E&P industry by the price downturn
Recommended