NESGSA
Tmo
C
North DaEmployeSystem Governmental Statements NoActuarial Valua
This report has been may not otherwise beother parties in its ent
Copyright © 2016 by T
akota Puees Reti
Accounting Sto. 67 and 68 ation and Revie
prepared at the reque copied or reproducedtirety. The measurem
The Segal Group, Inc
ublic rement
tandards Board
ew as of July 1
est of the Board Memd in any form without ents shown in this ac
c. All rights reserved.
d (GASB)
1, 2015
bers to assist in admthe consent of the Botuarial valuation may
inistering the Fund . Toard Members and mnot be applicable for
This valuation report ay only be provided tother purposes.
to
5990 Greenwood Plaza Blvd., Suite 118 Greenwood Village, CO 80111 T 303.714.9900 www.segalco.com
May 4, 2016 Board Members North Dakota Public Employees Retirement System Bismarck, North Dakota
Dear Board Members:
We are pleased to submit the following report intended to be used for satisfying certain reporting requirements by Governmental Accounting Standards Board (GASB) Statements No. 67 and 68 as of June 30, 2015.
This report was prepared in accordance with generally accepted actuarial principles and practices. The census and financial information on which our calculations were based was provided by the Retirement Office Staff. That assistance is gratefully acknowledged. The actuarial calculations were completed under the supervision of Tammy F. Dixon, FSA, MAAA, Enrolled Actuary.
The measurements shown in this actuarial valuation may not be applicable for other purposes. Future actuarial measurements may differ significantly from the current measurements presented in this report due to such factors as the following: plan experience differing from that anticipated by the economic or demographic assumptions; changes in economic or demographic assumptions; increases or decreases expected as part of the natural operation of the methodology used for these measurements (such as the end of an amortization period); and changes in plan provisions or applicable law.
We are members of the American Academy of Actuaries and we meet the Qualification Standards of the American Academy of Actuaries to render the actuarial opinion herein. To the best of our knowledge, the information supplied in the actuarial valuation is complete and accurate. Further, in our opinion, the assumptions as approved by the Trustees are reasonably related to the experience of and expectations for the Plan.

We look forward to reviewing this report with you and to answering any questions.
Sincerely,
Segal Consulting, a Member of The Segal Group, Inc. By:
Brad Ramirez, FSA, MAAA, FCA, EA Tammy F. Dixon, FSA, MAA, EA Laura L. Mitchell, MAAA, EA Vice President and Consulting Actuary Vice President and Actuary Vice President and Consulting Actuary cc: Sparb Collins

SECTION 1 SECTION 2 SECTION 3 SECTION 4
PURPOSE AND SIGNIFICANT ISSUES
GASB 67 AND 68 INFORMATION
ADDITIONAL INFORMATION FOR GASB 68
APPENDICES FOR GASB 68
Purpose ............................... i Significant Issues in Valuation
Year............................... i
EXHIBIT 1 Membership Data as of July 1, 2015 ........................... 1
EXHIBIT 2 Net Pension Liability/(Asset) .................... 2
EXHIBIT 3 Schedules of Changes in PERS Net Pension Liability/(Asset) – 2015 ......... 6
EXHIBIT 4 Schedule of Contribution – Year Ended June 30, 2015 ..... 8
EXHIBIT 5 Notes to Required Supplementary Information ... 9
EXHIBIT A Proportionate Share of Net Pension Liability/(Asset) for North Dakota Public Employees Retirement System ................... 12
EXHIBIT B Deferred Outflows of Resources and Deferred Inflows of Resources for Plan year ending June 30, 2015 ........................... 14
EXHIBIT C Collective Pension Expense/(Income) for Fiscal year ending June 30, 2015 ....... 15
EXHIBIT D Schedule of Proportionate Share of the Net Pension Liability/(Asset) ....................... 17
EXHIBIT E Schedule of Reconciliation of Net Pension Liability/(Asset) as of June 30, 2015 ....................... 18
EXHIBIT F Schedule of Recognition of Changes in Total Net Pension Liability/(Asset) for the Plan year ending June 30, 2015 ....... 20
EXHIBIT G Schedule of Employer Allocations ............................... 29
APPENDIX A Schedule of Employer Allocations as of June 30, 2015
Main System ........................... 31 Judges System ........................ 39 National Guard System .......... 40 Law Enforcement System with Prior Main Service ............... 41 Law Enforcement System without Prior Main Service .... 42
APPENDIX B Schedule of Pension Amounts by Employer as of June 30, 2015
Main System ........................... 43 Judges System ........................ 62 National Guard System .......... 63 Law Enforcement System with Prior Main Service ............... 64 Law Enforcement System without Prior Main Service .... 65
APPENDIX C Schedule of Deferred Inflows and Outflows of Resources by Employer as of June 30, 2015
Main System ........................... 66 Judges System ........................ 88 National Guard System .......... 89 Law Enforcement System with Prior Main Service ............... 90 Law Enforcement System without Prior Main Service .... 91

SECTION 1: Purpose and Significant Issues for North Dakota Public Employees Retirement System
i
Purpose This report has been prepared by Segal Consulting to present certain disclosure information required by Governmental Accounting Standards Board (GASB) Statements No. 67 and 68 as of June 30, 2015. The valuation is based on:
The benefit provisions of the North Dakota Employees Retirement System (PERS);
The characteristics of covered active members, inactive vested members, and retired members and beneficiaries as of July 1, 2015;
The assets of PERS as of June 30, 2015;
Economic assumptions regarding future salary increases and investment earnings; and
Other actuarial assumptions, regarding employee terminations, retirement, death, etc.
Significant Issues in Valuation Year The following key findings were the result of this actuarial valuation:
1. Based on the results of the Actuarial Experience Study completed in May 2015, the Board approved several changes to the actuarial assumptions as discussed in the Actuarial Valuation and Review as of July 1, 2015. The changes to assumptions decreased the Total Pension Liability (TPL) for the PERS Plans by $76.2 million from $3.129 billion to $3.052 billion. In addition, the Plan is now using the same actuarial cost method and the same discount rate (expected return on assets) for GASB and for funding. This means the TPL measure for financial reporting shown in this report is now determined on the same basis as the Actuarial Accrued Liability (AAL) measure for funding. Similarly, the Normal Cost component of the annual plan cost for funding and financial reporting is the same.
2. The Net Pension Liability/(Asset) (NPL) is equal to the difference between the TPL and the Plan’s Fiduciary Net Position. The Plan’s Fiduciary Net Position is equal to the market value of assets and therefore, the NPL measure is similar to an Unfunded Actuarial Accrued Liability (UAAL) on a market value basis. PERS’ NPL increased from $637.0 million as of June 30, 2014 to $680.7 million as of June 30, 2015. Changes in these values during the fiscal year ending June 30, 2015 can be found in Exhibit 3 of Section 2.

SECTION 1: Purpose and Significant Issues for North Dakota Public Employees Retirement System
ii
3. Based upon calculations required by Statement 67 paragraphs 40-45, the Plan's Fiduciary Net Position is projected to be sufficient to make projected benefit payments for current members. Therefore, the discount rate used to determine the TPL was determined to be the same as the Plan's long-term expected rate of return on investments (8.00%) as of June 30, 2015 and June 30, 2014.
4. The net pension expense totaled $65.6 million for the fiscal year ending June 30, 2015. The components of this expense can be found in Exhibit C of Section 3.
5. The actuarial valuation report as of July 1, 2015 is based on draft financial information as of that date. Changes in the value of assets subsequent to that date, to the extent that they exist, are not reflected.
SECTION 2: GASB 67 and 68 Information for North Dakota Public Employees Retirement System
1
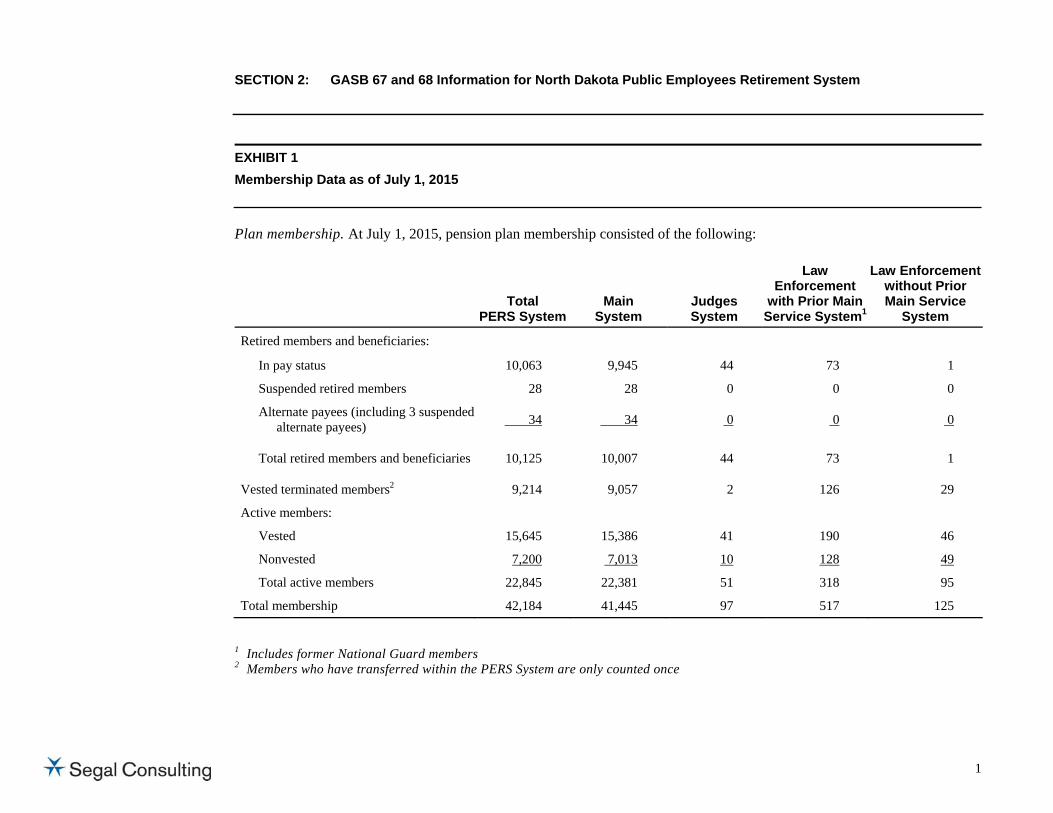
EXHIBIT 1 Membership Data as of July 1, 2015
Plan membership. At July 1, 2015, pension plan membership consisted of the following:
Total PERS System
Main System
Judges System
Law Enforcement
with Prior Main Service System1
Law Enforcement without Prior Main Service
System
Retired members and beneficiaries:
In pay status 10,063 9,945 44 73 1
Suspended retired members 28 28 0 0 0
Alternate payees (including 3 suspended alternate payees) 34 34 0 0 0
Total retired members and beneficiaries 10,125 10,007 44 73 1
Vested terminated members2 9,214 9,057 2 126 29
Active members:
Vested 15,645 15,386 41 190 46
Nonvested 7,200 7,013 10 128 49
Total active members 22,845 22,381 51 318 95
Total membership 42,184 41,445 97 517 125
1 Includes former National Guard members
2 Members who have transferred within the PERS System are only counted once

SECTION 2: GASB 67 and 68 Information for North Dakota Public Employees Retirement System
2
EXHIBIT 2 Net Pension Liability/(Asset)
The components of the net pension liability/(asset) of the PERS at June 30, 2015 were as follows:
Total PERS
System Main
System Judges System
Law Enforcement with Prior Main
Service System1
Law Enforcement without Prior Main Service
System Total pension liability $3,052,446,539 $2,976,071,808 $39,381,443 $34,317,782 $2,675,506 Plan fiduciary net position 2,371,710,809 2,296,088,880 44,137,412 28,691,976 2,792,541 Net pension liability/(asset) 680,735,730 679,982,928 (4,755,969) 5,625,806 (117,035) Plan fiduciary net position as a
percentage of the total pension liability
77.70% 77.15% 112.08% 83.61% 104.37%
The components of the net pension liability/(asset) of the PERS at June 30, 2014 were as follows:
Total PERS
System Main
System Judges System
Law Enforcement with Prior Main
Service System1
Law Enforcement without Prior Main Service
System Total pension liability $2,918,552,143 $2,846,579,777 $38,989,792 $30,791,599 $2,190,975 Plan fiduciary net position 2,281,582,863 2,211,858,402 42,713,635 24,806,508 2,204,318 Net pension liability/(asset) 636,969,280 634,721,375 (3,723,843) 5,985,091 (13,343) Plan fiduciary net position as a
percentage of the total pension liability
78.18% 77.70% 109.55% 80.56% 100.61%
1 Includes former National Guard members

SECTION 2: GASB 67 and 68 Information for North Dakota Public Employees Retirement System
3
Plan provisions. The plan provisions used in the measurement of the net pension liability/(asset) are the same as those used in the PERS Actuarial Valuation and Review as of July 1, 2015 and July 1, 2014.
Actuarial assumptions. The total pension liability was determined by an actuarial valuation as of July 1, 2015, using the following actuarial assumptions, applied to all periods included in the measurement:
Inflation 3.50% per annum Salary increases (Payroll Growth)
4.50% per annum for Main System and Law Enforcement; 4.00% per annum for Judges
Investment rate of return 8.00%, net of investment expense, including inflation
The actuarial assumptions used in the July 1, 2015 valuation were approved by the Board of Trustees and were based on the results of an experience study for the period July 1, 2009 to June 30, 2014.
As of July 1, 2015, mortality rates for active members, inactive members and healthy retirees were based on the RP-2000 Combined Healthy Mortality Table, set back 2 years for males and 3 years for females, projected generationally using the SSA 2014 Intermediate Cost scale from 2014. For disabled retirees, mortality rates were based on the RP-2000 Disabled Mortality Table, set back one year for males (no setback for females) multiplied by 125%. The underlying tables with the generational projection to the ages of participants as of the measurement date reasonably reflect the mortality experience of the Plan as of the measurement date.

SECTION 2: GASB 67 and 68 Information for North Dakota Public Employees Retirement System
4
The long-term expected rate of return on pension plan investments was determined using a building-block method in which best-estimate ranges of expected future real rates of return (expected returns, net of pension plan investment expense and inflation) are developed for each major asset class. These ranges are combined to produce the long-term expected rate of return by weighting the expected future real rates of return by the target asset allocation percentage and by adding expected inflation. Estimates of arithmetic real rates of return for each major asset class included in the pension plan’s target asset allocation as of July 1, 2015 are summarized in the following table:
Asset Class Target
Allocation
Long-Term Expected Real Rate of Return
Domestic equity 31% 6.90% International equity 21% 7.55% Global real assets 20% 5.38% Domestic fixed income 17% 1.52% Private Equity 5% 11.30% International fixed income 5% 0.45% Cash Equivalents 1% 0.00% Total 100%
Discount rate: The discount rate used to measure the total pension liability was 8.00%. The projection of cash flows used to determine the discount rate assumed plan member and employer contributions will be made at rates equal to those based on the July 1, 2015 and July 1, 2014 PERS Actuarial Valuation Reports. For this purpose, only employer contributions that are intended to fund benefits of current plan members and their beneficiaries are included. Projected employer contributions that are intended to fund the service costs of future plan members and their beneficiaries are not included. Based on those assumptions, the pension plan's fiduciary net position was projected to be sufficient to make all projected future benefit payments of current plan members. Therefore, the long-term expected rate of return on pension plan investments was applied to all periods of projected benefit payments to determine the total pension liability.

SECTION 2: GASB 67 and 68 Information for North Dakota Public Employees Retirement System
5
Sensitivity of the net pension liability/(asset) to changes in the discount rate. The following presents the net pension liability/(asset) of the PERS, calculated using the discount rate of 8.00%, as well as what the PERS’s net pension liability/(asset) would be if it were calculated using a discount rate that is 1-percentage-point lower (7.00%) or 1-percentage-point higher (9.00%) than the current rate:
Net pension liability/(asset) as of June 30, 2015
1% Decrease (7.00%)
Current Discount Rate (8.00%)
1% Increase (9.00%)
Total PERS System $1,052,010,116 $680,735,730 $376,867,526 Main System 1,042,719,788 679,982,928 383,198,605 Judges System (997,827) (4,755,969) (7,999,811) Law Enforcement with Prior
Main Service System 9,998,329 5,625,806 2,081,638
Law Enforcement without Prior Main Service System 289,826 (117,035) (412,906)
SECTION 2: GASB 67 and 68 Information for North Dakota Public Employees Retirement System
6
EXHIBIT 3 Schedules of Changes in PERS Net Pension Liability/(Asset) – 2015
Law Enforcement
System Total PERS Main Judges With Prior
Main Service1 Without Prior Main Service
Total pension liability Service cost $104,158,320 $100,674,242 $1,283,674 $1,771,780 $428,624 Interest 236,419,648 230,520,341 3,140,841 2,549,794 208,672 Change of benefit term 2,615 0 0 2,615 0 Differences between expected and actual experience 4,395,805 2,545,566 (75,927) 1,836,122 90,044 Changes of assumptions (76,152,255) (72,748,598) (1,931,030) (1,252,214) (220,413)Benefit payments, including refunds of employee contributions (134,929,737) (131,499,520) (2,025,907) (1,381,914) (22,396)
Net change in total pension liability 133,894,396 $129,492,031 $391,651 $3,526,183 $484,531
Total pension liability – beginning $2,918,552,143 $2,846,579,777 $38,989,792 $30,791,599 $2,190,975 Total pension liability – ending (a) $3,052,446,539 $2,976,071,808 $39,381,443 $34,317,782 $2,675,506
Plan fiduciary net position Contributions – employer $70,842,535 $67,669,374 $1,225,358 $1,638,384 $309,419 Contributions – employee 68,392,061 66,688,488 559,524 928,984 215,065 Contributions – service credit repurchase 6,651,879 6,434,176 143,801 67,519 6,383 Net investment income 81,537,244 78,946,513 1,532,169 971,658 86,904 Benefit payments, including refunds of employee contributions (134,929,737) (131,499,520) (2,025,907) (1,381,914) (22,396) Administrative expense (2,366,036) (2,318,883) (11,168) (28,833) (7,152) Transfers 0 (1,689,670) 0 1,689,670 0
Net change in plan fiduciary net position $90,127,946 $84,230,478 $1,423,777 $3,885,468 $588,223
Plan fiduciary net position – beginning $2,281,582,863 $2,211,858,402 $42,713,635 $24,806,508 $2,204,318 Plan fiduciary net position – ending (b) $2,371,710,809 $2,296,088,880 $44,137,412 $28,691,976 $2,792,541 Net pension liability/(asset) – ending (a) – (b) $680,735,730 $679,982,928 $(4,755,969) $5,625,806 $ (117,035)
Plan fiduciary net position as a percentage of the total pension liability 77.70% 77.15% 112.08% 83.61% 104.37% Covered employee payroll $973,536,402 $946,197,522 $6,964,502 $16,732,974 $3,641,404 Net pension liability/(asset) as percentage of covered employee payroll 69.92% 71.86% (68.29)% 33.62% (3.21)%
Notes to Schedule: Benefit changes: New employer and member contribution rates to LEW were adopted beginning August 1, 2015. These changes are reflected in the results shown above. Changes of Assumptions: The actuarial assumptions used in the July 1, 2015 valuation were based on the results of an experience study for the period July 1, 2009 to
June 30, 2014 1 Includes former National Guard members

SECTION 2: GASB 67 and 68 Information for North Dakota Public Employees Retirement System
7
EXHIBIT 3 Schedules of Changes in PERS Net Pension Liability/(Asset) (Continued) – 2014
Law Enforcement
System Total PERS Main Judges With Prior
Main Service1 Without Prior Main Service
Total pension liability Service cost $94,611,357 $91,683,248 $1,209,997 $1,426,397 $291,715 Interest 218,719,441 213,341,466 2,922,629 2,314,683 140,663 Change of benefit term 0 0 0 0 0 Differences between expected and actual experience 25,782,859 24,957,025 340,738 167,797 317,299 Changes of assumptions 0 0 0 0 0 Benefit payments, including refunds of employee contributions (119,886,323) (116,974,068) (1,612,870) (1,248,834) (50,551)
Net change in total pension liability $219,227,334 $213,007,671 $2,860,494 $2,660,043 $699,126
Total pension liability – beginning $2,699,324,809 $2,633,572,106 $36,129,298 $28,131,556 $1,491,849 Total pension liability – ending (a) $2,918,552,143 $2,846,579,777 $38,989,792 $30,791,599 $2,190,975
Plan fiduciary net position Contributions – employer $61,661,050 $58,872,974 $1,159,604 $1,385,958 $242,514 Contributions – employee 59,394,200 57,940,246 511,080 776,983 165,891 Contributions – service credit repurchase 8,325,140 7,683,330 180,146 2,160 459,504 Net investment income 316,629,563 307,046,081 5,961,058 3,399,422 223,002 Benefit payments, including refunds of employee contributions (119,886,324) (116,974,069) (1,612,870) (1,248,834) (50,551) Administrative expense (2,210,792) (2,168,827) (10,677) (25,137) (6,151)
Net change in plan fiduciary net position $323,912,837 $312,399,735 $6,188,341 $4,290,552 $1,034,209
Plan fiduciary net position – beginning $1,957,670,026 $1,899,458,667 $36,525,294 $20,515,956 $1,170,109 Plan fiduciary net position – ending (b) $2,281,582,863 $2,211,858,402 $42,713,635 $24,806,508 $2,204,318 Net pension liability/(asset) – ending (a) – (b) $636,969,280 $634,721,375 $(3,723,843) $5,985,091 $(13,343)
Plan fiduciary net position as a percentage of the total pension liability 78.18% 77.70% 109.55% 80.56% 100.61% Covered employee payroll $888,452,060 $865,868,265 $6,598,981 $13,394,927 $2,589,887 Net pension liability/(asset) as percentage of covered employee payroll 71.69% 73.30% (56.43)% 44.68% (0.52)%
Notes to Schedule: Benefit changes: New employer and member contribution rates to PERS were adopted beginning January 1, 2014. These changes are reflected in the results shown
above. 1 Includes former National Guard members

SECTION 2: GASB 67 and 68 Information for North Dakota Public Employees Retirement System
8
EXHIBIT 4 Schedule of Contribution – Year Ended June 30, 2015
System
Actuarially Determined
Contributions
Contributions in Relation to the
Actuarially Determined
Contributions
Contribution Deficiency (Excess)
Covered-Employee
Payroll
Contributions as a Percentage of
Covered Employee Payroll
Total PERS System $107,513,973 $70,842,535 $36,671,438 $973,536,402 7.28% Main System 104,636,238 67,669,374 36,966,864 946,197,522 7.15% Judges System 1,030,705 1,225,358 (194,653) 6,964,502 17.59% Law Enforcement with Prior
Main Service System1 1,577,004 1,638,384 (61,380) 16,732,974 9.79%
Law Enforcement without Prior Main Service System 270,026 309,419 (39,393) 3,641,404 8.50%
The schedule of contributions for the year ended June 30, 2014 are as follows:
System
Actuarially Determined
Contributions
Contributions in Relation to the
Actuarially Determined
Contributions
Contribution Deficiency (Excess)
Covered-Employee
Payroll
Contributions as a Percentage of
Covered Employee Payroll
Total PERS System $107,851,326 $61,661,050 $46,190,276 $888,452,060 6.94% Main System 105,092,504 58,872,974 46,219,530 865,868,265 6.80% Judges System 1,099,249 1,159,604 (60,355) 6,598,981 17.57% Law Enforcement with Prior
Main Service System1 1,449,458 1,385,958 63,500 13,394,927 10.35%
Law Enforcement without Prior Main Service System 210,115 242,514 (32,399) 2,589,887 9.36%
1 Includes former National Guard members

SECTION 2: GASB 67 and 68 Information for North Dakota Public Employees Retirement System
9
EXHIBIT 5 Notes to Required Supplementary Information
Valuation date Actuarially determined contribution rates are calculated as of June 30, one year prior to the end of the fiscal year in which contributions are reported.
Methods used to establish “actuarially determined contribution” rates:
Actuarial cost method Entry Age Actuarial Cost Method. Entry Age is the age at the time the participant commenced employment. Normal Cost and Actuarial Accrued Liability are calculated on an individual basis and are allocated by salary.
Amortization method Level percent of payroll Remaining amortization period 20 years open, assuming 4.50% (4.00% for Judges) of payroll growth per annum Asset valuation method Adjusted market value that immediately recognizes interest and dividends. The
procedure recognizes 20% of each year’s total appreciation (depreciation) beginning with the year of occurrence. After five years, the appreciation (depreciation) is fully recognized.
Methods used to determine GASB 67 and 68 amounts (Schedules of Change in Net Pension Liability/(Asset)):
Actuarial cost method Entry Age Actuarial Cost Method. Entry Age is the age at the time the participant commenced employment. Normal Cost and Actuarial Accrued Liability are calculated on an individual basis and are allocated by salary.
Asset valuation method The plan’s assets (Fiduciary Net Position) are reported without actuarial smoothing.

SECTION 2: GASB 67 and 68 Information for North Dakota Public Employees Retirement System
10
The information and analysis used by the Board in selecting each assumption that has a significant effect on this actuarial valuation is shown in our report titled Experience Review: July 2009 – June 2014, completed in May 2015.
Assumptions for GASB 67 and 68 amounts and to establish “actuarially determined contribution” rates beginning July 1, 2015:
Investment rate of return 8.00%. The net investment return assumption is a long-term estimate derived from historical data, current and recent market expectations, and professional judgment. As part of the analysis, a building block approach was used that reflects inflation expectations and anticipated risk premiums for each of the portfolio’s asset classes, as well as the Plan’s target asset allocation.
Inflation rate 3.50% per annum Projected salary increases Ranges from 7.25% to 20.00% for new members, and 5.00% to 10.00% for members
with 3 or more years of service (5 or more for Law Enforcement); 4.00% for Judges.Cost of living adjustments None
Retirement Probability Main System
Judges System
Law Enforcement
System Retirement Rates
Age Early
Retirement Unreduced Retirements
50 30% 25%
51-54 10 25
55 1% 10 10% 10 56-59 1 8 10 10 60 2 8 10 10 61 5 15 10 10 62-63 10 30 10 50 64 10 20 10 50 65 30 20 50 66 20 20 20 67-74 15 20 20 75 100 100 100

SECTION 2: GASB 67 and 68 Information for North Dakota Public Employees Retirement System
11
Mortality Healthy: RP-2000 Combined Healthy Mortality Table, set back 2 years for males and 3 years for females, projected generationally using the SSA 2014 Intermediate Cost scale from 2014
Disabled: RP-2000 Disabled Mortality Table, set back one year for males (no setback for females) multiplied by 125%.
The underlying tables with the generational projection to the ages of participants as of the measurement date reasonably reflect the mortality experience of the Plan as of the measurement date. These mortality tables were then adjusted to future years using the generational projections to reflect future mortality improvement between the measurement date and those years.
Other assumptions Same as those used in the July 1, 2015 and July 1, 2014 actuarial funding valuations
SECTION 3: Additional Information for GASB 68 for North Dakota Public Employees Retirement System
12
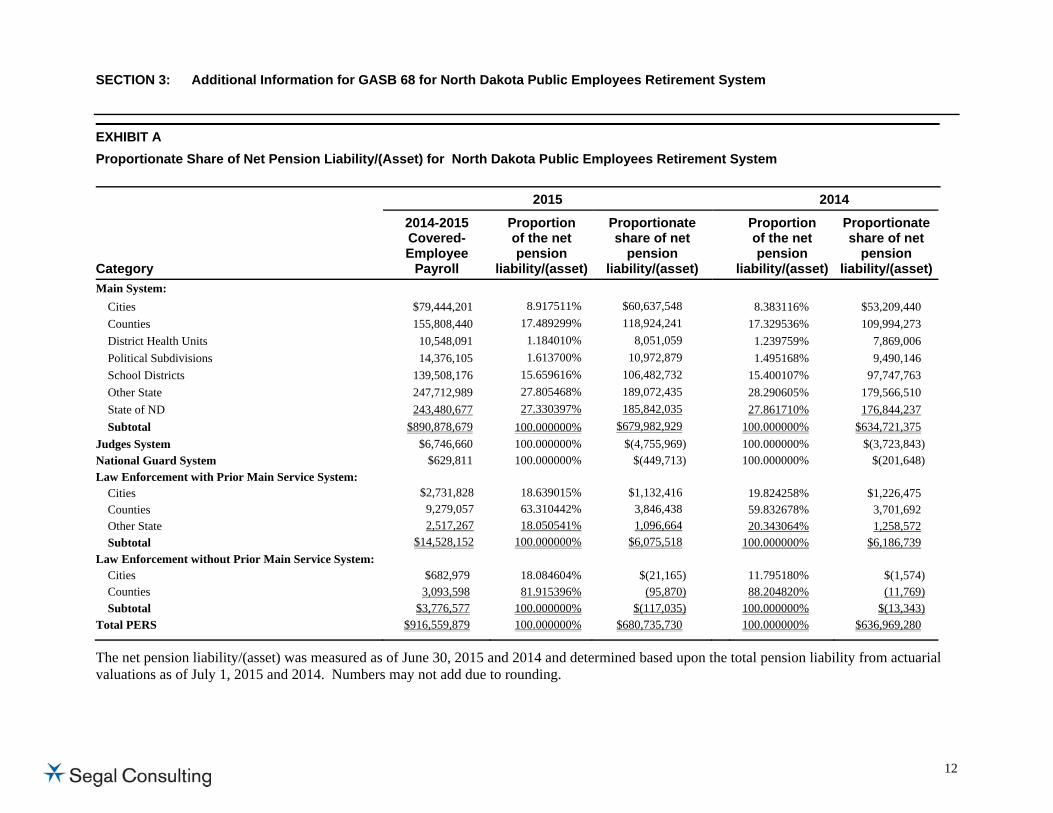
EXHIBIT A Proportionate Share of Net Pension Liability/(Asset) for North Dakota Public Employees Retirement System
2015 2014
Category
2014-2015 Covered-Employee
Payroll
Proportion of the net pension
liability/(asset)
Proportionate share of net
pension liability/(asset)
Proportion of the net pension
liability/(asset)
Proportionate share of net
pension liability/(asset)
Main System: Cities $79,444,201 8.917511% $60,637,548 8.383116% $53,209,440 Counties 155,808,440 17.489299% 118,924,241 17.329536% 109,994,273 District Health Units 10,548,091 1.184010% 8,051,059 1.239759% 7,869,006 Political Subdivisions 14,376,105 1.613700% 10,972,879 1.495168% 9,490,146 School Districts 139,508,176 15.659616% 106,482,732 15.400107% 97,747,763 Other State 247,712,989 27.805468% 189,072,435 28.290605% 179,566,510 State of ND 243,480,677 27.330397% 185,842,035 27.861710% 176,844,237 Subtotal $890,878,679 100.000000% $679,982,929 100.000000% $634,721,375
Judges System $6,746,660 100.000000% $(4,755,969) 100.000000% $(3,723,843) National Guard System $629,811 100.000000% $(449,713) 100.000000% $(201,648) Law Enforcement with Prior Main Service System:
Cities $2,731,828 18.639015% $1,132,416 19.824258% $1,226,475 Counties 9,279,057 63.310442% 3,846,438 59.832678% 3,701,692 Other State 2,517,267 18.050541% 1,096,664 20.343064% 1,258,572 Subtotal $14,528,152 100.000000% $6,075,518 100.000000% $6,186,739
Law Enforcement without Prior Main Service System: Cities $682,979 18.084604% $(21,165) 11.795180% $(1,574) Counties 3,093,598 81.915396% (95,870) 88.204820% (11,769) Subtotal $3,776,577 100.000000% $(117,035) 100.000000% $(13,343)
Total PERS $916,559,879 100.000000% $680,735,730 100.000000% $636,969,280
The net pension liability/(asset) was measured as of June 30, 2015 and 2014 and determined based upon the total pension liability from actuarial valuations as of July 1, 2015 and 2014. Numbers may not add due to rounding.

SECTION 3: Additional Information for GASB 68 for North Dakota Public Employees Retirement System
13
Sensitivity of the net pension liability/(asset) to changes in the discount rate. The following presents the net pension liability/(asset) for each of the employers as of June 30, 2015, calculated using the discount rate of 8.00%, as well as what the employer’s net pension liability/(asset) would be if it were calculated using a discount rate that is 1-percentage-point lower (7.00%) or 1-percentage-point higher (9.00%) than the current rate:
As of June 30, 2015 1% Decrease
(7.00%)
Current Discount Rate
(8.00%) 1% Increase
(9.00%) Main System:
Cities $ 92,984,640 $60,637,548 $34,171,776 Counties 182,364,371 118,924,241 67,018,745 District Health Units 12,345,895 8,051,059 4,537,108 Political Subdivisions 16,826,360 10,972,879 6,183,671 School Districts 163,285,938 106,482,732 60,007,438 Other State 289,933,122 189,072,435 106,550,162 State of ND 284,979,456 185,842,035 104,729,701 Subtotal $1,042,719,782 $679,982,929 $383,198,601
Judges System $(997,827) $(4,755,969) $(7,999,811) National Guard System $(165,258) $(449,713) $(678,349) Law Enforcement with Prior
Main Service System: Cities $1,894,392 $1,132,416 $ 514,433 Counties 6,434,610 3,846,438 1,747,359 Other State 1,834,583 1,096,664 498,193 Subtotal $10,163,585 $6,075,518 $2,759,985
Law Enforcement without Prior Main Service System: Cities $52,414 $(21,165) $(74,672) Counties 237,412 (95,870) (338,234) Subtotal $289,826 $(117,035) $(412,906)
Total PERS $1,052,010,108 $680,735,730 $376,867,520

SECTION 3: Additional Information for GASB 68 for North Dakota Public Employees Retirement System
14
EXHIBIT B Deferred Outflows of Resources and Deferred Inflows of Resources for Plan year ending June 30, 2015
Deferred Outflows of Resources Main
System Judges System
National Guard
System
Law Enforcement
with Prior Main Service
System
Law Enforcement without Prior Main Service
System Total PERS
Changes of assumptions or other inputs $0 $0 $0 $0 $0 $0 Net difference between projected and actual earnings
on pension plan investments 78,570,814 1,504,468 108,502 795,030 87,596 81,066,410 Difference between expected and actual experience 19,727,178 139,118 0 680,463 309,944 20,856,703 Total $98,297,992 $ 1,643,586 $108,502 $1,475,493 $397,540 $101,922,113
Deferred Inflows of Resources Changes of assumptions or other inputs $(60,583,281) $(1,438,420) $(52,331) $(958,505) $(186,659) $(63,219,196) Net difference between projected and actual earnings
on pension plan investments (92,925,145) (1,817,965) (133,889) (899,612) (58,167) (95,834,778) Difference between expected and actual experience 0 (56,558) (309,993) 0 0 (366,551) Total $(153,508,426) $(3,312,943) $(496,213) $(1,858,117) $(244,826) $(159,420,525)
Deferred outflows of resources and deferred inflows of resources related to pension will be recognized as follows: Year Ended June 30:
2016 $(18,411,003) $(641,041) $(258,363) $(159,916) $24,350 $(19,445,973) 2017 (18,411,003) (721,363) (98,091) (159,916) 24,350 (19,366,023) 2018 (18,411,004) (683,070) (58,381) (159,915) 24,350 (19,288,020) 2019 11,250,518 376,117 27,124 139,957 43,739 11,837,455 2020 (11,227,942) 0 0 (42,834) 35,925 (11,234,851)

SECTION 3: Additional Information for GASB 68 for North Dakota Public Employees Retirement System
15
EXHIBIT C Collective Pension Expense/(Income) for Fiscal year ending June 30, 2015
Components of Pension Expense/(Income)
Main System
Judges System
National Guard
System
Law Enforcement
with Prior Main Service System
Law Enforcement without Prior Main Service
System Total PERS Service Cost $100,674,242 $1,283,674 $123,489 $1,648,291 $428,624 $104,158,320 Interest on the total pension liability/(asset) 230,520,341 3,140,841 236,465 2,313,329 208,672 236,419,648 Expensed portion of current period Difference between expected and actual experience in the total pension liability 708,233 376,117 (143,071) 74,879 13,789 1,029,947
Difference between actual and projected earnings on plan investments 19,642,704 (19,369) 27,126 198,757 21,899 19,871,117
Changes of assumptions or other inputs (12,165,317) (492,610) (45,905) (192,858) (33,754) (12,930,444)
Change of benefit terms 0 0 2,615 0 0 2,615 Projected earnings on plan investments (177,160,031) (3,412,755) (246,645) (1,854,428) (196,398) (182,870,257) Actual contributions – member (including purchased service credit) (73,122,664) (703,324) (46,556) (949,947) (221,449) (75,043,940)
Administrative expense 2,318,883 11,168 3,822 25,011 7,152 2,366,036 Recognition of beginning deferred outflows of resources as pension expense 4,378,425 100,810 0 59,177 41,805 4,580,217
Recognition of beginning deferred inflows of resources as pension expense (30,975,048) (605,989) (99,128) (299,871) (19,389) (31,999,425)
Pension Expense/(Income) for 2014/20151 $64,819,768 $(321,437) $(187,788) $1,022,340 $250,951 $65,583,834 Average expected remaining service lives2 5.98 3.92 2.14 5.97 6.53 5.97
1 The employer pension expense differs from the plan pension expense due to contribution timing. The difference is shown in the Appendices. 2 The average of the expected service lives of all employees is determined by:
• Calculating active employees’ expected remaining service lives as the present value of $1 per year of future service at zero percent interest. • Setting the remaining service life to zero for each nonactive or retired member. • Dividing the sum of the above amounts by the total number of active employee, nonactive and retired members

SECTION 3: Additional Information for GASB 68 for North Dakota Public Employees Retirement System
16
EXHIBIT C (Continued) Collective Pension Expense/(Income) for Fiscal year ending June 30, 2014
Components of Pension Expense/(Income)
Main System
Judges System
National Guard
System
Law Enforcement
with Prior Main Service System
Law Enforcement without Prior Main Service
System Total PERS Service Cost $91,683,248 $1,209,997 $175,836 $1,250,561 $291,715 $94,611,357 Interest on the total pension liability/(asset) 213,341,466 2,922,629 240,936 2,073,747 140,663 218,719,441 Expensed portion of current period Difference between expected and actual experience in the total pension liability 4,378,425 100,810 (54,449) 59,177 41,805 4,525,718
Difference between actual and projected earnings on plan investments (30,975,048) (605,989) (57,798) (299,871) (19,389) (31,944,926)
Changes of assumptions or other inputs 0 0 0 0 0 0
Change of benefit terms 0 0 0 0 0 0 Projected earnings on plan investments (152,170,840) (2,931,115) (214,761) (1,462,160) (126,057) (156,904,933) Actual contributions – member (including purchased service credit) (65,623,576) (691,226) (44,629) (721,345) (625,395) (67,719,340)
Administrative expense 2,168,827 10,677 3,779 21,358 6,151 2,210,792 Other – adjustment for beginning of year balance 1 0 0 0 0 1 Recognition of beginning deferred outflows of resources as pension expense 0 0 0 0 0 0
Recognition of beginning deferred inflows of resources as pension expense 0 0 0 0 0 0
Pension Expense/(Income) for 2013/2014 $62,802,503 $15,783 $48,864 $921,467 $(290,507) $63,498,110 Average expected remaining service lives1 5.70 3.38 4.75 7.21 7.59 5.71
1 The average of the expected service lives of all employees is determined by: • Calculating active employees’ expected remaining service lives as the present value of $1 per year of future service at zero percent interest. • Setting the remaining service life to zero for each nonactive or retired member. • Dividing the sum of the above amounts by the total number of active employee, nonactive and retired members

SECTION 3: Additional Information for GASB 68 for North Dakota Public Employees Retirement System
17
EXHIBIT D Schedule of Proportionate Share of the Net Pension Liability/(Asset)
System
Proportion of the net pension
liability/(asset)
Proportionate share of net pension liability/(asset)
Covered-employee payroll
Proportionate share of the net pension
liability/(asset) as a percentage of its
covered-employee payroll
Plan fiduciary net position as a
percentage of the total pension
liability/(asset) 2014 Main System 100.000000% $634,721,375 $842,379,091 100.000000% 77.702316% Judges System 100.000000% (3,723,843) 6,460,877 100.000000% 109.550815% National Guard System 100.000000% (201,648) 1,061,849 100.000000% 106.929468% Law Enforcement with Prior Main Service System 100.000000% 6,186,739 12,945,017 100.000000% 77.810668%
Law Enforcement without Prior Main Service System 100.000000% (13,343) 2,732,328 100.000000% 100.608998%
Total PERS 100.000000% $636,969,280 $865,579,162 100.000000% 78.175162% 2015 Main System 100.000000% $679,982,929 $890,878,679 100.000000% 77.151663% Judges System 100.000000% (4,755,969) 6,746,660 100.000000% 112.076675% National Guard System 100.000000% (449,713) 629,811 100.000000% 116.559312% Law Enforcement with Prior Main Service System 100.000000% 6,075,519 14,528,152 100.000000% 80.774898%
Law Enforcement without Prior Main Service System 100.000000% (117,035) 3,776,577 100.000000% 104.374313%
Total PERS 100.000000% $680,735,731 $916,559,879 100.000000% 77.698685%

SECTION 3: Additional Information for GASB 68 for North Dakota Public Employees Retirement System
18
EXHIBIT E Schedule of Reconciliation of Net Pension Liability/(Asset) as of June 30, 2015
Beginning Net Pension
Liability/(Asset)
Pension Expense/ (Income)
Employer
Contributions
New Net Deferred Inflows/ Outflows
Less Recognition of Prior Deferred
Inflows/ Outflows
Change in Net Pension Liability/
(Asset) due to change in Proportion
Ending Net Pension
Liability/ (Asset)
Main System:
Cities $53,209,440 $ 5,780,310 $ (6,034,419) $1,918,561 $(2,371,759) $3,391,930 $ 60,637,581 Counties 109,994,273 11,336,525 (11,834,898) 3,762,741 (4,651,564) 1,014,019 118,924,224 District Health Units 7,869,006 767,472 (801,210) 254,734 (314,905) (353,825) 8,051,082 Political Subdivisions 9,490,146 1,045,998 (1,091,981) 347,180 (429,188) 752,344 10,972,875 School Districts 97,747,763 10,150,531 (10,596,758) 3,369,094 (4,164,933) 1,647,135 106,482,698 Other State 179,566,510 18,023,444 (18,815,784) 5,982,217 (7,395,315) (3,079,252) 189,072,450 State of ND 176,844,237 17,715,497 (18,494,310) 5,880,008 (7,268,964) (3,372,395) 185,842,001 Subtotal $634,721,375 $64,819,777 $(67,669,360) $21,514,535 $(26,596,628) $ (44) $679,982,911
Judges System $(3,723,843) $(321,437) $(1,225,358) $9,490 $(505,179) $0 ($4,755,969)National Guard System $(201,648) $(187,788) $(55,457) $(103,948) $(99,128) $0 ($449,713)Law Enforcement with Prior
Main Service System:
Cities $1,226,475 $190,554 $(295,041) $ 38,895 $(44,863) $(73,328) $1,132,418Counties 3,701,692 647,248 (1,002,158) 132,112 (152,384) 215,159 3,846,437Other State 1,258,572 184,538 (285,727) 37,667 (43,447) (141,832) 1,096,665Subtotal $6,186,739 $1,022,340 $(1,582,926) $208,674 $(240,694) $ (1) $6,075,520
Law Enforcement without Prior Main Service System:
Cities $(1,574) $45,383 $(55,957) $(4,125) $4,054 $(839) $(21,166)Counties (11,769) 205,568 (253,461) (18,683) 18,362 839 (95,868)Subtotal $(13,343) $250,951 $(309,418) $(22,808) $22,416 $0 ($117,034)
Total PERS $636,969,280 $65,583,843 $(70,842,519) $21,605,943 $(27,419,213) $(45) $680,735,715

SECTION 3: Additional Information for GASB 68 for North Dakota Public Employees Retirement System
19
EXHIBIT E Schedule of Reconciliation of Net Pension Liability/(Asset) as of June 30, 2014
Beginning
Net Pension Liability/ (Asset)
Pension Expense/ (Income)
Employer
Contributions
New Net Deferred Inflows/
Outflows
Recognition of Prior Deferred
Inflows/Outflows
Ending Net Pension
Liability/(Asset)Main System:
Cities $61,541,581 $5,264,818 $(4,935,390) $(8,661,569) $0 $53,209,440 Counties 127,218,452 10,883,386 (10,202,413) (17,905,152) 0 109,994,273 District Health Units 9,101,237 778,591 (729,883) (1,280,939) 0 7,869,006 Political Subdivisions 10,976,229 938,999 (880,250) (1,544,832) 0 9,490,146 School Districts 113,054,254 9,671,645 (9,066,501) (15,911,635) 0 97,747,763 Other State 207,685,131 17,767,204 (16,655,521) (29,230,304) 0 179,566,510 State of ND 204,536,555 17,497,860 (16,403,016) (28,787,162) 0 176,844,236 Subtotal $734,113,439 $62,802,503 $(58,872,974) $(103,321,593) $0 $634,721,375
Judges System $(395,996) $15,783 $(1,159,604) $(2,184,026) $0 $(3,723,843) National Guard System $224,327 $48,864 $(91,948) $(382,891) $0 $(201,648) Law Enforcement with Prior Main
Service System:
Cities $1,465,265 $182,674 $(256,528) $(164,396) $0 $1,226,475 Counties 4,422,397 551,338 (774,241) (497,802) 0 3,701,692 Other State 1,503,611 187,455 (263,241) (169,253) 0 1,258,572 Subtotal $7,391,273 $921,467 $(1,294,010) $(831,991) $0 $6,186,739
Law Enforcement without Prior Main Service System:
Cities $37,950 $(34,266) $(28,605) $23,347 $0 $(1,574) Counties 283,790 (256,241) (213,909) 174,591 0 (11,769) Subtotal $321,740 $(290,507) $(242,514) $197,938 $0 $(13,343)
Total PERS $741,654,783 $63,498,110 $(61,661,050) $(106,522,563) $0 $636,969,280

SECTION 3: Additional Information for GASB 68 for North Dakota Public Employees Retirement System
20
EXHIBIT F Schedule of Recognition of Changes in Total Net Pension Liability/(Asset) for the Plan year ending June 30, 2015
Increase (Decrease) in Pension Expense/(Income) Arising from the Recognition of the Effects of Differences between Expected and Actual Experience
Differences between Expected
and Actual Experience
Recognition Period (Years) 2015 2016 2017 2018 2019 2020 Thereafter
Main System: Cities $377,678 5.98 $63,157 $63,157 $63,157 $63,157 $63,157 $61,893 $0 Counties 740,713 5.98 123,865 123,865 123,865 123,865 123,865 121,388 0 District Health Units 50,146 5.98 8,386 8,386 8,386 8,386 8,386 8,216 0 Political Subdivisions 68,344 5.98 11,429 11,429 11,429 11,429 11,429 11,199 0 School Districts 663,222 5.98 110,907 110,907 110,907 110,907 110,907 108,687 0 Other State 1,177,626 5.98 196,927 196,927 196,927 196,927 196,927 192,991 0 State of ND 1,157,507 5.98 193,563 193,563 193,563 193,563 193,563 189,692 0 Subtotal $4,235,236 5.98 $708,234 $708,234 $708,234 $708,234 $708,234 $694,066 $0
Judges System $(75,927) 3.92 $(19,369) $(19,369) $(19,369) $(17,820) $0 $0 $0 National Guard System $(300,575) 2.14 $(140,456) $(140,456) $(19,663) $0 $0 $0 $0 Law Enforcement with Prior
Main Service System:
Cities $ 83,321 5.97 $13,957 $13,957 $13,957 $13,957 $13,957 $13,536 $0 Counties 283,015 5.97 47,406 47,406 47,406 47,406 47,406 45,985 0 Other State 80,691 5.97 13,516 13,516 13,516 13,516 13,516 13,111 0 Subtotal $447,027 5.97 $74,879 $74,879 $74,879 $74,879 $74,879 $72,632 $0
Law Enforcement without Prior Main Service System:
Cities $16,284 6.53 $2,494 $2,494 $2,494 $2,494 $2,494 $2,494 $1,320 Counties 73,760 6.53 11,296 11,296 11,296 11,296 11,296 11,296 5,984 Subtotal $90,044 6.53 $13,790 $13,790 $13,790 $13,790 $13,790 $13,790 $7,304
Total PERS $4,395,805 $637,078 $637,078 $757,871 $779,083 $796,903 $780,488 $7,304 Net increase (decrease) in pension expense/(income) $637,078 $637,078 $637,078 $779,083 $796,903 $780,488 $7,304

SECTION 3: Additional Information for GASB 68 for North Dakota Public Employees Retirement System
21
EXHIBIT F Schedule of Recognition of Changes in Total Net Pension Liability/(Asset) for the Plan year ending June 30, 2015
Increase (Decrease) in Pension Expense/(Income) Arising from the Recognition of the Effects of Assumption Changes
Differences between
Expected and Actual
Experience
Recognition Period (Years) 2015 2016 2017 2018 2019 2020 Thereafter
Main System: Cities $(6,487,364) 5.98 $(1,084,843) $(1,084,843) $(1,084,843) $(1,084,843) $(1,084,843) $(1,063,149) $0 Counties (12,723,219) 5.98 (2,127,629) (2,127,629) (2,127,629) (2,127,629) (2,127,629) (2,085,074) 0 District Health Units (861,350) 5.98 (144,038) (144,038) (144,038) (144,038) (144,038) (141,160) 0 Political Subdivisions (1,173,943) 5.98 (196,312) (196,312) (196,312) (196,312) (196,312) (192,383) 0 School Districts (11,392,153) 5.98 (1,905,042) (1,905,042) (1,905,042) (1,905,042) (1,905,042) (1,866,943) 0 Other State (20,228,088) 5.98 (3,382,623) (3,382,623) (3,382,623) (3,382,623) (3,382,623) (3,314,973) 0 State of ND (19,882,481) 5.98 (3,324,830) (3,324,830) (3,324,830) (3,324,830) (3,324,830) (3,258,331) 0 Subtotal $(72,748,598) 5.98 $(12,165,317) $(12,165,317) $(12,165,317) $(12,165,317) $(12,165,317) $(11,922,013) $0
Judges System $(1,931,030) 3.92 $(492,610) $(492,610) $(492,610) $(453,200) $0 $0 $0 National Guard System $(98,236) 2.14 $(45,905) $(45,905) $(6,426) $0 $0 $0 $0 Law Enforcement with Prior
Main Service System:
Cities $(214,603) 5.97 $ (35,947) $ (35,947) $ (35,947) $ (35,947) $ (35,947) $ (34,868) $0 Counties (728,933) 5.97 (122,099) (122,099) (122,099) (122,099) (122,099) (118,438) 0 Other State (207,827) 5.97 (34,812) (34,812) (34,812) (34,812) (34,812) (33,767) 0 Subtotal $(1,151,363) 5.97 $(192,858) $(192,858) $(192,858) $(192,858) $(192,858) $(187,073) $0
Law Enforcement without Prior Main Service System:
Cities $(39,861) 6.53 $(6,104) $(6,104) $(6,104) $(6,104) $(6,104) $(6,104) $(3,237) Counties (180,552) 6.53 (27,650) (27,650) (27,650) (27,650) (27,650) (27,650) (14,652) Subtotal $(220,413) 6.53 $(33,754) $(33,754) $(33,754) $(33,754) $(33,754) $(33,754) $(17,889)
Total PERS $(76,149,640) $(12,930,444) $(12,930,444) $(12,890,965) $(12,845,129) $(12,391,929) $(12,142,840) $(17,889) Net increase (decrease) in pension expense/(income) $(12,930,444) $(12,930,444) $(12,890,965) $(12,845,129) $(12,391,929) $(12,142,840) $(17,889)

SECTION 3: Additional Information for GASB 68 for North Dakota Public Employees Retirement System
22
EXHIBIT F Schedule of Recognition of Changes in Total Net Pension Liability/(Asset) for the Plan year ending June 30, 2015
Increase (Decrease) in Pension Expense/(Income) Arising from the Recognition of Differences between Projected and Actual Earnings on Pension Plan Investments
Differences between
Expected and Actual
Experience
Recognition Period (Years) 2015 2016 2017 2018 2019 2020 Thereafter
Main System: Cities $ 8,758,201 5.00 $1,751,640 $1,751,640 $1,751,640 $1,751,640 $1,751,641 $0 $0 Counties 17,176,855 5.00 3,435,371 3,435,371 3,435,371 3,435,371 3,435,371 0 0 District Health Units 1,162,857 5.00 232,571 232,571 232,571 232,571 232,573 0 0 Political Subdivisions 1,584,871 5.00 316,974 316,974 316,974 316,974 316,975 0 0 School Districts 15,379,862 5.00 3,075,972 3,075,972 3,075,972 3,075,972 3,075,974 0 0 Other State 27,308,729 5.00 5,461,746 5,461,746 5,461,746 5,461,746 5,461,745 0 0 State of ND 26,842,145 5.00 5,368,429 5,368,429 5,368,429 5,368,429 5,368,429 0 0 Subtotal $98,213,520 5.00 $19,642,703 $19,642,703 $19,642,703 $19,642,703 $19,642,708 0 0
Judges System $1,880,585 5.00 $376,117 $376,117 $376,117 $376,117 $376,117 $0 $0 National Guard System $135,628 5.00 $27,126 $27,126 $27,126 $27,126 $27,124 $0 $0 Law Enforcement with Prior
Main Service System: Cities $185,232 5.00 $37,046 $37,046 $37,046 $37,046 $37,048 $0 $0 Counties 629,171 5.00 125,834 125,834 125,834 125,834 125,835 0 0 Other State 179,384 5.00 35,877 35,877 35,877 35,877 35,876 0 0 Subtotal $993,787 5.00 $198,757 $198,757 $198,757 $198,757 $198,759 0 0
Law Enforcement without Prior Main Service System:
Cities $19,802 5.00 $3,960 $3,960 $3,960 $3,960 $3,962 0 0 Counties 89,693 5.00 17,939 17,939 17,939 17,939 17,937 0 0 Subtotal $109,495 5.00 $21,899 $21,899 $21,899 $21,899 $21,899 0 0
Total PERS $101,333,015 $20,266,602 $20,266,602 $20,266,602 $20,266,602 $20,266,607 $0 $0 Net increase (decrease) in pension expense/(income) $20,266,602 $20,266,602 $20,266,602 $20,266,602 $20,266,607 $0 $0

SECTION 3: Additional Information for GASB 68 for North Dakota Public Employees Retirement System
23
EXHIBIT F Schedule of Recognition of Changes in Total Net Pension Liability/(Asset) for the Plan year ending June 30, 2015
Increase (Decrease) in Pension Expense/(Income) Arising from the Changes in Proportion
Differences between
Expected and Actual
Experience
Recognition Period (Years) 2015 2016 2017 2018 2019 2020 Thereafter
Main System: Cities $3,944,081 5.98 $659,548 $659,548 $659,548 $659,548 $659,548 $646,341 $0 Counties 1,179,084 5.98 197,172 197,172 197,172 197,172 197,172 193,224 0 District Health Units (411,419) 5.98 (68,799) (68,799) (68,799) (68,799) (68,799) (67,424) 0 Political Subdivisions 874,813 5.98 146,291 146,291 146,291 146,291 146,291 143,358 0 School Districts 1,915,258 5.98 320,275 320,275 320,275 320,275 320,275 313,883 0 Other State (3,580,498) 5.98 (598,746) (598,746) (598,746) (598,746) (598,746) (586,768) 0 State of ND (3,921,368) 5.98 (655,747) (655,747) (655,747) (655,747) (655,747) (642,633) 0 Subtotal $(49) 5.98 $ (6) $ (6) $ (6) $ (6) $ (6) $ (19) $0
Judges System $0 3.92 $0 $0 $0 $0 $0 $0 $0 National Guard System $0 2.14 $0 $0 $0 $0 $0 $0 $0 Law Enforcement with Prior
Main Service System: Cities $(83,189) 5.97 $(13,935) $(13,935) $(13,935) $(13,935) $(13,935) $(13,514) $0 Counties 244,093 5.97 40,886 40,886 40,886 40,886 40,886 39,663 0 Other State (160,906) 5.97 (26,952) (26,952) (26,952) (26,952) (26,952) (26,146) 0 Subtotal $ (2) 5.97 $ (1) $ (1) $ (1) $ (1) $ (1) $ 3 $0
Law Enforcement without Prior Main Service System:
Cities $(13,288) 6.53 $(2,035) $(2,035) $(2,035) $(2,035) $(2,035) $(2,035) $(1,079) Counties 13,288 6.53 2,035 2,035 2,035 2,035 2,035 2,035 1,079 Subtotal $ 0 6.53 $0 $0 $0 $0 $0 $0 $0
Total PERS $(51) $(7) $(7) $(7) $(7) $(7) $(16) $0 Net increase (decrease) in pension expense/(income) $(7) $(7) $(7) $(7) $(7) $(16) $0

SECTION 3: Additional Information for GASB 68 for North Dakota Public Employees Retirement System
24
EXHIBIT F Schedule of Recognition of Changes in Total Net Pension Liability/(Asset) for the Plan year ending June 30, 2015
Increase (Decrease) in Pension Expense/(Income) Arising from the Recognition of the Effects of the Change in Employer Contributions for the Year
Differences between
Expected and Actual
Experience
Recognition Period (Years) 2015 2016 2017 2018 2019 2020 Thereafter
Main System: Cities $(36,114) 5.98 $(6,041) $(6,041) $(6,041) $(6,041) $(6,041) $(5,909) $0 Counties 143,880 5.98 24,062 24,062 24,062 24,062 24,062 23,570 0 District Health Units 3,090 5.98 515 515 515 515 515 515 0 Political Subdivisions (3,153) 5.98 (523) (523) (523) (523) (523) (538) 0 School Districts 168,590 5.98 28,192 28,192 28,192 28,192 28,192 27,630 0 Other State (447,390) 5.98 (74,815) (74,815) (74,815) (74,815) (74,815) (73,315) 0 State of ND 71,651 5.98 11,983 11,983 11,983 11,983 11,983 11,736 0 Subtotal $ (99,446) 5.98 $(16,627) $(16,627) $(16,627) $(16,627) $(16,627) $(16,311) $0
Judges System $(1,986) 3.92 $(507) $(507) $(507) $(465) $0 $0 $0 National Guard System $(284) 2.14 $(133) $(133) $(18) $0 $0 $0 $0 Law Enforcement with Prior Main
Service System: $0
Cities $18,476 5.97 $3,095 $3,095 $3,095 $3,095 $3,095 $3,001 $0 Counties 34,547 5.97 5,787 5,787 5,787 5,787 5,787 5,612 0 Other State (12,896) 5.97 (2,160) (2,160) (2,160) (2,160) (2,160) (2,096) 0 Subtotal $40,127 5.97 $6,722 $6,722 $6,722 $6,722 $6,722 $6,517 $0
Law Enforcement without Prior Main Service System:
Cities $4,773 6.53 $731 $731 $731 $731 $731 $731 $387 Counties 3,124 6.53 479 479 479 479 479 479 250 Subtotal $7,897 6.53 $1,210 $1,210 $1,210 $1,210 $1,210 $1,210 $637
Total PERS $(53,692) $(9,335) $(9,335) $(9,220) $(9,160) $(8,695) $(8,584) $637 Net increase (decrease) in pension expense/(income) $(9,335) $(9,335) $(9,220) $(9,160) $(8,695) $(8,584) $637

SECTION 3: Additional Information for GASB 68 for North Dakota Public Employees Retirement System
25
EXHIBIT F Schedule of Recognition of Changes in Total Net Pension Liability/(Asset) for the Plan year ending June 30, 2014
Increase (Decrease) in Pension Expense/(Income) Arising from the Recognition of the Effects of Differences between Expected and Actual Experience
Differences between
Expected and Actual
Experience
Recognition Period (Years) 2014 2015 2016 2017 2018 Thereafter
Main System: Cities $2,092,176 5.70 $367,048 $367,048 $367,048 $367,048 $367,048 $256,936 Counties 4,324,937 5.70 758,761 758,761 758,761 758,761 758,761 531,132 District Health Units 309,407 5.70 54,282 54,282 54,282 54,282 54,282 37,997 Political Subdivisions 373,149 5.70 65,465 65,465 65,465 65,465 65,465 45,824 School Districts 3,843,409 5.70 674,282 674,282 674,282 674,282 674,282 471,999 Other State 7,060,493 5.70 1,238,683 1,238,683 1,238,683 1,238,683 1,238,683 867,078 State of ND 6,953,454 5.70 1,219,904 1,219,904 1,219,904 1,219,904 1,219,904 853,934 Subtotal $24,957,025 5.70 $4,378,425 $4,378,425 $4,378,425 $4,378,425 $4,378,425 $3,064,900
Judges System $340,738 3.38 $100,810 $100,810 $100,810 $38,308 $0 $0 National Guard System $(258,872) 4.75 $(54,499) $(54,499) $(54,499) $(54,499) $(40,876) $0 Law Enforcement with Prior
Main Service System:
Cities $84,584 7.21 $11,731 $11,731 $11,731 $11,731 $11,731 $25,929 Counties 255,287 7.21 35,407 35,407 35,407 35,407 35,407 78,252 Other State 86,798 7.21 12,039 12,039 12,039 12,039 12,039 26,603 Subtotal $426,669 7.21 $59,177 $59,177 $59,177 $59,177 $59,177 $130,784
Law Enforcement without Prior Main Service System:
Cities $37,426 7.59 $4,931 $4,931 $4,931 $4,931 $4,931 $12,771 Counties 279,873 7.59 36,874 36,874 36,874 36,874 36,874 95,503 Subtotal $317,299 7.59 $41,805 $41,805 $41,805 $41,805 $41,805 $108,274
Total PERS $25,782,859 $4,525,718 $4,525,718 $4,525,718 $4,463,216 $4,438,531 $3,303,958 Net increase (decrease) in pension expense/(income) $4,525,718 $4,525,718 $4,525,718 $4,463,216 $4,438,531 $3,303,958

SECTION 3: Additional Information for GASB 68 for North Dakota Public Employees Retirement System
26
EXHIBIT F Schedule of Recognition of Changes in Total Net Pension Liability/(Asset) for the Plan year ending June 30, 2014
Increase (Decrease) in Pension Expense/(Income) Arising from the Recognition of the Effects of Assumption Changes
Differences between Expected
and Actual Experience
Recognition Period (Years) 2015 2016 2017 2018 2019 Thereafter
Main System: Cities $0 5.70 $0 $0 $0 $0 $0 $0 Counties 0 5.70 0 0 0 0 0 0 District Health Units 0 5.70 0 0 0 0 0 0 Political Subdivisions 0 5.70 0 0 0 0 0 0 School Districts 0 5.70 0 0 0 0 0 0 Other State 0 5.70 0 0 0 0 0 0 State of ND 0 5.70 0 0 0 0 0 0 Subtotal $0 5.70 $0 $0 $0 $0 $0 $0
Judges System $0 3.38 $0 $0 $0 $0 $0 $0 National Guard System $0 4.75 $0 $0 $0 $0 $0 $0 Law Enforcement with Prior
Main Service System:
Cities $0 7.21 $0 $0 $0 $0 $0 $0 Counties 0 7.21 0 0 0 0 0 0 Other State 0 7.21 0 0 0 0 0 0 Subtotal $0 7.21 $0 $0 $0 $0 $0 $0
Law Enforcement without Prior Main Service System:
Cities $0 7.59 $0 $0 $0 $0 $0 $0 Counties 0 7.59 0 0 0 0 0 0 Subtotal $0 7.59 $0 $0 $0 $0 $0 $0
Total PERS $0 $0 $0 $0 $0 $0 $0 Net increase (decrease) in pension expense/(income) $0 $0 $0 $0 $0 $0

SECTION 3: Additional Information for GASB 68 for North Dakota Public Employees Retirement System
27
EXHIBIT F Schedule of Recognition of Changes in Total Net Pension Liability/(Asset) for the Plan year ending June 30, 2014
Increase (Decrease) in Pension Expense/(Income) Arising from the Recognition of Differences between Projected and Actual Earnings on Pension Plan Investments
Differences between Expected
and Actual Experience
Recognition Period (Years) 2014 2015 2016 2017 2018 Thereafter
Main System: Cities $(12,983,371) 5.00 $(2,596,674) $(2,596,674) $(2,596,674) $(2,596,674) $(2,596,675) $0 Counties (26,839,160) 5.00 (5,367,832) (5,367,832) (5,367,832) (5,367,832) (5,367,832) 0 District Health Units (1,920,080) 5.00 (384,016) (384,016) (384,016) (384,016) (384,016) 0 Political Subdivisions (2,315,645) 5.00 (463,129) (463,129) (463,129) (463,129) (463,129) 0 School Districts (23,850,953) 5.00 (4,770,191) (4,770,191) (4,770,191) (4,770,191) (4,770,189) 0 Other State (43,815,142) 5.00 (8,763,028) (8,763,028) (8,763,028) (8,763,028) (8,763,030) 0 State of ND (43,150,890) 5.00 (8,630,178) (8,630,178) (8,630,178) (8,630,178) (8,630,178) 0 Subtotal $(154,875,241) 5.00 $(30,975,048) $(30,975,048) $(30,975,048) $(30,975,048) $(30,975,049) $0
Judges System $(3,029,943) 5.00 $(605,989) $(605,989) $(605,989) $(605,989) $(605,987) $0 National Guard System $(223,147) 5.00 $(44,629) $(44,629) $(44,629) $(44,629) $(44,631) $0 Law Enforcement with Prior
Main Service System: Cities $(297,236) 5.00 $(59,447) $(59,447) $(59,447) $(59,447) $(59,448) $0 Counties (897,103) 5.00 (179,421) (179,421) (179,421) (179,421) (179,419) 0 Other State (305,015) 5.00 (61,003) (61,003) (61,003) (61,003) (61,003) 0 Subtotal $(1,499,354) 5.00 $(299,871) $(299,871) $(299,871) $(299,871) $(299,870) $0
Law Enforcement without Prior Main Service System: Cities $(11,435) 5.00 $(2,287) $(2,287) $(2,287) $(2,287) $(2,287) $0 Counties (85,510) 5.00 (17,102) (17,102) (17,102) (17,102) (17,102) 0 Subtotal $(96,945) 5.00 $(19,389) $(19,389) $(19,389) $(19,389) $(19,389) $0
Total PERS $(159,724,630) 5.00 $(31,944,926) $(31,944,926) $(31,944,926) $(31,944,926) $(31,944,926) $0 Net increase (decrease) in pension expense/(income) $(31,944,926) $(31,944,926) $(31,944,926) $(31,944,926) $(31,944,926) $0

SECTION 3: Additional Information for GASB 68 for North Dakota Public Employees Retirement System
28
The net effect of the change on the employer’s proportionate share of the collective net pension liability/(asset) and collective deferred outflows of resources and deferred inflows of resources will be also recognized over the average of the expected remaining service lives of all members. The difference between the actual employer and member contributions and the proportionate share of the employer and member contributions during the measurement periods will be recognized over the same periods. While these amounts are different for each employer, they should sum to zero for the each system of PERS.

SECTION 3: Additional Information for GASB 68 for North Dakota Public Employees Retirement System
29
EXHIBIT G Schedule of Employer Allocations
Schedule of Employer Allocations as of June 30, 2015
2014-2015 Covered
Employee Payroll
Current Contribution
Rate
Estimated 2015-2016
Contributions
Employer Allocation Percentage
Main System: Cities $79,444,201 7.12% $5,656,427 8.917511% Counties 155,808,440 7.12% 11,093,561 17.489299% District Health Units 10,548,091 7.12% 751,024 1.184010% Political Subdivisions 14,376,105 7.12% 1,023,579 1.613700% School Districts 139,508,176 7.12% 9,932,982 15.659616% Other State 247,712,989 7.12% 17,637,165 27.805468% State of ND 243,480,677 7.12% 17,335,824 27.330397%
Subtotal $890,878,679 7.12% $63,430,562 100.000001% Judges System $6,746,660 17.52% $1,182,015 100.000000% National Guard System $629,811 9.58% $60,336 100.000000% Law Enforcement with Prior Main Service System:
Cities $2,731,828 9.81% $267,991 18.639015% Counties 9,279,057 9.81% 910,275 63.310441% Other State 2,517,267 10.31% 259,530 18.050544% Subtotal $14,528,152 $1,437,796 100.000000%
Law Enforcement without Prior Main Service System: Cities $682,979 7.93% $54,160 18.084604% Counties 3,093,598 7.93% 245,322 81.915396% Subtotal $3,776,577 7.93% $299,482 100.000000%
Total PERS $916,559,879 $66,410,191

SECTION 3: Additional Information for GASB 68 for North Dakota Public Employees Retirement System
30
EXHIBIT G Schedule of Employer Allocations
Schedule of Employer Allocations as of June 30, 2014
2013-2014 Covered Employee
Payroll
Current Contribution
Rate
Estimated 2014-2015
Contributions
Employer Allocation Percentage
Main System: Cities $70,617,619 7.12% $5,027,974 8.383116% Counties 145,980,386 7.12% 10,393,803 17.329536% District Health Units 10,443,467 7.12% 743,575 1.239759% Political Subdivisions 12,594,979 7.12% 896,763 1.495168% School Districts 129,727,279 7.12% 9,236,582 15.400107% Other State 238,314,139 7.12% 16,967,966 28.290604% State of ND 234,701,222 7.12% 16,710,726 27.861710%
Subtotal $842,379,091 7.12% $59,977,389 100.000000% Judges System $6,460,877 17.52% $1,131,946 100.000000% National Guard System $1,061,849 7.00% $74,329 100.000000% Law Enforcement with Prior Main Service System:
Cities $2,591,824 9.81% $254,258 19.824258% Counties 7,822,525 9.81% 767,390 59.832678% Other State 2,530,668 10.31% 260,912 20.343064% Subtotal $12,945,017 $1,282,560 100.000000%
Law Enforcement without Prior Main Service System: Cities $322,283 7.93% $25,557 11.795180% Counties 2,410,045 7.93% 191,117 88.204820% Subtotal $2,732,328 7.93% $216,674 100.000000%
Total PERS $865,579,162 $62,682,898
5401147v6/01640.001

SECTION
APPENDScheduleMain Sys
EmplTy
(1State of NDState of NDState State State State State of NDState State of NDState of NDState of NDState State of NDState of NDState State State of NDState State State of NDState of NDState State State State State State State State State State State State of NDState of NDState of NDState State of NDState of NDState of NDState of NDState of NDState of NDState of NDState of NDState of NDState of NDState State State of NDState of ND
N 4: Appen
IX A e of Employestem
loyer pe
E
1) D D
D
D D D
D D
D
D D
D D D
D D D D D D D D D D
D D
ndices for GA
er Allocations
Employer ID (2)
10100 G10800 S11000 O11200 I11700 S11800 C12000 S12500 A12700 T13000 F14000 O16000 L18000 N18800 C19000 R19200 N20100 P20200 E21500 N22300 N22400 J22600 L22700 B22800 L22900 W23000 U23500 N23800 N23900 D24000 M24100 M24200 V25000 N25200 S25300 S26100 N27000 C30100 N30500 T31000 L31200 N31300 N31600 I32100 V32500 D36000 P38000 J40100 I40500 I40600 N
ASB 68 for N
s as of June
Governor's OfficSecretary Of StatOffice Of Managnformation Tech
State Auditor's OCentral ServicesState Treasurer's Attorney GeneraTax DepartmentFacility ManagemOffice Of AdminLegislative CounND Supreme CouCommission On Retirement & InvND Public EmplPublic InstructionEducation StandaND University SND Youth CorreJuvenile ServicesLand DepartmenBismarck State CLake Region StatWilliston State CUniversity Of NoNorth Dakota StaND St College ODickinson State UMayville State UMinot State UnivValley City StateND State LibrarySCHOOL FOR TSchool For The BND Board Of NuCareer & TechniND Department Tobacco PreventLife Skills and TNorth Dakota StaND Veterans Hondian Affairs Co
Veterans Affairs Department Of HProtection & AdvJob Service Nortnsurance Departndustrial Comm
ND Department
North Dakota
30, 2015
Employer (3)
ce te gement & Budgehnology Dept
Office
Office al's Office
ment nistrative Hearinncil urt Legal Counsel Fvestment Officeoyees Retiremenn ards & Practiceystem Office
ectional Center s - DOCR
nt College te College
College orth Dakota ate University
Of Science University
University versity e University y THE DEAF Blind ursing ical Education Of Health tion/Control Com
Transition Centerate Hospital me ommission Department
Human Servicesvocacy Project th Dakota tment
mission Of Labor
a Public Emp
et
ngs
For Indigents
nt System
mmittee r
ployees Retir
Covered Employee
Payroll (4)
$ 951,471,147,432,450,75
21,046,873,179,601,152,09
315,179,631,726,313,002,074,77
252,911,866,29
17,117,211,813,441,296,631,588,704,830,34
389,37573,91
3,028,801,373,191,566,163,949,651,860,761,121,55
40,158,4831,519,65
5,545,272,514,212,628,195,445,711,798,841,210,161,007,75
560,58329,05934,82
17,602,22559,21
12,782,5917,595,36
4,334,11279,81325,64
63,297,691,621,799,790,392,075,665,859,62
479,95
rement Syste
e
EmploProport
ShaAlloca
(571 0.106838 0.128754 0.275078 2.362402 0.356991 0.129379 0.035328 1.081108 0.708672 0.232819 0.028399 0.209410 1.921348 0.203538 0.145506 0.178349 0.542276 0.043717 0.064408 0.339996 0.154160 0.175751 0.443363 0.208859 0.125883 4.507754 3.538070 0.622413 0.282296 0.295018 0.611241 0.201962 0.135858 0.113188 0.062953 0.036925 0.104923 1.975815 0.062794 1.434868 1.975015 0.486412 0.031447 0.036591 7.105099 0.182099 1.098962 0.232925 0.657759 0.0538
em
31
yer’s ionate
are ation 5)
801% 798% 094% 485% 906% 321% 378% 149% 627% 891% 390% 490% 385% 557% 546% 330% 201% 707% 421% 980% 140% 799% 343% 868% 894% 739% 041% 450% 217% 012% 275% 918% 839% 120% 925% 936% 933% 827% 771% 830% 058% 499% 409% 553% 085% 045% 960% 990% 735% 875%

SECTION
EmplTy
(1State of NDState of NDState of NDState of NDState State State State State State State State State of NDState of NDState of ND
State of NDState of NDState State of ND
State of NDState of NDState of NDState of NDState of NDState State of NDState of NDState State of NDState of NDState State of NDState of NDState of NDState of NDState of NDState of NDState State State State State State State District HeaDistrict HeaDistrict HeaDistrict HeaDistrict HeaDistrict HeaDistrict HeaDistrict HeaDistrict Hea
N 4: Appen
loyer pe
E
1) D D D D
D D D
D D
D
D D D D D
D D
D D
D D D D D D
alth Unit alth Unit alth Unit alth Unit alth Unit alth Unit alth Unit alth Unit alth Unit
ndices for GA
Employer ID (2)
40800 P41200 A41300 D41400 N42600 S42700 N42800 N47100 B47200 P47300 H47500 M48500 W50200 F50400 H51700 D
S51800 J51900 S52000 R53000 D
R54000 A60100 D60200 D60700 M60800 N61100 N61400 N61600 S62400 B62500 N62600 N66500 S67000 R70100 H70900 N72000 G75000 P77000 W80100 D90000 N90100 B90200 B90600 R90900 E99501 N
100002 M100003 W100004 C100005 D100006 E100007 R100008 T100009 N100010 F
ASB 68 for N
Public Service CAeronautics ComDepartment Of FND Securities DeState Board Of LND State Board OND State PlumbiBank Of North DPublic Finance AHousing FinanceMill & Elevator AWorkforce SafetyField Services DHighway PatrolDepartment Of CServices James River CorrState PenitentiaryRough Rider IndDepartment Of CRehabilitation Adjutant GeneralDepartment Of CDept Of AgricultMilk Marketing BND Oilseed CounND Soybean CouND Corn UtilizatState Seed DeparBeef CommissioND Wheat CommND Barley CounState Fair AssociRacing CommissHistorical SocietND Council On TGame & Fish DeParks & RecreatiWater CommissiDepartment Of TND State Board OBoard Of MedicaBoard Of PharmaReal Estate ComElectrical BoardND System InforMcIntosh DistricWells County DiCentral Valley HDickey County HEmmons CountyRolette County PTowner County PNelson-Griggs DFirst District Hea
North Dakota
Employer (3)
ommission mmission Financial Institutepartment
Law Examiners Of Cosmetologying Board
Dakota Authority e Agency Association y & Insurance ivision
Corrections Tran
rectional Ctr y
dustries Corrections And
l ND National GCommerce ture Board ncil uncil tion Council rtment n mission ncil iation sion ty The Arts epartment ion Departmention Transportation Of Accountancyal Examiners acy
mmission
rmation Technolct Health Unit ist Health Unit
Health Unit Health District y Public Health Public Health Public Health Un
District Health Unalth Unit
a Public Emp
tions
y
nsitional
Guard
y
logy Services
nit Unit
ployees Retir
Covered Employee
Payroll (4)
2,740,79320,89
2,003,92524,50338,49
58,73299,77
8,868,34159,37
2,168,807,732,208,230,885,920,221,842,941,747,49
6,035,778,799,451,357,186,270,90
9,270,233,267,423,551,00
188,292,50
371,36110,83
1,097,08119,98390,65120,00922,65123,24
3,377,49283,19
9,268,862,914,435,639,32
60,100,2729,13
166,78210,04123,07
1,371,361,604,88
61,10165,93924,76129,97108,87308,66
56,01127,45
1,891,60
rement Syste
e
EmploProport
ShaAlloca
(594 0.307691 0.036028 0.224903 0.058894 0.037939 0.006576 0.033649 0.995472 0.017806 0.243408 0.867986 0.923923 0.664547 0.206893 0.1961
70 0.677553 0.987781 0.152308 0.7039
37 1.040529 0.366702 0.398592 0.021100 0.000264 0.041631 0.012482 0.123181 0.013458 0.043800 0.013457 0.103540 0.013894 0.379195 0.031766 1.040434 0.327128 0.633070 6.746138 0.003288 0.018748 0.023576 0.013860 0.153985 0.180104 0.006835 0.018666 0.103879 0.014576 0.012264 0.034615 0.006252 0.014301 0.2123
em
32
yer’s ionate
are ation 5)
651% 020% 938% 875% 996% 593% 649% 461% 889% 446% 931% 906% 538% 868% 154%
508% 727% 342% 901%
572% 765% 595% 136% 281% 685% 441% 146% 468% 851% 470% 567% 834% 119% 788% 418% 142% 007% 179% 271% 722% 578% 815% 933% 146% 859% 626% 804% 590% 221% 647% 288% 306% 330%

SECTION
EmplTy
(1District HeaDistrict HeaDistrict HeaDistrict HeaDistrict HeaDistrict HeaDistrict HeaDistrict HeaDistrict HeaDistrict HeaDistrict HeaCity City City City City City City City City City City City City City City City City City City City City City City City City City City City City City City City City City City City City City City City City City City City
N 4: Appen
loyer pe
E
1) alth Unit alth Unit alth Unit alth Unit alth Unit alth Unit alth Unit alth Unit alth Unit alth Unit alth Unit
ndices for GA
Employer ID (2)
100011 L100012 G100013 U100014 K100015 S100017 C100018 S100019 T100021 C100022 W100023 C200002 C200003 C200004 C200005 C200006 C200008 C200009 C200010 C200011 C200012 C200014 C200015 C200016 C200017 C200018 C200019 C200020 C200021 C200022 C200025 C200026 C200028 C200029 C200030 C200031 C200033 C200035 C200036 C200037 C200038 C200040 C200041 C200045 C200046 C200049 C200050 C200051 C200052 C200053 C200054 C200055 C200057 C200058 C200059 C
ASB 68 for N
Lake Region DisGarrison DiversiUpper Missouri HKidder County DSouthwestern DiCity-County HeaSargent County DTraill District HeCavalier County Walsh County HCuster Health UnCity Of McvilleCity Of DraytonCity Of FessendeCity Of WesthopCity Of BelfieldCity Of Rolla City of New TowCity Of CavalierCity Of HarveyCity Of NapoleonCity Of Grand FoCity Of KilldeerCity Of EllendaleCity Of WishekCity Of GranvilleCity Of Linton City Of Finley City Of Wilton City Of Ray City Of MedoraCity of Velva City Of ThompsoCity Of WillistonCity Of BowmanCity Of Tioga City Of Rhame City Of Fargo City Of JamestowCity Of Beach City Of GlenburnCity Of Kulm City Of HarwoodCity Of MapletonCity Of WahpetoCity Of Elgin City Of Rugby City Of New SalCity Of WalhallaCity Of GwinnerCity Of KenmareCity Of Watford City Of CooperstCity Of New EngCity Of Carringto
North Dakota
Employer (3)
strict Health Union ConservancyHealth Unit
District Health Ustrict Health Un
alth District District Health Uealth Unit Health Dist
Health District nit
en pe
wn
n orks
e
e
on n n
wn
n
d n on
em a r e City town gland on
a Public Emp
it y District
Unit nit
Unit
ployees Retir
Covered Employee
Payroll (4) 774,80
1,578,78835,01
26,651,193,65
513,7682,74
155,21110,51277,11
1,225,4393,78
212,1537,50
141,69371,48249,44710,41507,28464,48150,14
16,368,03567,35287,98
67,3446,09
211,2190,26
130,32249,60282,93112,31113,04
8,403,52566,01985,94
32,4023,267,89
4,462,48172,16
54,37104,47
88,37123,64
2,288,6887,16
507,1290,90
157,08139,18243,59
2,172,36125,75128,57703,73
rement Syste
e
EmploProport
ShaAlloca
(509 0.086982 0.177213 0.093759 0.002955 0.133963 0.057640 0.009214 0.017411 0.012415 0.031138 0.137586 0.010550 0.023809 0.004294 0.015989 0.041642 0.028016 0.079786 0.056988 0.052143 0.016830 1.837253 0.063683 0.032345 0.007591 0.005111 0.023762 0.010120 0.014601 0.028034 0.031717 0.012646 0.012627 0.943210 0.063549 0.110600 0.003698 2.611786 0.500967 0.019371 0.006174 0.011774 0.009941 0.013886 0.256962 0.009727 0.056907 0.010282 0.017684 0.015695 0.027361 0.243857 0.014171 0.014439 0.0789
em
33
yer’s ionate
are ation 5)
971% 216% 729% 992% 986% 669% 287% 423% 405% 106% 554% 527% 814% 210% 905% 699% 000% 743% 942% 138% 853% 291% 685% 326% 559% 174% 708% 132% 628% 017% 759% 607% 689% 285% 534% 672% 637% 792% 908% 326% 103% 727% 920% 879% 902% 784% 924% 204% 632% 623% 343% 845% 116% 432% 994%

SECTION
EmplTy
(1City City City City City City City City City City City City City City City City City City City City City City City City City City City City City City City City City City City City City City City City County County County County County County County County County County County County County County County
N 4: Appen
loyer pe
E
1)
ndices for GA
Employer ID (2)
200060 C200061 C200062 C200063 C200064 C200065 C200067 C200069 C200070 C200072 C200073 C200075 C200076 C200077 C200079 C200080 C200083 C200084 C200085 C200086 C200087 C200088 C200089 C200090 C200091 C200094 C200097 C200098 C200100 C200101 C200102 C200103 C200104 C200110 C200111 C200114 C200115 C200117 C200118 C200119 C300001 A300002 B300003 B300004 B300005 B300006 B300007 B300008 B300009 C300010 C300011 D300012 D300013 D300014 E300015 E
ASB 68 for N
City Of Mott City Of LarimoreCity Of SherwooCity Of LamoureCity Of MichiganCity Of Park RivCity Of Hatton City Of NorthwoCity Of Powers LCity Of TownerCity Of PembinaCity Of UnderwoCity Of New LeiCity Of StanleyCity Of ScrantonCity Of Crosby City Of GraftonCity Of EmeradoCity Of LincolnCity Of Minto City Of Ashley City Of Neche City Of Surrey City Of HankinsoCity Of New RocCity Of West FarCity Of Devils LCity Of Oakes City Of Mohall City Of LidgerwCity Of MccluskCity Of BurlingtoCity Of Lisbon City Of HallidayCity Of MaddockCity of Regent City of Lakota City of AlexandeCity of BertholdCity of Carson Adams County Barnes County Benson CountyBillings CountyBottineau CountyBowman CountyBurke County Burleigh CountyCass County Cavalier CountyDickey County Divide County Dunn County Eddy County Emmons County
North Dakota
Employer (3)
e od e n
ver
ood Lake
a ood ipzig
n
o
on ckford rgo
Lake
ood ky on
y k
er
y y
y
a Public Empployees Retir
Covered Employee
Payroll (4)
99,10102,06
17,50133,95
18,83402,23
84,70121,76
34,8673,8578,8324,63
805,80
141,881,307,32
68,82283,29
77,9991,2343,50
312,80183,09186,18
5,931,05602,81638,73132,66
59,9632,45
127,20282,32
77,4999,4525,88
210,84$70,84
30,0257,78
823,912,530,051,594,042,295,812,796,531,359,101,374,62
12,780,8320,819,74
1,814,901,551,282,565,093,304,49
741,051,089,35
rement Syste
e
EmploProport
ShaAlloca
(508 0.011164 0.011400 0.001953 0.015031 0.002137 0.045100 0.009561 0.0136
0 0.000062 0.003955 0.008234 0.008837 0.002709 0.0904
0 0.000087 0.015927 0.146723 0.007795 0.031894 0.008732 0.010200 0.004800 0.035197 0.020584 0.020852 0.665713 0.067631 0.071668 0.014866 0.006757 0.003603 0.014227 0.031695 0.008652 0.011185 0.002945 0.023644 0.007927 0.003382 0.006410 0.092450 0.283946 0.178912 0.257733 0.313908 0.152523 0.154338 1.434649 2.336902 0.203786 0.174197 0.287998 0.370956 0.083150 0.1222
em
34
yer’s ionate
are ation 5)
125% 457% 964% 036% 114% 151% 507% 668% 000% 913% 290% 849% 765% 451% 000% 927% 746% 725% 800% 755% 241% 883% 111% 552% 899% 753% 665% 697% 892% 731% 643% 278% 691% 699% 163% 906% 667% 952% 370% 486% 483% 995% 930% 702% 907% 558% 300% 633% 990% 720% 130% 929% 926% 183% 278%

SECTION
EmplTy
(1County County County County County County County County County County County County County County County County County County County County County County County County County County County County County County County County County County School DistSchool DistSchool DistSchool DistSchool DistSchool DistSchool DistSchool DistSchool DistSchool DistSchool DistSchool DistSchool DistSchool DistSchool DistSchool DistSchool DistSchool DistSchool DistSchool DistSchool Dist
N 4: Appen
loyer pe
E
1)
rict rict rict rict rict rict rict rict rict rict rict rict rict rict rict rict rict rict rict rict rict
ndices for GA
Employer ID (2)
300016 F300018 G300019 G300020 G300021 H300023 L300024 L300025 M300026 M300027 M300028 M300029 M300030 M300031 M300032 N300033 O300034 P300035 P300036 R300037 R300038 R300039 R300040 R300042 S300044 S300045 S300046 S300047 S300048 T300049 T300050 W300051 W300052 W300053 W400002 M400003 L400004 L400006 H400007 O400008 U400010 N400011 B400012 P400014 B400016 S400017 E400018 R400019 F400020 S400021 J400023 W400024 S400025 R400026 B400027 B
ASB 68 for N
Foster County Grand Forks CouGrant County Griggs County Hettinger CountyLamoure CountyLogan County Mchenry CountyMcintosh CountyMckenzie CountyMclean CountyMercer County Morton CountyMountrail CountNelson County Oliver County Pembina CountyPierce County Ramsey CountyRansom CountyRenville CountyRichland CountyRolette County Sheridan CountySlope County Stark County Steele County Stutsman CountyTowner CountyTraill County Walsh County Ward County Wells County Williams CountyMcclusky PublicLake Region SpeLidgerwood PubHalliday Public SOliver-Mercer SpUnderwood SchoNew Town PubliBottineau PublicPeace Garden SpBeulah Public ScSt John School DEllendale Public Rural Cass SpeciFargo Public SchSurrey Schools Jamestown PubliWarwick Public Souris Valley SpRugby Public ScBillings County SBelcourt School
North Dakota
Employer (3)
unty
y y
y y y
ty
y
y
y
y c Schools ecial Education Ulic School School pecial Educationool District #8 ic School DistricSchool
pecial Services chool #27 District #3
School District ial Education Unhools
ic School DistricSchool
pecial Services hool District #5School DistrictDistrict #7
a Public Emp
Unit
n Unit
ct
#40 nit
ct #1
ployees Retir
Covered Employee
Payroll (4) 809,62
13,246,07900,32692,53
1,067,081,455,94
628,751,344,34
921,225,740,073,850,482,708,375,200,054,817,441,215,48
691,472,557,051,981,612,883,591,333,181,119,385,107,831,911,00
528,75545,49
4,971,91805,33
5,743,88867,09
2,595,582,951,688,142,291,380,737,651,80
134,78568,68265,21
64,80352,87263,44
1,062,791,350,91
340,10567,72505,97390,57251,40
19,139,05559,07
2,758,95285,10
1,188,98634,04421,98
4,776,44
rement Syste
e
EmploProport
ShaAlloca
(524 0.090875 1.486820 0.101036 0.077786 0.119744 0.163459 0.070546 0.150922 0.103470 0.644386 0.432277 0.304057 0.583748 0.540786 0.136473 0.077659 0.287011 0.222496 0.323685 0.149688 0.125630 0.573309 0.214554 0.059397 0.061218 0.558035 0.090387 0.644792 0.097388 0.291387 0.331396 0.913933 0.154908 0.858988 0.015187 0.063816 0.029709 0.007273 0.039649 0.029592 0.119211 0.151601 0.038124 0.063776 0.056772 0.043803 0.028257 2.148375 0.062758 0.309601 0.032083 0.133443 0.071183 0.047343 0.5361
em
35
yer’s ionate
are ation 5)
879% 855% 060% 736% 779% 428% 577% 901% 406% 316% 212% 012% 700% 752% 437% 617% 027% 433% 680% 648% 650% 347% 508% 352% 231% 091% 398% 744% 330% 351% 323% 962% 986% 906% 130% 834% 770% 275% 610% 572% 297% 638% 176% 726% 795% 841% 220% 335% 755% 690% 002% 462% 171% 367% 150%

SECTION
EmplTy
(1School DistSchool DistSchool DistSchool DistSchool DistSchool DistSchool DistSchool DistSchool DistSchool DistSchool DistSchool DistSchool DistSchool DistSchool DistSchool DistSchool DistSchool DistSchool DistSchool DistSchool DistSchool DistSchool DistSchool DistSchool DistSchool DistSchool Dist
School DistSchool DistSchool DistSchool DistSchool DistSchool DistSchool DistSchool DistSchool DistSchool DistSchool DistSchool DistSchool DistSchool DistSchool DistSchool DistSchool DistSchool DistSchool DistSchool DistSchool DistSchool DistSchool DistSchool DistSchool DistSchool DistSchool Dist
N 4: Appen
loyer pe
E
1) rict rict rict rict rict rict rict rict rict rict rict rict rict rict rict rict rict rict rict rict rict rict rict rict rict rict rict
rict rict rict rict rict rict rict rict rict rict rict rict rict rict rict rict rict rict rict rict rict rict rict rict rict rict rict
ndices for GA
Employer ID (2)
400028 W400029 M400030 B400031 M400033 H400034 O400035 L400036 H400038 P400039 H400040 L400042 N400043 M400044 T400045 N400046 B400047 A400048 B400049 W400050 E400051 M400052 V400053 S400054 C400055 B400056 N400057 J
U400058 N400059 N400060 Y400061 C400062 R400063 F400064 B400065 S400068 L400069 S400070 M400072 K400073 G400074 N400075 W400076 V400077 D400078 D400079 M400080 W400081 K400082 G400083 W400084 S400085 W400086 T400087 T
ASB 68 for N
West Fargo PublMinot Public SchBelfield Public SMinto Public SchHarvey Public ScOakes Public SchLarimore Public Hazen Public SchPark River Area Hillsboro Public Lisbon Public ScNorthern Cass ScMandaree PublicThompson PublicNorthern Plains SBowman CountyApple Creek ElemBurke Central ScWashburn PublicEnderlin Area ScMidkota SchoolVelva Public SchSheyenne ValleyCenter Stanton PBurleigh CountyNew Rockford SJames River MulUnit Newburg UnitedNapoleon PublicYellowstone SchCavalier Public SRichland School Fort Totten SchoBismarck Public Solen Public SchLakota Public ScStanley CommunMandan Public SKilldeer Public SGlenburn SchoolNew Public SchoWilliston Public Valley City PublDickinson PublicDrayton Public SMohall LansfordWesthope PublicKindred Public SGrafton Public SWilton Public ScSheyenne ValleyWhite Shield SchTgu School DistrTurtle Lake Merc
North Dakota
Employer (3)
lic School #6 hool District #1School #13 hool District #20chool Dist #38 hools School District hool District #3School DistrictSchool
chool chool District # c School #36 c School Special Ed Unit
y School Districtmentary Schoolchool c School chool District #2
hool y Special EducatPublic School Special Educatiheyenne Public ltidistrict Specia
d Public School School District
hool District # 14Schools District # 44
ool District # 30Schools
hool Dist #3 chool District # 6nity Public SchoSchool District #School #16 l District ool #8 School #1
lic School c Schools School #19 d Sherwood Schoc School #17 School District #chool District #3
chool District y Career And Techool Dist #85 rict #60 cer School Distr
a Public Emp
0
#44
97
t #1
24
tion Unit
ion Unit School
al Education
#2 4
66 ool District # 2 #1
ool
#2 3
ch Center
rict #72
ployees Retir
Covered Employee
Payroll (4)
12,705,5713,479,82
332,69354,41492,00518,75574,95595,80517,74473,95603,84579,69432,42314,06109,81620,09
51,9691,16
354,96468,44
85,21363,25520,08256,26
46,39230,85390,27
206,60231,64
91,22412,98379,64341,23
21,067,35134,53261,78
1,084,906,774,95
693,14352,17480,83
3,920,68942,02
4,280,76165,75337,53271,80435,16
1,157,12191,48
91,88847,37
1,557,52422,82
rement Syste
e
EmploProport
ShaAlloca
(578 1.426129 1.513097 0.037316 0.039708 0.055256 0.058256 0.064503 0.066842 0.058154 0.053244 0.067795 0.065020 0.048565 0.035214 0.012394 0.069660 0.005866 0.010268 0.039841 0.052514 0.009555 0.040789 0.058367 0.028795 0.005256 0.025977 0.0438
05 0.023145 0.026026 0.010280 0.046345 0.042639 0.038356 2.364731 0.015185 0.029305 0.121759 0.760444 0.077879 0.039533 0.053982 0.440024 0.105763 0.480553 0.018639 0.037804 0.030569 0.048824 0.129889 0.021481 0.010377 0.095122 0.174823 0.0474
em
36
yer’s ionate
are ation 5)
185% 094% 345% 783% 227% 230% 538% 878% 116% 201% 781% 070% 539% 253% 326% 605% 832% 233% 845% 582% 565% 775% 379% 766% 208% 913% 808%
191% 002% 240% 356% 615% 304% 784% 101% 385% 779% 481% 805% 532% 973% 092% 741% 510% 606% 888% 510% 847% 886% 494% 314% 117% 830% 461%
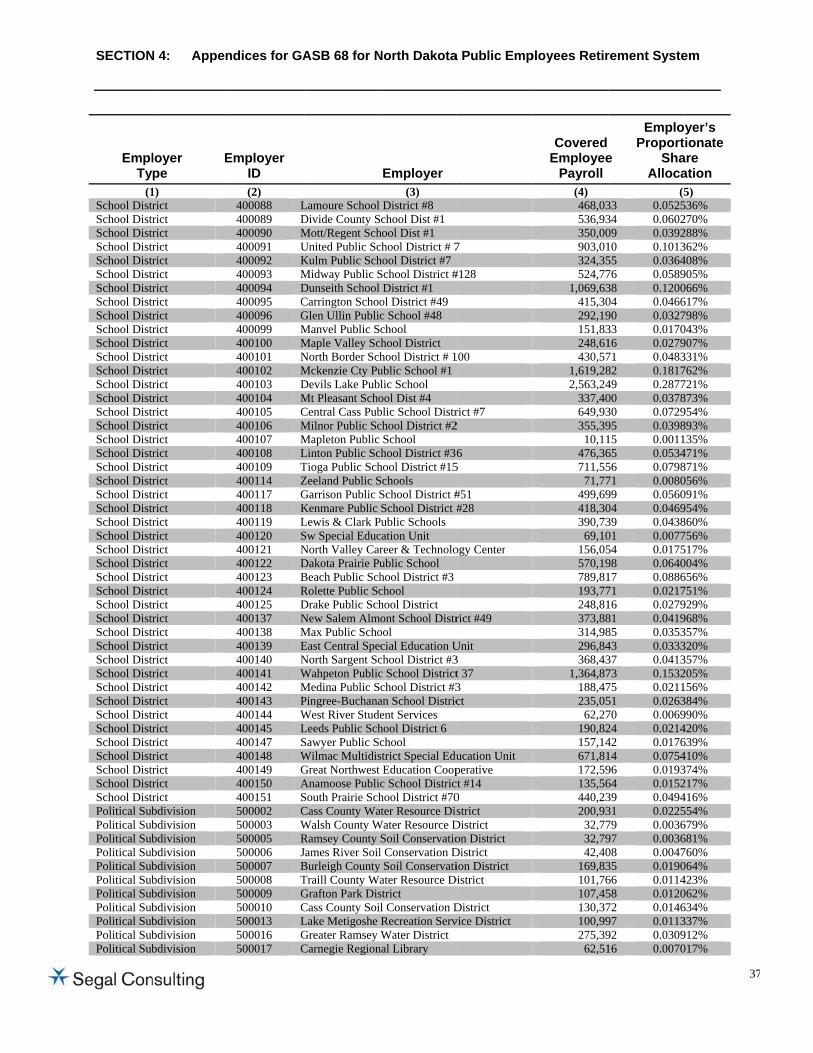
SECTION
EmplTy
(1School DistSchool DistSchool DistSchool DistSchool DistSchool DistSchool DistSchool DistSchool DistSchool DistSchool DistSchool DistSchool DistSchool DistSchool DistSchool DistSchool DistSchool DistSchool DistSchool DistSchool DistSchool DistSchool DistSchool DistSchool DistSchool DistSchool DistSchool DistSchool DistSchool DistSchool DistSchool DistSchool DistSchool DistSchool DistSchool DistSchool DistSchool DistSchool DistSchool DistSchool DistSchool DistSchool DistSchool DistPolitical SubPolitical SubPolitical SubPolitical SubPolitical SubPolitical SubPolitical SubPolitical SubPolitical SubPolitical SubPolitical Sub
N 4: Appen
loyer pe
E
1) rict rict rict rict rict rict rict rict rict rict rict rict rict rict rict rict rict rict rict rict rict rict rict rict rict rict rict rict rict rict rict rict rict rict rict rict rict rict rict rict rict rict rict rict bdivision bdivision bdivision bdivision bdivision bdivision bdivision bdivision bdivision bdivision bdivision
ndices for GA
Employer ID (2)
400088 L400089 D400090 M400091 U400092 K400093 M400094 D400095 C400096 G400099 M400100 M400101 N400102 M400103 D400104 M400105 C400106 M400107 M400108 L400109 T400114 Z400117 G400118 K400119 L400120 S400121 N400122 D400123 B400124 R400125 D400137 N400138 M400139 E400140 N400141 W400142 M400143 P400144 W400145 L400147 S400148 W400149 G400150 A400151 S500002 C500003 W500005 R500006 J500007 B500008 T500009 G500010 C500013 L500016 G500017 C
ASB 68 for N
Lamoure School Divide County SMott/Regent SchUnited Public ScKulm Public SchMidway Public SDunseith School Carrington SchooGlen Ullin PublicManvel Public SMaple Valley ScNorth Border SchMckenzie Cty PuDevils Lake PubMt Pleasant SchoCentral Cass PubMilnor Public ScMapleton Public Linton Public ScTioga Public SchZeeland Public SGarrison Public SKenmare Public Lewis & Clark PSw Special EducNorth Valley CarDakota Prairie PuBeach Public SchRolette Public ScDrake Public SchNew Salem AlmMax Public SchoEast Central SpeNorth Sargent ScWahpeton PublicMedina Public SPingree-BuchanaWest River StudeLeeds Public SchSawyer Public ScWilmac MultidisGreat Northwest Anamoose PublicSouth Prairie SchCass County WaWalsh County WRamsey County James River SoilBurleigh CountyTraill County WaGrafton Park DisCass County SoiLake Metigoshe Greater Ramsey Carnegie Region
North Dakota
Employer (3)
District #8 chool Dist #1
hool Dist #1 chool District # 7hool District #7School District #
District #1 ol District #49 c School #48 chool hool District hool District # 1ublic School #1lic School ool Dist #4 blic School Distrchool District #2
School hool District #3
hool District #15Schools School District #School District #
Public Schools cation Unit reer & Technoloublic School hool District #3chool hool District ont School Distr
ool cial Education Uchool District #3c School Districtchool District #3an School Districent Services hool District 6 chool strict Special EduEducation Coopc School Districhool District #70ater Resource Di
Water Resource DSoil Conservatiol Conservation D Soil Conservatiater Resource Dstrict l Conservation DRecreation ServWater District
nal Library
a Public Emp
7
#128
100
rict #7 2
6 5
#51 #28
ogy Center
rict #49
Unit 3 t 37 3 ct
ucation Unit perative ct #14 0 strict
District on District District ion District
District
District vice District
ployees Retir
Covered Employee
Payroll (4) 468,03536,93350,00903,01324,35524,77
1,069,63415,30292,19151,83248,61430,57
1,619,282,563,24
337,40649,93355,39
10,11476,36711,55
71,77499,69418,30390,73
69,10156,05570,19789,81193,77248,81373,88314,98296,84368,43
1,364,87188,47235,05
62,27190,82157,14671,81172,59135,56440,23200,93
32,7732,7942,40
169,83101,76107,45130,37100,99275,39
62,51
rement Syste
e
EmploProport
ShaAlloca
(533 0.052534 0.060209 0.039210 0.101355 0.036476 0.058938 0.120004 0.046690 0.032733 0.017016 0.027971 0.048382 0.181749 0.287700 0.037830 0.072995 0.039815 0.001165 0.053456 0.079871 0.008099 0.056004 0.046939 0.043801 0.007754 0.017598 0.064017 0.088671 0.021716 0.027981 0.041985 0.035343 0.033337 0.041373 0.153275 0.021151 0.026370 0.006924 0.021442 0.017614 0.075496 0.019364 0.015239 0.049431 0.022579 0.003697 0.003608 0.004735 0.019066 0.011458 0.012072 0.014697 0.011392 0.030916 0.0070
em
37
yer’s ionate
are ation 5)
536% 270% 288% 362% 408% 905% 066% 617% 798% 043% 907% 331% 762% 721% 873% 954% 893% 135% 471% 871% 056% 091% 954% 860% 756% 517% 004% 656% 751% 929% 968% 357% 320% 357% 205% 156% 384% 990% 420% 639% 410% 374% 217% 416% 554% 679% 681% 760% 064% 423% 062% 634% 337% 912% 017%

SECTION
EmplTy
(1Political SubPolitical SubPolitical SubPolitical SubPolitical SubPolitical SubPolitical SubPolitical SubPolitical SubPolitical SubPolitical SubPolitical SubPolitical SubPolitical SubPolitical SubPolitical SubPolitical SubPolitical SubPolitical SubPolitical Sub
Political SubPolitical SubPolitical SubPolitical Sub
Political SubPolitical SubPolitical SubPolitical SubPolitical Sub
Political SubPolitical SubPolitical SubPolitical SubPolitical SubPolitical Sub
Political SubPolitical SubPolitical SubPolitical SubSchool DistSchool Dist
Political SubPolitical SubPolitical SubPolitical Sub
N 4: Appen
loyer pe
E
1) bdivision bdivision bdivision bdivision bdivision bdivision bdivision bdivision bdivision bdivision bdivision bdivision bdivision bdivision bdivision bdivision bdivision bdivision bdivision bdivision
bdivision bdivision bdivision bdivision
bdivision bdivision bdivision bdivision bdivision
bdivision bdivision bdivision bdivision bdivision bdivision
bdivision bdivision bdivision bdivision rict rict
bdivision bdivision bdivision bdivision
ndices for GA
Employer ID (2)
500018 G500019 R500022 C500023 W500024 W500025 B500028 W500030 M500031 C500033 R500038 J500039 P500040 F500041 B500045 D500047 M500049 W500053 S500054 G500055 S
C500056 C500057 B500059 T500060 D
B500061 W500063 S500068 B500072 W500080 W
D500081 R500082 G500084 R500085 J500091 R500107 G
P500108 N500109 J500110 G500111 M500113 L500114 R
(500116 W500117 R500120 T500121 D
T
ASB 68 for N
Griggs County PR & T Water SupConsolidated WaWalsh County HWilliams CountyBowman City PaWilliston HousinMinot Rural FireCentral Plains WRansom County Jamestown RegioPierce County SoFargo Park DistrBismarck Rural FDunseith CommuMercer County SWest Fargo ParkStutsman CountyGrand Forks CouSoutheast RegionCenter Cavalier County Barnes County STraill Rural WateDevils Lake BasiBoard Ward County WaSouthwest WaterBurleigh CountyWatford City ParWestern & CentrDistrict Ramsey County HGrand Forks PubRolette County SJamestown ParksRamsey County WGrand Forks-E GPlanning North Dakota FirJames River VallGrand Forks ParkMcintosh CountyLonetree SpecialRoughrider EducRESP)
Western Area WRed River Joint WTri-Cities Joint JDevils Lake ParkTotal allocation
North Dakota
Employer (3)
Public Library pply Commerce aste Ltd
Housing Authorityy Soil Conservatark Board ng Authority e Department
Water District Soil Cons Distonal Airport oil Conservationict Fire Protection unity Nursing HSoil Conservationk District y Housing Authounty Water Reson Career & Tech
Job DevelopmeSoil Conservationer District in Joint Water R
ater Resource Dr Authority Council On Agrk District ral Stark Soil Co
Housing Authorblic Library Soil Conservations And RecreationWater Resource
Grand Forks Met
refighters Assocley Library Systk District y Housing Authol Education Unitcation Services P
Water Supply AutWater Resource Job Developmenk Board
a Public Emp
Authority
ty tion District
n District
Home n District
ority ource District hnology
ent Authority n District
Resource
District
ging
onservation
rity
n District n District
e District tropolitan
ciation tem
ority t Program
thority District
nt Authority
ployees Retir
Covered Employee
Payroll (4)
30,99415,89125,56
29,3827,3878,43
368,6171,90
180,4684,25
135,71
1,980,86354,80862,76100,88858,50
80,3055,6490,49
43,20104,32
37,7345,76
33,462,161,93
502,28125,63
92,03
192,54522,75
28,80119,82
16,83231,41
174,68246,89
1,452,4435,0765,8340,03
810,41
85,68122,24
$890,878,67
rement Syste
e
EmploProport
ShaAlloca
(596 0.003495 0.046664 0.014088 0.003280 0.003039 0.008819 0.041304 0.008065 0.020254 0.009413 0.0152
0 0.000066 0.222308 0.039861 0.096880 0.011306 0.096302 0.009044 0.006295 0.0101
00 0.004821 0.011730 0.004264 0.0051
61 0.003734 0.242688 0.056339 0.014130 0.0103
40 0.021655 0.058600 0.003221 0.013436 0.001815 0.0259
89 0.019691 0.027745 0.163070 0.003936 0.007330 0.0044
15 0.09090 0.0000
89 0.009642 0.013779 99.9999
em
38
yer’s ionate
are ation 5)
479% 684% 094% 299% 073% 805% 377% 071% 257% 457% 234% 000% 350% 827% 844% 324% 366% 014% 246% 158%
849% 710% 235% 137%
756% 674% 381% 103% 330%
612% 679% 233% 450% 890% 976%
609% 713% 035% 937% 390% 493%
968% 000% 618% 722% 999%

SECTION
APPENDScheduleJudges S
EmployeType
(1) State of ND
N 4: Appen
IX A e of EmployeSystem
er EmployeID (2)
D 018000
ndices for GA
er Allocations
er
0 ND SupreTotal allo
ASB 68 for N
s as of June
Employer(3)
eme Court ocation
North Dakota
30, 2015
r
a Public Emp
CoveEmplo
Payr(4)
$6,746$6,746
ployees Retir
ered oyee roll
Pro
) 6,660 6,660
rement Syste
Employer’soportionate S
Allocation(5)
100.000000%100.000000%
em
39
s Share

SECTION
APPENDScheduleNational
EmployeType
(1) State of ND
N 4: Appen
IX A e of EmployeGuard Syste
er EmployeID (2)
D 054000
ndices for GA
er Allocationsem
er
0 National GTotal allo
ASB 68 for N
s as of June
Employer(3)
Guard ocation
North Dakota
30, 2015
r
a Public Emp
CoveEmplo
Payr(4)
$629 $629
ployees Retir
ered oyee roll
Pro
) 9,811 9,811
rement Syste
Employer’soportionate S
Allocation(5)
100.000000%100.000000%
em
40
s Share

SECTION
APPENDScheduleLaw Enfo
EmployeType
(1) State City City City City City City City County County County County County County County County County County County
* Allocatiosince em
N 4: Appen
IX A e of Employeorcement Sys
er EmployeID (2)
012500200010200016200028200029200030200070200103300001300003300006300013300020300027300028300044300045300051300053
on for Law Enfomployers for this
ndices for GA
er Allocationsstem with Pr
er
0 Attorney G0 City Of C6 City Of E8 City Of T9 City Of W0 City Of B0 City Of Po3 City Of B Adams Co
3 Benson C6 Bowman 3 Dunn Cou0 Griggs Co7 Mckenzie8 Mclean C4 Slope Cou5 Stark Cou Ward Cou
3 Williams Total allo
orcement Systes Plan are cont
ASB 68 for N
s as of June rior Main Ser
Employer(3)
General's OfficCavalier
llendale hompson
Williston owman owers Lake urlington ounty ounty County unty ounty e County ounty unty unty unty County
ocation
em with Prior Mtributing at var
North Dakota
30, 2015 rvice
r
ce
Main Service is ious rates.
a Public Emp
Estima2015-2
Contribu(4)
$ 259104
217171169
1519871091609
99209296
$1,437
based on estim
ployees Retir
ated 2016 utions*
Pro
) 9,530 0,098 4,883
0 7,272 7,707 ,163
6,868 9,804 5,687 9,286 7,182 0,517 ,909
0,974 9,918 9,169 9,551 6,278 7,796
mated 2015-20
rement Syste
Employer’soportionate S
Allocation(5)
18.050544%0.702325%0.339617%0.000000%
15.111462%1.231538%0.776397%0.477676%0.681877%1.091045%1.341359%6.063586%0.731467%6.392353%4.240796%0.689806%6.897293%
14.574460%20.606400%
100.000001%
016 contribution
em
41
s Share
%
ns

SECTION
APPENDScheduleLaw Enfo
EmployeType
(1) City City County County County
5424332v1/0
N 4: Appen
IX A e of Employeorcement Sys
er EmployeID (2)
200097 200118 300002 300030 300040
01640.001
ndices for GA
er Allocationsstem withou
er
City Of DCity of BeBarnes CoMorton CRolette CoTotal allo
ASB 68 for N
s as of June t Prior Main
Employer(3)
Devils Lake erthold ounty ounty ounty ocation
North Dakota
30, 2015 Service
r
a Public Emp
CoveEmployee
(4) $ 631
51682
1,753656
$3,776
ployees Retir
red e Payroll
Pro
) ,083 ,896
2,966 3,650 6,982 6,577
rement Syste
Employer’soportionate S
Allocation(5)
16.710450%1.374154%
18.084260%46.434907%17.396229%
100.000000%
em
42
s Share
% % % % % %

SECT
APPEScheMain
Employe
ID (1)
101001080011000
11200
11700118001200012500127001300014000
160001800018800
19000
19200
2010020200
21500
22300
TION 4: Appe
ENDIX B edule of Pension
System
p-er
Employ) (2) 0 Governor's Offic0 Secretary Of Stat0 Office Of Manag
Budget 0 Information Tech
Dept 0 State Auditor's O0 Central Services 0 State Treasurer's 0 Attorney General0 Tax Department 0 Facility Managem0 Office Of Admin
Hearings 0 Legislative Coun0 ND Supreme Cou0 Commission On
Counsel For Indi0 Retirement & Inv
Office 0 ND Public Emplo
Retirement Syste0 Public Instruction0 Education Standa
Practice 0 ND University Sy
Office 0 ND Youth Correc
Center
ndices for GASB
n Amounts by Em
yer
EmployPropotionaShar
Allocat(3)
e 0.1068te 0.1287gement & 0.2750
hnology 2.3624
Office 0.35690.1293
Office 0.0353l's Office 1.0811
0.7086ment 0.2328nistrative 0.0283
ncil 0.2094urt 1.9213Legal gents
0.2035
vestment 0.1455
oyees em
0.1783
n 0.5422ards & 0.0437
ystem 0.0644
ctional 0.3399
B 68 for North D
mployer as of Ju
yer's or-
ate re tion
Net Pension Liability
(4) 801% $726,229 798% 875,804 094% 1,870,592
485% 16,064,495
906% 2,426,900 321% 879,361 378% 240,564 149% 7,351,629 627% 4,818,543 891% 1,583,619 390% 193,047
490% 1,424,496 385% 13,065,090 557% 1,384,153
546% 989,688
330% 1,212,614
201% 3,686,874 707% 297,200
421% 438,052
980% 2,311,806
Dakota Public Em
une 30, 2015
Covered
Employee Payroll
1%
(5) $951,471 1,147,438 2,450,754
21,046,878
3,179,602 1,152,091 315,179 9,631,728 6,313,008 2,074,772 252,919
1,866,299 17,117,210 1,813,448
1,296,638
1,588,706
4,830,349 389,376
573,917
3,028,808
mployees Retirem
Discount Rat
% Decrease (7.00%)
CurDisc
Rate (8(6) (7
$1,113,635 $71,343,002 82,868,460 1,8
24,634,099 16,0
3,721,529 2,41,348,456 8
368,893 2 11,273,355 7,3
7,388,994 4,82,428,401 1,5
296,028 1
2,184,394 1,4 20,034,662 13,0
2,122,529 1,3
1,517,637 9
1,859,482 1,2
5,653,637 3,6455,742 2
671,731 4
3,545,039 2,3
ment System
te Sensitivity
rent ount 8.00%)
1% Increas(9.00%)
7) (8) 726,229 $409,2875,804 493,5870,592 1,054,1
064,495 9,053,0
426,900 1,367,6879,361 495,5240,564 135,5351,629 4,142,9818,543 2,715,4583,619 892,4193,047 108,7
424,496 802,7065,090 7,362,7384,153 780,0
989,688 557,7
212,614 683,3
686,874 2,077,7297,200 167,4
438,052 246,8
311,806 1,302,7
se Statutory Required Contrib
(9) 260 $72,272 552 87,157
56 186,154
010 1,598,679
659 241,516 556 87,511 568 23,940 948 731,607 449 479,523 435 157,596 790 19,211
763 141,761 721 1,300,189 028 137,746
730 98,490
58 120,675
707 366,904 485 29,576
860 43,593
799 230,062
Schedule of Con
Contribs In Relation to
the Statutory Required Contrib
CoDefic
(Ex(10) ($(69,440)
(93,771) (185,172)
(1,568,621)
(246,821) (86,183) (28,245)
(694,460) (493,543) (155,862)
(18,369)
(134,619) (1,304,666)
(146,506)
(94,272)
(125,656)
(355,159) (27,724)
(46,186)
(227,677)
ntributions
ontrib ciency/
xcess)
Contribas a
Percentaof CoverEmploye
Payroll(11) (12)
$2,832 7.6 (6,614) 7.6
982 7.6
30,058 7.6
(5,305) 7.61,328 7.6
(4,305) 7.637,147 7.6
(14,020) 7.61,734 7.6
842 7.6
7,142 7.6 (4,477) 7.6 (8,760) 7.6
4,218 7.6
(4,981) 7.6
11,745 7.61,852 7.6
(2,593) 7.6
2,385 7.6
b
ge ed ee l
Propor- tionate
Share of Plan
Pension Expense
(13) 60% $69,228 60% 83,487 60% 178,315
60% 1,531,357
60% 231,346 60% 83,826 60% 22,932 60% 700,798 60% 459,330 60% 150,959 60% 18,402
60% 135,791 60% 1,245,437 60% 131,945
60% 94,343
60% 115,593
60% 351,453 60% 28,331
60% 41,758
60% 220,374
Pension ExpensNet Amortization Deferred Amountfrom Changes in
Proportion and DBetween Employ
Contrib and Proportionate Sha
of Contributions(14) $9,976
(38,889) (17,636)
(115,108)
(33,694) 3,425 (115)
(10,945) (46,582)
(9,713) 493
25,805 (83,411)
4,247
28,542
(29,779)
16,718 (992)
(4,201)
2,277
43
se of ts n
Diff er
are s
Total Employer Pension Expense
(15) $79,204 44,598
160,679
1,416,249
197,652 87,251 22,817
689,853 412,748 141,246
18,895
161,596 1,162,026
136,192
122,885
85,814
368,171 27,339
37,557
222,651

SECT
Employe
ID (1)
22400226002270022800229002300023500
2380023900240002410024200
2500025200
253002610027000
3010030500
31000
31200
313003160032100
TION 4: Appe
p-er
Employ) (2) 0 Juvenile Services0 Land Department0 Bismarck State C0 Lake Region Stat0 Williston State C0 University Of No0 North Dakota Sta
University 0 ND St College O0 Dickinson State U0 Mayville State U0 Minot State Univ0 Valley City State
University 0 ND State Library0 SCHOOL FOR T
DEAF 0 School For The B0 ND Board Of Nu0 Career & Technic
Education 0 ND Department O0 Tobacco
Prevention/ContrCommittee
0 Life Skills and TrCenter
0 North Dakota StaHospital
0 ND Veterans Hom0 Indian Affairs Co0 Veterans Affairs
Department
ndices for GASB
yer
EmployPropotionaShar
Allocat(3)
s - DOCR 0.1541t 0.1757
College 0.4433te College 0.2088
College 0.1258orth Dakota 4.5077ate 3.5380
Of Science 0.6224University 0.2822
University 0.2950versity 0.6112e 0.2019
y 0.1358THE 0.1131
Blind 0.0629ursing 0.0369cal 0.1049
Of Health 1.9758
rol 0.0627
ransition 1.4348
ate 1.9750
me 0.4864ommission 0.0314
0.0365
B 68 for North D
yer's or-
ate re tion
Net Pension Liability
(4) 140% 1,048,126 799% 1,195,403 343% 3,014,657 868% 1,420,267 894% 856,058 739% 30,651,856 041% 24,058,075
450% 4,232,554 217% 1,919,027 012% 2,006,031 275% 4,156,566 918% 1,373,008
839% 923,682 120% 769,197
925% 427,879 936% 251,158 933% 713,526
827% 13,435,286 771% 426,832
830% 9,756,599
058% 13,430,057
499% 3,308,110 409% 213,576 553% 248,554
Dakota Public Em
Covered
Employee Payroll
1%
(5) 1,373,196 1,566,160 3,949,651 1,860,763 1,121,559 40,158,483 31,519,654
5,545,270 2,514,213 2,628,196 5,445,718 1,798,841
1,210,162 1,007,758
560,588 329,053 934,825
17,602,223 559,215
12,782,594
17,595,368
4,334,115 279,812 325,647
mployees Retirem
Discount Rat
% Decrease (7.00%)
CurDisc
Rate (8(6) (71,607,248 1,01,833,091 1,14,622,825 3,02,177,908 1,41,312,722 8
47,003,087 30,6 36,891,854 24,0
6,490,409 4,22,942,733 1,93,076,149 2,06,373,885 4,12,105,439 1,3
1,416,420 91,179,525 7
656,131 4385,139 2
1,094,157 7
20,602,339 13,4654,526 4
14,961,256 9,7
20,594,321 13,4
5,072,821 3,3327,508 2381,145 2
ment System
te Sensitivity
rent ount 8.00%)
1% Increas(9.00%)
7) (8) 048,126 590,6195,403 673,6014,657 1,698,8420,267 800,3856,058 482,4651,856 17,273,5058,075 13,557,7
232,554 2,385,2919,027 1,081,4006,031 1,130,4156,566 2,342,3373,008 773,7
923,682 520,5769,197 433,4
427,879 241,1251,158 141,5713,526 402,1
435,286 7,571,3426,832 240,5
756,599 5,498,2
430,057 7,568,3
308,110 1,864,2213,576 120,3248,554 140,0
se Statutory Required Contrib
(9) 662 104,306 659 118,962 884 300,007
79 141,340 424 85,192 593 3,050,359 724 2,394,170
220 421,208 452 190,974 482 199,633
97 413,646 747 136,637
533 91,921 474 76,548
28 42,581 538 24,994
02 71,008
42 1,337,030 538 42,477
249 970,940
95 1,336,509
257 329,211 59 21,254
071 24,735
Schedule of Con
Contribs In Relation to
the Statutory Required Contrib
CoDefic
(Ex(10) ((109,039) (120,630) (285,523) (143,210)
(91,674) (3,007,897) (2,330,536)
(411,459) (185,481) (190,621) (410,922) (133,028)
(87,798) (83,073)
(48,677) (23,429)
(108,011)
(1,319,409) (35,709)
(963,229)
(1,391,450)
(329,727) (21,325) (24,898)
ntributions
ontrib ciency/
xcess)
Contribas a
Percentaof CoverEmploye
Payroll(11) (12) (4,733) 7.6 (1,668) 7.614,484 7.6
(1,870) 7.6 (6,482) 7.642,462 7.663,634 7.6
9,749 7.65,493 7.69,012 7.62,724 7.63,609 7.6
4,123 7.6 (6,525) 7.6
(6,096) 7.61,565 7.6
(37,003) 7.6
17,621 7.66,768 7.6
7,711 7.6
(54,941) 7.6
(516) 7.6 (71) 7.6
(163) 7.6
b
ge ed ee l
Propor- tionate
Share of Plan
Pension Expense
(13) 60% 99,913 60% 113,953 60% 287,374 60% 135,388 60% 81,604 60% 2,921,906 60% 2,293,350
60% 403,471 60% 182,932 60% 191,226 60% 396,227 60% 130,883
60% 88,051 60% 73,324
60% 40,788 60% 23,942 60% 68,017
60% 1,280,726 60% 40,688
60% 930,053
60% 1,280,228
60% 315,348 60% 20,359 60% 23,694
Pension ExpensNet Amortization Deferred Amountfrom Changes in
Proportion and DBetween Employ
Contrib and Proportionate Sha
of Contributions(14) (6,539)
(263) 18,165 (3,944)
557 (166,700)
(61,336)
(40,270) 14,169 35,003
(18,142) 11,913
(2,735) (20,962)
(19,415) 4,070
(55,557)
(7,772) 36,867
1,095
(59,240)
2,964 (880)
1,064
44
se of ts n
Diff er
are s
Total Employer Pension Expense
(15) 93,374
113,690 305,539 131,444
82,161 2,755,206 2,232,014
363,201 197,101 226,229 378,085 142,796
85,316 52,362
21,373 28,012 12,460
1,272,954 77,555
931,148
1,220,988
318,312 19,479 24,758

SECT
Employe
ID (1)
32500
36000
38000401004050040600408004120041300
4140042600
42700
4280047100472004730047500
48500
502005040051700
51800
5190052000
TION 4: Appe
p-er
Employ) (2) 0 Department Of H
Services 0 Protection & Adv
Project 0 Job Service North0 Insurance Depart0 Industrial Comm0 ND Department O0 Public Service Co0 Aeronautics Com0 Department Of F
Institutions 0 ND Securities De0 State Board Of L
Examiners 0 ND State Board O
Cosmetology 0 ND State Plumbi0 Bank Of North D0 Public Finance A0 Housing Finance0 Mill & Elevator
Association 0 Workforce Safety
Insurance 0 Field Services Di0 Highway Patrol 0 Department Of C
Transitional Serv0 James River Corr
Ctr 0 State Penitentiary0 Rough Rider Indu
ndices for GASB
yer
EmployPropotionaShar
Allocat(3)
Human 7.1050
vocacy 0.1820
h Dakota 1.0989tment 0.2329
mission 0.6577Of Labor 0.0538ommission 0.3076
mmission 0.0360inancial 0.2249
epartment 0.0588Law 0.0379
Of 0.0065
ing Board 0.0336Dakota 0.9954Authority 0.0178
Agency 0.24340.8679
y & 0.9239
ivision 0.66450.2068
Corrections vices
0.1961
rectional 0.6775
y 0.9877ustries 0.1523
B 68 for North D
yer's or-
ate re tion
Net Pension Liability
(4) 085% 48,313,365
045% 1,237,875
960% 7,472,740 990% 1,584,292 735% 4,472,486 875% 366,341 651% 2,091,974 020% 244,930 938% 1,529,540
875% 400,340 996% 258,366
593% 44,831
649% 228,807 461% 6,768,965 889% 121,642 446% 1,655,391 931% 5,901,783
906% 6,282,403
538% 4,518,745 868% 1,406,667 154% 1,333,814
508% 4,606,939
727% 6,716,375 342% 1,035,900
Dakota Public Em
Covered
Employee Payroll
1%
(5) 63,297,691
1,621,799
9,790,399 2,075,662 5,859,625 479,959 2,740,794 320,891 2,003,928
524,503 338,494
58,739
299,776 8,868,349 159,372 2,168,806 7,732,208
8,230,886
5,920,223 1,842,947 1,747,493
6,035,770
8,799,453 1,357,181
mployees Retirem
Discount Rat
% Decrease (7.00%)
CurDisc
Rate (8(6) (7
74,086,127 48,3
1,898,219 1,2
11,459,073 7,42,429,433 1,56,858,333 4,4
561,765 33,207,938 2,0
375,588 22,345,473 1,5
613,901 4396,192 2
68,747
350,865 2 10,379,869 6,7
186,532 12,538,460 1,69,050,088 5,9
9,633,751 6,2
6,929,269 4,52,157,054 1,42,045,337 1,3
7,064,510 4,6
10,299,225 6,71,588,500 1,0
ment System
te Sensitivity
rent ount 8.00%)
1% Increas(9.00%)
7) (8) 313,365 27,226,5
237,875 697,5
472,740 4,211,1584,292 892,8472,486 2,520,4366,341 206,4091,974 1,178,9244,930 138,0529,540 861,9
400,340 225,6258,366 145,6
44,831 25,2
228,807 128,9768,965 3,814,5121,642 68,5655,391 932,8901,783 3,325,8
282,403 3,540,3
518,745 2,546,5406,667 792,7333,814 751,6
606,939 2,596,2
716,375 3,784,9035,900 583,7
se Statutory Required Contrib
(9) 587 4,807,967
594 123,189
99 743,659 814 157,663 431 445,085 448 36,457 914 208,186 028 24,375 959 152,214
608 39,840 600 25,712
264 4,461
942 22,770 593 673,622 550 12,105 882 164,738 899 587,323
95 625,201
500 449,689 715 139,986 659 132,736
201 458,465
956 668,389 772 103,089
Schedule of Con
Contribs In Relation to
the Statutory Required Contrib
CoDefic
(Ex(10) (
(4,818,127)
(118,979)
(742,673) (155,261) (425,962)
(38,385) (202,111)
(23,117) (149,939)
(34,984) (7,772)
(4,182)
(21,344) (660,183)
(11,348) (161,685) (560,143)
(617,554)
(433,917) (136,959) (143,059)
(484,144)
(717,961) (102,131)
ntributions
ontrib ciency/
xcess)
Contribas a
Percentaof CoverEmploye
Payroll(11) (12)(10,160) 7.6
4,210 7.6
986 7.62,402 7.6
19,123 7.6 (1,928) 7.6
6,075 7.61,258 7.62,275 7.6
4,856 7.617,940 7.6
279 7.6
1,426 7.613,439 7.6
757 7.63,053 7.6
27,180 7.6
7,647 7.6
15,772 7.63,027 7.6
(10,323) 7.6
(25,679) 7.6
(49,572) 7.6 958 7.6
b
ge ed ee l
Propor- tionate
Share of Plan
Pension Expense
(13) 60% 4,605,500
60% 118,001
60% 712,343 60% 151,024 60% 426,342 60% 34,922 60% 199,419 60% 23,348 60% 145,804
60% 38,163 60% 24,629
60% 4,274
60% 21,811 60% 645,256 60% 11,596 60% 157,801 60% 562,591
60% 598,874
60% 430,752 60% 134,091 60% 127,147
60% 439,159
60% 640,242 60% 98,748
Pension ExpensNet Amortization Deferred Amountfrom Changes in
Proportion and DBetween Employ
Contrib and Proportionate Sha
of Contributions(14)
(174,987)
(5,632)
(80,739) 5,426
23,185 1,408
(7,442) 13,214
7,308
5,056 (2,564)
(100)
(1,046) 12,007
164 (12,019) 58,310
(18,621)
(26,008) (27,451) (22,646)
(55,717)
(31,329) (15,815)
45
se of ts n
Diff er
are s
Total Employer Pension Expense
(15) 4,430,513
112,369
631,604 156,450 449,527
36,330 191,977
36,562 153,112
43,219 22,065
4,174
20,765 657,263
11,760 145,782 620,901
580,253
404,744 106,640 104,501
383,442
608,913 82,933

SECT
Employe
ID (1)
53000
54000
601006020060700608006110061400
61600624006250062600665006700070100709007200075000
7700080100
90000
90100
902009060090900
TION 4: Appe
p-er
Employ) (2) 0 Department Of C
And Rehabilitatio0 Adjutant General
National Guard 0 Department Of C0 Dept Of Agricult0 Milk Marketing B0 ND Oilseed Coun0 ND Soybean Cou0 ND Corn Utilizat
Council 0 State Seed Depar0 Beef Commission0 ND Wheat Comm0 ND Barley Coun0 State Fair Associ0 Racing Commiss0 Historical Society0 ND Council On T0 Game & Fish De0 Parks & Recreati
Department 0 Water Commissio0 Department Of
Transportation 0 ND State Board O
Accountancy 0 Board Of Medica
Examiners 0 Board Of Pharma0 Real Estate Comm0 Electrical Board
ndices for GASB
yer
EmployPropotionaShar
Allocat(3)
Corrections on
0.7039
l ND 1.0405
Commerce 0.3667ture 0.3985Board 0.0211ncil 0.0002uncil 0.0416tion 0.0124
rtment 0.1231n 0.0134mission 0.0438cil 0.0134iation 0.1035sion 0.0138y 0.3791The Arts 0.0317partment 1.0404ion 0.3271
on 0.63306.7461
Of 0.0032
al 0.0187
acy 0.0235mission 0.0138
0.1539
B 68 for North D
yer's or-
ate re tion
Net Pension Liability
(4) 901% 4,786,407
572% 7,075,712
765% 2,493,939 595% 2,710,378 136% 143,721 281% 1,911 685% 283,451 441% 84,597
146% 837,372 468% 91,580 851% 298,179 470% 91,594 567% 704,238 834% 94,069 119% 2,577,944 788% 216,153 418% 7,074,665 142% 2,224,510
007% 4,304,340 179% 45,872,865
271% 22,242
722% 127,306
578% 160,326 815% 93,940 933% 1,046,718
Dakota Public Em
Covered
Employee Payroll
1%
(5) 6,270,908
9,270,237
3,267,429 3,551,002 188,292 2,500 371,364 110,831
1,097,082 119,981 390,658 120,000 922,657 123,240 3,377,494 283,195 9,268,866 2,914,434
5,639,328 60,100,270
29,138
166,788
210,048 123,076 1,371,360
mployees Retirem
Discount Rat
% Decrease (7.00%)
CurDisc
Rate (8(6) (77,339,715 4,7
10,850,250 7,0
3,824,331 2,44,156,229 2,7
220,389 1 2,930
434,658 2129,725
1,284,068 8140,434 457,243 2140,454
1,079,914 7144,250
3,953,149 2,5331,460 2
10,848,644 7,03,411,174 2,2
6,600,489 4,3 70,343,743 45,8
34,107
195,218 1
245,852 1144,052
1,605,090 1,0
ment System
te Sensitivity
rent ount 8.00%)
1% Increas(9.00%)
7) (8) 786,407 2,697,3
075,712 3,987,4
493,939 1,405,4710,378 1,527,4143,721 80,9
1,911 1,0283,451 159,7 84,597 47,6
837,372 471,8 91,580 51,6298,179 168,0 91,594 51,6704,238 396,8 94,069 53,0577,944 1,452,7216,153 121,8074,665 3,986,8224,510 1,253,6
304,340 2,425,6872,865 25,851,2
22,242 12,5
127,306 71,7
160,326 90,3 93,940 52,9046,718 589,8
se Statutory Required Contrib
(9) 39 476,325
457 704,149
438 248,188 410 269,727 993 14,303 077 190 736 28,208 674 8,419
894 83,332 609 9,114 036 29,674 617 9,115 867 70,083 012 9,361 779 256,547 811 21,511 867 704,044 604 221,375
674 428,352 264 4,565,097
534 2,213
742 12,669
51 15,955 939 9,349 869 104,165
Schedule of Con
Contribs In Relation to
the Statutory Required Contrib
CoDefic
(Ex(10) ((472,881)
(669,680)
(247,693) (271,299)
(13,406) (178)
(26,440) (24,405)
(79,863) (8,543) (29,839) (8,544) (75,526) (8,775)
(253,917) (20,329)
(684,553) (217,254)
(420,116) (4,422,237)
(2,226)
(11,875)
(14,955) (8,763) (97,227)
ntributions
ontrib ciency/
xcess)
Contribas a
Percentaof CoverEmploye
Payroll(11) (12)
3,444 7.6
34,469 7.6
495 7.6 (1,572) 7.6
897 7.612 7.6
1,768 7.6(15,986) 7.6
3,469 7.6 571 7.6
(165) 7.6 571 7.6
(5,443) 7.6 586 7.6
2,630 7.61,182 7.6
19,491 7.64,121 7.6
8,236 7.6142,860 7.6
(13) 7.6
794 7.6
1,000 7.6 586 7.6
6,938 7.6
b
ge ed ee l
Propor- tionate
Share of Plan
Pension Expense
(13) 60% 456,267
60% 674,496
60% 237,736 60% 258,368 60% 13,700 60% 182 60% 27,020 60% 8,064
60% 79,823 60% 8,730 60% 28,424 60% 8,731 60% 67,132 60% 8,967 60% 245,744 60% 20,605 60% 674,397 60% 212,053
60% 410,314 60% 4,372,858
60% 2,120
60% 12,136
60% 15,283 60% 8,955 60% 99,779
Pension ExpensNet Amortization Deferred Amountfrom Changes in
Proportion and DBetween Employ
Contrib and Proportionate Sha
of Contributions(14) 19,346
28,903
(8,344) (7,534)
(729) 345 (82)
(23,138)
6,292 (227)
(5,149) (320)
(7,202) 213
(26,395) (2,041)
(53,451) 7,979
(2,591) (294,153)
4,039
(240)
324 5,443
23,873
46
se of ts n
Diff er
are s
Total Employer Pension Expense
(15) 475,613
703,399
229,392 250,834
12,971 527
26,938 (15,074)
86,115 8,503
23,275 8,411
59,930 9,180
219,349 18,564
620,946 220,032
407,723 4,078,705
6,159
11,896
15,607 14,398
123,652

SECT
Employe
ID (1)
9950
10000
10000
1000010000
10000
10000
10000
10000
10001000
1000
10001000
1000
10001000
100010002
TION 4: Appe
p-er
Employ) (2) 1 ND System Infor
Technology Serv02 McIntosh Distric
Unit 03 Wells County Di
Unit 04 Central Valley H05 Dickey County H
District 06 Emmons County
Health 07 Rolette County P
Health 08 Towner County P
Health Unit 09 Nelson-Griggs D
Health Unit 10 First District Hea11 Lake Region Dist
Health Unit 12 Garrison Diversio
Conservancy Dis13 Upper Missouri H14 Kidder County D
Health Unit 15 Southwestern Dis
Health Unit 17 City-County Hea18 Sargent County D
Health Unit 19 Traill District He21 Cavalier County
Dist
ndices for GASB
yer
EmployPropotionaShar
Allocat(3)
rmation vices
0.1801
t Health 0.0068
st Health 0.0186
Health Unit 0.1038Health 0.0145
Public 0.0122
Public 0.0346
Public 0.0062
District 0.0143
alth Unit 0.2123trict 0.0869
on strict
0.1772
Health Unit 0.0937District 0.0029
strict 0.1339
alth District 0.0576District 0.0092
ealth Unit 0.0174Health 0.0124
B 68 for North D
yer's or-
ate re tion
Net Pension Liability
(4) 146% 1,224,962
859% 46,640
626% 126,654
804% 705,849 590% 99,210
221% 83,101
647% 235,594
288% 42,757
306% 97,278
330% 1,443,808 971% 591,388
216% 1,205,039
729% 637,341 992% 20,345
986% 911,082
669% 392,139 287% 63,150
423% 118,473 405% 84,352
Dakota Public Em
Covered
Employee Payroll
1%
(5) 1,604,885
61,104
165,935
924,766 129,979
108,876
308,664
56,015
127,452
1,891,601 774,809
1,578,782
835,013 26,659
1,193,655
513,763 82,740
155,214 110,511
mployees Retirem
Discount Rat
% Decrease (7.00%)
CurDisc
Rate (8(6) (71,878,418 1,2
71,520
194,217 1
1,082,385 7152,133
127,431
361,271 2
65,566
149,171
2,214,007 1,4906,864 5
1,847,866 1,2
977,331 631,198
1,397,099 9
601,326 396,837
181,673 1129,349
ment System
te Sensitivity
rent ount 8.00%)
1% Increas(9.00%)
7) (8) 224,962 690,3
46,640 26,2
126,654 71,3
705,849 397,7 99,210 55,9
83,101 46,8
235,594 132,7
42,757 24,0
97,278 54,8
443,808 813,6591,388 333,2
205,039 679,0
637,341 359,1 20,345 11,4
911,082 513,4
392,139 220,9 63,150 35,5
118,473 66,7 84,352 47,5
se Statutory Required Contrib
(9) 17 121,904
284 4,641
75 12,604
775 70,244 909 9,873
831 8,270
767 23,445
096 4,255
820 9,681
646 143,682 272 58,853
089 119,921
68 63,426 465 2,025
432 90,667
987 39,024 588 6,284
765 11,790 536 8,394
Schedule of Con
Contribs In Relation to
the Statutory Required Contrib
CoDefic
(Ex(10) ((112,205)
(4,577)
(11,814)
(73,545) (9,610)
(6,927)
(21,460)
(3,988)
(9,075)
(150,067) (56,207)
(118,474)
(68,990) (1,898)
(87,866)
(36,838) (5,891)
(11,051) (7,868)
ntributions
ontrib ciency/
xcess)
Contribas a
Percentaof CoverEmploye
Payroll(11) (12)
9,699 7.6
64 7.6
790 7.6
(3,301) 7.6 263 7.6
1,343 7.6
1,985 7.6
267 7.6
606 7.6
(6,385) 7.62,646 7.6
1,448 7.6
(5,564) 7.6 127 7.6
2,801 7.6
2,186 7.6 393 7.6
739 7.6 526 7.6
b
ge ed ee l
Propor- tionate
Share of Plan
Pension Expense
(13) 60% 116,770
60% 4,446
60% 12,073
60% 67,286 60% 9,457
60% 7,922
60% 22,458
60% 4,076
60% 9,273
60% 137,632 60% 56,374
60% 114,871
60% 60,755 60% 1,939
60% 86,849
60% 37,381 60% 6,020
60% 11,294 60% 8,041
Pension ExpensNet Amortization Deferred Amountfrom Changes in
Proportion and DBetween Employ
Contrib and Proportionate Sha
of Contributions(14) 11,022
668
(4)
(16,437) (2,602)
(429)
1,603
(73)
(68)
(15,431) 3,852
(20,084)
(16,750) (26)
5,517
(1,145) 4,100
(579) (647)
47
se of ts n
Diff er
are s
Total Employer Pension Expense
(15) 127,792
5,114
12,069
50,849 6,855
7,493
24,061
4,003
9,205
122,201 60,226
94,787
44,005 1,913
92,366
36,236 10,120
10,715 7,394

SECT
Employe
ID (1)
10002
100022000020000200002000020000200002000020002000200020002000200020002000200020002200022000220002200022000220002200032000320003200032000320003
TION 4: Appe
p-er
Employ) (2) 22 Walsh County He
District 23 Custer Health Un02 City Of Mcville 03 City Of Drayton 04 City Of Fessende05 City Of Westhop06 City Of Belfield 08 City Of Rolla 09 City of New Tow10 City Of Cavalier 11 City Of Harvey 12 City Of Napoleon14 City Of Grand Fo15 City Of Killdeer 16 City Of Ellendale17 City Of Wishek 18 City Of Granville19 City Of Linton 20 City Of Finley 21 City Of Wilton 22 City Of Ray 25 City Of Medora 26 City of Velva 28 City Of Thompso29 City Of Williston30 City Of Bowman31 City Of Tioga 33 City Of Rhame 35 City Of Fargo 36 City Of Jamestow37 City Of Beach
ndices for GASB
yer
EmployPropotionaShar
Allocat(3)
ealth 0.0311
nit 0.13750.01050.0238
en 0.0042e 0.0159
0.04160.0280
wn 0.07970.05690.0521
n 0.0168orks 1.8372
0.0636e 0.0323
0.0075e 0.0051
0.02370.01010.01460.02800.03170.0126
on 0.0126n 0.9432n 0.0635
0.11060.00362.6117
wn 0.50090.0193
B 68 for North D
yer's or-
ate re tion
Net Pension Liability
(4) 106% 211,515
554% 935,344 527% 71,582 814% 161,931 210% 28,627 905% 108,151 699% 283,546 000% 190,395 743% 542,239 942% 387,196 138% 354,529 853% 114,598 291% 12,493,265 685% 433,047 326% 219,811 559% 51,400 174% 35,182 708% 161,210 132% 68,896 628% 99,468 017% 190,511 759% 215,956 607% 85,725 689% 86,283 285% 6,414,177 534% 432,020 672% 752,551 637% 24,731 792% 17,759,740 908% 3,406,089 326% 131,414
Dakota Public Em
Covered
Employee Payroll
1%
(5) 277,115
1,225,438 93,786 212,150 37,509 141,694 371,489 249,442 710,416 507,286 464,488 150,143 16,368,030 567,353 287,983 67,345 46,091 211,211 90,262 130,320 249,601 282,934 112,317 113,046 8,403,527 566,010 985,949 32,400 23,267,898 4,462,486 172,167
mployees Retirem
Discount Rat
% Decrease (7.00%)
CurDisc
Rate (8(6) (7
324,348 2
1,434,303 9109,767 248,313 143,899
165,845 1434,804 2291,962 1831,496 5593,746 3543,653 3175,730 1
19,157,797 12,4664,056 4337,070 278,819 53,950
247,208 1105,648 152,529 292,139 1331,157 2131,456 132,311
9,835,819 6,4662,482 4
1,153,999 737,924
27,233,672 17,75,223,067 3,4
201,516 1
ment System
te Sensitivity
rent ount 8.00%)
1% Increas(9.00%)
7) (8) 211,515 119,1
935,344 527,1 71,582 40,3161,931 91,2 28,627 16,1108,151 60,9283,546 159,7190,395 107,2542,239 305,5387,196 218,2354,529 199,7114,598 64,5493,265 7,040,4433,047 244,0219,811 123,8 51,400 28,9 35,182 19,8161,210 90,8 68,896 38,8 99,468 56,0190,511 107,3215,956 121,7 85,725 48,3 86,283 48,6414,177 3,614,6432,020 243,4752,551 424,0 24,731 13,9759,740 10,008,3406,089 1,919,4131,414 74,0
se Statutory Required Contrib
(9) 98 21,049
05 93,082 39 7,124
255 16,115 33 2,849
948 10,763 790 28,217 296 18,947 574 53,962 201 38,532 792 35,281 580 11,404 473 1,243,283 040 43,095 873 21,875 966 5,115 827 3,501 849 16,043 826 6,856 054 9,899
61 18,959 700 21,491 10 8,531
624 8,587 655 638,315 461 42,993 094 74,891 937 2,461
51 1,767,383 472 338,961 057 13,078
Schedule of Con
Contribs In Relation to
the Statutory Required Contrib
CoDefic
(Ex(10) (
(19,731)
(98,424) (6,678) (16,769) (4,198) (10,089) (35,154) (21,479) (65,452) (37,111) (34,769) (13,775)
(1,209,361) (41,444) (17,312) (5,462) (3,598) (15,145) (4,516) (8,827) (19,374) (20,145) (10,712) (8,049)
(653,903) (40,300) (78,913) (3,482)
(1,720,379) (333,948)
(12,258)
ntributions
ontrib ciency/
xcess)
Contribas a
Percentaof CoverEmploye
Payroll(11) (12)
1,318 7.6
(5,342) 7.6 446 7.6
(654) 7.6 (1,349) 7.6
674 7.6 (6,937) 7.6 (2,532) 7.6(11,490) 7.6
1,421 7.6 512 7.6
(2,371) 7.633,922 7.6
1,651 7.64,563 7.6(347) 7.6 (97) 7.6 898 7.6
2,340 7.61,073 7.6(415) 7.61,346 7.6
(2,181) 7.6 538 7.6
(15,588) 7.62,693 7.6
(4,022) 7.6 (1,021) 7.647,004 7.6
5,013 7.6 820 7.6
b
ge ed ee l
Propor- tionate
Share of Plan
Pension Expense
(13) 60% 20,163
60% 89,162 60% 6,824 60% 15,436 60% 2,729 60% 10,310 60% 27,029 60% 18,150 60% 51,689 60% 36,910 60% 33,796 60% 10,924 60% 1,190,928 60% 41,280 60% 20,954 60% 4,900 60% 3,354 60% 15,367 60% 6,568 60% 9,482 60% 18,161 60% 20,586 60% 8,172 60% 8,225 60% 611,435 60% 41,183 60% 71,737 60% 2,357 60% 1,692,958 60% 324,687 60% 12,527
Pension ExpensNet Amortization Deferred Amountfrom Changes in
Proportion and DBetween Employ
Contrib and Proportionate Sha
of Contributions(14)
(890)
(8,859) 1,107
(3,582) (2,173)
361 (8,818)
(748) 40,166
646 (3,261) (3,242) 88,910 13,263
355 9,387
188 (2,925) 3,235 5,349 7,251 2,358 (266)
(1,303) 240,803
9,489 29,111 (5,625) 89,399
8,452 6,091
48
se of ts n
Diff er
are s
Total Employer Pension Expense
(15) 19,273
80,303 7,931
11,854 556
10,671 18,211 17,402 91,855 37,556 30,535
7,682 1,279,838
54,543 21,309 14,287
3,542 12,442
9,803 14,831 25,412 22,944
7,906 6,922
852,238 50,672
100,848 (3,268)
1,782,357 333,139
18,618
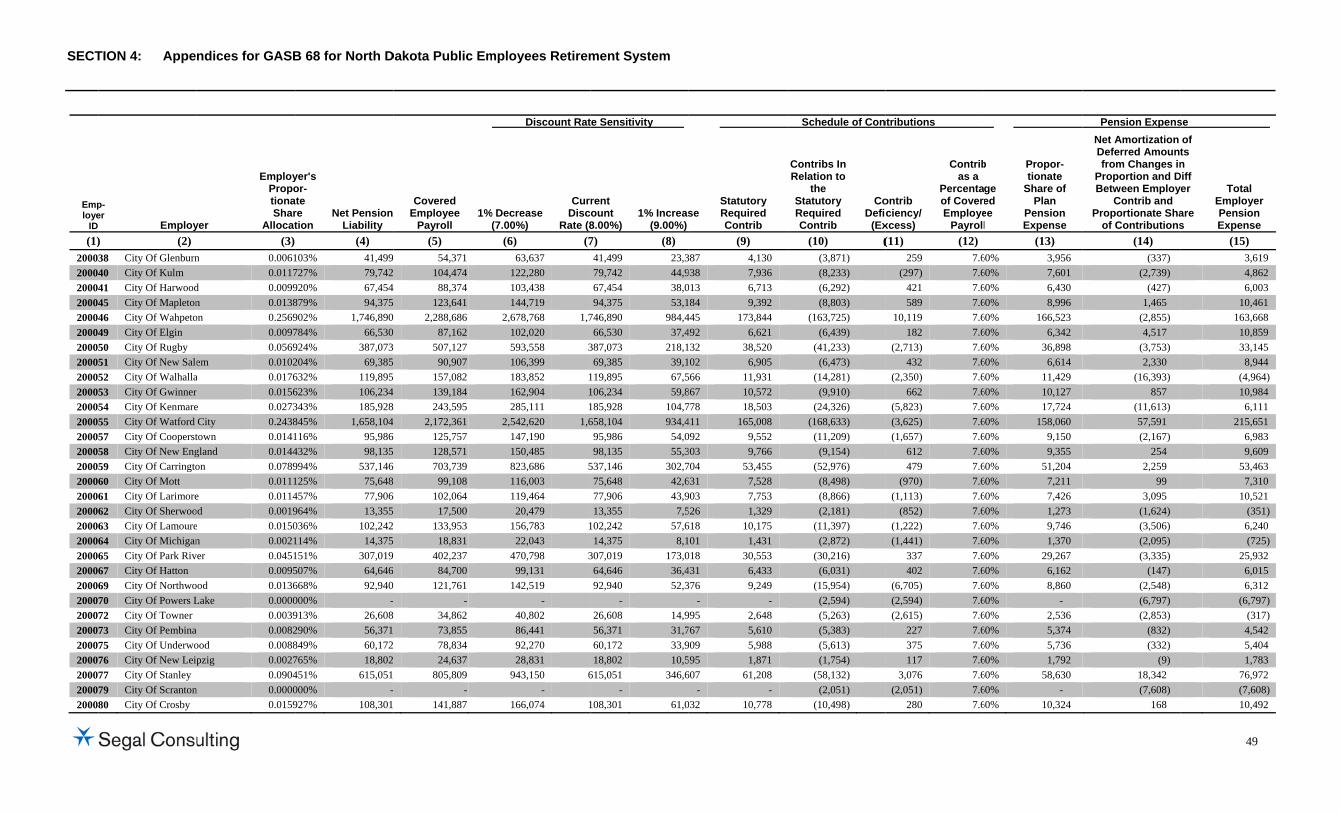
SECT
Employe
ID (1)
20003200042000420004200042000420005200052000520005200052000520005200052000520006200062000620006200062000620006200062000720007200072000720007200072000720008
TION 4: Appe
p-er
Employ) (2) 38 City Of Glenburn40 City Of Kulm 41 City Of Harwood45 City Of Mapleton46 City Of Wahpeto49 City Of Elgin 50 City Of Rugby 51 City Of New Sale52 City Of Walhalla53 City Of Gwinner 54 City Of Kenmare55 City Of Watford 57 City Of Cooperst58 City Of New Eng59 City Of Carringto60 City Of Mott 61 City Of Larimore62 City Of Sherwoo63 City Of Lamoure64 City Of Michigan65 City Of Park Riv67 City Of Hatton 69 City Of Northwo70 City Of Powers L72 City Of Towner 73 City Of Pembina 75 City Of Underwo76 City Of New Leip77 City Of Stanley 79 City Of Scranton80 City Of Crosby
ndices for GASB
yer
EmployPropotionaShar
Allocat(3)
n 0.00610.0117
d 0.0099n 0.0138on 0.2569
0.00970.0569
em 0.0102a 0.0176
0.0156e 0.0273City 0.2438town 0.0141gland 0.0144on 0.0789
0.0111e 0.0114d 0.0019
e 0.0150n 0.0021er 0.0451
0.0095od 0.0136
Lake 0.00000.00390.0082
ood 0.0088pzig 0.0027
0.0904n 0.0000
0.0159
B 68 for North D
yer's or-
ate re tion
Net Pension Liability
(4) 103% 41,499 727% 79,742 920% 67,454 879% 94,375 902% 1,746,890 784% 66,530 924% 387,073 204% 69,385 632% 119,895 623% 106,234 343% 185,928 845% 1,658,104 116% 95,986 432% 98,135 994% 537,146 125% 75,648 457% 77,906 964% 13,355 036% 102,242 114% 14,375 151% 307,019 507% 64,646 668% 92,940 000% -913% 26,608 290% 56,371 849% 60,172 765% 18,802 451% 615,051 000% -927% 108,301
Dakota Public Em
Covered
Employee Payroll
1%
(5) 54,371 104,474 88,374 123,641 2,288,686 87,162 507,127 90,907 157,082 139,184 243,595 2,172,361 125,757 128,571 703,739 99,108 102,064 17,500 133,953 18,831 402,237 84,700 121,761 - 34,862 73,855 78,834 24,637 805,809 - 141,887
mployees Retirem
Discount Rat
% Decrease (7.00%)
CurDisc
Rate (8(6) (7
63,637 122,280 103,438 144,719
2,678,768 1,7102,020 593,558 3106,399 183,852 1162,904 1285,111 1
2,542,620 1,6147,190 150,485 823,686 5116,003 119,464 20,479
156,783 122,043
470,798 399,131
142,519 -
40,802 86,441 92,270 28,831
943,150 6-
166,074 1
ment System
te Sensitivity
rent ount 8.00%)
1% Increas(9.00%)
7) (8) 41,499 23,3 79,742 44,9 67,454 38,0 94,375 53,1746,890 984,4 66,530 37,4387,073 218,1 69,385 39,1119,895 67,5106,234 59,8185,928 104,7658,104 934,4 95,986 54,0 98,135 55,3537,146 302,7 75,648 42,6 77,906 43,9 13,355 7,5102,242 57,6 14,375 8,1307,019 173,0 64,646 36,4 92,940 52,3
- 26,608 14,9 56,371 31,7 60,172 33,9 18,802 10,5615,051 346,6
- 108,301 61,0
se Statutory Required Contrib
(9) 87 4,130
938 7,936 013 6,713
84 9,392 445 173,844 492 6,621
32 38,520 02 6,905
566 11,931 867 10,572 778 18,503 411 165,008 092 9,552
03 9,766 704 53,455 631 7,528 903 7,753 526 1,329 618 10,175
01 1,431 018 30,553 431 6,433
76 9,249 - -
995 2,648 767 5,610 909 5,988 595 1,871 607 61,208
- - 032 10,778
Schedule of Con
Contribs In Relation to
the Statutory Required Contrib
CoDefic
(Ex(10) (
(3,871) (8,233) (6,292) (8,803)
(163,725) (6,439) (41,233) (6,473) (14,281) (9,910) (24,326)
(168,633) (11,209) (9,154) (52,976) (8,498) (8,866) (2,181) (11,397) (2,872) (30,216) (6,031) (15,954) (2,594) (5,263) (5,383) (5,613) (1,754) (58,132) (2,051) (10,498)
ntributions
ontrib ciency/
xcess)
Contribas a
Percentaof CoverEmploye
Payroll(11) (12)
259 7.6(297) 7.6 421 7.6 589 7.6
10,119 7.6 182 7.6
(2,713) 7.6 432 7.6
(2,350) 7.6 662 7.6
(5,823) 7.6 (3,625) 7.6 (1,657) 7.6
612 7.6 479 7.6
(970) 7.6 (1,113) 7.6
(852) 7.6 (1,222) 7.6 (1,441) 7.6
337 7.6 402 7.6
(6,705) 7.6 (2,594) 7.6 (2,615) 7.6
227 7.6 375 7.6 117 7.6
3,076 7.6 (2,051) 7.6
280 7.6
b
ge ed ee l
Propor- tionate
Share of Plan
Pension Expense
(13) 60% 3,956 60% 7,601 60% 6,430 60% 8,996 60% 166,523 60% 6,342 60% 36,898 60% 6,614 60% 11,429 60% 10,127 60% 17,724 60% 158,060 60% 9,150 60% 9,355 60% 51,204 60% 7,211 60% 7,426 60% 1,273 60% 9,746 60% 1,370 60% 29,267 60% 6,162 60% 8,860 60% - 60% 2,536 60% 5,374 60% 5,736 60% 1,792 60% 58,630 60% - 60% 10,324
Pension ExpensNet Amortization Deferred Amountfrom Changes in
Proportion and DBetween Employ
Contrib and Proportionate Sha
of Contributions(14)
(337) (2,739)
(427) 1,465
(2,855) 4,517
(3,753) 2,330
(16,393) 857
(11,613) 57,591 (2,167)
254 2,259
99 3,095
(1,624) (3,506) (2,095) (3,335)
(147) (2,548) (6,797) (2,853)
(832) (332)
(9) 18,342 (7,608)
168
49
se of ts n
Diff er
are s
Total Employer Pension Expense
(15) 3,619 4,862 6,003
10,461 163,668
10,859 33,145
8,944 (4,964) 10,984
6,111 215,651
6,983 9,609
53,463 7,310
10,521 (351) 6,240 (725)
25,932 6,015 6,312
(6,797) (317) 4,542 5,404 1,783
76,972 (7,608) 10,492

SECT
Employe
ID (1)
2000820008200082000820008200082000820009200092000920009200092001020010200102001020010200120012001200120012001200130000300003000030000300003000030000
TION 4: Appe
p-er
Employ) (2) 83 City Of Grafton 84 City Of Emerado85 City Of Lincoln 86 City Of Minto 87 City Of Ashley 88 City Of Neche 89 City Of Surrey 90 City Of Hankinso91 City Of New Roc94 City Of West Far97 City Of Devils La98 City Of Oakes 00 City Of Mohall 01 City Of Lidgerwo02 City Of Mcclusky03 City Of Burlingto04 City Of Lisbon 10 City Of Halliday 11 City Of Maddock14 City of Regent 15 City of Lakota 17 City of Alexande18 City of Berthold 19 City of Carson 01 Adams County 02 Barnes County 03 Benson County 04 Billings County 05 Bottineau County06 Bowman County07 Burke County
ndices for GASB
yer
EmployPropotionaShar
Allocat(3)
0.1467o 0.0077
0.03180.00870.01020.00480.0351
on 0.0205ckford 0.0208rgo 0.6657ake 0.0676
0.07160.0148
ood 0.0067y 0.0036on 0.0142
0.03160.0086
k 0.01110.00290.0236
er 0.00790.00330.00640.09240.28390.17890.2577
y 0.3139y 0.1525
0.1543
B 68 for North D
yer's or-
ate re tion
Net Pension Liability
(4) 746% 997,848 725% 52,529 800% 216,235 755% 59,533 241% 69,637 883% 33,204 111% 238,749 552% 139,750 899% 142,110 753% 4,527,007 665% 460,110 697% 487,527 892% 101,263 731% 45,770 643% 24,772 278% 97,088 691% 215,493 699% 59,152 163% 75,906 906% 19,760 667% 160,932 952% 54,072 370% 22,915 486% 44,104 483% 628,869 995% 1,931,118 930% 1,216,693 702% 1,752,330 907% 2,134,514 558% 1,037,368 300% 1,049,214
Dakota Public Em
Covered
Employee Payroll
1%
(5) 1,307,327 68,823 283,295 77,994 91,232 43,500 312,800 183,097 186,184 5,931,052 602,813 638,731 132,668 59,966 32,457 127,203 282,327 77,495 99,452 25,885 210,845 70,844 30,027 57,782 823,910 2,530,050 1,594,046 2,295,812 2,796,533 1,359,108 1,374,623
mployees Retirem
Discount Rat
% Decrease (7.00%)
CurDisc
Rate (8(6) (71,530,150 9
80,550 331,585 291,290
106,785 50,916
366,109 2214,300 1217,918 1
6,941,938 4,5705,556 4747,599 4155,282 170,185 37,986
148,880 330,448 290,706
116,399 30,301
246,780 1 82,917 35,140 67,631
964,339 62,961,272 1,91,865,739 1,22,687,110 1,73,273,170 2,11,590,752 1,01,608,917 1,0
ment System
te Sensitivity
rent ount 8.00%)
1% Increas(9.00%)
7) (8) 997,848 562,3 52,529 29,6216,235 121,8 59,533 33,5 69,637 39,2 33,204 18,7238,749 134,5139,750 78,7142,110 80,0527,007 2,551,1460,110 259,2487,527 274,7101,263 57,0 45,770 25,7 24,772 13,9 97,088 54,7215,493 121,4 59,152 33,3 75,906 42,7 19,760 11,1160,932 90,654,072 30,4 22,915 12,9 44,104 24,8628,869 354,3931,118 1,088,2216,693 685,6752,330 987,5134,514 1,202,8037,368 584,6049,214 591,2
se Statutory Required Contrib
(9) 29 99,302
602 5,227 857 21,519 549 5,924 243 6,930 712 3,304 545 23,759 755 13,907 085 14,142
56 450,511 291 45,788 742 48,517 066 10,077 793 4,555 960 2,465 713 9,662 439 21,445 34 5,887
776 7,554 36 1,966
692 16,015 472 5,381 914 2,280 854 4,389
94 62,583 265 192,178 657 121,081 510 174,385 887 212,419 600 103,235 275 104,414
Schedule of Con
Contribs In Relation to
the Statutory Required Contrib
CoDefic
(Ex(10) (
(98,367) (4,900) (28,553) (5,553) (6,496) (3,097) (22,930) (13,681) (13,256)
(451,207) (43,296) (44,856) (9,796) (4,270) (2,311) (9,486) (23,647) (7,160) (8,120) (4,550) (15,641) (5,044) (2,138) (4,493) (63,275)
(191,911) (131,089) (172,478) (211,280) (102,976) (109,068)
ntributions
ontrib ciency/
xcess)
Contribas a
Percentaof CoverEmploye
Payroll(11) (12)
935 7.6 327 7.6
(7,034) 7.6 371 7.6 434 7.6 207 7.6 829 7.6 226 7.6 886 7.6
(696) 7.62,492 7.63,661 7.6
281 7.6 285 7.6 154 7.6 176 7.6
(2,202) 7.6 (1,273) 7.6
(566) 7.6 (2,584) 7.6
374 7.6337 7.6 142 7.6
(104) 7.6(692) 7.6 267 7.6
(10,008) 7.61,907 7.61,139 7.6
259 7.6 (4,654) 7.6
b
ge ed ee l
Propor- tionate
Share of Plan
Pension Expense
(13) 60% 95,120 60% 5,007 60% 20,613 60% 5,675 60% 6,638 60% 3,165 60% 22,759 60% 13,322 60% 13,547 60% 431,540 60% 43,860 60% 46,474 60% 9,653 60% 4,363 60% 2,361 60% 9,255 60% 20,542 60% 5,639 60% 7,236 60% 1,884 60% 15,341 60% 5,154 60% 2,184 60% 4,204 60% 59,947 60% 184,085 60% 115,982 60% 167,042 60% 203,474 60% 98,888 60% 100,017
Pension ExpensNet Amortization Deferred Amountfrom Changes in
Proportion and DBetween Employ
Contrib and Proportionate Sha
of Contributions(14) (12,187)
2,908 (11,797)
(241) 3,330 (382)
12,447 (1,803) 4,210
12,808 60,280
1,753 (3,195) 2,240
470 7,432 (582)
(4,879) 1,914 2,222
14,363 9,758 2,948 6,505 6,305
19,016 (10,742)
(4,325) (13,704)
(5,036) (4,203)
50
se of ts n
Diff er
are s
Total Employer Pension Expense
(15) 82,933
7,915 8,816 5,434 9,968 2,783
35,206 11,519 17,757
444,348 104,140
48,227 6,458 6,603 2,831
16,687 19,960
760 9,150 4,106
29,704 14,912
5,132 10,709 66,252
203,101 105,240 162,717 189,770
93,852 95,814

SECT
Employe
ID (1)
30000300003000300030003000300030003000300030003000230002300023000230002300023000230002300023000330003300033000330003300033000330003300033000330004
TION 4: Appe
p-er
Employ) (2) 08 Burleigh County 09 Cass County 10 Cavalier County 11 Dickey County 12 Divide County 13 Dunn County 14 Eddy County 15 Emmons County 16 Foster County 18 Grand Forks Cou19 Grant County 20 Griggs County 21 Hettinger County23 Lamoure County24 Logan County 25 Mchenry County26 Mcintosh County27 Mckenzie County28 Mclean County 29 Mercer County 30 Morton County 31 Mountrail County32 Nelson County 33 Oliver County 34 Pembina County 35 Pierce County 36 Ramsey County 37 Ransom County 38 Renville County 39 Richland County40 Rolette County
ndices for GASB
yer
EmployPropotionaShar
Allocat(3)
1.43462.33690.20370.17410.28790.37090.08310.12220.0908
unty 1.48680.10100.0777
y 0.1197y 0.1634
0.0705y 0.1509y 0.1034y 0.6443
0.43220.30400.5837
y 0.54070.13640.07760.28700.22240.32360.14960.1256
y 0.57330.2145
B 68 for North D
yer's or-
ate re tion
Net Pension Liability
(4) 633% 9,755,259 990% 15,891,133 720% 1,385,261 130% 1,184,054 929% 1,957,868 926% 2,522,233 183% 565,630 278% 831,470 879% 617,962 855% 10,110,360 060% 687,191 736% 528,592 779% 814,477 428% 1,111,282 577% 479,912 901% 1,026,101 406% 703,143 316% 4,381,239 212% 2,938,968 012% 2,067,230 700% 3,969,060 752% 3,677,021 437% 927,748 617% 527,782 027% 1,951,735 433% 1,512,506 680% 2,200,969 648% 1,017,581 650% 854,399 347% 3,898,662 508% 1,458,618
Dakota Public Em
Covered
Employee Payroll
1%
(5) 12,780,838 20,819,749 1,814,902 1,551,286 2,565,097 3,304,498 741,056 1,089,350 809,624 13,246,075 900,320 692,536 1,067,086 1,455,944 628,759 1,344,346 921,222 5,740,070 3,850,486 2,708,377 5,200,057 4,817,448 1,215,486 691,473 2,557,059 1,981,611 2,883,596 1,333,185 1,119,388 5,107,830 1,911,009
mployees Retirem
Discount Rat
% Decrease (7.00%)
CurDisc
Rate (8(6) (7
14,959,202 9,7 24,368,257 15,8
2,124,229 1,31,815,688 1,13,002,293 1,93,867,719 2,5
867,366 51,275,017 8
947,613 6 15,503,731 10,1
1,053,773 6810,569 5
1,248,959 81,704,096 1,1
735,920 41,573,475 1,01,078,235 76,718,410 4,34,506,760 2,93,169,993 2,06,086,355 3,95,638,528 3,61,422,656 9
809,328 52,992,887 1,92,319,353 1,53,375,075 2,21,560,409 1,01,310,177 85,978,403 3,82,236,717 1,4
ment System
te Sensitivity
rent ount 8.00%)
1% Increas(9.00%)
7) (8) 755,259 5,497,4891,133 8,955,3385,261 780,6184,054 667,2957,868 1,103,3522,233 1,421,3565,630 318,7831,470 468,5617,962 348,2110,360 5,697,6687,191 387,2528,592 297,8814,477 458,9111,282 626,2479,912 270,4026,101 578,2703,143 396,2381,239 2,469,0938,968 1,656,2067,230 1,164,9969,060 2,236,7677,021 2,072,1927,748 522,8527,782 297,4951,735 1,099,8512,506 852,3200,969 1,240,3017,581 573,4854,399 481,4898,662 2,197,0458,618 821,9
se Statutory Required Contrib
(9) 494 970,807
13 1,581,427 652 137,856 264 117,833
40 194,840 83 251,003
756 56,289 568 82,745 247 61,497 608 1,006,145 261 68,387 883 52,603 991 81,054 254 110,591 450 47,759 251 102,114 250 69,974 010 436,005 230 292,475 970 205,723 730 394,986
54 365,923 825 92,326 427 52,523 883 194,229
60 150,519 37 219,032
449 101,266 489 85,027 058 387,980 992 145,156
Schedule of Con
Contribs In Relation to
the Statutory Required Contrib
CoDefic
(Ex(10) (
(1,010,081) (1,571,032)
(131,433) (122,862) (193,690) (245,589)
(59,722) (86,203) (78,199)
(1,012,374) (74,160) (57,360) (76,441)
(101,693) (48,778)
(107,365) (71,280)
(450,486) (286,954) (204,848) (374,863) (367,420)
(91,675) (49,511)
(193,547) (153,449) (204,185)
(98,477) (87,094)
(379,299) (146,566)
ntributions
ontrib ciency/
xcess)
Contribas a
Percentaof CoverEmploye
Payroll(11) (12)(39,274) 7.6
10,395 7.66,423 7.6
(5,029) 7.61,150 7.65,414 7.6
(3,433) 7.6 (3,458) 7.6(16,702) 7.6 (6,229) 7.6 (5,773) 7.6 (4,757) 7.6
4,613 7.68,898 7.6
(1,019) 7.6 (5,251) 7.6 (1,306) 7.6(14,481) 7.6
5,521 7.6 875 7.6
20,123 7.6 (1,497) 7.6
651 7.63,012 7.6
682 7.6 (2,930) 7.614,847 7.6
2,789 7.6 (2,067) 7.6
8,681 7.6 (1,410) 7.6
b
ge ed ee l
Propor- tionate
Share of Plan
Pension Expense
(13) 60% 929,926 60% 1,514,831 60% 132,051 60% 112,871 60% 186,635 60% 240,433 60% 53,919 60% 79,260 60% 58,908 60% 963,776 60% 65,507 60% 50,388 60% 77,640 60% 105,934 60% 45,748 60% 97,814 60% 67,028 60% 417,644 60% 280,159 60% 197,060 60% 378,353 60% 350,514 60% 88,438 60% 50,311 60% 186,050 60% 144,181 60% 209,809 60% 97,001 60% 81,446 60% 371,642 60% 139,044
Pension ExpensNet Amortization Deferred Amountfrom Changes in
Proportion and DBetween Employ
Contrib and Proportionate Sha
of Contributions(14) (44,365)
(121,943) 8,883
(12,878) 32,405 46,540 (6,611)
(19,411) (38,953) (86,528) (18,318)
(8,453) 7,897
24,713 5,495 7,140 5,419
167,321 2,712
25,752 64,024 74,676 (8,109) 8,400
(2,780) 27,030 (1,406) (3,865) (4,139)
(31,729) (2,960)
51
se of ts n
Diff er
are s
Total Employer Pension Expense
(15) 885,561
1,392,888 140,934
99,993 219,040 286,973
47,308 59,849 19,955
877,248 47,189 41,935 85,537
130,647 51,243
104,954 72,447
584,965 282,871 222,812 442,377 425,190
80,329 58,711
183,270 171,211 208,403
93,136 77,307
339,913 136,084

SECT
Employe
ID (1)
30004300043000430004300043000430004300053000530005300054000040000
400004000040000
40000
4000
40004000
400040004000
4000
400040002
TION 4: Appe
p-er
Employ) (2) 42 Sheridan County 44 Slope County 45 Stark County 46 Steele County 47 Stutsman County48 Towner County 49 Traill County 50 Walsh County 51 Ward County 52 Wells County 53 Williams County02 Mcclusky Public 03 Lake Region Spe
Education Unit 04 Lidgerwood Publ06 Halliday Public S07 Oliver-Mercer Sp
Education Unit 08 Underwood Scho
#8 10 New Town Publi
District 11 Bottineau Public 12 Peace Garden Sp
Services 14 Beulah Public Sc16 St John School D17 Ellendale Public
District #40 18 Rural Cass Speci
Education Unit 19 Fargo Public Sch20 Surrey Schools
ndices for GASB
yer
EmployPropotionaShar
Allocat(3)
0.05930.06120.55800.0903
y 0.64470.09730.29130.33130.91390.1549
y 0.8589Schools 0.0151
ecial 0.0638
lic School 0.0297School 0.0072pecial 0.0396
ool District 0.0295
ic School 0.1192
School 0.1516ecial 0.0381
chool #27 0.0637District #3 0.0567
School 0.0438
ial 0.0282
hools 2.14830.0627
B 68 for North D
yer's or-
ate re tion
Net Pension Liability
(4) 352% 403,583 231% 416,360 091% 3,794,924 398% 614,691 744% 4,384,149 330% 661,827 351% 1,981,137 323% 2,252,940 962% 6,214,786 986% 1,053,878 906% 5,840,414 130% 102,881 834% 434,060
770% 202,431 275% 49,469 610% 269,341
572% 201,085
297% 811,199
638% 1,031,113 176% 259,590
726% 433,326 795% 386,196 841% 298,111
220% 191,891
335% 14,608,311 755% 426,723
Dakota Public Em
Covered
Employee Payroll
1%
(5) 528,754 545,497 4,971,918 805,335 5,743,887 867,092 2,595,588 2,951,687 8,142,296 1,380,733 7,651,808 134,788 568,687
265,216 64,809 352,873
263,449
1,062,792
1,350,911 340,101
567,724 505,976 390,572
251,403
19,139,057 559,075
mployees Retirem
Discount Rat
% Decrease (7.00%)
CurDisc
Rate (8(6) (7
618,875 4638,468 4
5,819,325 3,7942,598 6
6,722,873 4,31,014,879 63,037,975 1,93,454,770 2,29,530,063 6,21,616,070 1,08,955,983 5,8
157,764 1665,610 4
310,418 275,858
413,021 2
308,353 2
1,243,933 8
1,581,159 1,0398,069 2
664,484 4592,213 3457,139 2
294,256 1
22,401,114 14,6654,359 4
ment System
te Sensitivity
rent ount 8.00%)
1% Increas(9.00%)
7) (8) 403,583 227,4416,360 234,6794,924 2,138,5614,691 346,4384,149 2,470,6661,827 372,9981,137 1,116,4252,940 1,269,6214,786 3,502,2053,878 593,9840,414 3,291,3102,881 57,9434,060 244,6
202,431 114,0 49,469 27,8269,341 151,7
201,085 113,3
811,199 457,1
031,113 581,0259,590 146,2
433,326 244,1386,196 217,6298,111 167,9
191,891 108,1
608,311 8,232,3426,723 240,4
se Statutory Required Contrib
(9) 436 40,163 636 41,435 597 377,657 404 61,172 650 436,294 967 65,863 453 197,155 625 224,204 290 618,472 904 104,878
16 581,216 978 10,238 611 43,196
078 20,145 878 4,923 785 26,804
19 20,011
44 80,728
075 102,612 290 25,833
97 43,123 638 38,433 998 29,667
39 19,096
90 1,453,765 476 42,466
Schedule of Con
Contribs In Relation to
the Statutory Required Contrib
CoDefic
(Ex(10) (
(42,942) (37,096)
(379,909) (62,873)
(434,840) (64,886)
(193,697) (228,804) (661,061) (114,045) (639,914)
(9,711) (41,072)
(21,452) (4,614) (25,514)
(21,813)
(84,557)
(90,830) (22,808)
(61,813) (41,033) (29,773)
(14,087)
(1,577,824) (1(40,471)
ntributions
ontrib ciency/
xcess)
Contribas a
Percentaof CoverEmploye
Payroll(11) (12) (2,779) 7.6
4,339 7.6 (2,252) 7.6 (1,701) 7.6
1,454 7.6 977 7.6
3,458 7.6 (4,600) 7.6(42,589) 7.6 (9,167) 7.6(58,698) 7.6
527 7.62,124 7.6
(1,307) 7.6 309 7.6
1,290 7.6
(1,802) 7.6
(3,829) 7.6
11,782 7.63,025 7.6
(18,690) 7.6 (2,600) 7.6
(106) 7.6
5,009 7.6
124,059) 7.61,995 7.6
b
ge ed ee l
Propor- tionate
Share of Plan
Pension Expense
(13) 60% 38,472 60% 39,690 60% 361,753 60% 58,596 60% 417,922 60% 63,089 60% 188,853 60% 214,763 60% 592,428 60% 100,462 60% 556,741 60% 9,807 60% 41,377
60% 19,297 60% 4,716 60% 25,675
60% 19,169
60% 77,328
60% 98,291 60% 24,746
60% 41,307 60% 36,814 60% 28,418
60% 18,292
60% 1,392,546 60% 40,678
Pension ExpensNet Amortization Deferred Amountfrom Changes in
Proportion and DBetween Employ
Contrib and Proportionate Sha
of Contributions(14)
1,493 8,087
13,081 22,056 52,080
2,477 (467)
(8,279) (32,674) (37,049) 117,159
401 (11,000)
(3,048) (3,738) (2,391)
(420)
(22,760)
9,096 1,957
(28,307) (10,528)
3,184
(6,436)
(181,137) (1,139)
52
se of ts n
Diff er
are s
Total Employer Pension Expense
(15) 39,965 47,777
374,834 80,652
470,002 65,566
188,386 206,484 559,754
63,413 673,900
10,208 30,377
16,249 978
23,284
18,749
54,568
107,387 26,703
13,000 26,286 31,602
11,856
1,211,409 39,539

SECT
Employe
ID (1)
40002
4000240002
40002
40002
4000240002
40002
4000340003
40003
4000340003
40003
40003
400034000440004
40004
40004
TION 4: Appe
p-er
Employ) (2) 21 Jamestown Publi
District #1 23 Warwick Public S24 Souris Valley Sp
Services 25 Rugby Public Sch
District #5 26 Billings County S
District 27 Belcourt School D28 West Fargo Publi
#6 29 Minot Public Sch
District #1 30 Belfield Public S31 Minto Public Sch
District #20 33 Harvey Public Sc
#38 34 Oakes Public Sch35 Larimore Public
District #44 36 Hazen Public Sch
District #3 38 Park River Area
District 39 Hillsboro Public 40 Lisbon Public Sc42 Northern Cass Sc
District # 97 43 Mandaree Public
#36 44 Thompson Public
ndices for GASB
yer
EmployPropotionaShar
Allocat(3)
c School 0.3096
School 0.0320ecial 0.1334
hool 0.0711
School 0.0473
District #7 0.5361ic School 1.4261
hool 1.5130
chool #13 0.0373hool 0.0397
chool Dist 0.0552
hools 0.0582School 0.0645
hool 0.0668
School 0.0581
School 0.0532chool 0.0677chool 0.0650
School 0.0485
c School 0.0352
B 68 for North D
yer's or-
ate re tion
Net Pension Liability
(4) 690% 2,105,839
002% 217,608 462% 907,519
171% 483,951
367% 322,088
150% 3,645,728 185% 9,697,815
094% 10,288,781
345% 253,940 783% 270,518
227% 375,534
230% 395,954 538% 438,847
878% 454,759
116% 395,179
201% 361,758 781% 460,899 070% 442,465
539% 330,057
253% 239,714
Dakota Public Em
Covered
Employee Payroll
1%
(5) 2,758,958
285,101 1,188,983
634,043
421,983
4,776,443 12,705,578
13,479,829
332,697 354,416
492,008
518,756 574,956
595,803
517,742
473,954 603,844 579,695
432,420
314,065
mployees Retirem
Discount Rat
% Decrease (7.00%)
CurDisc
Rate (8(6) (73,229,199 2,1
333,691 21,391,635 9
742,114 4
493,905 3
5,590,542 3,6 14,871,113 9,6
15,777,331 10,2
389,404 2414,825 2
575,863 3
607,176 3672,950 4
697,350 4
605,987 3
554,737 3706,766 4678,498 4
506,126 3
367,590 2
ment System
te Sensitivity
rent ount 8.00%)
1% Increas(9.00%)
7) (8) 105,839 1,186,7
217,608 122,6907,519 511,4
483,951 272,7
322,088 181,5
645,728 2,054,5697,815 5,465,1
288,781 5,798,1
253,940 143,1270,518 152,4
375,534 211,6
395,954 223,1438,847 247,3
454,759 256,2
395,179 222,7
361,758 203,8460,899 259,7442,465 249,3
330,057 186,0
239,714 135,0
se Statutory Required Contrib
(9) 728 209,565
631 21,656 425 90,313
726 48,161
510 32,053
519 362,809 21 965,090
55 1,023,901
06 25,271 448 26,921
629 37,372
37 39,404 09 43,672
276 45,256
700 39,327
865 36,001 736 45,867
47 44,032
001 32,846
089 23,855
Schedule of Con
Contribs In Relation to
the Statutory Required Contrib
CoDefic
(Ex(10) ((211,422)
(28,317) (86,178)
(45,153)
(30,815)
(344,664) (956,975)
(1,047,246)
(25,141) (26,793)
(37,126)
(40,517) (40,099)
(44,264)
(39,438)
(33,440) (46,839) (42,329)
(40,998)
(24,880)
ntributions
ontrib ciency/
xcess)
Contribas a
Percentaof CoverEmploye
Payroll(11) (12) (1,857) 7.6
(6,661) 7.64,135 7.6
3,008 7.6
1,238 7.6
18,145 7.68,115 7.6
(23,345) 7.6
130 7.6 128 7.6
246 7.6
(1,113) 7.63,573 7.6
992 7.6
(111) 7.6
2,561 7.6(972) 7.61,703 7.6
(8,152) 7.6
(1,025) 7.6
b
ge ed ee l
Propor- tionate
Share of Plan
Pension Expense
(13) 60% 200,740
60% 20,744 60% 86,510
60% 46,133
60% 30,703
60% 347,531 60% 924,450
60% 980,784
60% 24,207 60% 25,787
60% 35,798
60% 37,745 60% 41,833
60% 43,350
60% 37,671
60% 34,485 60% 43,935 60% 42,178
60% 31,463
60% 22,851
Pension ExpensNet Amortization Deferred Amountfrom Changes in
Proportion and DBetween Employ
Contrib and Proportionate Sha
of Contributions(14) (16,711)
(7,918) 3,450
5,469
6,768
(49,122) 164,626
7,319
13,412 3,190
182
(15,476) 5,738
(1,006)
(974)
(3,652) (2,598) 3,467
(18,923)
(3,301)
53
se of ts n
Diff er
are s
Total Employer Pension Expense
(15) 184,029
12,826 89,960
51,602
37,471
298,409 1,089,076
988,103
37,619 28,977
35,980
22,269 47,571
42,344
36,697
30,833 41,337 45,645
12,540
19,550

SECT
Employe
ID (1)
40004
40004
40004
400044000440005
400054000540005
40005
40005
40005
40005
40005
40005
40006
4000640006
40006
40006
TION 4: Appe
p-er
Employ) (2) 45 Northern Plains S
Unit 46 Bowman County
District #1 47 Apple Creek Elem
School 48 Burke Central Sc49 Washburn Public50 Enderlin Area Sc
District #24 51 Midkota School 52 Velva Public Sch53 Sheyenne Valley
Education Unit 54 Center Stanton Pu
School 55 Burleigh County
Education Unit 56 New Rockford Sh
Public School 57 James River Mul
Special Education58 Newburg United
School 59 Napoleon Public
District #2 60 Yellowstone Sch
District # 14 61 Cavalier Public S62 Richland School
44 63 Fort Totten Scho
# 30 64 Bismarck Public
ndices for GASB
yer
EmployPropotionaShar
Allocat(3)
Special Ed 0.0123
y School 0.0696
mentary 0.0058
chool 0.0102c School 0.0398chool 0.0525
0.0095hool 0.0407 Special 0.0583
ublic 0.0287
Special 0.0052
heyenne 0.0259
ltidistrict n Unit
0.0438
Public 0.0231
School 0.0260
ool 0.0102
Schools 0.0463District # 0.0426
ol District 0.0383
Schools 2.3647
B 68 for North D
yer's or-
ate re tion
Net Pension Liability
(4) 326% 83,815
605% 473,302
832% 39,657
233% 69,583 845% 270,939 582% 357,549
565% 65,040 775% 277,263 379% 396,967
766% 195,604
208% 35,414
913% 176,204
808% 297,887
191% 157,695
002% 176,809
240% 69,630
356% 315,213 615% 289,775
304% 260,461
784% 16,080,127
Dakota Public Em
Covered
Employee Payroll
1%
(5) 109,814
620,094
51,960
91,166 354,968 468,441
85,214 363,255 520,089
256,267
46,395
230,856
390,277
206,605
231,645
91,226
412,980 379,645
341,239
21,067,356
mployees Retirem
Discount Rat
% Decrease (7.00%)
CurDisc
Rate (8(6) (7
128,526
725,785 4
60,811
106,702 415,472 2548,283 3
99,736 425,169 2608,729 3
299,949 1
54,305
270,200 1
456,795 2
241,817 1
271,128 1
106,775
483,363 3444,355 2
399,403 2
24,658,071 16,0
ment System
te Sensitivity
rent ount 8.00%)
1% Increas(9.00%)
7) (8) 83,815 47,2
473,302 266,7
39,657 22,3
69,583 39,2270,939 152,6357,549 201,4
65,040 36,6277,263 156,2396,967 223,7
195,604 110,2
35,414 19,9
176,204 99,2
297,887 167,8
157,695 88,8
176,809 99,6
69,630 39,2
315,213 177,6289,775 163,3
260,461 146,7
080,127 9,061,8
se Statutory Required Contrib
(9) 233 8,341
725 47,101
48 3,946
213 6,925 685 26,963 493 35,582
653 6,473 249 27,592 708 39,505
231 19,466
957 3,524
298 17,535
872 29,645
868 15,693
639 17,595
240 6,929
636 31,369 00 28,837
780 25,920
819 1,600,235
Schedule of Con
Contribs In Relation to
the Statutory Required Contrib
CoDefic
(Ex(10) (
(3,794)
(45,694)
(3,700)
(6,491) (24,592) (35,887)
(6,067) (26,666) (38,316)
(17,782)
(3,559)
(17,734)
(24,434)
(14,710)
(17,933)
(8,059)
(32,098) (31,433)
(27,107)
(1,570,339)
ntributions
ontrib ciency/
xcess)
Contribas a
Percentaof CoverEmploye
Payroll(11) (12)
4,547 7.6
1,407 7.6
247 7.6
434 7.62,371 7.6(305) 7.6
406 7.6 926 7.6
1,189 7.6
1,684 7.6
(35) 7.6
(199) 7.6
5,211 7.6
983 7.6
(338) 7.6
(1,130) 7.6
(729) 7.6 (2,596) 7.6
(1,187) 7.6
29,896 7.6
b
ge ed ee l
Propor- tionate
Share of Plan
Pension Expense
(13) 60% 7,990
60% 45,118
60% 3,780
60% 6,633 60% 25,827 60% 34,084
60% 6,200 60% 26,430 60% 37,841
60% 18,646
60% 3,376
60% 16,797
60% 28,396
60% 15,032
60% 16,854
60% 6,638
60% 30,048 60% 27,623
60% 24,829
60% 1,532,847
Pension ExpensNet Amortization Deferred Amountfrom Changes in
Proportion and DBetween Employ
Contrib and Proportionate Sha
of Contributions(14)
(816)
1,109
6
9,137 8,028
(2,263)
11,737 (1,761)
(13,043)
(406)
(501)
(3,383)
(5,749)
387
337
1,380
(2,450) (4,158)
(7,910)
141,648
54
se of ts n
Diff er
are s
Total Employer Pension Expense
(15) 7,174
46,227
3,786
15,770 33,855 31,821
17,937 24,669 24,798
18,240
2,875
13,414
22,647
15,419
17,191
8,018
27,598 23,465
16,919
1,674,495
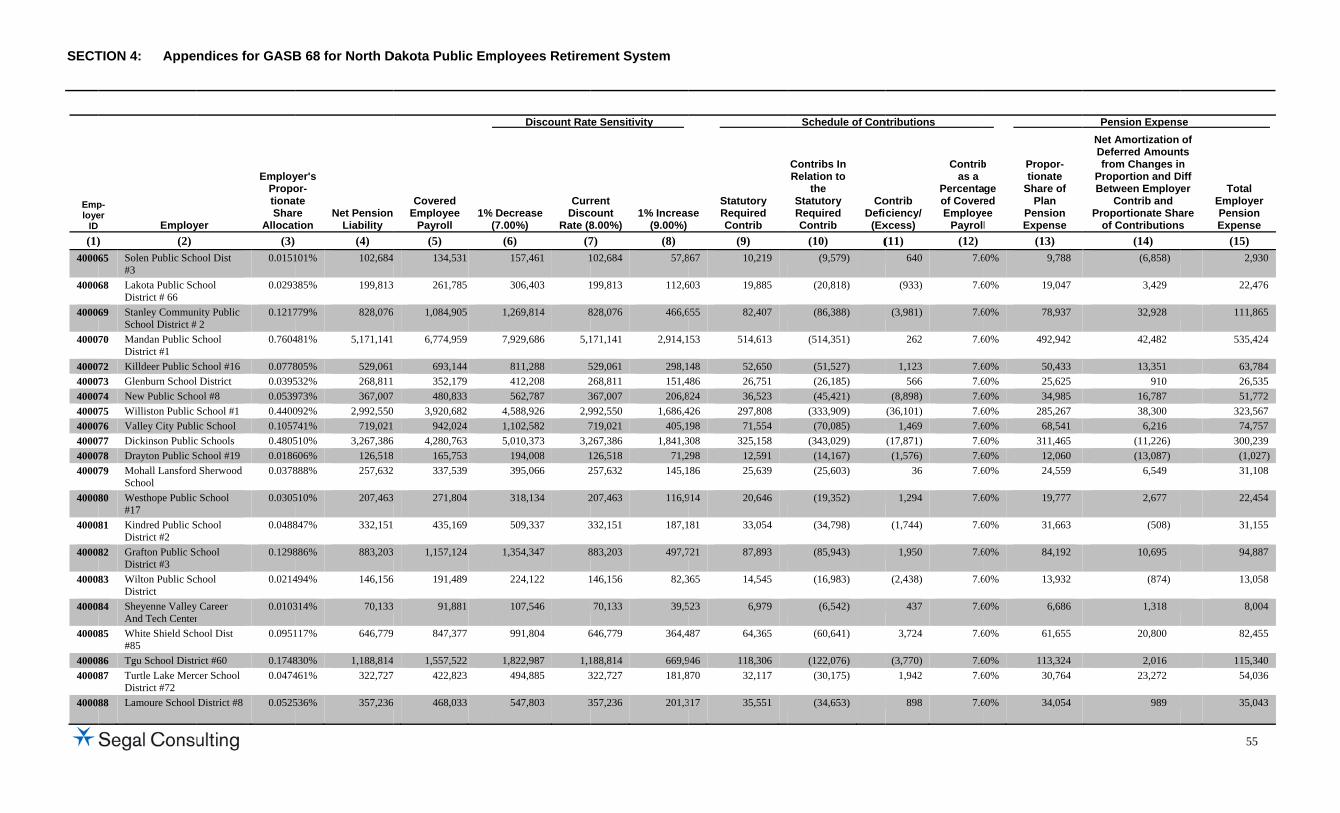
SECT
Employe
ID (1)
40006
40006
40006
40007
4000740007400074000740007400074000740007
40008
40008
40008
40008
40008
40008
4000840008
40008
TION 4: Appe
p-er
Employ) (2) 65 Solen Public Sch
#3 68 Lakota Public Sc
District # 66 69 Stanley Commun
School District # 70 Mandan Public S
District #1 72 Killdeer Public S73 Glenburn School74 New Public Scho75 Williston Public 76 Valley City Publi77 Dickinson Public78 Drayton Public S79 Mohall Lansford
School 80 Westhope Public
#17 81 Kindred Public S
District #2 82 Grafton Public Sc
District #3 83 Wilton Public Sc
District 84 Sheyenne Valley
And Tech Center85 White Shield Sch
#85 86 Tgu School Distr87 Turtle Lake Merc
District #72 88 Lamoure School
ndices for GASB
yer
EmployPropotionaShar
Allocat(3)
hool Dist 0.0151
hool 0.0293
nity Public 2
0.1217
School 0.7604
School #16 0.0778 District 0.0395
ool #8 0.0539School #1 0.4400ic School 0.1057c Schools 0.4805School #19 0.0186
Sherwood 0.0378
School 0.0305
School 0.0488
chool 0.1298
hool 0.0214
Career r
0.0103
hool Dist 0.0951
rict #60 0.1748cer School 0.0474
District #8 0.0525
B 68 for North D
yer's or-
ate re tion
Net Pension Liability
(4) 101% 102,684
385% 199,813
779% 828,076
481% 5,171,141
805% 529,061 532% 268,811 973% 367,007 092% 2,992,550 741% 719,021 510% 3,267,386 606% 126,518 888% 257,632
510% 207,463
847% 332,151
886% 883,203
494% 146,156
314% 70,133
117% 646,779
830% 1,188,814 461% 322,727
536% 357,236
Dakota Public Em
Covered
Employee Payroll
1%
(5) 134,531
261,785
1,084,905
6,774,959
693,144 352,179 480,833 3,920,682 942,024 4,280,763 165,753 337,539
271,804
435,169
1,157,124
191,489
91,881
847,377
1,557,522 422,823
468,033
mployees Retirem
Discount Rat
% Decrease (7.00%)
CurDisc
Rate (8(6) (7
157,461 1
306,403 1
1,269,814 8
7,929,686 5,1
811,288 5412,208 2562,787 3
4,588,926 2,91,102,582 75,010,373 3,2
194,008 1395,066 2
318,134 2
509,337 3
1,354,347 8
224,122 1
107,546
991,804 6
1,822,987 1,1494,885 3
547,803 3
ment System
te Sensitivity
rent ount 8.00%)
1% Increas(9.00%)
7) (8) 102,684 57,8
199,813 112,6
828,076 466,6
171,141 2,914,1
529,061 298,1268,811 151,4367,007 206,8992,550 1,686,4719,021 405,1267,386 1,841,3126,518 71,2257,632 145,1
207,463 116,9
332,151 187,1
883,203 497,7
146,156 82,3
70,133 39,5
646,779 364,4
188,814 669,9322,727 181,8
357,236 201,3
se Statutory Required Contrib
(9) 867 10,219
603 19,885
655 82,407
53 514,613
48 52,650 486 26,751 824 36,523 426 297,808
98 71,554 08 325,158
298 12,591 86 25,639
914 20,646
81 33,054
721 87,893
65 14,545
523 6,979
487 64,365
946 118,306 870 32,117
17 35,551
Schedule of Con
Contribs In Relation to
the Statutory Required Contrib
CoDefic
(Ex(10) (
(9,579)
(20,818)
(86,388)
(514,351)
(51,527) (26,185) (45,421)
(333,909) (70,085)
(343,029) (14,167) (25,603)
(19,352)
(34,798)
(85,943)
(16,983)
(6,542)
(60,641)
(122,076) (30,175)
(34,653)
ntributions
ontrib ciency/
xcess)
Contribas a
Percentaof CoverEmploye
Payroll(11) (12)
640 7.6
(933) 7.6
(3,981) 7.6
262 7.6
1,123 7.6 566 7.6
(8,898) 7.6(36,101) 7.6
1,469 7.6(17,871) 7.6 (1,576) 7.6
36 7.6
1,294 7.6
(1,744) 7.6
1,950 7.6
(2,438) 7.6
437 7.6
3,724 7.6
(3,770) 7.61,942 7.6
898 7.6
b
ge ed ee l
Propor- tionate
Share of Plan
Pension Expense
(13) 60% 9,788
60% 19,047
60% 78,937
60% 492,942
60% 50,433 60% 25,625 60% 34,985 60% 285,267 60% 68,541 60% 311,465 60% 12,060 60% 24,559
60% 19,777
60% 31,663
60% 84,192
60% 13,932
60% 6,686
60% 61,655
60% 113,324 60% 30,764
60% 34,054
Pension ExpensNet Amortization Deferred Amountfrom Changes in
Proportion and DBetween Employ
Contrib and Proportionate Sha
of Contributions(14) (6,858)
3,429
32,928
42,482
13,351 910
16,787 38,300
6,216 (11,226) (13,087)
6,549
2,677
(508)
10,695
(874)
1,318
20,800
2,016 23,272
989
55
se of ts n
Diff er
are s
Total Employer Pension Expense
(15) 2,930
22,476
111,865
535,424
63,784 26,535 51,772
323,567 74,757
300,239 (1,027) 31,108
22,454
31,155
94,887
13,058
8,004
82,455
115,340 54,036
35,043

SECT
Employe
ID (1)
40008
4000940009
40009
40009
4000940009
40009
4000940010
40010
40010
400104001040010
40010
4001040010
40010
4001
TION 4: Appe
p-er
Employ) (2) 89 Divide County Sc
#1 90 Mott/Regent Sch91 United Public Sch
District # 7 92 Kulm Public Sch
District #7 93 Midway Public S
District #128 94 Dunseith School 95 Carrington Schoo
#49 96 Glen Ullin Public
#48 99 Manvel Public Sc00 Maple Valley Sch
District 01 North Border Sch
District # 100 02 Mckenzie Cty Pu
School #1 03 Devils Lake Publ04 Mt Pleasant Scho05 Central Cass Pub
District #7 06 Milnor Public Sc
District #2 07 Mapleton Public 08 Linton Public Sch
District #36 09 Tioga Public Sch
District #15 14 Zeeland Public S
ndices for GASB
yer
EmployPropotionaShar
Allocat(3)
chool Dist 0.0602
ool Dist #1 0.0392hool 0.1013
hool 0.0364
School 0.0589
District #1 0.1200ol District 0.0466
c School 0.0327
chool 0.0170hool 0.0279
hool 0.0483
ublic 0.1817
lic School 0.2877ool Dist #4 0.0378blic School 0.0729
hool 0.0398
School 0.0011hool 0.0534
hool 0.0798
chools 0.0080
B 68 for North D
yer's or-
ate re tion
Net Pension Liability
(4) 270% 409,826
288% 267,152 362% 689,244
408% 247,568
905% 400,544
066% 816,428 617% 316,988
798% 223,021
043% 115,889 907% 189,763
331% 328,643
762% 1,235,951
721% 1,956,454 873% 257,530 954% 496,075
893% 271,266
135% 7,718 471% 363,594
871% 543,109
056% 54,779
Dakota Public Em
Covered
Employee Payroll
1%
(5) 536,934
350,009 903,010
324,355
524,776
1,069,638 415,304
292,190
151,833 248,616
430,571
1,619,282
2,563,249 337,400 649,930
355,395
10,115 476,365
711,556
71,771
mployees Retirem
Discount Rat
% Decrease (7.00%)
CurDisc
Rate (8(6) (7
628,447 4
409,664 21,056,922 6
379,633 2
614,214 4
1,251,952 8486,085 3
341,991 2
177,711 1290,992 1
503,957 3
1,895,268 1,2
3,000,124 1,9394,909 2760,706 4
415,972 2
11,835 557,553 3
832,831 5
84,002
ment System
te Sensitivity
rent ount 8.00%)
1% Increas(9.00%)
7) (8) 409,826 230,9
267,152 150,5689,244 388,4
247,568 139,5
400,544 225,7
816,428 460,0316,988 178,6
223,021 125,6
115,889 65,3189,763 106,9
328,643 185,2
235,951 696,5
956,454 1,102,5257,530 145,1496,075 279,5
271,266 152,8
7,718 4,3363,594 204,9
543,109 306,0
54,779 30,8
se Statutory Required Contrib
(9) 954 40,784
551 26,586 418 68,591
515 24,637
723 39,861
091 81,248 636 31,545
681 22,194
09 11,533 939 18,884
204 32,705
509 122,997
543 194,699 29 25,628
559 49,368
869 26,995
49 768 900 36,183
065 54,048
870 5,451
Schedule of Con
Contribs In Relation to
the Statutory Required Contrib
CoDefic
(Ex(10) (
(38,136)
(28,517) (66,271)
(24,918)
(36,899)
(76,788) (29,570)
(21,634)
(10,810) (17,709)
(33,546)
(138,787)
(209,352) (25,163) (53,170)
(25,556)
(5,268) (36,042)
(54,630)
(5,110)
ntributions
ontrib ciency/
xcess)
Contribas a
Percentaof CoverEmploye
Payroll(11) (12)
2,648 7.6
(1,931) 7.62,320 7.6
(281) 7.6
2,962 7.6
4,460 7.61,975 7.6
560 7.6
723 7.61,175 7.6
(841) 7.6
(15,790) 7.6
(14,653) 7.6 465 7.6
(3,802) 7.6
1,439 7.6
(4,500) 7.6 141 7.6
(582) 7.6
341 7.6
b
ge ed ee l
Propor- tionate
Share of Plan
Pension Expense
(13) 60% 39,067
60% 25,466 60% 65,703
60% 23,600
60% 38,182
60% 77,827 60% 30,217
60% 21,260
60% 11,047 60% 18,089
60% 31,328
60% 117,818
60% 186,500 60% 24,549 60% 47,289
60% 25,859
60% 736 60% 34,660
60% 51,772
60% 5,222
Pension ExpensNet Amortization Deferred Amountfrom Changes in
Proportion and DBetween Employ
Contrib and Proportionate Sha
of Contributions(14) (5,748)
(605) 23,479
4,631
122
(4,645) (5,298)
(52)
(713) (1,054)
(4,271)
36,520
(7,525) 6,882
(3,045)
6,921
(5,333) 5,475
9,796
14
56
se of ts n
Diff er
are s
Total Employer Pension Expense
(15) 33,319
24,861 89,182
28,231
38,304
73,182 24,919
21,208
10,334 17,035
27,057
154,338
178,975 31,431 44,244
32,780
(4,597) 40,135
61,568
5,236

SECT
Employe
ID (1)
4001
4001
4001
4001240012
40012
40012
4001240012
40013
4001340013
40014
40014
40014
40014
40014
40014
40014
TION 4: Appe
p-er
Employ) (2) 17 Garrison Public S
District #51 18 Kenmare Public S
District #28 19 Lewis & Clark Pu
Schools 20 Sw Special Educ21 North Valley Car
Technology Cent22 Dakota Prairie Pu
School 23 Beach Public Sch
District #3 24 Rolette Public Sc25 Drake Public Sch
District 37 New Salem Almo
District #49 38 Max Public Scho39 East Central Spec
Education Unit 40 North Sargent Sc
District #3 41 Wahpeton Public
District 37 42 Medina Public Sc
District #3 43 Pingree-Buchana
District 44 West River Stude
Services 45 Leeds Public Sch
District 6 47 Sawyer Public Sc
ndices for GASB
yer
EmployPropotionaShar
Allocat(3)
School 0.0560
School 0.0469
ublic 0.0438
ation Unit 0.0077reer & ter
0.0175
ublic 0.0640
hool 0.0886
chool 0.0217hool 0.0279
ont School 0.0419
ool 0.0353cial 0.0333
chool 0.0413
c School 0.1532
chool 0.0211
an School 0.0263
ent 0.0069
hool 0.0214
chool 0.0176
B 68 for North D
yer's or-
ate re tion
Net Pension Liability
(4) 091% 381,409
954% 319,279
860% 298,241
756% 52,739 517% 119,113
004% 435,216
656% 602,846
751% 147,903 929% 189,912
968% 285,375
357% 240,422 320% 226,570
357% 281,221
205% 1,041,768
156% 143,857
384% 179,407
990% 47,531
420% 145,652
639% 119,942
Dakota Public Em
Covered
Employee Payroll
1%
(5) 499,699
418,304
390,739
69,101 156,054
570,198
789,817
193,771 248,816
373,881
314,985 296,843
368,437
1,364,873
188,475
235,051
62,270
190,824
157,142
mployees Retirem
Discount Rat
% Decrease (7.00%)
CurDisc
Rate (8(6) (7
584,872 3
489,599 3
457,337 2
80,873 182,653 1
667,382 4
924,434 6
226,802 1291,221 1
437,609 2
368,674 2347,434 2
431,238 2
1,597,499 1,0
220,598 1
275,111 1
72,886
223,351 1
183,925 1
ment System
te Sensitivity
rent ount 8.00%)
1% Increas(9.00%)
7) (8) 381,409 214,9
319,279 179,9
298,241 168,0
52,739 29,7119,113 67,1
435,216 245,2
602,846 339,7
147,903 83,3189,912 107,0
285,375 160,8
240,422 135,4226,570 127,6
281,221 158,4
041,768 587,0
143,857 81,0
179,407 101,1
47,531 26,7
145,652 82,0
119,942 67,5
se Statutory Required Contrib
(9) 940 37,956
927 31,773
071 29,680
721 5,248 25 11,854
262 43,311
729 59,993
50 14,719 024 18,899
821 28,399
488 23,926 682 22,547
479 27,986
079 103,673
069 14,316
03 17,854
786 4,730
081 14,495
592 11,936
Schedule of Con
Contribs In Relation to
the Statutory Required Contrib
CoDefic
(Ex(10) (
(40,937)
(29,787)
(29,095)
(4,920) (10,003)
(45,447)
(56,427)
(15,386) (17,978)
(28,108)
(24,523) (22,021)
(26,232)
(105,652)
(13,419)
(16,735)
(5,407)
(14,153)
(17,839)
ntributions
ontrib ciency/
xcess)
Contribas a
Percentaof CoverEmploye
Payroll(11) (12) (2,981) 7.6
1,986 7.6
585 7.6
328 7.61,851 7.6
(2,136) 7.6
3,566 7.6
(667) 7.6 921 7.6
291 7.6
(597) 7.6 526 7.6
1,754 7.6
(1,979) 7.6
897 7.6
1,119 7.6
(677) 7.6
342 7.6
(5,903) 7.6
b
ge ed ee l
Propor- tionate
Share of Plan
Pension Expense
(13) 60% 36,358
60% 30,435
60% 28,430
60% 5,027 60% 11,354
60% 41,487
60% 57,467
60% 14,099 60% 18,104
60% 27,204
60% 22,918 60% 21,598
60% 26,808
60% 99,307
60% 13,713
60% 17,102
60% 4,531
60% 13,884
60% 11,434
Pension ExpensNet Amortization Deferred Amountfrom Changes in
Proportion and DBetween Employ
Contrib and Proportionate Sha
of Contributions(14)
5,077
5,131
(5,963)
(1,975) 3,525
6,787
8,681
(942) 7,373
234
(132) 9,918
3,429
3,379
(1,208)
(2,604)
116
(351)
(8,857)
57
se of ts n
Diff er
are s
Total Employer Pension Expense
(15) 41,435
35,566
22,467
3,052 14,879
48,274
66,148
13,157 25,477
27,438
22,786 31,516
30,237
102,686
12,505
14,498
4,647
13,533
2,577

SECT
Employe
ID (1)
40014
40014
40015
40015
50000
50000
50000
50000
50000
50000
500005000
5000
5000
50005000
5000
50002
TION 4: Appe
p-er
Employ) (2) 48 Wilmac Multidis
Special Education49 Great Northwest
Cooperative 50 Anamoose Public
District #14 51 South Prairie Sch
District #70 02 Cass County Wat
Resource District03 Walsh County W
Resource District05 Ramsey County S
Conservation Dis06 James River Soil
Conservation Dis07 Burleigh County
Conservation Dis08 Traill County Wa
Resource District09 Grafton Park Dis10 Cass County Soil
Conservation Dis13 Lake Metigoshe R
Service District 16 Greater Ramsey W
District 17 Carnegie Regiona18 Griggs County Pu
Library 19 R & T Water Sup
Commerce Autho22 Consolidated Wa
ndices for GASB
yer
EmployPropotionaShar
Allocat(3)
trict n Unit
0.0754
Education 0.0193
c School 0.0152
hool 0.0494
ter t
0.0225
Water t
0.0036
Soil strict
0.0036
strict 0.0047
Soil strict
0.0190
ater t
0.0114
trict 0.0120l strict
0.0146
Recreation 0.0113
Water 0.0309
al Library 0.0070ublic 0.0034
pply ority
0.0466
aste Ltd 0.0140
B 68 for North D
yer's or-
ate re tion
Net Pension Liability
(4) 410% 512,775
374% 131,740
217% 103,473
416% 336,020
554% 153,363
679% 25,017
681% 25,030
760% 32,367
064% 129,632
423% 77,674
062% 82,020 634% 99,509
337% 77,090
912% 210,196
017% 47,714 479% 23,657
684% 317,443
094% 95,837
Dakota Public Em
Covered
Employee Payroll
1%
(5) 671,814
172,596
135,564
440,239
200,931
32,779
32,797
42,408
169,835
101,766
107,458 130,372
100,997
275,392
62,516 30,996
415,895
125,564
mployees Retirem
Discount Rat
% Decrease (7.00%)
CurDisc
Rate (8(6) (7
786,315 5
202,017 1
158,671 1
515,270 3
235,175 1
38,362
38,383
49,633
198,784 1
119,110
125,773 152,592
118,213
322,326 2
73,168 36,276
486,783 3
146,961
ment System
te Sensitivity
rent ount 8.00%)
1% Increas(9.00%)
7) (8) 512,775 288,9
131,740 74,2
103,473 58,3
336,020 189,3
153,363 86,4
25,017 14,0
25,030 14,1
32,367 18,2
129,632 73,0
77,674 43,7
82,020 46,2 99,509 56,0
77,090 43,4
210,196 118,4
47,714 26,8 23,657 13,3
317,443 178,8
95,837 54,0
se Statutory Required Contrib
(9) 970 51,029
241 13,110
11 10,297
61 33,439
427 15,262
098 2,490
06 2,491
240 3,221
053 12,900
773 7,730
221 8,162 077 9,903
443 7,672
454 20,918
889 4,748 31 2,354
892 31,591
008 9,537
Schedule of Con
Contribs In Relation to
the Statutory Required Contrib
CoDefic
(Ex(10) (
(51,087)
(12,289)
(12,512)
(31,345)
(14,987)
(3,289)
(2,279)
(3,020)
(12,092)
(7,246)
(10,124) (9,533)
(7,191)
(19,608)
(4,451) (2,207)
(31,288)
(9,214)
ntributions
ontrib ciency/
xcess)
Contribas a
Percentaof CoverEmploye
Payroll(11) (12)
(58) 7.6
821 7.6
(2,215) 7.6
2,094 7.6
275 7.6
(799) 7.6
212 7.6
202 7.6
808 7.6
484 7.6
(1,962) 7.6 370 7.6
481 7.6
1,310 7.6
297 7.6 147 7.6
303 7.6
324 7.6
b
ge ed ee l
Propor- tionate
Share of Plan
Pension Expense
(13) 60% 48,881
60% 12,558
60% 9,864
60% 32,031
60% 14,619
60% 2,385
60% 2,386
60% 3,085
60% 12,357
60% 7,404
60% 7,819 60% 9,486
60% 7,349
60% 20,037
60% 4,548 60% 2,255
60% 30,260
60% 9,136
Pension ExpensNet Amortization Deferred Amountfrom Changes in
Proportion and DBetween Employ
Contrib and Proportionate Sha
of Contributions(14) 15,787
3,190
19,151
60,639
166
(394)
78
1,057
3,377
(266)
(2,239) (1,381)
1,830
(453)
342 (2)
1,947
2,992
58
se of ts n
Diff er
are s
Total Employer Pension Expense
(15) 64,668
15,748
29,015
92,670
14,785
1,991
2,464
4,142
15,734
7,138
5,580 8,105
9,179
19,584
4,890 2,253
32,207
12,128

SECT
Employe
ID (1)
50002
50002
5000250002
50003
50003
50003
50003
50003
5000450004
50004
50004
5000450005
50005
50005
50005
TION 4: Appe
p-er
Employ) (2) 23 Walsh County Ho
Authority 24 Williams County
Conservation Dis25 Bowman City Pa28 Williston Housin
Authority 30 Minot Rural Fire
Department 31 Central Plains W
District 33 Ransom County S
Dist 38 Jamestown Regio
Airport 39 Pierce County So
Conservation Dis40 Fargo Park Distri41 Bismarck Rural F
Protection 45 Dunseith Commu
Nursing Home 47 Mercer County S
Conservation Dis49 West Fargo Park 53 Stutsman County
Authority 54 Grand Forks Cou
Resource District55 Southeast Region
Technology Cent56 Cavalier County
Development Au
ndices for GASB
yer
EmployPropotionaShar
Allocat(3)
ousing 0.0032
y Soil strict
0.0030
ark Board 0.0088ng 0.0413
0.0080
Water 0.0202
Soil Cons 0.0094
onal 0.0152
oil strict
0.0000
ict 0.2223Fire 0.0398
unity 0.0968
Soil strict
0.0113
District 0.0963y Housing 0.0090
unty Water t
0.0062
n Career & ter
0.0101
Job uthority
0.0048
B 68 for North D
yer's or-
ate re tion
Net Pension Liability
(4) 299% 22,433
073% 20,896
805% 59,872 377% 281,357
071% 54,881
257% 137,744
457% 64,306
234% 103,589
000% -
350% 1,511,942 827% 270,817
844% 658,523
324% 77,001
366% 655,272 014% 61,294
246% 42,472
158% 69,073
849% 32,972
Dakota Public Em
Covered
Employee Payroll
1%
(5) 29,388
27,380
78,439 368,619
71,904
180,465
84,254
135,713
-
1,980,866 354,808
862,761
100,880
858,506 80,302
55,644
90,495
43,200
mployees Retirem
Discount Rat
% Decrease (7.00%)
CurDisc
Rate (8(6) (7
34,399
32,043
91,811 431,446 2
84,158
211,224 1
98,610
158,848 1
-
2,318,487 1,5415,284 2
1,009,812 6
118,078
1,004,827 693,991
65,128
105,919
50,561
ment System
te Sensitivity
rent ount 8.00%)
1% Increas(9.00%)
7) (8) 22,433 12,6
20,896 11,7
59,872 33,7281,357 158,5
54,881 30,9
137,744 77,6
64,306 36,2
103,589 58,3
-
511,942 852,0270,817 152,6
658,523 371,1
77,001 43,3
655,272 369,2 61,294 34,5
42,472 23,9
69,073 38,9
32,972 18,5
se Statutory Required Contrib
(9) 642 2,232
776 2,079
741 5,958 556 28,000
928 5,462
625 13,708
239 6,399
76 10,309
- -
042 150,463 617 26,951
05 65,534
93 7,663
273 65,210 542 6,100
935 4,227
925 6,874
581 3,281
Schedule of Con
Contribs In Relation to
the Statutory Required Contrib
CoDefic
(Ex(10) (
(2,092)
(5,356)
(5,585) (26,245)
(5,120)
(15,491)
(5,999)
(10,564)
-
(141,237) (25,262)
(69,078)
(7,182)
(60,499) (7,801)
(3,962)
(6,443)
(3,076)
ntributions
ontrib ciency/
xcess)
Contribas a
Percentaof CoverEmploye
Payroll(11) (12)
140 7.6
(3,277) 7.6
373 7.61,755 7.6
342 7.6
(1,783) 7.6
400 7.6
(255) 7.6
- 7.6
9,226 7.61,689 7.6
(3,544) 7.6
481 7.6
4,711 7.6 (1,701) 7.6
265 7.6
431 7.6
205 7.6
b
ge ed ee l
Propor- tionate
Share of Plan
Pension Expense
(13) 60% 2,138
60% 1,992
60% 5,707 60% 26,820
60% 5,232
60% 13,131
60% 6,130
60% 9,875
60% -
60% 144,127 60% 25,816
60% 62,774
60% 7,340
60% 62,464 60% 5,843
60% 4,049
60% 6,584
60% 3,143
Pension ExpensNet Amortization Deferred Amountfrom Changes in
Proportion and DBetween Employ
Contrib and Proportionate Sha
of Contributions(14)
(133)
(1,130)
5,181 (141)
(8)
(4,415)
(357)
(6,350)
-
27,784 973
(7,013)
3,249
2,226 635
(161)
(85)
104
59
se of ts n
Diff er
are s
Total Employer Pension Expense
(15) 2,005
862
10,888 26,679
5,224
8,716
5,773
3,525
-
171,911 26,789
55,761
10,589
64,690 6,478
3,888
6,499
3,247

SECT
Employe
ID (1)
50005
5000550006
50006
5000650006
5000750008
50008
5000850008
50008
50009
50010
50010
50010
50015001
5001
TION 4: Appe
p-er
Employ) (2) 57 Barnes County S
Conservation Dis59 Traill Rural Wate60 Devils Lake Basi
Water Resource B61 Ward County Wa
Resource District63 Southwest Water68 Burleigh County
On Aging 72 Watford City Par80 Western & Centr
Soil Conservation81 Ramsey County H
Authority 82 Grand Forks Pub84 Rolette County S
Conservation Dis85 Jamestown Parks
Recreation Distri91 Ramsey County W
Resource District07 Grand Forks-E G
Metropolitan Plan08 North Dakota Fir
Association 09 James River Vall
System 10 Grand Forks Park11 Mcintosh County
Authority 13 Lonetree Special
Unit
ndices for GASB
yer
EmployPropotionaShar
Allocat(3)
oil strict
0.0117
er District 0.0042in Joint Board
0.0051
ater t
0.0037
r Authority 0.2426Council 0.0563
rk District 0.0141ral Stark n District
0.0103
Housing 0.0216
lic Library 0.0586Soil strict
0.0032
s And ict
0.0134
Water t
0.0018
Grand Forks nning
0.0259
refighters 0.0196
ley Library 0.0277
k District 0.1630y Housing 0.0039
Education 0.0073
B 68 for North D
yer's or-
ate re tion
Net Pension Liability
(4) 710% 79,626
235% 28,797 137% 34,931
756% 25,540
674% 1,650,142 381% 383,381
103% 95,898 330% 70,242
612% 146,958
679% 399,007 233% 21,984
450% 91,458
890% 12,852
976% 176,632
609% 133,338
713% 188,444
035% 1,108,610 937% 26,771
390% 50,251
Dakota Public Em
Covered
Employee Payroll
1%
(5) 104,321
37,730 45,764
33,461
2,161,934 502,288
125,639 92,030
192,540
522,755 28,800
119,821
16,836
231,415
174,689
246,891
1,452,445 35,070
65,836
mployees Retirem
Discount Rat
% Decrease (7.00%)
CurDisc
Rate (8(6) (7
122,102
44,159 53,565
39,165
2,530,410 1,6587,896 3
147,055 107,713
225,353 1
611,858 333,711
140,246
19,707
270,857 1
204,467 1
288,969 1
1,699,998 1,141,052
77,057
ment System
te Sensitivity
rent ount 8.00%)
1% Increas(9.00%)
7) (8) 79,626 44,8
28,797 16,2 34,931 19,6
25,540 14,3
650,142 929,9383,381 216,0
95,898 54,0 70,242 39,5
146,958 82,8
399,007 224,8 21,984 12,3
91,458 51,5
12,852 7,2
176,632 99,5
133,338 75,1
188,444 106,1
108,610 624,7 26,771 15,0
50,251 28,3
se Statutory Required Contrib
(9) 873 7,924
228 2,866 685 3,476
93 2,542
923 164,216 051 38,153
042 9,543 584 6,990
817 14,625
857 39,708 89 2,188
540 9,102
242 1,279
540 17,578
41 13,269
96 18,753
748 110,325 087 2,664
18 5,001
Schedule of Con
Contribs In Relation to
the Statutory Required Contrib
CoDefic
(Ex(10) (
(7,428)
(5,192) (3,258)
(2,382)
(175,694) (37,666)
(9,871) (6,553)
(13,709)
(37,465) (2,221)
(8,400)
(1,199)
(18,320)
(12,438)
(20,246)
(109,681) (2,497)
(4,688)
ntributions
ontrib ciency/
xcess)
Contribas a
Percentaof CoverEmploye
Payroll(11) (12)
496 7.6
(2,326) 7.6 218 7.6
160 7.6
(11,478) 7.6 487 7.6
(328) 7.6 437 7.6
916 7.6
2,243 7.6 (33) 7.6
702 7.6
80 7.6
(742) 7.6
831 7.6
(1,493) 7.6
644 7.6 167 7.6
313 7.6
b
ge ed ee l
Propor- tionate
Share of Plan
Pension Expense
(13) 60% 7,590
60% 2,745 60% 3,330
60% 2,435
60% 157,301 60% 36,546
60% 9,142 60% 6,696
60% 14,009
60% 38,036 60% 2,096
60% 8,718
60% 1,225
60% 16,838
60% 12,711
60% 17,964
60% 105,679 60% 2,552
60% 4,790
Pension ExpensNet Amortization Deferred Amountfrom Changes in
Proportion and DBetween Employ
Contrib and Proportionate Sha
of Contributions(14)
437
(6,544) (184)
(268)
23,074 619
1,104 (167)
1,782
8,562 (574)
3,226
71
(4,350)
130
3,624
30,742 (340)
567
60
se of ts n
Diff er
are s
Total Employer Pension Expense
(15) 8,027
(3,799) 3,146
2,167
180,375 37,165
10,246 6,529
15,791
46,598 1,522
11,944
1,296
12,488
12,841
21,588
136,421 2,212
5,357

SECT
Employe
ID (1)
5001
5001
5001
50012
50012
TION 4: Appe
p-er
Employ) (2) 14 Roughrider Educ
Services Program16 Western Area Wa
Supply Authority17 Red River Joint W
Resource District20 Tri-Cities Joint Jo
Development Au21 Devils Lake Park
Total Allocation
ndices for GASB
yer
EmployPropotionaShar
Allocat(3)
cation m (RESP)
0.0044
ater y
0.0909
Water t
0.0000
ob uthority
0.0096
k Board 0.0137n: 99.9999
B 68 for North D
yer's or-
ate re tion
Net Pension Liability
(4) 493% 30,552
968% 618,567
000% -
618% 65,401
722% 93,307 999% $679,982,929
Dakota Public Em
Covered
Employee Payroll
1%
(5) 40,030
810,415
-
85,689
122,242 $890,878,679 $1,
mployees Retirem
Discount Rat
% Decrease (7.00%)
CurDisc
Rate (8(6) (7
46,849
948,541 6
-
100,289
143,082 042,719,782 $679,9
ment System
te Sensitivity
rent ount 8.00%)
1% Increas(9.00%)
7) (8) 30,552 17,2
618,567 348,5
-
65,401 36,8
93,307 52,5982,929 $383,198,6
se Statutory Required Contrib
(9) 217 3,040
588 61,557
- -
856 6,508
583 9,286 601 $67,669,360
Schedule of Con
Contribs In Relation to
the Statutory Required Contrib
CoDefic
(Ex(10) (
(2,850)
(56,913)
(4,747)
(6,724)
(8,704) $(67,569,914)
ntributions
ontrib ciency/
xcess)
Contribas a
Percentaof CoverEmploye
Payroll(11) (12)
190 7.6
4,644 7.6
(4,747) 7.6
(216) 7.6
582 7.6$99,446 7.6
b
ge ed ee l
Propor- tionate
Share of Plan
Pension Expense
(13) 60% 2,912
60% 58,965
60% -
60% 6,234
60% 8,895 0% $64,819,777
Pension ExpensNet Amortization Deferred Amountfrom Changes in
Proportion and DBetween Employ
Contrib and Proportionate Sha
of Contributions(14)
2,795
47,812
(10,927)
3,688
16,838 $(16,633)
61
se of ts n
Diff er
are s
Total Employer Pension Expense
(15) 5,707
106,777
(10,927)
9,922
25,733 $64,803,144

SECT
APPSchJud
EmploID
(1
01800
TION 4: Appe
PENDIX B edule of Pensioges System
oyer D Employe
1) (2)
00 ND Supreme C
Total Allocatio
ndices for GASB
n Amounts by E
r
Employer'sProportiona
Share Allocation
(3)
Court 100.000000%
on 100.000000%
B 68 for North D
Employer as of J
s ate
n Net Pension
Liability
(4)
% $(4,755,969)
% $(4,755,969)
Dakota Public Em
June 30, 2015
Covered Employee
Payroll
1%Decr(7.0
(5) (6
$6,746,660 $(997,
$6,746,660 $(997,
mployees Retirem
Discount Rate Sen
% ease 0%)
Current Discount
Rate (8.00%)
) (7)
,827) $(4,755,969)
,827) $(4,755,969)
ment System
nsitivity
1% Increase (9.00%)
StaReCb
(8)
$(7,999,811) $1,2
$(7,999,811) $1,2
Sche
atutory quired ontri-ution
ContribsIn Relatio
to the StatutorRequire
Contribut
(9) (10)
225,358 $(1,223,3
225,358 $(1,223,3
edule of Contributio
s on
ry d ion
Contribution Deficiency/
(Excess)
(11)
372) $1,986
372) $1,986
ons
Contributions as a
Percentage of Covered
Employee Payroll
(12)
18.16%
18.16%
Proportionate Share of Plan
Pension Expense
NeDf
BC
Pro
(13)
$(321,437)
$(321,437)
Pension Expense
et Amortization of Deferred Amounts from Changes in Proportion and
Differences Between Employer Contributions and roportionate Share of Contributions
(14)
$(507)
$(507)
62
Total Employer Pension Expense
(15)
$(321,944)
$(321,944)

SECT
APPSchNati
EmploID
(1
05400
TION 4: Appe
PENDIX B edule of Pensioional Guard Sys
oyer D Employe
1) (2)
00 National Guard
Total Allocatio
ndices for GASB
n Amounts by Etem
r
Employer'sProportiona
Share Allocation
(3)
d 100.000000%
on 100.000000%
B 68 for North D
Employer as of J
s ate
n Net Pension
Liability
(4)
% $(449,713)
% $(449,713)
Dakota Public Em
June 30, 2015
Covered Employee
Payroll
1%Decr(7.0
(5) (6
$629,811 $(165
$629,811 $(165
mployees Retirem
Discount Rate Sen
% ease 0%)
Current Discount
Rate (8.00%)
6) (7)
,258) $(449,713)
,258) $(449,713)
ment System
nsitivity
1% Increase (9.00%)
StaReCb
(8)
$(678,349) $
$(678,349) $
Sche
atutory quired ontri-ution
ContribsIn Relatio
to the StatutorRequire
Contribut
(9) (10)
$55,457 $(55,173
$55,457 $(55,173
edule of Contributio
s on
ry d ion
Contribution Deficiency/
(Excess)
(11)
3) $284
3) $284
ons
Contributions as a
Percentage of Covered
Employee Payroll
(12)
8.81%
8.81%
Proportionate Share of Plan
Pension Expense
NeDf
BC
Pro
(13)
$(187,788)
$(187,788)
Pension Expense
et Amortization of Deferred Amounts from Changes in Proportion and
Differences Between Employer Contributions and roportionate Share of Contributions
(14)
$(133)
$(133)
63
Total Employer Pension Expense
(15)
$(187,921)
$(187,921)

SECT
APPSchLaw
EmploID
(1
01250
200020002000220002200032000720010300003000030000300030002300023000230004300043000530005
TION 4: Appe
PENDIX B edule of Pensio
w Enforcement S
oyer D Employe
1) (2)
00 Attorney GenerOffice
10 City Of Cavalie16 City Of Ellenda28 City Of Thomp29 City Of Willist30 City Of Bowm70 City Of Powers03 City Of Burling01 Adams County03 Benson County06 Bowman Coun13 Dunn County 20 Griggs County 27 Mckenzie Coun28 Mclean County44 Slope County 45 Stark County 51 Ward County 53 Williams Coun
Total Allocatio
ndices for GASB
n Amounts by ESystem with Prio
er
EmployProportio
ShareAllocat
(3)
ral's 18.05054
er 0.70232ale 0.33961pson 0.00000ton 15.11146an 1.23153s Lake 0.77639gton 0.47767
y 0.68187y 1.09104nty 1.34135
6.063580.73146
nty 6.39235y 4.24079
0.689806.89729
14.57446nty 20.60640
on: 100.00000
B 68 for North D
Employer as of Jor Main Service
yer's onate e tion
Net Pension Liability
(4)
44% $1,096,664
25% 42,670 7% 20,633
00% -62% 918,100 38% 74,822 97% 47,170 76% 29,021 77% 41,428 45% 66,287 59% 81,495 86% 368,394 67% 44,440 53% 388,369 96% 257,650 06% 41,909 93% 419,046 60% 885,474 00% 1,251,946
01% $6,075,518
Dakota Public Em
June 30, 2015
Covered Employee
Payroll
1Dec(7.
(5)
$2,517,267 $1,
102,937 49,779
- 2,214,803 1,
180,503 113,792
70,014 99,941
159,912 196,596 888,701 107,208 936,891 621,552 101,105
1,010,892 2,136,092 1, 3,020,167 2,
$14,528,152 $10,
mployees Retirem
Discount Rate Se
1% crease 00%)
Current Discount
Rate (8.00%)
(6) (7)
834,583 $1,096,664
71,381 42,670 34,517 20,633
- -535,867 918,100 125,168 74,822 78,910 47,170 48,549 29,021 69,303 41,428 110,889 66,287 136,330 81,495 616,278 368,394 74,343 44,440 649,692 388,369 431,017 257,650 70,109 41,909 701,012 419,046 481,288 885,474 094,349 1,251,946
163,585 $6,075,518
ment System
ensitivity
1% Increase (9.00%)
StatReqCobu
(8) (
$498,193 $2
19,384 9,373
- 417,074 2 33,990 21,428 13,184 18,820 30,113 37,021 167,354 20,188 176,428 1117,045 19,039 190,364 1402,253 2568,734 3
$2,759,985 $1,58
Sche
tutory quired ontri-
tion
ContributioIn Relationthe Statut
RequireContribut
(9) (10)
285,727 $(272,8
11,117 (15,05,376 (6,5
- (3,7239,203 (250,619,494 (17,712,290 (11,1
7,561 (8,710,794 (15,817,270 (1,321,233 (19,295,982 (89,911,579 (13,7
101,186 (124,367,129 (75,510,919 (9,9
109,179 (130,4230,703 (240,6326,184 (315,6
82,926 $(1,623,0
edule of Contributio
ons n to ory d ion
ContributionDeficiency/
(Excess)
(11)
831) $12,896
062) (3,945)512) (1,136)746) (3,746)603) (11,400)707) 1,787 163) 1,127 724) (1,163)810) (5,016)330) 15,940 286) 1,947 910) 6,072 795) (2,216)379) (23,193)503) (8,374)919) 1,000 443) (21,264)653) (9,950)677) 10,507
053) $(40,127)
ons
n
Contributions as a
Percentage of Covered
Employee Payroll
(12)
10.31%
9.81% 9.81% 9.81% 9.81% 9.81% 9.81% 9.81% 9.81% 9.81% 9.81% 9.81% 9.81% 9.81% 9.81% 9.81% 9.81% 9.81% 9.81%
Proportionate Share of Plan
Pension Expense
N
B
P
(13)
$184,538
7,180 3,472
- 154,491 12,591
7,937 4,883 6,971
11,154 13,713 61,990
7,478 65,352 43,355
7,052 70,514
149,001 210,668
$1,022,340
Pension Expense
Net Amortization of Deferred Amounts from Changes in Proportion and
Differences Between Employer Contributions and
Proportionate Share of Contributions
(14)
$(29,112)
(4,631) (2,743) (4,150) (1,784) 1,110 3,526
(2,168) (1,431) 10,157
1,645 20,599 (6,044) 42,087 (1,123) 3,013
(12,082) (23,188) 13,040
$6,721
64
Total Employer Pension Expense
(15)
$155,426
2,549 729
(4,150) 152,707
13,701 11,463
2,715 5,540
21,311 15,358 82,589
1,434 107,439
42,232 10,065 58,432
125,813 223,708
$1,029,061

SECT
APPSchLaw
EmploID
(1
200092001300003000330004
TION 4: Appe
PENDIX B edule of Pensio
w Enforcement S
oyer D Employe
1) (2)
97 City Of Devils 18 City of Berthol02 Barnes County 30 Morton County40 Rolette County
Total Allocatio
ndices for GASB
n Amounts by ESystem without P
er
EmployerProportion
Share Allocatio
(3)
Lake 16.710450%ld 1.374154%
18.084260%y 46.434907%y 17.396229%
on: 100.000000%
B 68 for North D
Employer as of JPrior Main Servic
r's nate
on
Net Pension Liability
(4)
% $(19,557) % (1,608) % (21,165) % (54,345) % (20,360)
% $(117,035) $
Dakota Public Em
June 30, 2015 ce
Covered Employee
Payroll
1%Decre(7.00
(5) (6
$631,083 $48,4 51,896 3,
682,966 52,4 1,753,650 134,
656,982 50,4
$3,776,577 $289,
mployees Retirem
Discount Rate Sen
% ease 0%)
Current Discount
Rate (8.00%)
) (7)
431 $(19,557) 983 (1,608) 413 (21,165) 580 (54,345) 419 (20,360)
826 $(117,035)
ment System
sitivity
1% Increase (9.00%)
StatReqCobu
(8) (
$(68,998) $51 (5,674) 4
(74,671) 55 (191,733) 143
(71,830) 53
$(412,906) $309
Sche
tutory quired ontri-
tion
ContributioIn Relationthe Statut
RequireContribut
9) (10)
1,705 $(56,6154,252 (4,1155,956 (54,5343,678 (146,6403,827 (55,411
9,418 $(317,315
edule of Contributio
ons n to ory d ion
ContributionDeficiency/
(Excess)
(11)
5) $ (4,910) 5) 137 4) 1,422 0) (2,962) 1) (1,584)
5) $(7,897)
ons
n
Contributions as a
Percentage of Covered
Employee Payroll
(12)
8.19% 8.19% 8.19% 8.19% 8.19%
Proportionate Share of Plan
Pension Expense
N
B
P
(13)
$41,935 3,448 45,383
116,529 43,656
$250,951
Pension Expense
Net Amortization of Deferred Amounts from Changes in Proportion and
Differences Between Employer Contributions and
Proportionate Share of Contributions
(14)
$(998) (306)
445 1,588
480
$1,209
65
Total Employer Pension Expense
(15)
$40,937 3,142
45,828 118,117 44,136
$252,160

SECT
APPESchedMain S
Employer ID
(1)
10100 10800 11000
11200
11700 11800 12000 12500 12700 13000 14000
16000 18000 18800
19000
19200
20100
TION 4: Appe
NDIX C dule of Deferred System
r Employer
(2)
Governor's Office Secretary Of State Office Of ManagemeBudget Information TechnoloDept State Auditor's OfficeCentral Services State Treasurer's OffiAttorney General's OTax Department Facility ManagementOffice Of AdministraHearings Legislative Council ND Supreme Court Commission On LegaCounsel For IndigentRetirement & InvestmOffice ND Public EmployeeRetirement System Public Instruction
ndices for GASB
Inflows and Ou
Diff Between Expected
and Actual Experience
PaInE
P
(3)
$21,069 25,408
nt & 54,268
ogy 466,052
e 70,407 25,511
ice 6,979 ffice 213,280
139,792 45,943
ative 5,601
41,326 379,035
al s
40,156
ment 28,712
s 35,179
106,961
B 68 for North D
tflows of Resou
Deferred InflowNet Diff
Between Projected
and Actual nvestment arnings on Pension
Plan Invest-ments
Chgs oAssumptions
(4) (5)
$83,914 $- 101,198 - 216,144 -
1,856,224 -
280,424 - 101,609 -
27,797 - 849,468 - 556,774 - 182,984 -
22,306 -
164,598 - 1,509,648 - 159,936 -
114,357 -
140,115 -
426,012 -
Dakota Public Em
urces by Employ
ws of Resources
of m-s
Changes in Proportion
and Diff Between Employer Contrib & Propor-
tionate Share of Contribs
ToOR
(6)
$52,041 5,508
-
-
4,418 18,162
3,585 -
11,676 -
3,159
134,456 3,728
21,149
145,648
4,148
93,036
mployees Retirem
yer as of June 30
otal Deferred Outflows of Resources
DiffBetweExpec
and AcExperie
(7) (8)
$157,024 132,114 270,412
2,322,276
355,249 145,282 38,361
1,062,748 708,242 228,927 31,066
340,380 1,892,411
221,241
288,717
179,442
626,009
ment System
0, 2015
Deferre
f een cted ctual ence
Net Diff Between Projected
and Actual Investment Earnings on Pension Plan Investments
(9)
$- $(99,245)- (119,686)- (255,631)
- (2,195,343)
- (331,655)- (120,172)- (32,875)- (1,004,659)- (658,493)- (216,414)- (26,381)
- (194,669)- (1,785,450)- (189,156)
- (135,249)
- (165,713)
- (503,841)
d Outflows of Resou
Changes of Assump-
tions
ChangPropo
and BetwEmplContProp
tionateof Co
(10) (1
$(64,704) $(78,030) (19
(166,661) (
(1,431,271) (57
(216,225) (17(78,347)(21,433)
(654,996) (5(429,309) (24(141,093) (4
(17,200)
(126,916)(1,164,038) (4
(123,322)
(88,177)
(108,038) (15
(328,483)
urces ges in ortion Diff
ween loyer rib & por-
e Share ontrib
Total DeferreInflows of Resources
1) (12)
$(2,358) $(166,30799,175) (396,89187,831) (510,123
73,241) (4,199,855
72,211) (720,091(1,106) (199,625(4,161) (58,46954,504) (1,714,15943,650) (1,331,45248,371) (405,878
(701) (44,282
(5,948) (327,53319,119) (3,368,607
- (312,478
(3,513) (226,939
52,445) (426,196
(9,781) (842,105
Def ed
f s 2016
(13)
7) $(9,687)1) (62,602)3) (68,284)
5) (550,065)
1) (99,404)5) (20,384)9) (6,628)9) (209,995)2) (177,047)8) (52,591)2) (4,734)
3) (12,764)7) (437,157)8) (33,230)
9) 1,746
6) (62,611)
5) (83,107)
ferred Inflows/(OutflPension Exp
2017 2018
(14) (15)
$(9,687) $(9(62,602) (62(68,284) (68
(550,065) (550
(99,404) (99(20,384) (20
(6,628) (6(209,995) (209(177,047) (177
(52,591) (52(4,734) (4
(12,764) (12(437,157) (437
(33,230) (33
1,746 1
(62,611) (62
(83,107) (83
lows) Recognized Inpense (Year Ended J
8 2019
(16)
9,687) $21,992 2,602) (24,399) 8,284) 13,313
0,065) 150,684
9,404) 6,460 0,384) 17,974 6,628) 3,865 9,995) 110,690 7,047) 33,142 2,591) 16,488 4,734) 3,687
2,764) 49,374 7,157) 132,755 3,230) 27,148
1,746 44,917
2,611) (9,716)
3,107) 77,718
66
n Future June 30):
2020 There-after
(17) (18)
$(2,225) $ - (52,550) - (48,176) -
(378,165) -
(73,073) - (11,168) -
(4,073) - (132,240) - (125,166) -
(35,674) - (2,706) -
1,745 - (297,462) -
(18,664) -
11,613 -
(49,187) -
(44,534) -
e r

SECT
Employer ID
(1)
20200
21500
22300
22400 22600 22700 22800
22900 23000
23500
23800 23900
24000 24100 24200
25000 25200
25300 26100 27000
TION 4: Appe
r Employer
(2)
Education Standards Practice ND University SystemOffice ND Youth CorrectionCenter Juvenile Services - DLand Department Bismarck State CollegLake Region State College Williston State CollegUniversity Of North Dakota North Dakota State University ND St College Of SciDickinson State University Mayville State UniveMinot State UniversitValley City State University ND State Library SCHOOL FOR THE DEAF School For The BlindND Board Of NursingCareer & Technical Education
ndices for GASB
Diff Between Expected
and Actual Experience
PaInE
P
(3)
& 8,622
m 12,708
nal 67,068
OCR 30,407 34,680
ge 87,459 41,204
ge 24,835 889,250
697,956
ience 122,792 55,673
rsity 58,198 ty 120,587
39,833
26,797 22,315
d 12,413 g 7,286
20,700
B 68 for North D
Deferred InflowNet Diff
Between Projected
and Actual nvestment arnings on Pension
Plan Invest-ments
Chgs oAssumptions
(4) (5)
34,341 -
50,616 -
267,125 -
121,109 - 138,127 - 348,338 - 164,109 -
98,916 - 3,541,767 -
2,779,868 -
489,064 - 221,740 -
231,793 - 480,284 - 158,649 -
106,730 - 88,879 -
49,441 - 29,021 - 82,447 -
Dakota Public Em
ws of Resources
of m-s
Changes in Proportion
and Diff Between Employer Contrib & Propor-
tionate Share of Contribs
ToOR
(6)
-
2,159
13,325
3,941 1,389
102,526 1,557
5,398 -
-
- 75,138
181,818 -
62,336
- 5,434
5,077 21,574 30,815
mployees Retirem
otal Deferred Outflows of Resources
DiffBetweExpec
and AcExperie
(7) (8)
42,963
65,483
347,518
155,457 174,196 538,323 206,870
129,149 4,431,017
3,477,824
611,856 352,551
471,809 600,871 260,818
133,527 116,628
66,931 57,881 133,962
ment System
Deferre
f een cted ctual ence
Net Diff Between Projected
and Actual Investment Earnings on Pension Plan Investments
(9)
- (40,615)
- (59,863)
- (315,927)
- (143,235)- (163,361)- (411,977)- (194,091)
- (116,987)- (4,188,823)
- (3,287,730)
- (578,413)- (262,251)
- (274,140)- (568,028)- (187,633)
- (126,229)- (105,117)
- (58,473)- (34,323)- (97,509)
d Outflows of Resou
Changes of Assump-
tions
ChangPropo
and BetwEmplContProp
tionateof Co
(10) (1
(26,479)
(39,028) (2
(205,971)
(93,383) (3(106,505)(268,592) ((126,539) (2
(76,271)(2,730,936) (83
(2,143,461) (30
(377,101) (20(170,976)
(178,728)(370,330) (9(122,329)
(82,296) ((68,532) (10
(38,122) (10(22,377)(63,572) (30
urces ges in ortion Diff
ween loyer rib & por-
e Share ontrib
Total DeferreInflows of Resources
1) (12)
(4,941) (72,035
23,085) (121,976
(1,986) (523,884
36,508) (273,126(2,698) (272,56412,062) (692,63121,197) (341,827
(2,624) (195,88230,163) (7,749,922
05,457) (5,736,648
00,545) (1,156,059(4,574) (437,801
(7,505) (460,37390,351) (1,028,709(3,005) (312,967
13,625) (222,15009,821) (283,470
01,764) (198,359(1,303) (58,00307,491) (468,572
Def ed
f s 2016
(13)
5) (9,039)
6) (16,062)
4) (60,317)
6) (34,918)4) (32,629)1) (63,459)7) (42,399)
2) (22,621)2) (996,620)
8) (712,725)
9) (154,869)1) (37,790)
3) (19,312)9) (130,684)7) (25,262)
0) (27,744)0) (41,789)
9) (31,000)3) (2,730)2) (74,876)
ferred Inflows/(OutflPension Exp
2017 2018
(14) (15)
(9,039) (9
(16,062) (16
(60,317) (60
(34,918) (34(32,629) (32(63,459) (63(42,399) (42
(22,621) (22(996,620) (996
(712,725) (712
(154,869) (154(37,790) (37
(19,312) (19(130,684) (130
(25,262) (25
(27,744) (27(41,789) (41
(31,000) (31(2,730) (2
(74,876) (74
lows) Recognized Inpense (Year Ended J
8 2019
(16)
9,039) 3,925
6,062) 3,047
0,317) 40,527
4,918) 10,803 2,629) 19,515 3,459) 68,043 2,399) 19,555
2,621) 14,721 6,620) 340,444
2,725) 336,712
4,869) 29,759 7,790) 45,920
9,312) 68,193 0,684) 50,630 5,262) 34,630
7,744) 12,548 1,789) (8,235)
1,000) (12,336) 2,730) 8,225 4,876) (43,751)
67
n Future June 30):
2020 There-after
(17) (18)
(5,888) -
(11,344) -
(35,951) -
(23,699) - (19,990) - (32,022) - (27,308) -
(13,567) - (669,633) -
(457,574) -
(109,384) - (17,820) -
1,147 - (86,423) - (11,007) -
(17,948) - (33,219) -
(26,074) - (163) -
(66,105) -
e r

SECT
Employer ID
(1)
30100 30500
31000
31200
31300 31600
32100
32500
36000
38000 40100 40500 40600 40800
41200 41300
41400 42600
42700
TION 4: Appe
r Employer
(2)
ND Department Of HTobaccoPrevention/ Control Committee Life Skills and TransiCenter North Dakota State Hospital ND Veterans Home Indian Affairs Commission Veterans Affairs Department Department Of HumaServices Protection & AdvocaProject Job Service North DaInsurance DepartmenIndustrial CommissioND Department Of LPublic Service Commission Aeronautics CommissDepartment Of FinanInstitutions ND Securities DepartState Board Of Law Examiners ND State Board Of Cosmetology
ndices for GASB
Diff Between Expected
and Actual Experience
PaInE
P
(3)
Health 389,775 12,383
ition 283,051
389,623
95,973 6,196
7,211
an 1,401,633
cy 35,912
akota 216,794 nt 45,962 on 129,753 Labor 10,628
60,691
sion 7,106 ncial 44,374
tment 11,614 7,496
1,301
B 68 for North D
Deferred InflowNet Diff
Between Projected
and Actual nvestment arnings on Pension
Plan Invest-ments
Chgs oAssumptions
(4) (5)
1,552,423 - 49,320 -
1,127,358 -
1,551,819 -
382,246 - 24,678 -
28,720 -
5,582,523 -
143,034 -
863,462 - 183,062 - 516,788 -
42,330 - 241,724 -
28,301 - 176,736 -
46,259 - 29,854 -
5,180 -
Dakota Public Em
ws of Resources
of m-s
Changes in Proportion
and Diff Between Employer Contrib & Propor-
tionate Share of Contribs
ToOR
(6)
- 189,236
11,875
45,753
14,763 59
5,299
8,461
-
- 29,022
131,389 7,014
-
66,854 38,285
29,225 2,169
-
mployees Retirem
otal Deferred Outflows of Resources
DiffBetweExpec
and AcExperie
(7) (8)
1,942,198 250,939
1,422,284
1,987,195
492,982 30,933
41,230
6,992,617
178,946
1,080,256 258,046 777,930 59,972 302,415
102,261 259,395
87,098 39,519
6,481
ment System
Deferre
f een cted ctual ence
Net Diff Between Projected
and Actual Investment Earnings on Pension Plan Investments
(9)
- (1,836,040)- (58,330)
- (1,333,318)
- (1,835,326)
- (452,080)- (29,187)
- (33,967)
- (6,602,411)
- (169,166)
- (1,021,210)- (216,506)- (611,201)- (50,063)- (285,885)
- (33,472)- (209,024)
- (54,710)- (35,308)
- (6,127)
d Outflows of Resou
Changes of Assump-
tions
ChangPropo
and BetwEmplContProp
tionateof Co
(10) (1
(1,197,021) (3(38,029)
(869,267)
(1,196,555) (34
(294,737)(19,029)
(22,145)
(4,304,494) (87
(110,289) (2
(665,786) (40(141,153)(398,477) (
(32,639)(186,385) (3
(21,822)(136,275)
(35,668)(23,019) (
(3,994)
urces ges in ortion Diff
ween loyer rib & por-
e Share ontrib
Total DeferreInflows of Resources
1) (12)
38,701) (3,071,762(5,636) (101,995
(6,422) (2,209,007
40,772) (3,372,653
- (746,817(4,445) (52,661
- (56,112
79,897) (11,786,802
28,047) (307,502
02,079) (2,089,075(2,000) (359,65915,925) (1,025,603
0 (82,70237,063) (509,333
(1,048) (56,342(1,895) (347,194
(4,044) (94,42214,940) (73,267
(496) (10,617
Def ed
f s 2016
(13)
2) (371,542)5) 25,310
7) (263,072)
3) (422,868)
7) (86,605)1) (6,663)
2) (5,666)
2) (1,483,104)
2) (39,148)
5) (283,069)9) (37,470)3) (97,911)2) (8,511)3) (64,084)
2) 6,582 4) (34,105)
2) (5,783)7) (9,559)
7) (1,314)
ferred Inflows/(OutflPension Exp
2017 2018
(14) (15)
(371,542) (37125,310 25
(263,072) (263
(422,868) (422
(86,605) (86(6,663) (6
(5,666) (5
(1,483,104) (1,483
(39,148) (39
(283,069) (283(37,470) (37(97,911) (97
(8,511) (8(64,084) (64
6,582 6(34,105) (34
(5,783) (5(9,559) (9
(1,314) (1
lows) Recognized Inpense (Year Ended J
8 2019
(16)
1,542) 214,519 5,310 43,929
3,072) 162,521
2,868) 162,964
6,605) 57,698 6,663) 2,654
5,666) 5,176
3,104) 624,372
9,148) 14,849
3,069) 42,900 7,470) 31,639 7,911) 97,184 8,511) 7,469 4,084) 27,170
6,582 17,266 4,105) 32,615
5,783) 11,680 9,559) 1,711
1,314) 642
68
n Future June 30):
2020 There-after
(17) (18)
(229,519) - 29,060 -
(160,052) -
(279,630) -
(51,717) - (4,392) -
(3,062) -
(969,209) -
(25,973) -
(202,518) - (20,852) - (51,191) -
(4,663) - (41,859) -
8,904 - (18,103) -
(1,669) - (6,841) -
(839) -
e r

SECT
Employer ID
(1)
42800 47100 47200 47300 47500
48500
50200 50400 51700
51800
51900 52000 53000
54000
60100 60200 60700 60800 61100 61400
TION 4: Appe
r Employer
(2)
ND State Plumbing BBank Of North DakotPublic Finance AuthoHousing Finance AgeMill & Elevator Association Workforce Safety & Insurance Field Services DivisioHighway Patrol Department Of Corrections TransitioServices James River CorrectioCtr State Penitentiary Rough Rider IndustriDepartment Of Corrections And Rehabilitation Adjutant General NDNational Guard Department Of CommDept Of Agriculture Milk Marketing BoarND Oilseed Council ND Soybean CouncilND Corn Utilization Council
ndices for GASB
Diff Between Expected
and Actual Experience
PaInE
P
(3)
Board 6,638 ta 196,376 ority 3,529 ency 48,025
171,218
182,261
on 131,095 40,809
nal 38,696
onal 133,653
194,851 es 30,053
138,860
D 205,275
merce 72,352 78,632
rd 4,170 55
8,223 2,454
B 68 for North D
Deferred InflowNet Diff
Between Projected
and Actual nvestment arnings on Pension
Plan Invest-ments
Chgs oAssumptions
(4) (5)
26,438 - 782,142 -
14,056 - 191,278 - 681,940 -
725,920 -
522,133 - 162,538 - 154,120 -
532,324 -
776,065 - 119,696 - 553,061 -
817,586 -
288,170 - 313,179 -
16,607 - 221 -
32,752 - 9,775 -
Dakota Public Em
ws of Resources
of m-s
Changes in Proportion
and Diff Between Employer Contrib & Propor-
tionate Share of Contribs
ToOR
(6)
- 70,982
1,452 -
313,016
-
- -
8,597
21,385
41,282 -
99,213
172,643
- 1,309
- 1,727 1,064
13,313
mployees Retirem
otal Deferred Outflows of Resources
DiffBetweExpec
and AcExperie
(7) (8)
33,076 1,049,500
19,037 239,303
1,166,174
908,181
653,228 203,347 201,413
687,362
1,012,198 149,749 791,134
1,195,504
360,522 393,120 20,777
2,003 42,039 25,542
ment System
Deferre
f een cted ctual ence
Net Diff Between Projected
and Actual Investment Earnings on Pension Plan Investments
(9)
- (31,268)- (925,034)- (16,623)- (226,223)- (806,526)
- (858,541)
- (617,523)- (192,232)- (182,276)
- (629,575)
- (917,847)- (141,564)- (654,101)
- (966,953)
- (340,817)- (370,395)- (19,641)- (261)- (38,736)- (11,561)
d Outflows of Resou
Changes of Assump-
tions
ChangPropo
and BetwEmplContProp
tionateof Co
(10) (1
(20,386)(603,083) (
(10,838)(147,488) (5(525,821) (2
(559,733) (9
(402,599) (12(125,327) (13(118,837) (12
(410,457) (29
(598,397) (19(92,294) (7
(426,446)
(630,413) (2
(222,198) (4(241,482) (3
(12,805)(170)
(25,254)(7,537) (12
urces ges in ortion Diff
ween loyer rib & por-
e Share ontrib
Total DeferreInflows of Resources
1) (12)
(5,206) (56,86011,192) (1,539,309
(630) (28,09159,849) (433,56022,635) (1,354,982
92,730) (1,511,004
29,521) (1,149,64336,707) (454,26621,371) (422,484
98,855) (1,338,887
97,300) (1,713,54478,757) (312,615(2,868) (1,083,415
28,705) (1,626,071
41,554) (604,56938,832) (650,709(3,629) (36,075
(10) (441(1,472) (65,46228,536) (147,634
Def ed
f s 2016
(13)
0) (7,241)9) (171,267)1) (3,130)0) (56,840)2) (101,485)
4) (188,721)
3) (148,356)6) (65,537)4) (58,760)
7) (180,453)
4) (213,179)5) (43,863)5) (110,249)
1) (162,677)
9) (75,869)9) (80,919)5) (4,620)1) 293 2) (7,757)4) (25,429)
ferred Inflows/(OutflPension Exp
2017 2018
(14) (15)
(7,241) (7(171,267) (171
(3,130) (3(56,840) (56
(101,485) (101
(188,721) (188
(148,356) (148(65,537) (65(58,760) (58
(180,453) (180
(213,179) (213(43,863) (43
(110,249) (110
(162,677) (162
(75,869) (75(80,919) (80
(4,620) (4293
(7,757) (7(25,429) (25
lows) Recognized Inpense (Year Ended J
8 2019
(16)
7,241) 2,740 1,267) 124,002 3,130) 2,177 6,840) 15,370 1,485) 155,957
8,721) 85,323
8,356) 48,756 5,537) (4,177) 8,760) (578)
0,453) 20,506
3,179) 79,795 3,863) 1,324 0,249) 98,539
2,677) 145,973
5,869) 32,919 0,919) 37,310 4,620) 1,649
293 377 7,757) 4,608 5,429) (21,738)
69
n Future June 30):
2020 There-after
(17) (18)
(4,808) - (100,051) -
(1,848) - (39,120) - (40,400) -
(122,009) -
(100,153) - (50,139) - (44,181) -
(130,587) -
(141,435) - (32,604) - (60,085) -
(88,624) -
(49,361) - (52,135) -
(3,089) - 305 -
(4,768) - (24,016) -
e r

SECT
Employer ID
(1)
61600 62400 62500 62600 66500 67000 70100 70900 72000 75000
77000 80100
90000
90100
90200 90600 90900 99501
100002
100003
100004
TION 4: Appe
r Employer
(2)
State Seed DepartmenBeef Commission ND Wheat CommissiND Barley Council State Fair AssociationRacing Commission Historical Society ND Council On The AGame & Fish DepartmParks & Recreation Department Water Commission Department Of Transportation ND State Board Of Accountancy Board Of Medical Examiners Board Of Pharmacy Real Estate CommissElectrical Board ND System InformatiTechnology Services McIntosh District HeUnit Wells County Dist HeUnit Central Valley HealthUnit
ndices for GASB
Diff Between Expected
and Actual Experience
PaInE
P
(3)
nt 24,293 2,657
ion 8,651 2,657
n 20,431 2,729
74,789 Arts 6,271 ment 205,245
64,536
124,874 1,330,831
645
3,693
4,651 ion 2,725
30,367 ion 35,538
alth 1,353
ealth 3,674
h 20,478
B 68 for North D
Deferred InflowNet Diff
Between Projected
and Actual nvestment arnings on Pension
Plan Invest-ments
Chgs oAssumptions
(4) (5)
96,757 - 10,582 - 34,454 - 10,583 - 81,373 - 10,869 -
297,877 - 24,976 -
817,465 - 257,038 -
497,359 - 5,300,528 -
2,570 -
14,710 -
18,525 - 10,855 -
120,946 - 141,542 -
5,389 -
14,635 -
81,560 -
Dakota Public Em
ws of Resources
of m-s
Changes in Proportion
and Diff Between Employer Contrib & Propor-
tionate Share of Contribs
ToOR
(6)
34,222 -
137 -
4,533 1,548
- - -
43,165
- -
20,116
-
2,447 27,597
124,664 62,967
3,380
640
2,749
mployees Retirem
otal Deferred Outflows of Resources
DiffBetweExpec
and AcExperie
(7) (8)
155,272 13,239 43,242 13,240 106,337 15,146 372,666 31,247
1,022,710 364,739
622,233 6,631,359
23,331
18,403
25,623 41,177 275,977 240,047
10,122
18,949
104,787
ment System
Deferre
f een cted ctual ence
Net Diff Between Projected
and Actual Investment Earnings on Pension Plan Investments
(9)
- (114,434)- (12,515)- (40,749)- (12,517)- (96,240)- (12,855)- (352,297)- (29,539)- (966,810)- (303,997)
- (588,223)- (6,268,897)
- (3,040)
- (17,397)
- (21,910)- (12,838)- (143,042)- (167,401)
- (6,374)
- (17,308)
- (96,460)
d Outflows of Resou
Changes of Assump-
tions
ChangPropo
and BetwEmplContProp
tionateof Co
(10) (1
(74,606)(8,159)
(26,566) (2(8,161)
(62,744) (4(8,381)
(229,683) (13(19,258) (
(630,319) (26(198,193)
(383,496) ((4,087,057) (1,46
(1,982)
(11,342)
(14,284)(8,370)
(93,258)(109,138)
(4,155)
(11,284)
(62,888) (
urces ges in ortion Diff
ween loyer rib & por-
e Share ontrib
Total DeferreInflows of Resources
1) (12)
(2,889) (191,929(1,133) (21,80725,784) (93,099(1,595) (22,27340,400) (199,384
(488) (21,72431,445) (713,42510,161) (58,95866,188) (1,863,317(3,432) (505,622
12,907) (984,62664,881) (11,820,835
- (5,022
(1,195) (29,934
(833) (37,027(488) (21,696
(5,778) (242,078(8,077) (284,616
(53) (10,582
(658) (29,250
84,603) (243,951
Def ed
f s 2016
(13)
9) (16,380)7) (2,707)9) (13,222)3) (2,800)4) (26,270)4) (2,334)5) (96,195)8) (7,893)7) (245,002)2) (52,251)
6) (119,134)5) (1,536,192)
2) 3,437
4) (3,687)
7) (4,017)6) 2,900 8) (4,468)6) (22,145)
2) (595)
0) (3,433)
1) (35,548)
ferred Inflows/(OutflPension Exp
2017 2018
(14) (15)
(16,380) (16(2,707) (2
(13,222) (13(2,800) (2
(26,270) (26(2,334) (2
(96,195) (96(7,893) (7
(245,002) (245(52,251) (52
(119,134) (119(1,536,192) (1,536
3,437 3
(3,687) (3
(4,017) (42,900 2
(4,468) (4(22,145) (22
(595)
(3,433) (3
(35,548) (35
lows) Recognized Inpense (Year Ended J
8 2019
(16)
6,380) 20,147 2,707) 1,288 3,222) (216) 2,800) 1,195 6,270) 4,450 2,334) 1,769 6,195) 16,258 7,893) 1,535 5,002) 63,601 2,251) 44,784
9,134) 68,626 6,192) 464,827
3,437 4,407
3,687) 1,866
4,017) 2,977 2,900 6,997 4,468) 41,191 2,145) 31,289
(595) 1,440
3,433) 2,092
5,548) (4,759)
70
n Future June 30):
2020 There-after
(17) (18)
(7,673) - (1,736) - (9,972) - (1,826) -
(18,670) - (1,347) -
(68,442) - (5,572) -
(169,265) - (28,927) -
(72,438) - (1,046,206) -
3,592 -
(2,341) -
(2,331) - 3,784 - 6,088 -
(9,458) -
(117) -
(2,095) -
(27,750) -
e r

SECT
Employer ID
(1)
100005
100006
100007
100008
100009
100010 100011
100012
100013
100014
100015
100017
100018
100019 100021
100022
100023
TION 4: Appe
r Employer
(2)
Dickey County HealthDistrict Emmons County PubHealth Rolette County PublicHealth Towner County PubliHealth Unit Nelson-Griggs DistricHealth Unit First District Health ULake Region District Health Unit Garrison Diversion Conservancy District Upper Missouri HealtUnit Kidder County DistriHealth Unit Southwestern DistrictHealth Unit City-County Health District Sargent County DistriHealth Unit Traill District Health Cavalier County HealDist Walsh County HealthDistrict Custer Health Unit
ndices for GASB
Diff Between Expected
and Actual Experience
PaInE
P
(3)
h 2,878
lic 2,411
c 6,835
ic 1,240
ct 2,822
Unit 41,887 17,157
34,960
th 18,490
ct 590
t 26,432
11,376
ict 1,832
Unit 3,437 lth 2,447
h 6,136
27,136
B 68 for North D
Deferred InflowNet Diff
Between Projected
and Actual nvestment arnings on Pension
Plan Invest-ments
Chgs oAssumptions
(4) (5)
11,463 -
9,602 -
27,222 -
4,941 -
11,240 -
166,829 - 68,334 -
139,240 -
73,644 -
2,351 -
105,274 -
45,311 -
7,297 -
13,689 - 9,747 -
24,440 -
108,077 -
Dakota Public Em
ws of Resources
of m-s
Changes in Proportion
and Diff Between Employer Contrib & Propor-
tionate Share of Contribs
ToOR
(6)
-
-
9,638
-
165
5,317 21,389
-
4,634
-
29,804
-
20,744
- -
-
4,449
mployees Retirem
otal Deferred Outflows of Resources
DiffBetweExpec
and AcExperie
(7) (8)
14,341
12,013
43,695
6,181
14,227
214,033 106,880
174,200
96,768
2,941
161,510
56,687
29,873
17,126 12,194
30,576
139,662
ment System
Deferre
f een cted ctual ence
Net Diff Between Projected
and Actual Investment Earnings on Pension Plan Investments
(9)
- (13,558)
- (11,356)
- (32,196)
- (5,843)
- (13,294)
- (197,308)- (80,818)
- (164,678)
- (87,098)
- (2,780)
- (124,507)
- (53,589)
- (8,630)
- (16,190)- (11,527)
- (28,905)
- (127,822)
d Outflows of Resou
Changes of Assump-
tions
ChangPropo
and BetwEmplContProp
tionateof Co
(10) (1
(8,839) (
(7,404)
(20,990)
(3,809)
(8,667)
(128,636) ((52,690)
(107,363) (10
(56,784) (
(1,813)
(81,173)
(34,938)
(5,626)
(10,555)(7,515)
(18,845)
(83,335) (4
urces ges in ortion Diff
ween loyer rib & por-
e Share ontrib
Total DeferreInflows of Resources
1) (12)
12,960) (35,357
(2,132) (20,892
(1,653) (54,839
(363) (10,015
(505) (22,466
82,163) (408,107(2,203) (135,711
00,019) (372,060
88,045) (231,927
(130) (4,723
(2,333) (208,013
(5,699) (94,226
(327) (14,583
(2,883) (29,628(3,222) (22,264
(4,436) (52,186
48,567) (259,724
Def ed
f s 2016
(13)
7) (5,288)
2) (2,679)
9) (4,776)
5) (1,231)
6) (2,702)
7) (54,523)1) (12,160)
0) (52,711)
7) (34,006)
3) (577)
3) (19,151)
6) (11,762)
3) 2,390
8) (3,787)4) (2,931)
6) (6,617)
4) (34,184)
ferred Inflows/(OutflPension Exp
2017 2018
(14) (15)
(5,288) (5
(2,679) (2
(4,776) (4
(1,231) (1
(2,702) (2
(54,523) (54(12,160) (12
(52,711) (52
(34,006) (34
(577)
(19,151) (19
(11,762) (11
2,390 2
(3,787) (3(2,931) (2
(6,617) (6
(34,184) (34
lows) Recognized Inpense (Year Ended J
8 2019
(16)
5,288) (961)
2,679) 946
4,776) 5,501
1,231) 634
2,702) 1,541
4,523) 8,457 2,160) 13,637
2,711) (146)
4,006) (6,205)
(577) 311
9,151) 20,591
1,762) 5,343
2,390 5,145
3,787) 1,381 2,931) 749
6,617) 2,610
4,184) 6,617
71
n Future June 30):
2020 There-after
(17) (18)
(4,191) -
(1,795) -
(2,324) -
(780) -
(1,674) -
(38,939) - (5,999) -
(39,585) -
(26,919) -
(361) -
(9,648) -
(7,604) -
2,971 -
(2,528) - (2,029) -
(4,371) -
(24,110) -
e r

SECT
Employer ID
(1)
200002 200003 200004 200005 200006 200008 200009 200010 200011 200012 200014 200015 200016 200017 200018 200019 200020 200021 200022 200025 200026 200028 200029 200030 200031 200033
TION 4: Appe
r Employer
(2)
City Of Mcville City Of Drayton City Of Fessenden City Of Westhope City Of Belfield City Of Rolla City of New Town City Of Cavalier City Of Harvey City Of Napoleon City Of Grand Forks City Of Killdeer City Of Ellendale City Of Wishek City Of Granville City Of Linton City Of Finley City Of Wilton City Of Ray City Of Medora City of Velva City Of Thompson City Of Williston City Of Bowman City Of Tioga City Of Rhame
ndices for GASB
Diff Between Expected
and Actual Experience
PaInE
P
(3)
2,077 4,698
831 3,138 8,226 5,524
15,731 11,233 10,285
3,325 362,446
12,563 6,377 1,491 1,021 4,677 1,999 2,886 5,527 6,265 2,487 2,503
186,084 12,533 21,832
717
B 68 for North D
Deferred InflowNet Diff
Between Projected
and Actual nvestment arnings on Pension
Plan Invest-ments
Chgs oAssumptions
(4) (5)
8,271 - 18,711 -
3,308 - 12,497 - 32,763 - 22,000 - 62,655 - 44,740 - 40,965 - 13,242 -
1,443,574 - 50,038 - 25,399 -
5,939 - 4,065 -
18,628 - 7,961 -
11,493 - 22,013 - 24,953 -
9,905 - 9,970 -
741,147 - 49,919 - 86,956 -
2,858 -
Dakota Public Em
ws of Resources
of m-s
Changes in Proportion
and Diff Between Employer Contrib & Propor-
tionate Share of Contribs
ToOR
(6)
5,889 545
1,123 2,359 5,777 2,109
200,029 4,401
- 1,975
471,023 67,425
5,570 46,749
935 -
18,058 27,529 36,111 12,864
1,816 -
1,199,200 49,496
144,971 850
mployees Retirem
otal Deferred Outflows of Resources
DiffBetweExpec
and AcExperie
(7) (8)
16,237 23,954
5,262 17,994 46,766 29,633 278,415 60,374 51,250 18,542
2,277,043 130,026 37,346 54,179
6,021 23,305 28,018 41,908 63,651 44,082 14,208 12,473
2,126,431 111,948 253,759
4,425
ment System
Deferre
f een cted ctual ence
Net Diff Between Projected
and Actual Investment Earnings on Pension Plan Investments
(9)
- (9,782)- (22,129)- (3,912)- (14,780)- (38,749)- (26,019)- (74,101)- (52,913)- (48,449)- (15,661)- (1,707,305)- (59,179)- (30,039)- (7,024)- (4,808)- (22,031)- (9,415)- (13,593)- (26,035)- (29,512)- (11,715)- (11,791)- (876,549)- (59,039)- (102,842)- (3,380)
d Outflows of Resou
Changes of Assump-
tions
ChangPropo
and BetwEmplContProp
tionateof Co
(10) (1
(6,378)(14,427) ((2,551) ((9,636)
(25,263) (4(16,963)(48,311)(34,497)(31,587) ((10,210) (
(1,113,091) (2(38,582)(19,584)(4,579)(3,135)
(14,363) ((6,138)(8,862)
(16,974)(19,241)(7,638)(7,687)
(571,473)(38,491)(67,049)(2,203) (2
urces ges in ortion Diff
ween loyer rib & por-
e Share ontrib
Total DeferreInflows of Resources
1) (12)
(371) (16,53118,383) (54,93911,949) (18,412
(561) (24,97749,693) (113,705(5,833) (48,815
- (122,412(1,183) (88,59316,240) (96,27618,118) (43,98928,249) (2,848,645(1,375) (99,136(3,800) (53,423
- (11,603- (7,943
14,565) (50,959(1,949) (17,502
(894) (23,349- (43,009
(1,121) (49,874(3,140) (22,493(6,489) (25,967
- (1,448,022(2,243) (99,773
- (169,89128,862) (34,445
Def ed
f s 2016
(13)
1) (831)9) (7,966)2) (2,948)7) (2,567)5) (16,495)5) (5,903)2) 25,485 3) (9,838)6) (12,860)9) (6,345)5) (249,354)6) 1,538 3) (5,597)3) 7,995 3) (765)9) (7,290)2) 1,370 9) 2,656 9) 2,093 4) (3,489)3) (2,587)7) (3,639)2) 67,135 3) (2,208)1) 8,735 5) (6,295)
ferred Inflows/(OutflPension Exp
2017 2018
(14) (15)
(831) (7,966) (7(2,948) (2(2,567) (2
(16,495) (16(5,903) (525,485 25(9,838) (9
(12,860) (12(6,345) (6
(249,354) (2491,538 1
(5,597) (57,995 7(765)
(7,290) (71,370 12,656 22,093 2
(3,489) (3(2,587) (2(3,639) (367,135 67(2,208) (28,735 8
(6,295) (6
lows) Recognized Inpense (Year Ended J
8 2019
(16)
(831) 2,291 7,966) (903) 2,948) (1,699) 2,567) 2,150 6,495) (4,127) 5,903) 2,402 5,485 49,138 9,838) 7,052 2,860) 2,605 6,345) (1,346) 9,354) 295,615 1,538 20,428 5,597) 3,992 7,995 10,237 (765) 770
7,290) (258) 1,370 4,375 2,656 6,995 2,093 10,403 3,489) 5,931 2,587) 1,152 3,639) 125 7,135 346,927 2,208) 16,637 8,735 41,562 6,295) (5,216)
72
n Future June 30):
2020 There-after
(17) (18)
(96) - (6,184) - (2,600) - (1,436) -
(13,303) - (3,870) - 30,448 - (5,766) - (9,054) - (5,062) -
(119,272) - 5,842 -
(3,295) - 8,353 - (399) -
(5,529) - 2,025 - 3,596 - 3,960 -
(1,259) - (1,667) - (2,704) -
130,131 - 2,156 -
16,117 - (5,915) -
e r

SECT
Employer ID
(1)
200035 200036 200037 200038 200040 200041 200045 200046 200049 200050 200051 200052 200053 200054 200055 200057 200058 200059 200060 200061 200062 200063 200064 200065 200067 200069
TION 4: Appe
r Employer
(2)
City Of Fargo City Of Jamestown City Of Beach City Of Glenburn City Of Kulm City Of Harwood City Of Mapleton City Of Wahpeton City Of Elgin City Of Rugby City Of New Salem City Of Walhalla City Of Gwinner City Of Kenmare City Of Watford CityCity Of CooperstownCity Of New EnglandCity Of Carrington City Of Mott City Of Larimore City Of Sherwood City Of Lamoure City Of Michigan City Of Park River City Of Hatton City Of Northwood
ndices for GASB
Diff Between Expected
and Actual Experience
PaInE
P
(3)
515,233 98,815
3,812 1,204 2,313 1,957 2,738
50,680 1,930
11,229 2,013 3,478 3,082 5,394
y 48,104 n 2,785 d 2,847
15,583 2,195 2,260
387 2,966
417 8,907 1,875 2,696
B 68 for North D
Deferred InflowNet Diff
Between Projected
and Actual nvestment arnings on Pension
Plan Invest-ments
Chgs oAssumptions
(4) (5)
2,052,106 - 393,567 -
15,185 - 4,795 - 9,214 - 7,794 -
10,905 - 201,850 -
7,687 - 44,726 -
8,017 - 13,854 - 12,275 - 21,484 -
191,591 - 11,091 - 11,339 - 62,066 -
8,741 - 9,002 - 1,543 -
11,814 - 1,661 -
35,476 - 7,470 -
10,739 -
Dakota Public Em
ws of Resources
of m-s
Changes in Proportion
and Diff Between Employer Contrib & Propor-
tionate Share of Contribs
ToOR
(6)
484,348 46,262 31,014
- 247
- 7,781
- 22,648
2,259 11,960
1,957 4,819 4,849
286,802 1,380 1,770
11,647 808
15,413 710
1,018 1,200
- -
5,584
mployees Retirem
otal Deferred Outflows of Resources
DiffBetweExpec
and AcExperie
(7) (8)
3,051,687 538,644 50,011
5,999 11,774
9,751 21,424 252,530 32,265 58,214 21,990 19,289 20,176 31,727 526,497 15,256 15,956 89,296 11,744 26,675
2,640 15,798
3,278 44,383
9,345 19,019
ment System
Deferre
f een cted ctual ence
Net Diff Between Projected
and Actual Investment Earnings on Pension Plan Investments
(9)
- (2,427,012)- (465,469)- (17,959)- (5,671)- (10,897)- (9,218)- (12,897)- (238,727)- (9,092)- (52,897)- (9,482)- (16,385)- (14,518)- (25,409)- (226,593)- (13,117)- (13,411)- (73,405)- (10,338)- (10,646)- (1,825)- (13,972)- (1,964)- (41,957)- (8,834)- (12,701)
d Outflows of Resou
Changes of Assump-
tions
ChangPropo
and BetwEmplContProp
tionateof Co
(10) (1
(1,582,309) (3(303,467)
(11,708)(3,697)(7,105) ((6,010)(8,408)
(155,640) ((5,927)
(34,486) (2(6,182)
(10,682) ((9,465)
(16,565) (6(147,729)
(8,552) ((8,743)
(47,857)(6,740)(6,941)(1,190)(9,109) ((1,281) (
(27,354) ((5,760)(8,281) (
urces ges in ortion Diff
ween loyer rib & por-
e Share ontrib
Total DeferreInflows of Resources
1) (12)
39,144) (4,048,465(4,175) (773,111
(683) (30,350(1,679) (11,04713,890) (31,892(2,127) (17,355
(491) (21,79614,216) (408,583
(151) (15,17020,952) (108,335
(360) (16,02483,596) (110,663
(551) (24,53462,686) (104,660
- (374,32212,170) (33,839
(510) (22,664(399) (121,661(312) (17,390- (17,587
(8,795) (11,81018,474) (41,55511,635) (14,88016,612) (85,923
(735) (15,32918,273) (39,255
Def ed
f s 2016
(13)
5) (391,458)1) (83,770)0) 2,533 7) (1,461)2) (4,898)5) (2,253)6) (1,090)3) (50,153)0) 2,716 5) (14,233)4) 451 3) (19,639)4) (2,019)0) (16,647)2) 12,697 9) (4,766)4) (2,403)1) (12,285)0) (1,949)7) 986 0) (1,986)5) (6,274)0) (2,484)3) (11,648)9) (1,897)5) (5,064)
ferred Inflows/(OutflPension Exp
2017 2018
(14) (15)
(391,458) (391(83,770) (83
2,533 2(1,461) (1(4,898) (4(2,253) (2(1,090) (1
(50,153) (502,716 2
(14,233) (14451
(19,639) (19(2,019) (2
(16,647) (1612,697 12(4,766) (4(2,403) (2
(12,285) (12(1,949) (1
986 (1,986) (1(6,274) (6(2,484) (2
(11,648) (11(1,897) (1(5,064) (5
lows) Recognized Inpense (Year Ended J
8 2019
(16)
1,458) 383,239 3,770) 64,807 2,533 8,265 1,461) 350 4,898) (1,420) 2,253) 689 1,090) 3,026 0,153) 26,048 2,716 5,618 4,233) 2,651
451 3,478 9,639) (14,409) 2,019) 2,615 6,647) (8,537) 2,697 85,025 4,766) (579) 2,403) 1,878 2,285) 11,146 1,949) 1,351
986 4,384 1,986) (1,403) 6,274) (1,814) 2,484) (1,857) 1,648) 1,745 1,897) 923 5,064) (1,010)
73
n Future June 30):
2020 There-after
(17) (18)
(205,798) - (47,978) -
3,795 - (1,015) - (4,001) - (1,532) -
(127) - (31,674) -
3,326 - (10,061) -
1,134 - (18,039) -
(918) - (14,434) - 29,070 - (3,702) - (1,376) - (6,658) - (1,147) - 1,750 -
(1,810) - (5,118) - (2,287) - (8,341) - (1,214) - (4,011) -
e r

SECT
Employer ID
(1)
200070 200072 200073 200075 200076 200077 200079 200080 200083 200084 200085 200086 200087 200088 200089 200090 200091 200094 200097 200098 200100 200101 200102 200103 200104 200110
TION 4: Appe
r Employer
(2)
City Of Powers Lake City Of Towner City Of Pembina City Of Underwood City Of New Leipzig City Of Stanley City Of Scranton City Of Crosby City Of Grafton City Of Emerado City Of Lincoln City Of Minto City Of Ashley City Of Neche City Of Surrey City Of Hankinson City Of New RockforCity Of West Fargo City Of Devils Lake City Of Oakes City Of Mohall City Of Lidgerwood City Of Mcclusky City Of Burlington City Of Lisbon City Of Halliday
ndices for GASB
Diff Between Expected
and Actual Experience
PaInE
P
(3)
- 772
1,635 1,746
545 17,843
- 3,142
28,949 1,524 6,273 1,727 2,020
963 6,926 4,054
rd 4,123 131,334
13,348 14,144
2,938 1,328
719 2,817 6,252 1,716
B 68 for North D
Deferred InflowNet Diff
Between Projected
and Actual nvestment arnings on Pension
Plan Invest-ments
Chgs oAssumptions
(4) (5)
- - 3,074 - 6,514 - 6,953 - 2,172 -
71,068 - - -
12,514 - 115,300 -
6,070 - 24,986 -
6,879 - 8,046 - 3,837 -
27,587 - 16,148 - 16,421 -
523,088 - 53,165 - 56,333 - 11,701 -
5,289 - 2,862 -
11,218 - 24,900 -
6,835 -
Dakota Public Em
ws of Resources
of m-s
Changes in Proportion
and Diff Between Employer Contrib & Propor-
tionate Share of Contribs
ToOR
(6)
2,160 2,178
- -
55 93,903
1,708 1,069
- 14,757
5,858 -
16,945 -
62,681 -
21,702 63,788
302,272 11,776
- 11,396
2,471 37,153
1,834 1,060
mployees Retirem
otal Deferred Outflows of Resources
DiffBetweExpec
and AcExperie
(7) (8)
2,160 6,024 8,149 8,699 2,772
182,814 1,708
16,725 144,249 22,351 37,117
8,606 27,011
4,800 97,194 20,202 42,246 718,210 368,785 82,253 14,639 18,013
6,052 51,188 32,986
9,611
ment System
Deferre
f een cted ctual ence
Net Diff Between Projected
and Actual Investment Earnings on Pension Plan Investments
(9)
- - - (3,636)- (7,703)- (8,223)- (2,569)- (84,052)- - - (14,800)- (136,364)- (7,178)- (29,550)- (8,136)- (9,516)- (4,538)- (32,627)- (19,098)- (19,420)- (618,652)- (62,878)- (66,625)- (13,838)- (6,255)- (3,385)- (13,268)- (29,449)- (8,084)
d Outflows of Resou
Changes of Assump-
tions
ChangPropo
and BetwEmplContProp
tionateof Co
(10) (1
- (3(2,371) ((5,022)(5,361)(1,675)
(54,798)- (3
(9,649)(88,904) (6(4,680)
(19,265) (6(5,304)(6,204)(2,958)
(21,271)(12,451)(12,661)
(403,335)(40,994)(43,436)(9,022) ((4,078)(2,207)(8,650)
(19,199)(5,270) (2
urces ges in ortion Diff
ween loyer rib & por-
e Share ontrib
Total DeferreInflows of Resources
1) (12)
36,010) (36,01016,385) (22,392(4,142) (16,867(1,652) (15,236
(97) (4,341(2,562) (141,41239,594) (39,594
(233) (24,68260,692) (285,960
(272) (12,13064,603) (113,418(1,201) (14,641
(361) (16,081(1,899) (9,395
(690) (54,588(8,976) (40,525
(738) (32,819- (1,021,987
(2,075) (105,947(3,049) (113,11015,913) (38,773
(237) (10,570(128) (5,720(147) (22,065
(4,733) (53,38125,360) (38,714
Def ed
f s 2016
(13)
0) (6,797)2) (3,573)7) (2,358)6) (1,961)1) (518)2) 1,689 4) (7,608)2) (2,764)0) (39,204)0) 1,486 8) (17,652)1) (1,853)1) 1,445 5) (1,281)8) 5,983 5) (5,587)9) 362 7) (109,764)7) 47,822 0) (11,447)3) (5,937)0) 1,001 0) (201)5) 4,803 1) (6,417)4) (6,481)
ferred Inflows/(OutflPension Exp
2017 2018
(14) (15)
(6,797) (6(3,573) (3(2,358) (2(1,961) (1
(518) 1,689 1
(7,608) (7(2,764) (2
(39,204) (391,486 1
(17,652) (17(1,853) (11,445 1
(1,281) (15,983 5
(5,587) (5362
(109,764) (10947,822 47
(11,447) (11(5,937) (51,001 1(201)
4,803 4(6,417) (6(6,481) (6
lows) Recognized Inpense (Year Ended J
8 2019
(16)
6,797) (6,797) 3,573) (2,413) 2,358) 101 1,961) 664 (518) 302
1,689 28,518 7,608) (7,608) 2,764) 1,960 9,204) 4,323 1,486 3,777 7,652) (8,219) 1,853) 744 1,445 4,482 1,281) 167 5,983 16,397 5,587) 509
362 6,561 9,764) 87,709 7,822 67,893 1,447) 9,819 5,937) (1,520) 1,001 2,997 (201) 880
4,803 9,038 6,417) 2,983 6,481) (3,900)
74
n Future June 30):
2020 There-after
(17) (18)
(6,652) - (3,227) - (1,746) - (1,321) -
(319) - 7,809 -
(7,447) - (1,626) -
(28,422) - 1,983 -
(15,105) - (1,221) - 2,110 - (922) -
8,256 - (4,074) - 1,775 -
(62,194) - 51,470 - (6,346) - (4,806) - 1,440 -
52 - 5,677 -
(4,123) - (5,756) -
e r

SECT
Employer ID
(1)
200111 200114 200115 200117 200118 200119 300001 300002 300003 300004 300005 300006 300007 300008 300009 300010 300011 300012 300013 300014 300015 300016 300018 300019 300020 300021
TION 4: Appe
r Employer
(2)
City Of Maddock City of Regent City of Lakota City of Alexander City of Berthold City of Carson Adams County Barnes County Benson County Billings County Bottineau County Bowman County Burke County Burleigh County Cass County Cavalier County Dickey County Divide County Dunn County Eddy County Emmons County Foster County Grand Forks County Grant County Griggs County Hettinger County
ndices for GASB
Diff Between Expected
and Actual Experience
PaInE
P
(3)
2,202 573
4,669 1,569
665 1,280
18,244 56,024 35,298 50,837 61,925 30,095 30,439
283,013 461,022
40,188 34,351 56,800 73,173 16,410 24,122 17,928
293,315 19,936 15,335 23,629
B 68 for North D
Deferred InflowNet Diff
Between Projected
and Actual nvestment arnings on Pension
Plan Invest-ments
Chgs oAssumptions
(4) (5)
8,771 - 2,283 -
18,595 - 6,248 - 2,648 - 5,096 -
72,665 - 223,137 - 140,587 - 202,479 - 246,639 - 119,866 - 121,235 -
1,127,203 - 1,836,192 - 160,064 - 136,815 - 226,228 - 291,440 -
65,358 - 96,075 - 71,404 -
1,168,234 - 79,404 - 61,078 - 94,111 -
Dakota Public Em
ws of Resources
of m-s
Changes in Proportion
and Diff Between Employer Contrib & Propor-
tionate Share of Contribs
ToOR
(6)
9,531 11,064 71,844 48,876 14,800 32,397 31,400 94,922
8,334 - - -
3,876 32,707
- 49,587
4,188 162,336 236,275
2,859 2,880
13,909 5,187 4,808 3,961
43,165
mployees Retirem
otal Deferred Outflows of Resources
DiffBetweExpec
and AcExperie
(7) (8)
20,504 13,920 95,108 56,693 18,113 38,773 122,309 374,083 184,219 253,316 308,564 149,961 155,550
1,442,923 2,297,214
249,839 175,354 445,364 600,888 84,627 123,077 103,241
1,466,736 104,148 80,374 160,905
ment System
Deferre
f een cted ctual ence
Net Diff Between Projected
and Actual Investment Earnings on Pension Plan Investments
(9)
- (10,373)- (2,700)- (21,993)- (7,389)- (3,132)- (6,027)- (85,940)- (263,903)- (166,271)- (239,470)- (291,699)- (141,765)- (143,383)- (1,333,135)- (2,171,651)- (189,307)- (161,811)- (267,558)- (344,684)- (77,298)- (113,627)- (84,449)- (1,381,662)- (93,910)- (72,236)- (111,305)
d Outflows of Resou
Changes of Assump-
tions
ChangPropo
and BetwEmplContProp
tionateof Co
(10) (1
(6,763)(1,761)
(14,338)(4,818)(2,042)(3,929)
(56,029)(172,053)(108,402) (6(156,124) (2(190,175) (6
(92,425) (2(93,480) (2
(869,148) (25(1,415,825) (60
(123,420)(105,494) (6(174,437)(224,719)
(50,395) (3(74,080) (9(55,057) (20
(900,786) (43(61,225) (9(47,095) (4(72,566)
urces ges in ortion Diff
ween loyer rib & por-
e Share ontrib
Total DeferreInflows of Resources
1) (12)
- (17,136- (4,461
(311) (36,642(281) (12,488(118) (5,292- (9,956- (141,969
(222) (436,17861,831) (336,50421,539) (417,13368,243) (550,11725,084) (259,27424,807) (261,67053,643) (2,455,92607,276) (4,194,752(5,349) (318,07668,323) (335,628
(958) (442,953(4,509) (573,91235,784) (163,47799,544) (287,25107,898) (347,40436,101) (2,718,54996,029) (251,16446,060) (165,391(3,842) (187,713
Def ed
f s 2016
(13)
6) (141)1) 1,687 2) 10,006 8) 8,294 2) 2,328 6) 5,311 9) (10,722)8) (33,270)4) (43,685)3) (51,771)7) (71,497)4) (33,123)0) (32,611)6) (308,495)2) (552,206)6) (28,624)8) (44,937)3) (20,606)2) (21,751)7) (21,926)1) (41,924)4) (55,685)9) (360,273)4) (36,924)1) (22,765)3) (14,156)
ferred Inflows/(OutflPension Exp
2017 2018
(14) (15)
(141) 1,687 1
10,006 108,294 82,328 25,311 5
(10,722) (10(33,270) (33(43,685) (43(51,771) (51(71,497) (71(33,123) (33(32,611) (32
(308,495) (308(552,206) (552
(28,624) (28(44,937) (44(20,606) (20(21,751) (21(21,926) (21(41,924) (41(55,685) (55
(360,273) (360(36,924) (36(22,765) (22(14,156) (14
lows) Recognized Inpense (Year Ended J
8 2019
(16)
(141) 3,170 1,687 2,549 0,006 17,026 8,294 10,653 2,328 3,327 5,311 7,235 0,722) 16,710 3,270) 50,967 3,685) 9,389 1,771) 24,668 1,497) 21,612 3,123) 12,128 2,611) 13,157 8,495) 117,039 2,206) 140,980 8,624) 31,803 4,937) 6,713 0,606) 64,799 1,751) 88,271 1,926) 2,748 1,924) (5,654) 5,685) (28,729) 0,273) 80,751 6,924) (6,948) 2,765) 293 4,156) 21,373
75
n Future June 30):
2020 There-after
(17) (18)
626 - 1,858 -
11,420 - 8,670 - 2,510 - 5,647 -
(4,200) - (13,254) - (30,583) - (33,181) - (48,679) - (22,068) - (21,430) -
(204,428) - (381,933) -
(14,189) - (32,157) -
(573) - 3,943 -
(15,810) - (32,739) - (48,325) -
(251,722) - (29,279) - (16,996) -
(5,727) -
e r

SECT
Employer ID
(1)
300023 300024 300025 300026 300027 300028 300029 300030 300031 300032 300033 300034 300035 300036 300037 300038 300039 300040 300042 300044 300045 300046 300047 300048 300049 300050
TION 4: Appe
r Employer
(2)
Lamoure County Logan County Mchenry County Mcintosh County Mckenzie County Mclean County Mercer County Morton County Mountrail County Nelson County Oliver County Pembina County Pierce County Ramsey County Ransom County Renville County Richland County Rolette County Sheridan County Slope County Stark County Steele County Stutsman County Towner County Traill County Walsh County
ndices for GASB
Diff Between Expected
and Actual Experience
PaInE
P
(3)
32,240 13,923 29,769 20,399
127,105 85,263 59,973
115,148 106,675
26,915 15,312 56,622 43,880 63,853 29,521 24,787
113,105 42,316 11,708 12,079
110,096 17,833
127,190 19,200 57,475 65,361
B 68 for North D
Deferred InflowNet Diff
Between Projected
and Actual nvestment arnings on Pension
Plan Invest-ments
Chgs oAssumptions
(4) (5)
128,407 - 55,453 -
118,564 - 81,247 -
506,244 - 339,592 - 238,865 - 458,618 - 424,873 - 107,200 -
60,984 - 225,519 - 174,767 - 254,318 - 117,580 -
98,724 - 450,483 - 168,541 -
46,633 - 48,110 -
438,497 - 71,026 -
506,581 - 76,473 -
228,917 - 260,323 -
Dakota Public Em
ws of Resources
of m-s
Changes in Proportion
and Diff Between Employer Contrib & Propor-
tionate Share of Contribs
ToOR
(6)
130,479 27,370 35,560 26,987
833,259 18,101
128,973 335,598 371,891
- 44,340
- 134,609
5,366 -
1,721 -
1,174 7,433
43,890 65,138
109,842 260,570
13,146 552
3,831
mployees Retirem
otal Deferred Outflows of Resources
DiffBetweExpec
and AcExperie
(7) (8)
291,126 96,746 183,893 128,633
1,466,608 442,956 427,811 909,364 903,439 134,115 120,636 282,141 353,256 323,537 147,101 125,232 563,588 212,031 65,774 104,079 613,731 198,701 894,341 108,819 286,944 329,515
ment System
Deferre
f een cted ctual ence
Net Diff Between Projected
and Actual Investment Earnings on Pension Plan Investments
(9)
- (151,866)- (65,584)- (140,225)- (96,090)- (598,732)- (401,634)- (282,504)- (542,404)- (502,495)- (126,784)- (72,126)- (266,720)- (206,696)- (300,780)- (139,061)- (116,760)- (532,784)- (199,332)- (55,153)- (56,899)- (518,607)- (84,002)- (599,129)- (90,444)- (270,738)- (307,882)
d Outflows of Resou
Changes of Assump-
tions
ChangPropo
and BetwEmplContProp
tionateof Co
(10) (1
(99,010)(42,758)(91,421)(62,647)
(390,348)(261,848)(184,180)(353,625) ((327,605)
(82,658) (4(47,023)
(173,890) ((134,757)(196,096) (
(90,662) ((76,123) (2
(347,352) (15(129,956) (
(35,957)(37,096)
(338,110)(54,766)
(390,607)(58,966)
(176,510)(200,726) (4
urces ges in ortion Diff
ween loyer rib & por-
e Share ontrib
Total DeferreInflows of Resources
1) (12)
(7,410) (258,286- (108,342- (231,646- (158,737- (989,080
(4,598) (668,080(729) (467,413
16,758) (912,787- (830,100
40,381) (249,823(2,508) (121,65713,843) (454,453
- (341,45312,364) (509,24019,249) (248,97222,335) (215,21858,009) (1,038,14515,919) (345,207
- (91,110(3,613) (97,608
- (856,717- (138,768
(1,211) (990,947(814) (150,224
(2,880) (450,12845,058) (553,666
Def ed
f s 2016
(13)
6) (5,376)2) (7,499)6) (20,642)7) (13,619)0) 48,696 0) (76,863)3) (30,220)7) (43,441)0) (24,882)3) (33,228)7) (5,890)3) (55,625)3) (13,922)0) (60,999)2) (31,417)8) (27,272)5) (137,288)7) (42,453)0) (9,434)8) (3,186)7) (89,669)8) 5,413 7) (66,624)4) (15,442)8) (54,108)6) (69,279)
ferred Inflows/(OutflPension Exp
2017 2018
(14) (15)
(5,376) (5(7,499) (7
(20,642) (20(13,619) (1348,696 48
(76,863) (76(30,220) (30(43,441) (43(24,882) (24(33,228) (33
(5,890) (5(55,625) (55(13,922) (13(60,999) (60(31,417) (31(27,272) (27
(137,288) (137(42,453) (42
(9,434) (9(3,186) (3
(89,669) (895,413 5
(66,624) (66(15,442) (15(54,108) (54(69,279) (69
lows) Recognized Inpense (Year Ended J
8 2019
(16)
5,376) 43,099 7,499) 13,435 0,642) 24,117 3,619) 17,053 8,696 239,810 6,863) 51,338 0,220) 59,955 3,441) 129,693 4,882) 135,513 3,228) 7,241 5,890) 17,132 5,625) 29,512 3,922) 52,055 0,999) 35,010 1,417) 12,971 7,272) 9,997 7,288) 32,776 2,453) 21,173 9,434) 8,170 3,186) 14,976 9,669) 75,869 5,413 32,226 6,624) 124,617 5,442) 13,427 4,108) 32,311 9,279) 28,997
76
n Future June 30):
2020 There-after
(17) (18)
5,837 - (2,533) - (9,926) - (6,297) - 91,683 -
(45,891) - (8,899) - (2,860) - 12,475 -
(23,267) - (495) -
(34,952) - 1,524 -
(37,768) - (20,598) - (18,157) - (95,499) - (26,984) -
(5,192) - 1,037 -
(49,838) - 11,471 -
(21,356) - (8,505) -
(33,183) - (45,298) -
e r

SECT
Employer ID
(1)
300051 300052 300053 400002 400003
400004
400006 400007
400008
400010
400011 400012
400014 400016 400017
400018
400019 400020 400021
400023
TION 4: Appe
r Employer
(2)
Ward County Wells County Williams County Mcclusky Public SchLake Region Special Education Unit Lidgerwood Public School Halliday Public SchoOliver-Mercer SpeciaEducation Unit Underwood School District #8 New Town Public ScDistrict Bottineau Public SchoPeace Garden SpecialServices Beulah Public SchoolSt John School DistriEllendale Public SchoDistrict #40 Rural Cass Special Education Unit Fargo Public SchoolsSurrey Schools Jamestown Public SchDistrict #1 Warwick Public Scho
ndices for GASB
Diff Between Expected
and Actual Experience
PaInE
P
(3)
180,299 30,574
169,438 ools 2,985
12,593
5,873
ol 1,435 al 7,814
5,834
hool 23,534
ool 29,914 l 7,531
l #27 12,571 ct #3 11,204 ool 8,649
5,567
423,806 12,380
hool 61,093
ool 6,313
B 68 for North D
Deferred InflowNet Diff
Between Projected
and Actual nvestment arnings on Pension
Plan Invest-ments
Chgs oAssumptions
(4) (5)
718,107 - 121,774 - 674,849 -
11,888 - 50,155 -
23,391 -
5,716 - 31,122 -
23,235 -
93,733 -
119,143 - 29,995 -
50,070 - 44,624 - 34,446 -
22,173 -
1,687,964 - 49,307 -
243,326 -
25,144 -
Dakota Public Em
ws of Resources
of m-s
Changes in Proportion
and Diff Between Employer Contrib & Propor-
tionate Share of Contribs
ToOR
(6)
35,467 7,634
583,452 2,433
-
1,088
- -
1,501
3,189
55,107 12,268
15,565 2,165
15,852
-
103,313 -
1,546
5,547
mployees Retirem
otal Deferred Outflows of Resources
DiffBetweExpec
and AcExperie
(7) (8)
933,873 159,982
1,427,739 17,306 62,748
30,352
7,151 38,936
30,570
120,456
204,164 49,794
78,206 57,993 58,947
27,740
2,215,083 61,687 305,965
37,004
ment System
Deferre
f een cted ctual ence
Net Diff Between Projected
and Actual Investment Earnings on Pension Plan Investments
(9)
- (849,301)- (144,021)- (798,140)- (14,060)- (59,318)
- (27,664)
- (6,760)- (36,808)
- (27,480)
- (110,857)
- (140,910)- (35,475)
- (59,217)- (52,777)- (40,739)
- (26,223)
- (1,996,343)- (58,315)- (287,780)
- (29,738)
d Outflows of Resou
Changes of Assump-
tions
ChangPropo
and BetwEmplContProp
tionateof Co
(10) (1
(553,708) (19(93,896) (19
(520,353)(9,166)
(38,673) (5
(18,036) (
(4,407) ((23,997) (
(17,916)
(72,274) (1
(91,867)(23,128)
(38,607) (15(34,408) (5(26,560)
(17,097) (3
(1,301,532) (1,00(38,019)
(187,620) (
(19,388) (4
urces ges in ortion Diff
ween loyer rib & por-
e Share ontrib
Total DeferreInflows of Resources
1) (12)
98,186) (1,601,19592,138) (430,055
- (1,318,493(439) (23,665
54,781) (152,772
16,269) (61,969
18,616) (29,78311,903) (72,708
(3,589) (48,985
16,534) (299,665
(9,812) (242,589(2,519) (61,122
56,532) (254,35654,597) (141,782
- (67,299
32,050) (75,370
05,378) (4,303,253(5,668) (102,00284,768) (560,168
44,977) (94,103
Def ed
f s 2016
(13)
5) (200,944)5) (65,583)3) (40,974)5) (2,385)2) (22,752)
9) (8,529)
3) (5,077)8) (9,684)
5) (5,865)
5) (44,724)
9) (18,822)2) (5,072)
6) (40,040)2) (20,985)9) (4,888)
0) (11,632)
3) (576,667)2) (12,693)8) (73,728)
3) (13,810)
ferred Inflows/(OutflPension Exp
2017 2018
(14) (15)
(200,944) (200(65,583) (65(40,974) (40
(2,385) (2(22,752) (22
(8,529) (8
(5,077) (5(9,684) (9
(5,865) (5
(44,724) (44
(18,822) (18(5,072) (5
(40,040) (40(20,985) (20
(4,888) (4
(11,632) (11
(576,667) (576(12,693) (12(73,728) (73
(13,810) (13
lows) Recognized Inpense (Year Ended J
8 2019
(16)
0,944) 70,151 5,583) (19,612) 0,974) 213,790 2,385) 2,103 2,752) (3,818)
8,529) 301
5,077) (2,920) 9,684) 2,065
5,865) 2,907
4,724) (9,338)
8,822) 26,156 5,072) 6,252
0,040) (21,137) 0,985) (4,138) 4,888) 8,116
1,632) (3,261)
6,667) 60,562 2,693) 5,921 3,728) 18,131
3,810) (4,318)
77
n Future June 30):
2020 There-after
(17) (18)
(134,499) - (53,679) - 18,577 - (1,310) -
(17,954) -
(6,325) -
(4,484) - (6,792) -
(3,724) -
(35,689) -
(8,153) - (2,376) -
(34,834) - (16,687) -
(1,804) -
(9,494) -
(418,314) - (8,167) -
(51,141) -
(11,328) -
e r

SECT
Employer ID
(1)
400024
400025
400026
400027
400028
400029
400030
400031
400033
400034 400035
400036
400038
400039 400040 400042
400043
TION 4: Appe
r Employer
(2)
Souris Valley SpecialServices Rugby Public School District #5 Billings County SchoDistrict Belcourt School Distr#7 West Fargo Public Sc#6 Minot Public School District #1 Belfield Public Schoo#13 Minto Public School District #20 Harvey Public SchooDist #38 Oakes Public SchoolsLarimore Public SchoDistrict #44 Hazen Public School District #3 Park River Area SchoDistrict Hillsboro Public SchoLisbon Public SchoolNorthern Cass SchooDistrict # 97 Mandaree Public Sch#36
ndices for GASB
Diff Between Expected
and Actual Experience
PaInE
P
(3)
l 26,328
14,040
ool 9,344
rict 105,767
chool 281,346
298,491
ol 7,367
7,848
l 10,895
s 11,487 ool 12,732
13,193
ool 11,465
ool 10,495 l 13,371 l 12,836
hool 9,575
B 68 for North D
Deferred InflowNet Diff
Between Projected
and Actual nvestment arnings on Pension
Plan Invest-ments
Chgs oAssumptions
(4) (5)
104,862 -
55,920 -
37,217 -
421,257 -
1,120,565 -
1,188,850 -
29,342 -
31,258 -
43,392 -
45,752 - 50,708 -
52,547 -
45,662 -
41,800 - 53,256 - 51,126 -
38,137 -
Dakota Public Em
ws of Resources
of m-s
Changes in Proportion
and Diff Between Employer Contrib & Propor-
tionate Share of Contribs
ToOR
(6)
20,620
29,743
34,733
-
826,596
36,447
66,903
15,992
1,113
927 31,555
-
92
- 809
18,685
6,789
mployees Retirem
otal Deferred Outflows of Resources
DiffBetweExpec
and AcExperie
(7) (8)
151,810
99,703
81,294
527,024
2,228,507
1,523,788
103,612
55,098
55,400
58,166 94,995
65,740
57,219
52,295 67,436 82,647
54,501
ment System
Deferre
f een cted ctual ence
Net Diff Between Projected
and Actual Investment Earnings on Pension Plan Investments
(9)
- (124,020)
- (66,136)
- (44,016)
- (498,218)
- (1,325,284)
- (1,406,045)
- (34,703)
- (36,968)
- (51,320)
- (54,110)- (59,972)
- (62,146)
- (54,004)
- (49,437)- (62,986)- (60,466)
- (45,105)
d Outflows of Resou
Changes of Assump-
tions
ChangPropo
and BetwEmplContProp
tionateof Co
(10) (1
(80,856)
(43,118)
(28,696)
(324,817) (24
(864,030)
(916,682)
(22,625)
(24,102)
(33,458)
(35,278) (7(39,099)
(40,517)
(35,209)
(32,231) ((41,064) ((39,422)
(29,407) (10
urces ges in ortion Diff
ween loyer rib & por-
e Share ontrib
Total DeferreInflows of Resources
1) (12)
(3,444) (208,320
(2,505) (111,759
(1,031) (73,743
44,630) (1,067,665
(6,758) (2,196,072
- (2,322,727
(108) (57,436
(107) (61,177
(205) (84,983
77,996) (167,384(2,975) (102,046
(5,012) (107,675
(4,947) (94,160
18,186) (99,85413,748) (117,798(1,418) (101,306
01,027) (175,539
Def ed
f s 2016
(13)
0) (21,122)
9) (7,634)
3) (1,953)
5) (147,833)
2) (97,949)
7) (271,257)
6) 6,536
7) (4,134)
3) (9,986)
4) (26,197)6) (6,144)
5) (13,319)
0) (11,674)
4) (13,447)8) (15,077)6) (8,513)
9) (27,860)
ferred Inflows/(OutflPension Exp
2017 2018
(14) (15)
(21,122) (21
(7,634) (7
(1,953) (1
(147,833) (147
(97,949) (97
(271,257) (271
6,536 6
(4,134) (4
(9,986) (9
(26,197) (26(6,144) (6
(13,319) (13
(11,674) (11
(13,447) (13(15,077) (15
(8,513) (8
(27,860) (27
lows) Recognized Inpense (Year Ended J
8 2019
(16)
1,122) 18,465
7,634) 13,476
1,953) 12,097
7,833) 11,198
7,949) 325,079
1,257) 177,550
6,536 17,614
4,134) 7,666
9,986) 6,395
6,197) (8,925) 6,144) 12,999
3,319) 6,518
1,674) 5,564
3,447) 2,333 5,077) 5,028 8,513) 10,788
7,860) (13,462)
78
n Future June 30):
2020 There-after
(17) (18)
(11,620) -
(2,639) -
1,308 -
(108,400) -
1,176 -
(162,639) -
8,952 -
(1,340) -
(6,021) -
(21,700) - (1,633) -
(8,501) -
(7,481) -
(9,558) - (10,151) -
(3,914) -
(23,970) -
e r

SECT
Employer ID
(1)
400044 400045
400046
400047
400048 400049 400050
400051 400052 400053
400054
400055
400056
400057
400058
400059
400060
400061
TION 4: Appe
r Employer
(2)
Thompson Public SchNorthern Plains SpeciEd Unit Bowman County SchDistrict #1 Apple Creek ElementSchool Burke Central SchoolWashburn Public SchEnderlin Area SchoolDistrict #24 Midkota School Velva Public School Sheyenne Valley SpeEducation Unit Center Stanton PublicSchool Burleigh County SpecEducation Unit New Rockford SheyePublic School James River MultidisSpecial Education UnNewburg United PubSchool Napoleon Public SchoDistrict #2 Yellowstone School District # 14 Cavalier Public Schoo
ndices for GASB
Diff Between Expected
and Actual Experience
PaInE
P
(3)
hool 6,954 ial 2,432
hool 13,731
tary 1,150
l 2,019 hool 7,860 l 10,373
1,887 8,044
cial 11,517
c 5,675
cial 1,027
enne 5,112
trict nit
8,642
lic 4,575
ool 5,129
2,020
ols 9,145
B 68 for North D
Deferred InflowNet Diff
Between Projected
and Actual nvestment arnings on Pension
Plan Invest-ments
Chgs oAssumptions
(4) (5)
27,699 - 9,685 -
54,689 -
4,582 -
8,040 - 31,307 - 41,314 -
7,515 - 32,037 - 45,869 -
22,602 -
4,092 -
20,360 -
34,420 -
18,221 -
20,430 -
8,046 -
36,422 -
Dakota Public Em
ws of Resources
of m-s
Changes in Proportion
and Diff Between Employer Contrib & Propor-
tionate Share of Contribs
ToOR
(6)
854 -
6,694
233
45,863 41,954
254
58,789 - -
-
29
166
-
2,742
1,677
6,872
607
mployees Retirem
otal Deferred Outflows of Resources
DiffBetweExpec
and AcExperie
(7) (8)
35,507 12,117
75,114
5,965
55,922 81,121 51,941
68,191 40,081 57,386
28,277
5,148
25,638
43,062
25,538
27,236
16,938
46,174
ment System
Deferre
f een cted ctual ence
Net Diff Between Projected
and Actual Investment Earnings on Pension Plan Investments
(9)
- (32,759)- (11,454)
- (64,681)
- (5,419)
- (9,509)- (37,026)- (48,862)
- (8,888)- (37,890)- (54,249)
- (26,731)
- (4,840)
- (24,080)
- (40,709)
- (21,550)
- (24,162)
- (9,516)
- (43,076)
d Outflows of Resou
Changes of Assump-
tions
ChangPropo
and BetwEmplContProp
tionateof Co
(10) (1
(21,357) ((7,467)
(42,169)
(3,533)
(6,199)(24,139)(31,856) (
(5,795)(24,703)(35,368) (6
(17,427)
(3,155)
(15,699) (
(26,540) (2
(14,050)
(15,753)
(6,204)
(28,084) (
urces ges in ortion Diff
ween loyer rib & por-
e Share ontrib
Total DeferreInflows of Resources
1) (12)
17,290) (71,406(4,063) (22,984
(1,172) (108,022
(206) (9,158
(361) (16,069(1,975) (63,14011,525) (92,243
(338) (15,021(8,766) (71,35964,954) (154,571
(2,017) (46,175
(2,527) (10,522
17,014) (56,793
28,630) (95,879
(819) (36,419
- (39,915
- (15,720
12,809) (83,969
Def ed
f s 2016
(13)
6) (9,791)4) (3,085)
2) (11,706)
8) (1,068)
9) 7,253 0) 692 3) (11,944)
1) 9,976 9) (9,268)1) (23,791)
5) (5,702)
2) (1,460)
3) (8,154)
9) (13,814)
9) (3,883)
5) (4,450)
0) (505)
9) (10,985)
ferred Inflows/(OutflPension Exp
2017 2018
(14) (15)
(9,791) (9(3,085) (3
(11,706) (11
(1,068) (1
7,253 7692
(11,944) (11
9,976 9(9,268) (9
(23,791) (23
(5,702) (5
(1,460) (1
(8,154) (8
(13,814) (13
(3,883) (3
(4,450) (4
(505)
(10,985) (10
lows) Recognized Inpense (Year Ended J
8 2019
(16)
9,791) 665 3,085) 571
1,706) 8,940
1,068) 662
7,253 10,288 692 12,511
1,944) 3,653
9,976 12,813 9,268) 2,826 3,791) (6,475)
5,702) 2,830
1,460) 85
8,154) (468)
3,814) (820)
3,883) 2,996
4,450) 3,262
(505) 2,532
0,985) 2,765
79
n Future June 30):
2020 There-after
(17) (18)
(7,189) - (2,196) -
(6,732) -
(651) -
7,801 - 3,388 -
(8,122) -
10,427 - (6,304) -
(19,342) -
(3,631) -
(1,078) -
(6,226) -
(10,568) -
(2,230) -
(2,586) -
206 -
(7,604) -
e r

SECT
Employer ID
(1)
400062
400063
400064 400065
400068
400069
400070
400072
400073 400074 400075
400076 400077 400078
400079
400080
400081
400082
TION 4: Appe
r Employer
(2)
Richland School Dist44 Fort Totten School District # 30 Bismarck Public SchoSolen Public School D#3 Lakota Public SchoolDistrict # 66 Stanley Community Public School DistricMandan Public SchooDistrict #1 Killdeer Public Schoo#16 Glenburn School DistNew Public School #Williston Public Scho#1 Valley City Public ScDickinson Public SchDrayton Public Schoo#19 Mohall Lansford Sherwood School Westhope Public Sch#17 Kindred Public SchooDistrict #2 Grafton Public SchooDistrict #3
ndices for GASB
Diff Between Expected
and Actual Experience
PaInE
P
(3)
trict # 8,407
7,556
ools 466,505 Dist 2,979
l 5,797
t # 2 24,024
ol 150,021
ol 15,349
trict 7,799 8 10,647 ool 86,818
chool 20,860 hools 94,791 ol 3,670
7,474
hool 6,019
ol 9,636
ol 25,623
B 68 for North D
Deferred InflowNet Diff
Between Projected
and Actual nvestment arnings on Pension
Plan Invest-ments
Chgs oAssumptions
(4) (5)
33,483 -
30,096 -
1,858,030 - 11,865 -
23,088 -
95,683 -
597,516 -
61,132 -
31,061 - 42,407 -
345,784 -
83,082 - 377,541 -
14,619 -
29,769 -
23,972 -
38,379 -
102,052 -
Dakota Public Em
ws of Resources
of m-s
Changes in Proportion
and Diff Between Employer Contrib & Propor-
tionate Share of Contribs
ToOR
(6)
2,162
988
730,305 -
17,077
163,977
211,781
67,425
5,003 83,599
190,733
32,182 14,883
1,313
32,642
14,405
1,452
54,885
mployees Retirem
otal Deferred Outflows of Resources
DiffBetweExpec
and AcExperie
(7) (8)
44,052
38,640
3,054,840 14,844
45,962
283,684
959,318
143,906
43,863 136,653 623,335
136,124 487,215 19,602
69,885
44,396
49,467
182,560
ment System
Deferre
f een cted ctual ence
Net Diff Between Projected
and Actual Investment Earnings on Pension Plan Investments
(9)
- (39,600)
- (35,594)
- (2,197,479)- (14,033)
- (27,306)
- (113,163)
- (706,678)
- (72,300)
- (36,735)- (50,154)- (408,956)
- (98,260)- (446,515)- (17,290)
- (35,207)
- (28,351)
- (45,391)
- (120,697)
d Outflows of Resou
Changes of Assump-
tions
ChangPropo
and BetwEmplContProp
tionateof Co
(10) (1
(25,818) (2
(23,206) (4
(1,432,664) (2(9,149) (3
(17,802)
(73,778)
(460,724)
(47,137)
(23,950)(32,699)
(266,622)
(64,061)(291,109) (7
(11,272) (6
(22,954)
(18,484)
(29,593)
(78,689)
urces ges in ortion Diff
ween loyer rib & por-
e Share ontrib
Total DeferreInflows of Resources
1) (12)
22,870) (88,288
40,380) (99,180
24,897) (3,655,04034,155) (57,337
- (45,108
- (186,941
(218) (1,167,620
(935) (120,372
(471) (61,156- (82,853- (675,578
(1,223) (163,54470,786) (808,41066,484) (95,046
(30) (58,191
(1,078) (47,913
(3,982) (78,966
(1,624) (201,010
Def ed
f s 2016
(13)
8) (12,004)
0) (14,962)
0) (293,732)7) (9,638)
8) (1,981)
1) 10,507
0) (97,530)
2) (974)
6) (6,368)3) 6,850 8) (42,725)
4) (13,252)0) (99,693)6) (16,513)
1) (427)
3) (2,940)
6) (9,501)
0) (13,218)
ferred Inflows/(OutflPension Exp
2017 2018
(14) (15)
(12,004) (12
(14,962) (14
(293,732) (293(9,638) (9
(1,981) (1
10,507 10
(97,530) (97
(974)
(6,368) (66,850 6
(42,725) (42
(13,252) (13(99,693) (99(16,513) (16
(427)
(2,940) (2
(9,501) (9
(13,218) (13
lows) Recognized Inpense (Year Ended J
8 2019
(16)
2,004) 636
4,962) (3,601)
3,732) 407,698 9,638) (5,159)
1,981) 6,735
0,507 46,629
7,530) 128,040
(974) 22,104
6,368) 5,358 6,850 22,859 2,725) 87,813
3,252) 18,112 9,693) 42,834 6,513) (10,994)
(427) 10,812
2,940) 6,110
9,501) 4,988
3,218) 25,308
80
n Future June 30):
2020 There-after
(17) (18)
(8,853) -
(12,046) -
(126,799) - (8,421) -
65 -
18,607 -
(43,753) -
4,345 -
(3,551) - 10,421 -
(11,759) -
(5,785) - (64,893) - (14,910) -
2,162 -
(809) -
(5,975) -
(4,109) -
e r

SECT
Employer ID
(1)
400083
400084
400085
400086 400087
400088
400089
400090
400091
400092
400093
400094
400095
400096
400099 400100
400101
TION 4: Appe
r Employer
(2)
Wilton Public SchoolDistrict Sheyenne Valley CareAnd Tech Center White Shield School #85 Tgu School District #Turtle Lake Mercer School District #72 Lamoure School Dist#8 Divide County SchooDist #1 Mott/Regent School D#1 United Public SchoolDistrict # 7 Kulm Public School District #7 Midway Public SchooDistrict #128 Dunseith School Dist#1 Carrington School Di#49 Glen Ullin Public Sch#48 Manvel Public SchooMaple Valley School District North Border School District # 100
ndices for GASB
Diff Between Expected
and Actual Experience
PaInE
P
(3)
l 4,240
eer 2,035
Dist 18,764
#60 34,489 9,363
trict 10,364
ol 11,890
Dist 7,750
l 19,996
7,182
ol 11,620
trict 23,686
istrict 9,196
hool 6,470
ol 3,362 5,505
9,534
B 68 for North D
Deferred InflowNet Diff
Between Projected
and Actual nvestment arnings on Pension
Plan Invest-ments
Chgs oAssumptions
(4) (5)
16,888 -
8,104 -
74,734 -
137,365 - 37,290 -
41,278 -
47,355 -
30,869 -
79,641 -
28,606 -
46,282 -
94,337 -
36,627 -
25,770 -
13,391 - 21,927 -
37,974 -
Dakota Public Em
ws of Resources
of m-s
Changes in Proportion
and Diff Between Employer Contrib & Propor-
tionate Share of Contribs
ToOR
(6)
2,030
6,927
106,686
10,042 117,516
5,672
-
1,608
118,855
23,061
3,073
-
-
209
- -
700
mployees Retirem
otal Deferred Outflows of Resources
DiffBetweExpec
and AcExperie
(7) (8)
23,158
17,066
200,184
181,896 164,169
57,314
59,245
40,227
218,492
58,849
60,975
118,023
45,823
32,449
16,753 27,432
48,208
ment System
Deferre
f een cted ctual ence
Net Diff Between Projected
and Actual Investment Earnings on Pension Plan Investments
(9)
- (19,973)
- (9,584)
- (88,388)
- (162,461)- (44,103)
- (48,819)
- (56,006)
- (36,508)
- (94,191)
- (33,832)
- (54,738)
- (111,572)
- (43,319)
- (30,478)
- (15,837)- (25,933)
- (44,912)
d Outflows of Resou
Changes of Assump-
tions
ChangPropo
and BetwEmplContProp
tionateof Co
(10) (1
(13,022)
(6,249)
(57,625)
(105,918)(28,753)
(31,828)
(36,514) (2
(23,802)
(61,408)
(22,057)
(35,687)
(72,740) (2
(28,242) (2
(19,870)
(10,325)(16,907)
(29,281) (2
urces ges in ortion Diff
ween loyer rib & por-
e Share ontrib
Total DeferreInflows of Resources
1) (12)
(6,386) (39,381
(364) (16,197
(3,101) (149,114
- (268,379(1,617) (74,473
(748) (81,395
28,621) (121,141
(4,622) (64,932
(1,932) (157,531
- (55,889
(2,467) (92,892
23,129) (207,441
26,384) (97,945
(466) (50,814
(3,552) (29,714(5,250) (48,090
21,973) (96,166
Def ed
f s 2016
(13)
1) (4,831)
7) (581)
4) 3,288
9) (30,172)3) 14,534
5) (8,683)
1) (16,844)
2) (7,838)
1) 4,817
9) (2,072)
2) (10,723)
1) (26,750)
5) (13,881)
4) (6,090)
4) (3,851)0) (6,192)
6) (13,169)
ferred Inflows/(OutflPension Exp
2017 2018
(14) (15)
(4,831) (4
(581)
3,288 3
(30,172) (3014,534 14
(8,683) (8
(16,844) (16
(7,838) (7
4,817 4
(2,072) (2
(10,723) (10
(26,750) (26
(13,881) (13
(6,090) (6
(3,851) (3(6,192) (6
(13,169) (13
lows) Recognized Inpense (Year Ended J
8 2019
(16)
4,831) 1,544
(581) 2,478
3,288 31,501
0,172) 21,685 4,534 28,612
8,683) 6,900
6,844) 1,033
7,838) 3,815
4,817 34,883
2,072) 8,727
0,723) 6,749
6,750) 8,863
3,881) (53)
6,090) 3,638
3,851) 1,204 6,192) 2,086
3,169) 1,166
81
n Future June 30):
2020 There-after
(17) (18)
(3,263) -
132 -
9,691 -
(17,642) - 17,474 -
(4,933) -
(12,406) -
(4,998) -
11,618 -
450 -
(6,504) -
(18,046) -
(10,431) -
(3,736) -
(2,617) - (4,168) -
(9,611) -
e r

SECT
Employer ID
(1)
400102
400103
400104
400105
400106
400107 400108
400109
400114 400117
400118
400119
400120
400121
400122
400123
400124
TION 4: Appe
r Employer
(2)
Mckenzie Cty Public School #1 Devils Lake Public School Mt Pleasant School D#4 Central Cass Public School District #7 Milnor Public SchoolDistrict #2 Mapleton Public SchoLinton Public School District #36 Tioga Public School District #15 Zeeland Public SchooGarrison Public SchoDistrict #51 Kenmare Public SchoDistrict #28 Lewis & Clark PublicSchools Sw Special EducationUnit North Valley Career &Technology Center Dakota Prairie PublicSchool Beach Public School District #3 Rolette Public School
ndices for GASB
Diff Between Expected
and Actual Experience
PaInE
P
(3)
35,857
56,759
Dist 7,471
14,392
l 7,870
ool 224 10,548
15,756
ols 1,589 ol 11,065
ool 9,263
c 8,652
n 1,530
& 3,456
c 12,626
17,489
l 4,291
B 68 for North D
Deferred InflowNet Diff
Between Projected
and Actual nvestment arnings on Pension
Plan Invest-ments
Chgs oAssumptions
(4) (5)
142,812 -
226,065 -
29,757 -
57,321 -
31,344 -
892 - 42,013 -
62,755 -
6,330 - 44,071 -
36,892 -
34,461 -
6,094 -
13,763 -
50,288 -
69,658 -
17,090 -
Dakota Public Em
ws of Resources
of m-s
Changes in Proportion
and Diff Between Employer Contrib & Propor-
tionate Share of Contribs
ToOR
(6)
181,869
12,203
34,658
3,166
35,666
3,747 27,388
48,788
356 25,286
27,204
-
-
19,096
33,801
46,202
556
mployees Retirem
otal Deferred Outflows of Resources
DiffBetweExpec
and AcExperie
(7) (8)
360,538
295,027
71,886
74,879
74,880
4,863 79,949
127,299
8,275 80,422
73,359
43,113
7,624
36,315
96,715
133,349
21,937
ment System
Deferre
f een cted ctual ence
Net Diff Between Projected
and Actual Investment Earnings on Pension Plan Investments
(9)
- (168,903)
- (267,365)
- (35,194)
- (67,793)
- (37,071)
- (1,055)- (49,688)
- (74,220)
- (7,486)- (52,123)
- (43,632)
- (40,757)
- (7,207)
- (16,278)
- (59,476)
- (82,384)
- (20,212)
d Outflows of Resou
Changes of Assump-
tions
ChangPropo
and BetwEmplContProp
tionateof Co
(10) (1
(110,117)
(174,311) (4
(22,945)
(44,198) (
(24,168)
(688) (3(32,394)
(48,388)
(4,881)(33,982)
(28,446)
(26,572) (2
(4,699)
(10,612)
(38,776)
(53,711)
(13,177)
urces ges in ortion Diff
ween loyer rib & por-
e Share ontrib
Total DeferreInflows of Resources
1) (12)
- (279,020
49,673) (491,349
(387) (58,526
18,334) (130,325
(1,198) (62,437
30,308) (32,051(117) (82,199
- (122,608
(284) (12,6510 (86,105
(1,654) (73,732
29,693) (97,022
(9,837) (21,743
(1,541) (28,431
- (98,252
(2,970) (139,065
(5,241) (38,630
Def ed
f s 2016
(13)
0) 3,056
9) (60,497)
6) (91)
5) (16,477)
7) (424)
1) (5,542)9) (4,370)
8) (4,909)
1) (1,469)5) (5,250)
2) (3,514)
2) (14,038)
3) (3,403)
1) 300
2) (4,997)
5) (7,641)
0) (4,947)
ferred Inflows/(OutflPension Exp
2017 2018
(14) (15)
3,056 3
(60,497) (60
(91)
(16,477) (16
(424)
(5,542) (5(4,370) (4
(4,909) (4
(1,469) (1(5,250) (5
(3,514) (3
(14,038) (14
(3,403) (3
300
(4,997) (4
(7,641) (7
(4,947) (4
lows) Recognized Inpense (Year Ended J
8 2019
(16)
3,056 56,969
0,497) 24,845
(91) 11,143
6,477) 5,163
(424) 11,409
5,542) (5,205) 4,370) 11,491
4,909) 18,782
1,469) 920 5,250) 11,388
3,514) 10,414
4,038) (1,029)
3,403) (1,102)
300 5,496
4,997) 13,988
7,641) 18,655
4,947) 1,505
82
n Future June 30):
2020 There-after
(17) (18)
15,437 -
(39,628) -
2,488 -
(11,165) -
2,298 -
(5,338) - (636) -
636 -
(890) - (1,313) -
(252) -
(10,769) -
(2,810) -
1,479 -
(527) -
(1,456) -
(3,360) -
e r

SECT
Employer ID
(1)
400125
400137
400138 400139
400140
400141
400142
400143
400144
400145
400147 400148
400149
400150
400151
500002
500003
TION 4: Appe
r Employer
(2)
Drake Public School District New Salem Almont School District #49 Max Public School East Central Special Education Unit North Sargent SchoolDistrict #3 Wahpeton Public SchDistrict 37 Medina Public SchooDistrict #3 Pingree-Buchanan ScDistrict West River Student Services Leeds Public School District 6 Sawyer Public SchooWilmac Multidistrict Special Education UnGreat Northwest Education CooperativAnamoose Public SchDistrict #14 South Prairie School District #70 Cass County Water Resource District Walsh County Water Resource District
ndices for GASB
Diff Between Expected
and Actual Experience
PaInE
P
(3)
5,510
8,279
6,975 6,573
l 8,159
hool 30,223
ol 4,173
chool 5,205
1,379
4,226
l 3,480
nit 14,876
ve 3,822
hool 3,002
9,748
4,449
726
B 68 for North D
Deferred InflowNet Diff
Between Projected
and Actual nvestment arnings on Pension
Plan Invest-ments
Chgs oAssumptions
(4) (5)
21,944 -
32,975 -
27,780 - 26,180 -
32,495 -
120,374 -
16,622 -
20,730 -
5,492 -
16,830 -
13,859 - 59,250 -
15,222 -
11,956 -
38,827 -
17,721 -
2,891 -
Dakota Public Em
ws of Resources
of m-s
Changes in Proportion
and Diff Between Employer Contrib & Propor-
tionate Share of Contribs
ToOR
(6)
37,486
1,407
497 49,827
18,536
16,830
-
-
577
-
4,916 78,615
16,570
95,373
303,723
1,058
665
mployees Retirem
otal Deferred Outflows of Resources
DiffBetweExpec
and AcExperie
(7) (8)
64,940
42,661
35,252 82,580
59,190
167,427
20,795
25,935
7,448
21,056
22,255 152,741
35,614
110,331
352,298
23,228
4,282
ment System
Deferre
f een cted ctual ence
Net Diff Between Projected
and Actual Investment Earnings on Pension Plan Investments
(9)
- (25,953)
- (38,999)
- (32,856)- (30,963)
- (38,431)
- (142,366)
- (19,659)
- (24,517)
- (6,495)
- (19,905)
- (16,391)- (70,075)
- (18,003)
- (14,140)
- (45,920)
- (20,958)
- (3,419)
d Outflows of Resou
Changes of Assump-
tions
ChangPropo
and BetwEmplContProp
tionateof Co
(10) (1
(16,920)
(25,426)
(21,420)(20,186)
(25,055)
(92,817)
(12,817)
(15,984) (
(4,235)
(12,977)
(10,686) (4(45,686)
(11,737)
(9,219)
(29,938)
(13,664)
(2,229)
urces ges in ortion Diff
ween loyer rib & por-
e Share ontrib
Total DeferreInflows of Resources
1) (12)
(767) (43,640
(242) (64,667
(1,156) (55,432(438) (51,587
(1,461) (64,947
- (235,183
(6,014) (38,490
12,966) (53,467
- (10,730
(1,748) (34,630
49,022) (76,099- (115,761
(684) (30,424
- (23,359
(1,744) (77,602
(229) (34,851
(2,632) (8,280
Def ed
f s 2016
(13)
0) 2,231
7) (7,493)
2) (6,642)7) 3,783
7) (4,185)
3) (24,828)
0) (5,103)
7) (7,462)
0) (1,171)
0) (4,295)
9) (12,105)1) 1,903
4) (377)
9) 16,349
2) 51,541
1) (3,986)
0) (1,071)
ferred Inflows/(OutflPension Exp
2017 2018
(14) (15)
2,231 2
(7,493) (7
(6,642) (63,783 3
(4,185) (4
(24,828) (24
(5,103) (5
(7,462) (7
(1,171) (1
(4,295) (4
(12,105) (121,903 1
(377)
16,349 16
51,541 51
(3,986) (3
(1,071) (1
lows) Recognized Inpense (Year Ended J
8 2019
(16)
2,231 10,515
7,493) 4,956
6,642) 3,846 3,783 13,667
4,185) 8,082
4,828) 20,615
5,103) 1,172
7,462) 364
1,171) 902
4,295) 2,059
2,105) (6,873) 1,903 24,271
(377) 5,370
6,349 20,863
1,541 66,199
3,986) 2,703
1,071) 20
83
n Future June 30):
2020 There-after
(17) (18)
4,088 -
(4,486) -
(4,098) - 5,974 -
(1,289) -
(13,881) -
(3,560) -
(5,515) -
(671) -
(2,749) -
(10,639) - 7,002 -
950 -
17,065 -
53,869 -
(2,368) -
(799) -
e r
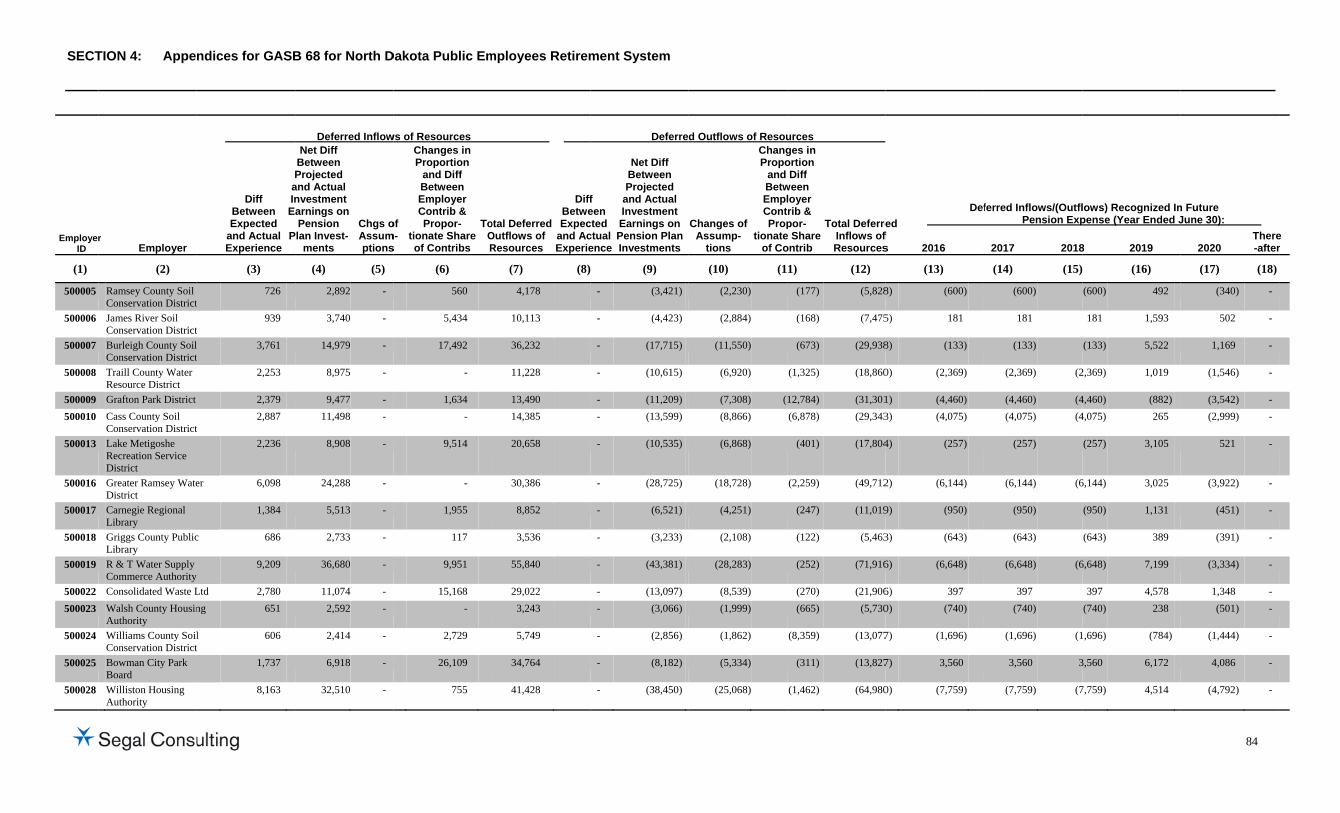
SECT
Employer ID
(1)
500005
500006
500007
500008
500009 500010
500013
500016
500017
500018
500019
500022 500023
500024
500025
500028
TION 4: Appe
r Employer
(2)
Ramsey County Soil Conservation DistrictJames River Soil Conservation DistrictBurleigh County SoilConservation DistrictTraill County Water Resource District Grafton Park District Cass County Soil Conservation DistrictLake Metigoshe Recreation Service District Greater Ramsey WateDistrict Carnegie Regional Library Griggs County PublicLibrary R & T Water Supply Commerce AuthorityConsolidated Waste LWalsh County HousinAuthority Williams County SoilConservation DistrictBowman City Park Board Williston Housing Authority
ndices for GASB
Diff Between Expected
and Actual Experience
PaInE
P
(3)
t 726
t 939
l t
3,761
2,253
2,379
t 2,887
2,236
er 6,098
1,384
c 686
9,209
Ltd 2,780 ng 651
l t
606
1,737
8,163
B 68 for North D
Deferred InflowNet Diff
Between Projected
and Actual nvestment arnings on Pension
Plan Invest-ments
Chgs oAssumptions
(4) (5)
2,892 -
3,740 -
14,979 -
8,975 -
9,477 - 11,498 -
8,908 -
24,288 -
5,513 -
2,733 -
36,680 -
11,074 - 2,592 -
2,414 -
6,918 -
32,510 -
Dakota Public Em
ws of Resources
of m-s
Changes in Proportion
and Diff Between Employer Contrib & Propor-
tionate Share of Contribs
ToOR
(6)
560
5,434
17,492
-
1,634 -
9,514
-
1,955
117
9,951
15,168 -
2,729
26,109
755
mployees Retirem
otal Deferred Outflows of Resources
DiffBetweExpec
and AcExperie
(7) (8)
4,178
10,113
36,232
11,228
13,490 14,385
20,658
30,386
8,852
3,536
55,840
29,022 3,243
5,749
34,764
41,428
ment System
Deferre
f een cted ctual ence
Net Diff Between Projected
and Actual Investment Earnings on Pension Plan Investments
(9)
- (3,421)
- (4,423)
- (17,715)
- (10,615)
- (11,209)- (13,599)
- (10,535)
- (28,725)
- (6,521)
- (3,233)
- (43,381)
- (13,097)- (3,066)
- (2,856)
- (8,182)
- (38,450)
d Outflows of Resou
Changes of Assump-
tions
ChangPropo
and BetwEmplContProp
tionateof Co
(10) (1
(2,230)
(2,884)
(11,550)
(6,920)
(7,308) ((8,866)
(6,868)
(18,728)
(4,251)
(2,108)
(28,283)
(8,539)(1,999)
(1,862)
(5,334)
(25,068)
urces ges in ortion Diff
ween loyer rib & por-
e Share ontrib
Total DeferreInflows of Resources
1) (12)
(177) (5,828
(168) (7,475
(673) (29,938
(1,325) (18,860
12,784) (31,301(6,878) (29,343
(401) (17,804
(2,259) (49,712
(247) (11,019
(122) (5,463
(252) (71,916
(270) (21,906(665) (5,730
(8,359) (13,077
(311) (13,827
(1,462) (64,980
Def ed
f s 2016
(13)
8) (600)
5) 181
8) (133)
0) (2,369)
1) (4,460)3) (4,075)
4) (257)
2) (6,144)
9) (950)
3) (643)
6) (6,648)
6) 397 0) (740)
7) (1,696)
7) 3,560
0) (7,759)
ferred Inflows/(OutflPension Exp
2017 2018
(14) (15)
(600)
181
(133)
(2,369) (2
(4,460) (4(4,075) (4
(257)
(6,144) (6
(950)
(643)
(6,648) (6
397 (740)
(1,696) (1
3,560 3
(7,759) (7
lows) Recognized Inpense (Year Ended J
8 2019
(16)
(600) 492
181 1,593
(133) 5,522
2,369) 1,019
4,460) (882) 4,075) 265
(257) 3,105
6,144) 3,025
(950) 1,131
(643) 389
6,648) 7,199
397 4,578 (740) 238
1,696) (784)
3,560 6,172
7,759) 4,514
84
n Future June 30):
2020 There-after
(17) (18)
(340) -
502 -
1,169 -
(1,546) -
(3,542) - (2,999) -
521 -
(3,922) -
(451) -
(391) -
(3,334) -
1,348 - (501) -
(1,444) -
4,086 -
(4,792) -
e r

SECT
Employer ID
(1)
500030
500031
500033
500038
500039
500040 500041
500045
500047
500049 500053
500054
500055
500056
500057
500059 500060
TION 4: Appe
r Employer
(2)
Minot Rural Fire Department Central Plains Water District Ransom County Soil Dist Jamestown Regional Airport Pierce County Soil Conservation DistrictFargo Park District Bismarck Rural Fire Protection Dunseith CommunityNursing Home Mercer County Soil Conservation DistrictWest Fargo Park DistStutsman County HouAuthority Grand Forks County Water Resource DistrSoutheast Region Car& Technology CenterCavalier County Job Development AuthoriBarnes County Soil Conservation DistrictTraill Rural Water DiDevils Lake Basin JoWater Resource Boar
ndices for GASB
Diff Between Expected
and Actual Experience
PaInE
P
(3)
1,592
3,996
Cons 1,866
3,005
t -
43,863 7,857
y 19,105
t 2,234
trict 19,010 using 1,778
rict 1,232
reer r
2,004
ity 957
t 2,310
istrict 835 int
rd 1,013
B 68 for North D
Deferred InflowNet Diff
Between Projected
and Actual nvestment arnings on Pension
Plan Invest-ments
Chgs oAssumptions
(4) (5)
6,341 -
15,916 -
7,430 -
11,969 -
- -
174,702 - 31,292 -
76,091 -
8,897 -
75,716 - 7,082 -
4,908 -
7,981 -
3,810 -
9,201 -
3,327 - 4,036 -
Dakota Public Em
ws of Resources
of m-s
Changes in Proportion
and Diff Between Employer Contrib & Propor-
tionate Share of Contribs
ToOR
(6)
247
1,485
-
212
-
146,047 6,251
2,951
16,576
15,009 3,163
-
-
689
2,587
1,937 -
mployees Retirem
otal Deferred Outflows of Resources
DiffBetweExpec
and AcExperie
(7) (8)
8,180
21,397
9,296
15,186
-
364,612 45,400
98,147
27,707
109,735 12,023
6,140
9,985
5,456
14,098
6,099 5,049
ment System
Deferre
f een cted ctual ence
Net Diff Between Projected
and Actual Investment Earnings on Pension Plan Investments
(9)
- (7,500)
- (18,824)
- (8,788)
- (14,156)
- -
- (206,619)- (37,009)
- (89,992)
- (10,523)
- (89,548)- (8,376)
- (5,804)
- (9,439)
- (4,506)
- (10,882)
- (3,935)- (4,774)
d Outflows of Resou
Changes of Assump-
tions
ChangPropo
and BetwEmplContProp
tionateof Co
(10) (1
(4,890)
(12,272) (2
(5,729)
(9,229) (3
-
(134,707)(24,129)
(58,671) (3
(6,860)
(58,382)(5,461)
(3,784)
(6,154)
(2,938)
(7,094)
(2,566) (3(3,112)
urces ges in ortion Diff
ween loyer rib & por-
e Share ontrib
Total DeferreInflows of Resources
1) (12)
(285) (12,675
23,473) (54,569
(1,777) (16,294
31,838) (55,223
- -
(7,683) (349,009(1,407) (62,545
37,879) (186,542
(401) (17,784
(3,923) (151,8530 (13,837
(805) (10,393
(426) (16,019
(171) (7,615
(413) (18,389
34,525) (41,026(918) (8,804
Def ed
f s 2016
(13)
5) (1,494)
9) (8,145)
4) (2,098)
3) (9,155)
-
9) (13,153)5) (6,360)
2) (24,843)
4) 1,164
3) (15,516)7) (1,025)
3) (1,311)
9) (1,955)
5) (789)
9) (1,719)
6) (7,324)4) (1,130)
ferred Inflows/(OutflPension Exp
2017 2018
(14) (15)
(1,494) (1
(8,145) (8
(2,098) (2
(9,155) (9
-
(13,153) (13(6,360) (6
(24,843) (24
1,164 1
(15,516) (15(1,025) (1
(1,311) (1
(1,955) (1
(789)
(1,719) (1
(7,324) (7(1,130) (1
lows) Recognized Inpense (Year Ended J
8 2019
(16)
1,494) 900
8,145) (2,136)
2,098) 707
9,155) (4,636)
- -
3,153) 52,800 6,360) 5,454
4,843) 3,882
1,164 4,523
5,516) 13,068 1,025) 1,649
1,311) 542
1,955) 1,058
(789) 650
1,719) 1,754
7,324) (6,068) 1,130) 394
85
n Future June 30):
2020 There-after
(17) (18)
(912) -
(6,597) -
(1,413) -
(7,933) -
- -
2,231 - (3,523) -
(17,736) -
1,909 -
(8,655) - (386) -
(861) -
(1,228) -
(441) -
(891) -
(6,880) - (757) -
e r

SECT
Employer ID
(1)
500061
500063
500068
500072 500080
500081
500082
500084
500085
500091
500107
500108
500109
500110 500111
500113
TION 4: Appe
r Employer
(2)
Ward County Water Resource District Southwest Water Authority Burleigh County CouOn Aging Watford City Park DiWestern & Central StSoil Conservation DisRamsey County HousAuthority Grand Forks Public Library Rolette County Soil Conservation DistrictJamestown Parks AndRecreation District Ramsey County WateResource District Grand Forks-E GrandForks Metropolitan Planning North Dakota FirefighAssociation James River Valley Library System Grand Forks Park DisMcintosh County HouAuthority Lonetree Special Education Unit
ndices for GASB
Diff Between Expected
and Actual Experience
PaInE
P
(3)
741
47,873
uncil 11,122
istrict 2,782 tark strict
2,038
sing 4,263
11,576
t 638
d 2,653
er 373
d 5,124
hters 3,868
5,467
strict 32,162 using 777
1,458
B 68 for North D
Deferred InflowNet Diff
Between Projected
and Actual nvestment arnings on Pension
Plan Invest-ments
Chgs oAssumptions
(4) (5)
2,951 -
190,671 -
44,299 -
11,081 - 8,116 -
16,981 -
46,105 -
2,540 -
10,568 -
1,485 -
20,410 -
15,407 -
21,774 -
128,098 - 3,093 -
5,806 -
Dakota Public Em
ws of Resources
of m-s
Changes in Proportion
and Diff Between Employer Contrib & Propor-
tionate Share of Contribs
ToOR
(6)
-
114,913
3,485
5,498 -
9,637
44,504
27
16,651
418
618
1,341
18,046
153,631 -
3,085
mployees Retirem
otal Deferred Outflows of Resources
DiffBetweExpec
and AcExperie
(7) (8)
3,692
353,457
58,906
19,361 10,154
30,881
102,185
3,205
29,872
2,276
26,152
20,616
45,287
313,891 3,870
10,349
ment System
Deferre
f een cted ctual ence
Net Diff Between Projected
and Actual Investment Earnings on Pension Plan Investments
(9)
- (3,490)
- (225,505)
- (52,392)
- (13,105)- (9,599)
- (20,083)
- (54,528)
- (3,004)
- (12,498)
- (1,756)
- (24,138)
- (18,222)
- (25,752)
- (151,501)- (3,658)
- (6,867)
d Outflows of Resou
Changes of Assump-
tions
ChangPropo
and BetwEmplContProp
tionateof Co
(10) (1
(2,276)
(147,020)
(34,157)
(8,544)(6,258)
(13,093)
(35,550)
(1,959)
(8,148)
(1,145)
(15,737) (2
(11,880)
(16,789)
(98,772)(2,385)
(4,477)
urces ges in ortion Diff
ween loyer rib & por-
e Share ontrib
Total DeferreInflows of Resources
1) (12)
(1,331) (7,097
- (372,525
(406) (86,955
- (21,649(831) (16,688
(763) (33,939
(1,868) (91,946
(2,888) (7,851
(585) (21,231
(67) (2,968
22,281) (62,156
(692) (30,794
- (42,541
(536) (250,809(1,694) (7,737
(261) (11,605
Def ed
f s 2016
(13)
7) (960)
5) (21,605)
5) (9,761)
9) (1,493)8) (2,069)
9) (2,197)
6) (2,241)
1) (1,169)
1) 750
8) (277)
6) (9,132)
4) (3,480)
1) (1,478)
9) 726 7) (1,065)
5) (794)
ferred Inflows/(OutflPension Exp
2017 2018
(14) (15)
(960)
(21,605) (21
(9,761) (9
(1,493) (1(2,069) (2
(2,197) (2
(2,241) (2
(1,169) (1
750
(277)
(9,132) (9
(3,480) (3
(1,478) (1
726 (1,065) (1
(794)
lows) Recognized Inpense (Year Ended J
8 2019
(16)
(960) 155
1,605) 50,376
9,761) 6,962
1,493) 2,691 2,069) 995
2,197) 4,213
2,241) 15,164
1,169) (210)
750 4,739
(277) 284
9,132) (1,428)
3,480) 2,336
1,478) 6,742
726 49,084 1,065) 103
(794) 1,398
86
n Future June 30):
2020 There-after
(17) (18)
(683) -
(4,594) -
(5,726) -
(499) - (1,324) -
(683) -
1,793 -
(925) -
1,652 -
(143) -
(7,178) -
(2,076) -
445 -
11,818 - (777) -
(273) -
e r

SECT
Employer ID
(1)
500114
500116
500117
500120
500121
TION 4: Appe
r Employer
(2)
Roughrider EducationServices Program (REWestern Area Water Supply Authority Red River Joint WateResource District Tri-Cities Joint Job Development AuthoriDevils Lake Park Boa
Total Allocation:
ndices for GASB
Diff Between Expected
and Actual Experience
PaInE
P
(3)
n ESP)
886
17,945
er -
ity 1,897
ard 2,707
$19,727,166
B 68 for North D
Deferred InflowNet Diff
Between Projected
and Actual nvestment arnings on Pension
Plan Invest-ments
Chgs oAssumptions
(4) (5)
3,530 -
71,474 -
- -
7,557 -
10,781 -
$78,570,811 -
Dakota Public Em
ws of Resources
of m-s
Changes in Proportion
and Diff Between Employer Contrib & Propor-
tionate Share of Contribs
ToOR
(6)
14,081
241,971
3,953
18,367
84,339
$16,431,930 $1
mployees Retirem
otal Deferred Outflows of Resources
DiffBetweExpec
and AcExperie
(7) (8)
18,497
331,390
3,953
27,821
97,827
14,729,907
ment System
Deferre
f een cted ctual ence
Net Diff Between Projected
and Actual Investment Earnings on Pension Plan Investments
(9)
- (4,175)
- (84,532)
- -
- (8,938)
- (12,751)
- $(92,925,145)
d Outflows of Resou
Changes of Assump-
tions
ChangPropo
and BetwEmplContProp
tionateof Co
(10) (1
(2,722)
(55,111)
- (5
(5,827)
(8,313)
$(60,583,275) $(16,5
urces ges in ortion Diff
ween loyer rib & por-
e Share ontrib
Total DeferreInflows of Resources
1) (12)
(158) (7,055
(3,867) (143,510
58,371) (58,371
- (14,765
(485) (21,549
14,792) $(170,023,212
Def ed
f s 2016
(13)
5) 1,968
0) 31,064
1) (10,927)
5) 1,917
9) 14,312
2) $(18,427,637) $(
ferred Inflows/(OutflPension Exp
2017 2018
(14) (15)
1,968 1
31,064 31
(10,927) (10
1,917 1
14,312 14
(18,427,637) $(18,427
lows) Recognized Inpense (Year Ended J
8 2019
(16)
1,968 3,300
1,064 58,046
0,927) (10,927)
1,917 4,770
4,312 18,382
7,637) $11,233,889 $
87
n Future June 30):
2020 There-after
(17) (18)
2,237 -
36,624 -
(10,693) -
2,535 -
14,961 -
$(11,243,381) -
e r
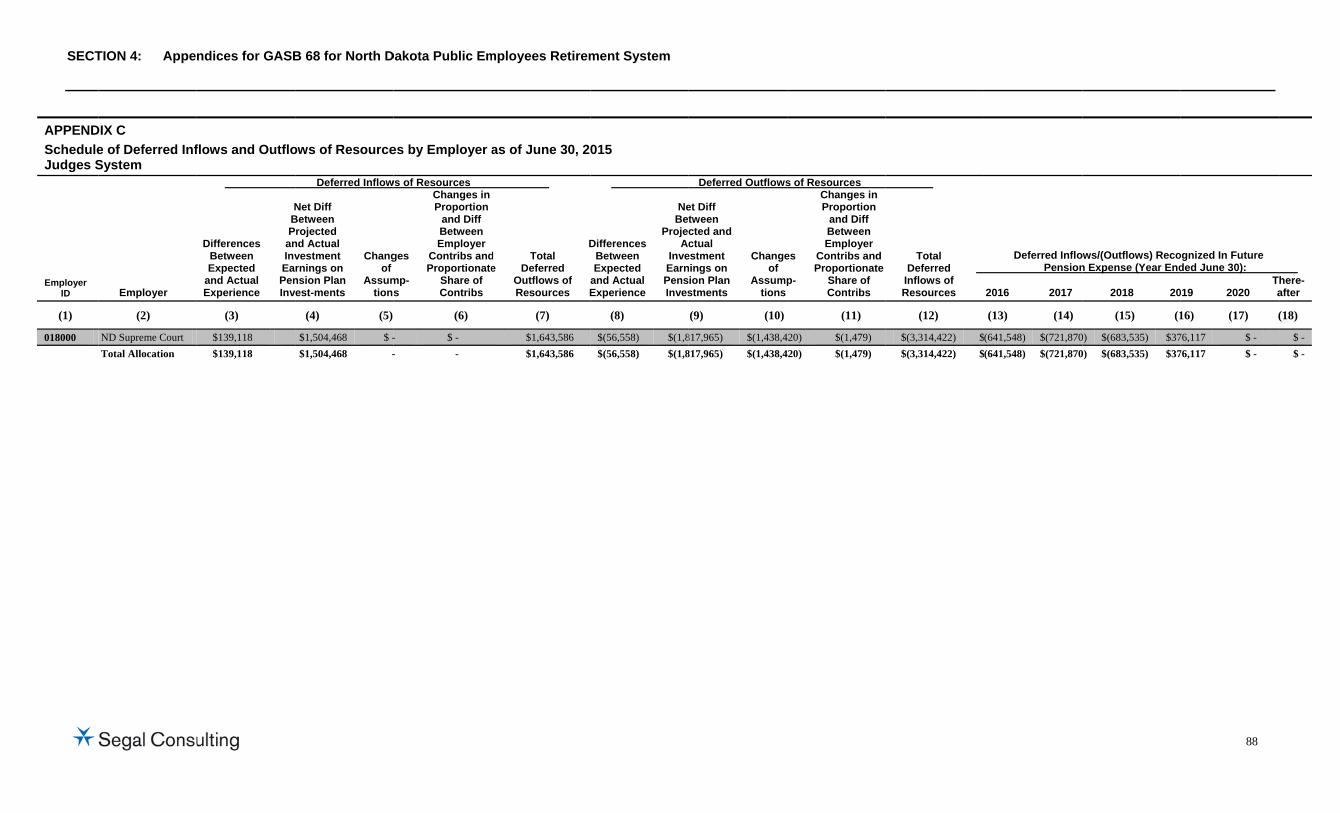
SECT
APPENDScheduleJudges S
Employer ID
(1)
018000
TION 4: Appe
DIX C e of Deferred InfSystem
Employer
(2)
ND Supreme Court Total Allocation
ndices for GASB
flows and Outflo
Differences Between Expected
and Actual Experience
NBP
anInvEaPenInv
(3)
$139,118 $139,118
B 68 for North D
ows of Resource
Deferred Inflow
Net Diff Between rojected
nd Actual vestment rnings on nsion Plan est-ments
Changof
Assumtions
(4) (5)
$1,504,468 $ - $1,504,468 -
Dakota Public Em
es by Employer a
ws of Resources
ges
mp-s
Changes in Proportion
and Diff Between Employer
Contribs andProportionate
Share of Contribs
(6)
- $ - - -
mployees Retirem
as of June 30, 2
d e
Total Deferred
Outflows of Resources
D
E
(7)
$1,643,586 $1,643,586
ment System
015
Differences Between Expected
and Actual Experience
NeBet
ProjecAc
InveEarnPensInves
(8)
$(56,558) $(1,8 $(56,558) $(1,8
Deferred Outflows
et Diff tween cted and ctual
estment nings on ion Plan stments
Changeof
Assumptions
(9) (10)
817,965) $(1,438,4817,965) $(1,438,4
s of Resources
es
p-
Changes in Proportion
and Diff Between Employer
Contribs and Proportionate
Share of Contribs
(11)
420) $(1,479) 420) $(1,479)
Total Deferred
Inflows of Resources
(12)
$(3,314,422) $$(3,314,422) $
Deferred InfloPension
2016 2017
(13) (14)
(641,548) $(721,870(641,548) $(721,870
ows/(Outflows) Recon Expense (Year End
2018 20
(15) (1
0) $(683,535) $370) $(683,535) $37
88
ognized In Future ded June 30):
019 2020 Ta
16) (17) (
76,117 $ - 76,117 $ -
here- after
(18)
$ - $ -

SECT
APPENDScheduleNational
Employer ID
(1)
054000
TION 4: Appe
DIX C e of Deferred InfGuard System
Employer
(2)
National Guard Total Allocation
ndices for GASB
flows and Outflo
Differences Between Expected
and Actual Experience
NB
ProjA
InvEarPenInve
(3)
$ - $1 - $1
B 68 for North D
ows of Resource
Deferred Inflows
Net Diff etween ected and Actual vestment rnings on sion Plan estments
Changof
Assumtions
(4) (5)
08,502 $ -08,502 -
Dakota Public Em
es by Employer a
s of Resources
ges
mp-s
Changes in Proportion
and Diff Between Employer
Contribs andProportionate
Share of Contribs
(6)
- $ - - -
mployees Retirem
as of June 30, 2
d e
Total Deferred Outflows
of Resources
D
aE
(7)
$108,502 $$108,502 $
ment System
015
Differences Between Expected
and Actual Experience
NeBet
ProjecAc
InveEarnPensInves
(8)
$(309,993) $(1$(309,993) $(1
Deferred Outflows
et Diff tween cted and ctual
estment nings on ion Plan stments
Changeof
Assumptions
(9) (10)
33,889) $(52,3133,889) $(52,3
s of Resources
es
p-
Changes in Proportion
and Diff Between Employer
Contribs and Proportionate
Share of Contribs
(11)
31) $(151) 31) $(151)
Total Deferred
Inflows of Resources
(12)
$(496,364) $ $(496,364) $
Deferred InfloPension
2016 2017
(13) (14)
(258,496) $(98,109(258,496) $(98,109
ows/(Outflows) Recon Expense (Year End
2018 20
(15) (1
9) $(58,381) $29) $(58,381) $2
89
ognized In Future ded June 30):
019 2020 T-
16) (17) (
27,124 $ - 27,124 $ -
There
after
(18)
$ - $ -

SECT
APPEScheLaw E
EmploID
(1)
0125200020002000200020002000200130003000300030003000300030003000300030003000
TION 4: Appe
ENDIX C edule of DeferredEnforcement Sy
oyer Employer Name
) (2)
500 Attorney General's010 City Of Cavalier 016 City Of Ellendale 028 City Of Thompson029 City Of Williston 030 City Of Bowman 070 City Of Powers La03 City Of Burlington
001 Adams County 003 Benson County 006 Bowman County 013 Dunn County 020 Griggs County 027 Mckenzie County 028 Mclean County 044 Slope County 045 Stark County 051 Ward County 053 Williams County
Total Allocation
ndices for GASB
d Inflows and Ouystem with Prior
e
DifferenceBetweenExpected
and ActuaExperienc
(3)
s Office $122,827 4,779 2,311
n - 102,828
8,380 ake 5,283 n 3,250
4,640 7,424 9,127
41,260 4,977
43,498 28,857
4,694 46,934 99,174
140,219
$680,462
B 68 for North D
utflows of ResouMain Service
Deferred In
es
d al ce
Net Diff Between Projected
and Actual Investment Earnings on
Pension Plan Invest-
ments
ChaAs
t
(4)
$143,507 5,584 2,700
- 120,141
9,791 6,173 3,798 5,421 8,674
10,664 48,207
5,815 50,821 33,716
5,484 54,836 115,871 163,827
$795,030
Dakota Public Em
urces by Employ
nflows of Resources
anges of ssump-tions
ChangesProportionDiff Betwe
EmployeContribs aProportion
Share oContrib
(5) (6)
$ - $ - - 3,284 - 946 - 3,119 - 9,490 - 7,003 - 18,463 - 968 - 4,176 - 63,750 - 9,799 - 107,430 - 1,845 - 209,174 - 6,971 - 15,810 - 17,702 - 8,283 - 73,554
- $561,768
mployees Retirem
yer as of June 3
s
in and een er and nate of s
Total Deferred
Outflows of Resources
D
aE
(7)
$266,334 4 13,647 6 5,957 9 3,119 0 232,459 3 25,174 3 29,919 8 8,016 6 14,237 0 79,848 9 29,590 0 196,897 5 12,637 4 303,493
69,544 0 25,988 2 119,472 3 223,328 4 377,600
8 $2,037,260
ment System
0, 2015
De
Differences Between Expected
and Actual Experience
Net DBetweProjec
and AcInvestmEarning
PensioPlan
Investm
(8) (9)
$- $(162,3- (6,3- (3,0- - (135,9- (11,0- (6,9- (4,2- (6,1- (9,8- (12,0- (54,5- (6,5- (57,5- (38,1- (6,2- (62,0- (131,1- (185,3
- $(899,6
eferred Outflows of RDiff een ted tual
ment s on on n
ments
Changes of Assump-
tions
PD
CP
(10)
385) $(173,015) 318) (6,732) 055) (3,255)
- - 945) (144,844) 079) (11,804) 985) (7,442) 297) (4,579) 134) (6,536) 815) (10,458) 067) (12,857) 549) (58,120) 580) (7,011) 506) (61,271) 151) (40,648) 206) (6,612) 049) (66,111) 114) (139,697) 378) (197,513)
613) $(958,505)
Resources
Changes in roportion and Diff Between
Employer Contribs and Proportionate
Share of Contribs
ToDef
InfloReso
(11) (1
$(144,690) $(48 (26,303) (3 (14,574) (2 (23,740) (2 (18,362) (29
(1,488) (2 (938) (1
(11,742) (2 (11,287) (2 (13,270) (3
(1,621) (2 (5,055) (11
(31,884) (4 - (11
(12,552) (9 (832) (1
(77,749) (20 (123,530) (39
(8,747) (39
$(528,364) $(2,38
otal ferred ows of ources
D
2016
12) (13)
80,090) $(57,978) 39,353) (5,754) 20,884) (3,286) 23,740) (4,150) 99,151) (25,950) 24,371) (859)
5,365) 2,284 20,618) (2,932) 23,957) (2,521) 33,543) 8,412 26,545) (500)
7,724) 10,902 45,475) (7,214)
8,777) 31,865 91,351) (7,905)
3,650) 1,910 05,909) (23,112) 94,341) (46,495) 91,638) (19,913)
86,482) $(153,196)
Deferred Inflows/(OuPension Expen
2017 201
(14) (15
$(57,978) $(57,9 (5,754) (5,7 (3,286) (3,2 (4,150) (4,1
(25,950) (25,9 (859) (8
2,284 2,2 (2,932) (2,9 (2,521) (2,5 8,412 8,4 (500) (5
10,902 10,9 (7,214) (7,2 31,865 31,8 (7,905) (7,9 1,910 1,9
(23,112) (23,1 (46,495) (46,4 (19,913) (19,9
$(153,196) $(153,1
utflows) Recognizednse (Year Ended Jun
18 2019
5) (16)
978) $(3,849) $754) (3,648) 286) (2,268) 150) (4,150) 949) 19,366 859) 2,834 284 4,613 932) (1,499) 521) (477) 412 11,684 500) 3,522 902 29,085 214) (5,020) 865 51,034 905) 4,812 910 3,978 112) (2,429) 495) (2,790) 913) 41,880
195) $146,678 $
90
d In Future ne 30):
2020 There- after
(17) (18)
$(38,217) $2,244 (4,883) 87 (2,844) 42 (4,021) -
(10,087) 1,878 394 153
2,992 97 (2,366) 59 (1,764) 85 9,249 136
857 167 16,628 754 (6,267) 91 37,293 795 (3,433) 527 2,545 86
(15,531) 857 (30,549) 1,812
1,259 2,561
$(48,744) $12,431

SECT
APPEScheLaw E
EmployID
(1)
200097200118300002300030300040
TION 4: Appe
ENDIX C edule of DeferredEnforcement Sy
yer Employer Nam
(2)
7 City Of Devils La8 City of Berthold 2 Barnes County 0 Morton County 0 Rolette County
Total Allocation
ndices for GASB
d Inflows and Ouystem without Pr
me
Differences Between Expected
and Actual Experience
(3)
ake $51,793 4,259
56,051 143,922
53,919
n $309,944
B 68 for North D
utflows of Resourior Main Service
Deferred INet Diff
Between Projected
and Actual Investment Earnings on
Pension Plan Invest-
ments
C
A
(4)
$14,638 1,204
15,841 40,675 15,238
$87,596
Dakota Public Em
urces by Employe nflows of Resource
Changes of
Assump-tions
ChangePropor
and DBetweEmplo
ContribsProportio
ShareContri
(5) (6)
$- $4,1 - - 3,6 - 8,7 - 2,6
- $19,2
mployees Retirem
yer as of June 3
s es in tion
Diff een yer
s and onate of ibs
Total Deferred
Outflows oResources
(7)
158 $70,589 - 5,463
667 75,559782 193,379654 71,811
261 $416,801
ment System
0, 2015
of s
Differences Between Expected
and Actual Experience
P
P
(8)
9 $- 3 -
9 -
9 -
1 -
1 -
Deferred Outf
Net Diff Between
Projected and Actual
Investment Earnings on Pension Plan Investments
Ch
Asst
(9) (
$(9,720) $(3 (799) (
(10,519) (3 (27,010) (8 (10,119) (3
$(58,167) $(18
flows of Resources
anges of
sump-ions
ChangesProporti
and DifBetweeEmploy
Contribs Proportion
Share oContrib
(10) (11)
31,192) $(9,680(2,565) (1,69033,756) (1,20486,675) 32,472)
86,660) $(12,573
s in ion ff
en yer and nate of bs
Total Deferred
Inflows of Resources
(12)
0) $(50,592)0) (5,054)4) (45,479) - (113,685) - (42,591)
3) $(257,400)
Deferred Inflow Pen
2016 2017
(13) (14)
$3,071 $3,071 29 29
4,849 4,849 12,895 12,895
4,716 4,716
$25,560 $25,560
ws/(Outflows) Recosion Expense (Year
2018 2019
(15) (16)
$3,071 $6,311 29 295 4,849 8,355 12,895 21,898 4,716 8,089
$25,560 $44,948
91
gnized In Future Ended June 30):
2020 There- after
(17) (18)
$2,652 $1,822 (6) 34 4,395 2,785 11,729 7,382 4,279 2,704
$23,049 $14,728
Recommended