NO
VE
MB
ER
2019
ICE
NI
PR
OJE
CT
S
LIM
ITE
D
ON
B
EH
ALF
O
F
CR
AW
LE
Y
BO
RO
UG
H
CO
UN
CIL
A
ND
HO
RS
HA
M
DIS
TR
ICT
CO
UN
CIL
No
rth
ern
West
Su
ssex
Iceni Projects
London: Da Vinci House, 44 Saffron Hill, London, EC1N 8FH
Glasgow: 177 West George Street, Glasgow, G2 2LB
Manchester: 68 Quay Street, Manchester, M3 3EJ
t: 020 3640 8508 | w: iceniprojects.com | e: [email protected]
linkedin: linkedin.com/company/iceni-projects | twitter: @iceniprojects
Northern West Sussex Strategic Housing Market Assessment
Final Report
Iceni Projects Limited on behalf of
Crawley Borough Council and
Horsham District Council
November 2019

2

0
CONTENTS
EXECUTIVE SUMMARY ............................................................................................. 2
INTRODUCTION ......................................................................................................... 9
HOUSING MARKET GEOGRAPHY AND SPATIAL RELATIONSHIPS ................... 13
HOUSING OFFER AND SUPPLY TRENDS ............................................................. 27
LOCAL HOUSING NEED .......................................................................................... 37
HOUSING MARKET DYNAMICS ............................................................................. 60
AFFORDABLE HOUSING NEED ............................................................................. 76
HOUSING NEEDS OF YOUNGER PEOPLE ........................................................... 92
NEEDS OF FAMILY HOUSEHOLDS ...................................................................... 111
NEEDS OF OLDER PERSONS & THOSE WITH DISABILITIES ........................... 121
NEED FOR DIFFERENT SIZES OF HOMES ......................................................... 135
EMERGING HOUSING MARKET SEGEMENTS ................................................... 145
CONCLUSIONS AND RECOMMENDATIONS ....................................................... 154
APPENDIX 1: MIGRATION FLOWS TO HORSHAM AND CRAWLEY .......................... 164
APPENDIX 2: COMPONENTS OF POPULATION CHANGE ........................................ 166
APPENDIX 3: ANALYSIS OF HOUSEHOLD REPRESENTATIVE RATES ................... 168
APPENDIX 4: ECONOMIC ACTIVITY RATE ASSUMPTIONS ...................................... 171

1

2
EXECUTIVE SUMMARY
This Strategic Housing Market Assessment (SHMA) has been commissioned by Crawley Borough
Council and Horsham District Council to inform the preparation of new Local Plans in their respective
areas, and to support consideration of housing mix on individual development schemes. The SHMA
has been prepared by a consultancy team comprising Iceni, Justin Gardner Consulting and Chilmark
Consulting. It builds on previous studies to consider housing needs within the area.
Local Housing Need
The Government, through the 2019 NPPF and associated Planning Practice Guidance, has
introduced a new ‘standard method’ to calculating areas minimum local housing need. This takes
projected household growth and applies an upward adjustment based on the affordability
characteristics of the area – the average house price-to-earnings ratio.
The standard method formula points to a minimum local housing need for 752 dwellings per annum
(dpa) in Crawley and 965 dwellings per annum in Horsham and a total of 2,819 dpa across the
Northern West Sussex Housing Market Area (HMA). This is based on 2014-based Household
Projections and 2018 affordability ratios; and takes account of the latest evidence. The implications
of this level of growth are set out below.
Implications of the Minimum Local Housing Need, 2019-39
Crawley
Homes – 15,040
Household Growth – 14,500 (32%)
Population Growth – 27,150 (24%)
Growth in 65+ Population – 9,600 (63%)
Workforce Growth – 16,300
Potential Jobs Supported – 24,200
Horsham
Homes – 19,300
Household Growth – 18,700 (31%)
Population Growth – 34,700 (24%)
Growth in 65+ Population – 20,000 (61%)
Workforce Growth – 15,100
Potential Jobs Supported – 13,500
The SHMA has explored whether higher levels of housing need might be justified, considering in
particular the rail service enhancements through the Thameslink Programme and potential
implications of the growth of Gatwick Airport. The Airport’s expansion to 70 million passengers per
annum could create over 9,000 additional jobs and on the basis of current commuting patterns might
draw around 3,000 of these from Crawley; with a more modest 700 (4.4%) from Horsham. For
Horsham the impact is modest and would not be expected to have an upward impact on housing
need; whilst for Crawley it could be more substantial but the evidence does not suggest that this

3
would necessarily generate additional housing need – depending on jobs growth more broadly within
the Borough. Rail service enhancements will improve capacity but are not considered to increase
the need for homes locally to a level above the standard method.
The implications of Gatwick’s growth will need to be kept under review as new information emerges;
and it may also be necessary to updating the local housing need figures prior to the submission of
the local plans to take account of either new evidence; or any changes to the methodology introduced
by Government.
Crawley Borough’s boundaries are drawn relatively tightly around the Borough’s existing urban area
and will limit what scale of development can be met within the Borough. Should significant
development occur adjacent to Crawley’s administrative boundaries, this would contribute to meeting
Crawley’s housing needs, and would thus be expected to have regard to the nature of Crawley’s
housing need identified within this Study.
The projected growth in different types of households is shown in the chart below.
Growth in Households by Type, 2019-39
Housing Market Geographies and the Duty to Cooperate
The SHMA confirms the findings of previous studies that Crawley, Horsham and Mid Sussex fall
within a Northern West Sussex Housing Market Area as a best-fit to local authority boundaries. This
is the principal grouping around which discussions on meeting housing need should take place and
these discussions are likely in particular to need to address land supply constraints within Crawley
Borough.
Steyning, Hassocks and potentially Burgess Hill fall within an overlap with a Brighton-focused Sussex
Coast Housing Market Area. In the northern part of the area there are functional relationships into
Surrey, particularly with Horley and areas to the south of the M25. It will therefore be important that
5216
3697
3485
3455
11474
4216
2349
2289
0 2000 4000 6000 8000 10000 12000 14000
Older Households (65+)
Families
Single Persons (< 65)
Multi-Adult/ Other
Horsham Crawley

4
the Councils actively engage with authorities within these areas on any cross-boundary issues arising
in regard to housing provision.
The evidence also points to functional housing market relationships between Northern West Sussex
and London with movement of households from London to the area seeking family housing. The
SHMA finds that in the instance that an unmet housing need arises from London and that it is
accepted that it cannot be met within London’s boundaries, it will be necessary for the Councils to
engage through to wider South East Councils Group to consider whether they can contribute to
addressing the unmet need. The Draft London Plan Inspector’s report published in October 2019
states that the proposed approach to development in the wider South East and beyond is justified
and consistent with national policy and that it should be effective in helping to implement the Plan.
This is of greater relevance to Horsham given land supply constraints in Crawley but there are
potential unmet need issues within the HMA and immediately adjoining areas with which there is a
closer spatial relationship.
Affordable Housing Need
The cost of market housing to sale and rent in Horsham and Crawley is significant. Median house
prices in 2018 stood at £295,000 in Crawley and £380,000 in Horsham; with median rents of £975
per month in Crawley and £995 per month in Horsham. Both house prices and rents have been
growing, with median house prices now standing at 9.1 times earnings in Crawley and 13.9 times
earnings in Horsham. The significant costs of market housing, and the difficulties facing younger
households and those on lower incomes in being able to afford them, influence the need for
affordable housing.
The SHMA analysis indicates a net need for 739 affordable homes per year in Crawley and 503
affordable homes per year in Horsham (2019-39). It points to a significant level of need for affordable
housing influenced by households’ inability to afford market housing and the current stock of
affordable housing. It provides evidence justifying policies seeking affordable housing in new
development schemes.
Policies regarding the level of affordable housing sought on new development schemes need to take
account of the affordable housing need, together with evidence regarding the viability of residential
development schemes and contributions to other forms of infrastructure.
The delivery of and access to affordable housing will be particularly important in ensuring that
younger people can afford to live in Crawley and Horsham. Given the level of affordable housing
need, consideration should be given to a range of means of increasing affordable housing delivery
and increasing access to housing. The SHMA shows that the Government’s Help-to-Buy Programme
will play a role in this, but consideration should be given to other means of enhancing affordable
housing provision as well including use of public sector land, and within Horsham District in particular,
the development of rural and entry-level exception sites.

5
Annual Affordable Housing Need
The evidence would support a split of affordable housing of 75% rented and 25% affordable home
ownership homes in Crawley, and either a 75/25 or 70/30 split in Horsham, subject to viability. To
ensure that rented housing is affordable, Iceni recommends that this is priced and maintained at
levels which are below either 80% of market housing costs (inclusive of service charges) or Local
Housing Allowance levels, whichever are the lower. The SHMA Report also provides
recommendations on how affordable home ownership products should be priced to be affordable to
local households who cannot afford lower quartile house prices.
Needs of Older Persons & those with Disabilities
The SHMA shows significant expected growth in the population of older persons, with the numbers
of people aged 65 or over expected to grow by 9,565 persons in Crawley (62.5%) between 2019-39
and by 19,960 persons in Horsham (61.0%). Growth of those aged 75+ of 5,439 persons in Crawley
and 13,654 persons in Horsham is expected, driven by improvements in life expectancy.
The SHMA indicates that the population with a long-term health problem or disability can be expected
to grow by 7,000 persons in Crawley and 9,700 persons in Horsham to 2039; and that the numbers
of persons with mobility problems or dementia can be expected to grow significantly. Many older
people will continue to live in their existing homes, and the SHMA recommends that planning policies
should require new homes to be delivered to the Part M4(2) accessible and adaptable home
standards, subject to viability testing. The SHMA recommends that 5% of dwellings on major
development schemes should be delivered to wheelchair adaptable standards.
344
563
159
176
0
100
200
300
400
500
600
700
800
900
1000
Horsham Crawley
Rented Affordable Housing Affordable Home Ownership
503 affordable homes per
year
739 affordable homes per
year

6
Projected Growth in People with Health or Mobility Issues, 2019-39
A proportion of older households will however need or seek specialist housing, particularly amongst
those aged over 75. The SHMA identifies indicatively a need for 1,027 units of specialist older
persons housing in Crawley (equivalent to 51 pa) and 2,087 units in Horsham (104 pa) over the 2019-
39 period. This is based on accommodation for 140 per 1000 people aged over 75 in specialist
accommodation in Horsham and 168 per 1,000 in Crawley, taking account of the relative health of
the population. The profile of need for different types of specialist housing is shown in the graph
below.
Need for Specialist Housing for Older Persons
In addition, a need is identified for 1,029 care home bedspaces in Crawley and 1,518 care home
bedspaces in Horsham over the period to 2039. These will fall in a C2 use class.
757
1 808
6 995
2 187
4 679
9 693
0 2000 4000 6000 8000 10000 12000
Dementia
Mobility problems
Long-term Heath Problem or Disability
Horsham Crawley
-138131
715
1 001175
360
276
595
-500
0
500
1000
1500
2000
2500
Crawley Horsham
Units,
2019-3
9
Housing with Support Rented Housing with Support Leasehold
Housing with Care Rented Housing with Care Leasehold
7
It is important that the councils’ planning policies support the delivery of specialist housing and care
home bedspaces. Doing so will help to release existing mainstream housing, including family
housing, for other groups in the population. Particular barriers to delivery include access to land, and
the viability of provision which can differ from mainstream housing; and the SHMA recommends that
these issues are considered in setting policies for affordable housing and the Councils consider
making specific allocations of land for older persons housing/care provision.
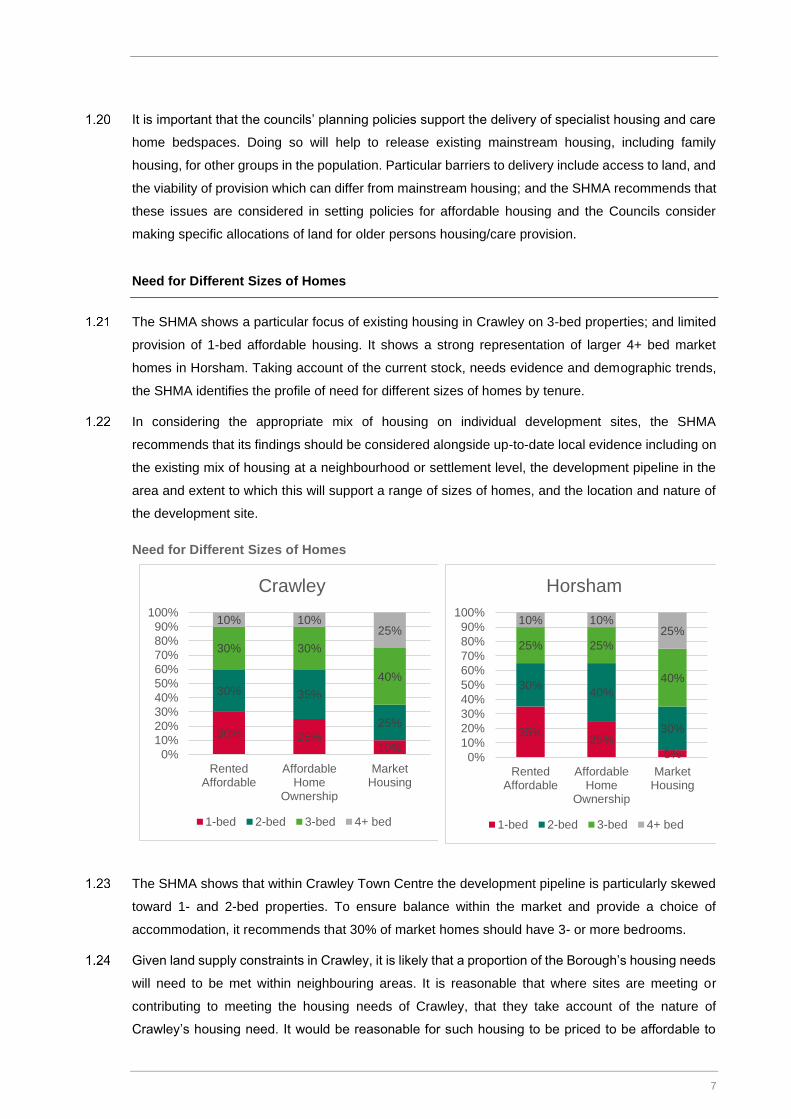
Need for Different Sizes of Homes
The SHMA shows a particular focus of existing housing in Crawley on 3-bed properties; and limited
provision of 1-bed affordable housing. It shows a strong representation of larger 4+ bed market
homes in Horsham. Taking account of the current stock, needs evidence and demographic trends,
the SHMA identifies the profile of need for different sizes of homes by tenure.
In considering the appropriate mix of housing on individual development sites, the SHMA
recommends that its findings should be considered alongside up-to-date local evidence including on
the existing mix of housing at a neighbourhood or settlement level, the development pipeline in the
area and extent to which this will support a range of sizes of homes, and the location and nature of
the development site.
Need for Different Sizes of Homes
The SHMA shows that within Crawley Town Centre the development pipeline is particularly skewed
toward 1- and 2-bed properties. To ensure balance within the market and provide a choice of
accommodation, it recommends that 30% of market homes should have 3- or more bedrooms.
Given land supply constraints in Crawley, it is likely that a proportion of the Borough’s housing needs
will need to be met within neighbouring areas. It is reasonable that where sites are meeting or
contributing to meeting the housing needs of Crawley, that they take account of the nature of
Crawley’s housing need. It would be reasonable for such housing to be priced to be affordable to
30% 25%10%
30% 35%
25%
30% 30%
40%
10% 10%25%
0%
10%
20%
30%
40%
50%
60%
70%
80%
90%
100%
RentedAffordable
AffordableHome
Ownership
MarketHousing
Crawley
1-bed 2-bed 3-bed 4+ bed
35%25%
5%
30%40%
30%
25% 25%
40%
10% 10%25%
0%
10%
20%
30%
40%
50%
60%
70%
80%
90%
100%
RentedAffordable
AffordableHome
Ownership
MarketHousing
Horsham
1-bed 2-bed 3-bed 4+ bed
8
households in Crawley; and that Duty to Cooperate discussion take place in respect of the extent to
which different authorities have ‘nominations rights’ over affordable housing provision on sites or at
locations identified as contributing to meeting a Crawley unmet need. To support effective joint
working in this respect in regard to sites adjacent to the Crawley boundary in Horsham, the SHMA
recommends that councils work together to provide a consistent assessment of the viability position.
Supporting Different Market Segments
The SHMA evidence points to a growing number of households living in the Private Rented Sector
as well as growth in rents. It recommends that planning policies should support Build-to-Rent
developments such as in town centres, the Three Bridges Corridor and potentially on strategic sites.
It recommends that the Councils consider – taking account of viability evidence – how policies for
affordable housing provision should apply to this sector of the market in Crawley and Horsham.
The SHMA further identifies that communal living and self- and custom-build development can
contribute to increasing housing delivery. It sets out that the Councils should support community
groups looking to bring forward communal living schemes; and should set policies requiring a
proportion of plots on major development sites of over 100 homes to include a proportion of plots for
self- and custom-build homes where it is feasible to do so, as well as policies to support self- and
custom-build development on smaller schemes, including in or adjoining rural settlements.

9
INTRODUCTION
Crawley Borough Council and Horsham District Council are in the process of preparing new local
plans to guide development and investment in their respective areas. Since the adoption of the
Horsham District Planning Framework in 2015 and the Crawley Borough Local Plan in 2016, there
have been a number of significant shifts in the underlying planning and housing policy landscape. It
is against this context, and the need for up-to-date evidence to inform and support policies within the
new two authorities’ new local plans, that they have jointly commissioned preparation of a new
Strategic Housing Market Assessment.
The two councils appointed a consultancy team comprising Iceni Projects Limited (“Iceni”), Justin
Gardner Consulting (JGC) and Chilmark Consulting (“Chilmark”) to prepare this updated Strategic
Housing Market Assessment. The updated SHMA is not ‘starting anew’ but represents the evolution
and development of previous studies which have considered housing needs across the Northern
West Sussex Housing Market Area over the last decade. These previous studies include:
• Northern West Sussex Strategic Housing Market Assessment (GVA Grimley, 2009)
• Northern West Sussex SHMA Update (GVA Grimley, 2012)
• Affordable Housing Needs Model Update (Chilmark Consulting, 2014)
• Objective Assessment of Crawley’s Housing & Employment Needs (Chilmark Consulting, 2015)
• Housing Need in Horsham District (GL Hearn, March 2015);
• Crawley Borough: OAN Update Report (Chilmark Consulting, 2015);
• Market Housing Mix Study (Chilmark Consulting, 2016); and
• Starter Homes Needs and Implications (Chilmark Consulting, 2016).
Key members of the consultancy team which have prepared this report have been involved in the
preparation of the above studies. This report therefore draws on these previous studies where
relevant but seeks to take account of the latest Government policy/ guidance and the latest data,
bringing the assessment of housing needs up-to-date.
Core Requirements of the Brief
The updated SHMA responds to the release of a revised National Planning Policy Framework by
Government and associated updated Planning Practice Guidance. In particular this provides a
revised framework for assessing local housing needs, a new widened definition of affordable
housing; and guidance on how to assess the needs of particular groups within the population and
specific market segments, including the self- and custom-build sector, and build-to-rent sector.

10
Specifically, the core requirements of the Councils’ brief are to:
• provide an up to date, NPPF- and NPPG-compliant evidence base for Local Plan preparation
purposes and for planning decision-taking in Crawley and in Horsham. This will include an
updated, consistent evidence on overall housing needs – using the standard method – and model
the potential for further growth in housing needs arising from economic growth;
• understand and update the key potential influences on the housing market, including migration
from Greater London and the south coast areas; and the significant changing characteristics of
economic drivers within the area;
• consider the housing market geography as an important component for plan-making as well as
cross-boundary relationships as a key component in testing and resolving unmet housing need
issues with surrounding areas;
• provide an update and clarity on the amount, and nature of affordable housing needs overall as
well as the different types of affordable need arising and the sources of those needs;
• address the need for current evidence on particular emerging/ growing housing market sectors
including self/custom-build; build to rent; intermediate housing provision; housing with care;
military family accommodation; and to consider potential policy requirements and responses;
and
• set out key policy recommendations for CBC and HDC arising from the SHMA update findings.
For the avoidance of doubt, the SHMA itself does not set targets for housing in the authorities – this
is the role of the Councils in bringing together a range of evidence including information on land
availability and infrastructure capacity. It does not set policies for the mix of housing to be applied to
individual sites, but it is a consideration (potentially alongside others) which can inform discussions
between the Councils and developers/ landowners on housing mix alongside other site-specific
considerations and local evidence.
Report Structure
This report has been informed by both analytical work and engagement with a range of stakeholders
to understand housing market dynamics and the need for different types of housing.
The remainder of the report is structured as follows:
• Section 3: Housing market geography and spatial relationships;
• Section 4: Housing offer and supply trends;
• Section 5: Local housing need;

11
• Section 6: Housing market dynamics;
• Section 7: Affordable housing need;
• Section 8: Housing needs of younger people;
• Section 9: Needs of family households;
• Section 10: Needs of older persons and those with disabilities;
• Section 11: Need for different sizes of homes;
• Section 12: Emerging housing market segments;
• Section 13: Conclusions and Recommendations.

12

13
HOUSING MARKET GEOGRAPHY AND SPATIAL RELATIONSHIPS
This section proves a review of the housing market geography influencing Crawley and Horsham
District, and explores spatial inter-relationships with other areas.
Planning Policy Context
Local planning authorities have a statutory duty to cooperate on strategic cross boundary matters as
part of the plan-making process. The National Planning Policy Framework (NPPF) sets out that joint
working can address a range of issues, including helping to determine where additional infrastructure
is necessary; and whether development needs that cannot be met wholly within a particular plan
area could be met elsewhere (Para 26). It states that authorities should prepare and maintain one or
more statements of common ground, documenting the cross-boundary maters being addressed and
progress in cooperating to address these (Para 27). Housing provision is a cross-boundary issue in
many areas.
Planning Practice Guidance (PPG) on Plan making sets out what a statement of common ground is
expected to contain. It also contains guidance on the geographical area that such statements need
to cover1 – setting out that this may be influenced by the strategic matters being planned for; and the
most appropriate functional geography to gather evidence and develop policies to address these
matters. It identifies that housing market areas and travel to work areas may be an appropriate basis,
that authorities may well work in different areas, and authorities should be pragmatic in determining
these areas.
The Practice Guidance includes specific advice on how housing market areas can be defined. A
housing market area is defined as “a geographical area defined by household demand and
preferences for all types of housing, reflecting the key functional linkages between places where
people live and work.” The PPG sets out that housing market geographies can be broadly defined
by analysing:
• The relationship between housing demand and supply across different locations using house
prices and rates of change in house prices. This should identify areas that have clearly
different price levels compared to surrounding areas.
• Migration flow and house search patterns. This can help identify the extent to which people
move home within an area, in particular where a relatively high proportion of short household
moves are contained, (due to connections to families, jobs, and schools).
1 ID 61-017-20190315
14
• Contextual data such as travel to work areas, retail and school catchment areas. These can
provide information about the areas within which people move without changing other aspects
of their lives (e.g. work or service use).
This essentially reiterates what was outlined previously within Planning Practice Guidance. Whilst
the Guidance sets out a range of sources, it does not specify what weight should be given to different
data.
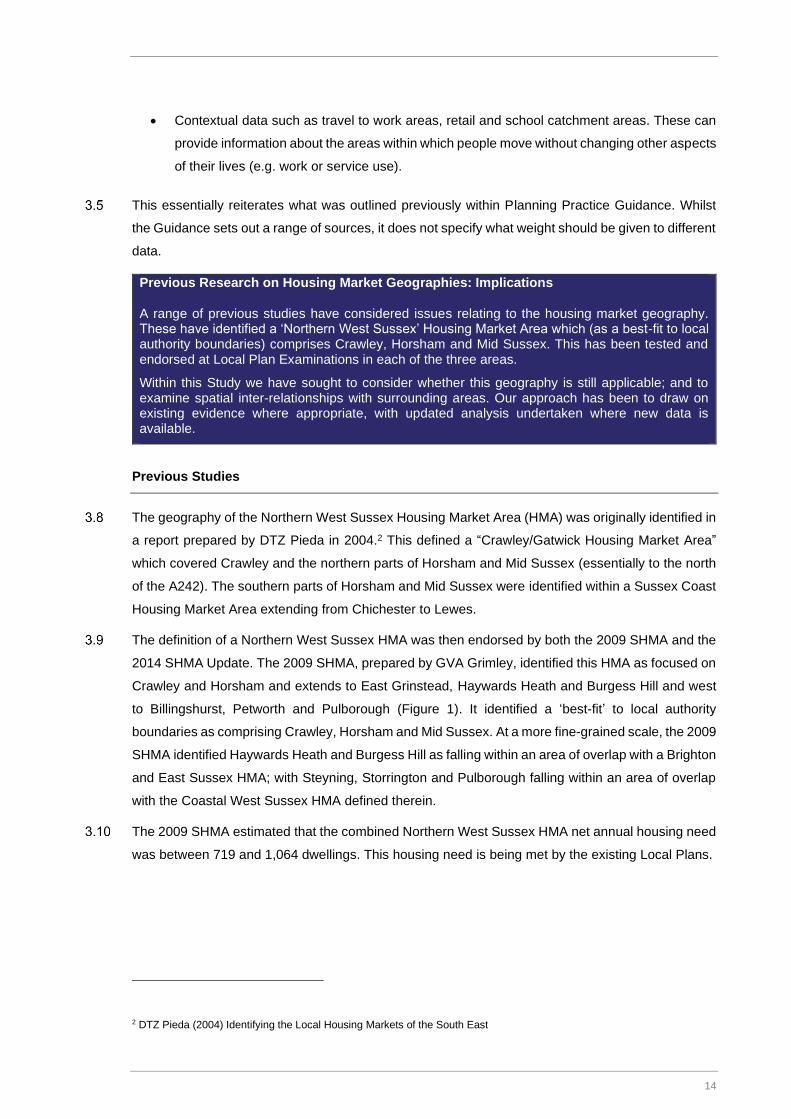
Previous Research on Housing Market Geographies: Implications
A range of previous studies have considered issues relating to the housing market geography. These have identified a ‘Northern West Sussex’ Housing Market Area which (as a best-fit to local authority boundaries) comprises Crawley, Horsham and Mid Sussex. This has been tested and endorsed at Local Plan Examinations in each of the three areas.
Within this Study we have sought to consider whether this geography is still applicable; and to examine spatial inter-relationships with surrounding areas. Our approach has been to draw on existing evidence where appropriate, with updated analysis undertaken where new data is available.
Previous Studies
The geography of the Northern West Sussex Housing Market Area (HMA) was originally identified in
a report prepared by DTZ Pieda in 2004.2 This defined a “Crawley/Gatwick Housing Market Area”
which covered Crawley and the northern parts of Horsham and Mid Sussex (essentially to the north
of the A242). The southern parts of Horsham and Mid Sussex were identified within a Sussex Coast
Housing Market Area extending from Chichester to Lewes.
The definition of a Northern West Sussex HMA was then endorsed by both the 2009 SHMA and the
2014 SHMA Update. The 2009 SHMA, prepared by GVA Grimley, identified this HMA as focused on
Crawley and Horsham and extends to East Grinstead, Haywards Heath and Burgess Hill and west
to Billingshurst, Petworth and Pulborough (Figure 1). It identified a ‘best-fit’ to local authority
boundaries as comprising Crawley, Horsham and Mid Sussex. At a more fine-grained scale, the 2009
SHMA identified Haywards Heath and Burgess Hill as falling within an area of overlap with a Brighton
and East Sussex HMA; with Steyning, Storrington and Pulborough falling within an area of overlap
with the Coastal West Sussex HMA defined therein.
The 2009 SHMA estimated that the combined Northern West Sussex HMA net annual housing need
was between 719 and 1,064 dwellings. This housing need is being met by the existing Local Plans.
2 DTZ Pieda (2004) Identifying the Local Housing Markets of the South East

15
Figure 1: Northern West Sussex HMA Geography, GVA Grimley, 2009
The housing market geography was considered again within the Affordable Housing Needs Model
Update report prepared by Chilmark Consulting in 2014. This included a review of 2011 Census
commuting data which identified commuting flows to Brighton and Hove and to London; but broadly
endorsed the findings of the 2014 SHMA. It identified Horley as falling principally within an East
Surrey HMA, but with some recognised overlap with the Northern West Sussex HMA.
The HMA definition of a Northern West Sussex Housing Market Area, based on this evidence, has
been endorsed through each of the three constituent authorities’ Local Plan Examinations.
More recently, a Study prepared by GL Hearn for the Sussex Coast authorities3 has confirmed strong
links between Horsham, Crawley and Mid Sussex – essentially endorsing their continued
appropriateness as a housing market area based on a ‘best fit’ to local authority boundaries. However
below local authority level, wards such as Steyning, Henfield, Bramber, Upper Beeding and
Woodmancote in Horsham District; and Hurstpierpoint and Hassocks in Mid Sussex, were found to
have stronger commuting links southwards to the Coast, the report concluding that when looking at
housing market geography on a more fine-grained basis below local authority level, these formed
part of a Coastal Housing Market Area focused on Brighton & Hove. Burgess Hill was considered to
3 Defining the HMA and FEMA (GL Hearn, Dec 2016) for Greater Brighton & Coastal West Sussex Strategic Planning Board

16
very much sit on the boundary between the two HMAs. This Study’s findings are not substantively
different to that of the 2009 Northern West Sussex SHMA in this respect.
Figure 2: Housing Market Geographies identified in 2016 GL Hearn Study for Greater Brighton
and Coastal West Sussex Strategic Planning Board
Source: Coastal West Sussex and Greater Brighton Defining the HMA and FEMA, GL Hearn 2016
Reviewing the Evidence
There is a wealth of detailed research studies which have considered the housing market geography.
Iceni has not sought to ‘reinvent the wheel’ but has sought to review key evidence to test whether
the housing market geography as previously defined remains appropriate; and to understand
functional relationships with other areas.
House Price Geography
The Planning Practice Guidance suggests that a housing market area should have clearly different
price levels to surrounding areas. Iceni has analysed house prices using 2018 sales data from HM
Land Registry and mapped this in Figure 3.
The house price geography can be understood at a number of different tiers. At a regional level, it
shows higher house prices in proximity to London. At a sub-regional level, we see higher housing
costs in Surrey and parts of Hampshire than we do in West Sussex. This does point towards areas
such as Reigate and Banstead and Tandridge in Surrey being in a separate housing market area to

17
Crawley and Horsham. In contrast there is a similarity in house prices between areas in Horsham
and Mid Sussex districts.
At a more local level, we find an urban/ rural distinction in house prices which is influenced by
differences in the housing stock and profile of sales (with higher sales of larger, more expensive
homes in rural areas) as well as an influence of ‘quality of place’ on house prices.
Crawley principally displays house prices in the £100,000 up to around £400,000 range. In
comparison, Horsham District demonstrates a variance in house prices, with areas surrounding
Horsham Town (including Southwater but also other more urban areas such as Billingshurst and
Pulborough) displaying lower prices similar to the ranges in Crawley whilst areas within the South
Downs National Park and the more rural parts of Horsham demonstrating higher house price ranges
(Storrington, Dial Post, West Chiltington and West Grinstead).
Figure 3: House Prices, 2018
Source: Land Registry, 2018
In terms of average house prices at a local level, Crawley generally offers average prices between
£100,000 and £400,000 which is similar to the area surrounding Horsham Town and some rural
areas such as Pulborough, Billingshurst and Steyning and Southwater. However, in some of the rural
areas within Horsham higher average house prices have been registered ranging between £600,000
and £900,000 including areas around Storrington, Dial Post and West Grinstead.
18
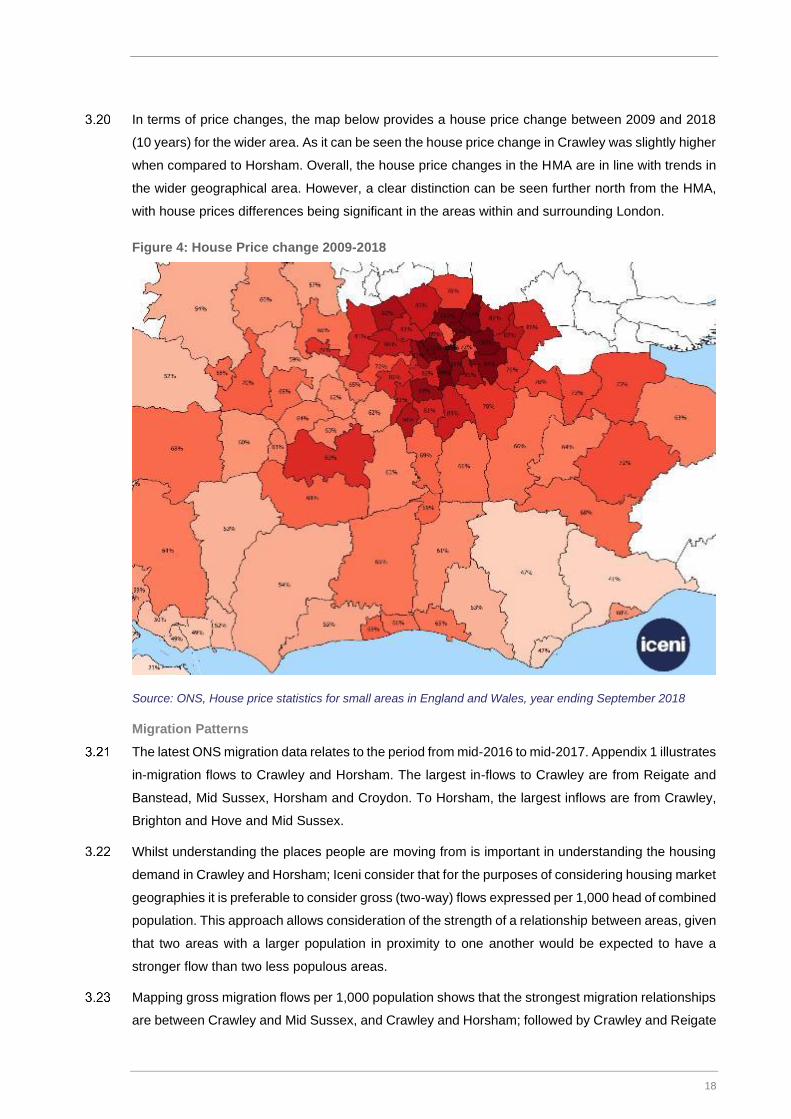
In terms of price changes, the map below provides a house price change between 2009 and 2018
(10 years) for the wider area. As it can be seen the house price change in Crawley was slightly higher
when compared to Horsham. Overall, the house price changes in the HMA are in line with trends in
the wider geographical area. However, a clear distinction can be seen further north from the HMA,
with house prices differences being significant in the areas within and surrounding London.
Figure 4: House Price change 2009-2018
Source: ONS, House price statistics for small areas in England and Wales, year ending September 2018
Migration Patterns
The latest ONS migration data relates to the period from mid-2016 to mid-2017. Appendix 1 illustrates
in-migration flows to Crawley and Horsham. The largest in-flows to Crawley are from Reigate and
Banstead, Mid Sussex, Horsham and Croydon. To Horsham, the largest inflows are from Crawley,
Brighton and Hove and Mid Sussex.
Whilst understanding the places people are moving from is important in understanding the housing
demand in Crawley and Horsham; Iceni consider that for the purposes of considering housing market
geographies it is preferable to consider gross (two-way) flows expressed per 1,000 head of combined
population. This approach allows consideration of the strength of a relationship between areas, given
that two areas with a larger population in proximity to one another would be expected to have a
stronger flow than two less populous areas.
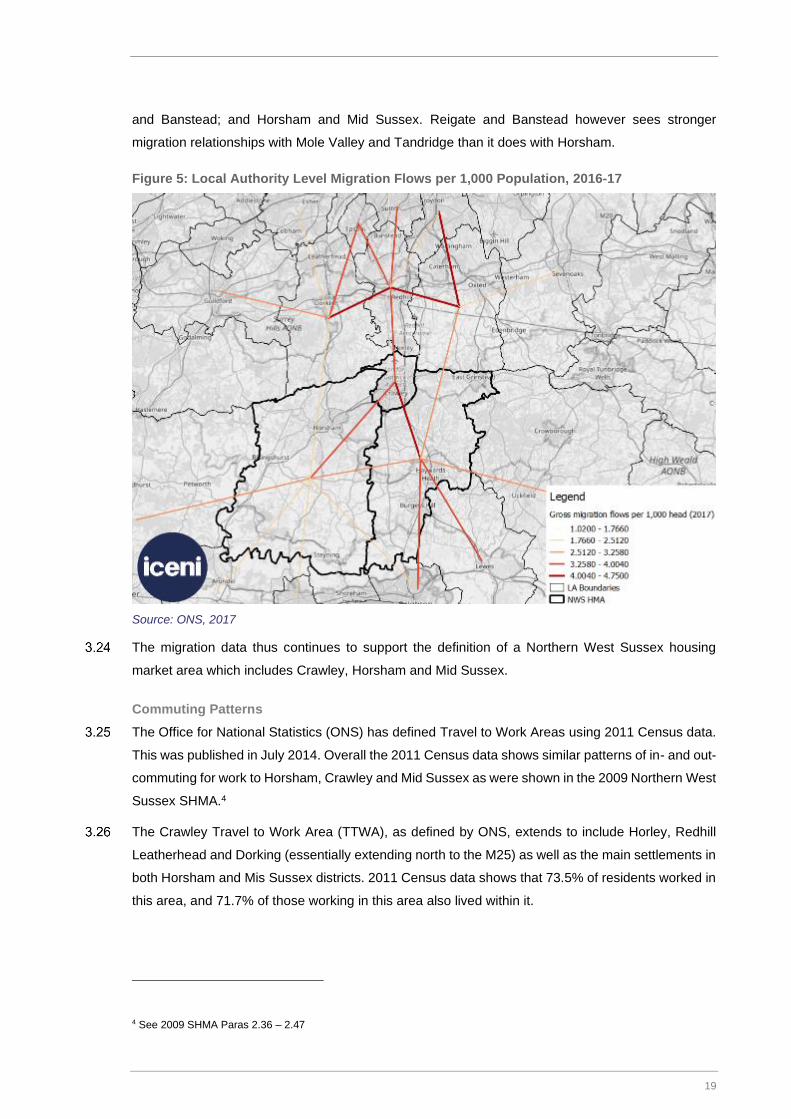
Mapping gross migration flows per 1,000 population shows that the strongest migration relationships
are between Crawley and Mid Sussex, and Crawley and Horsham; followed by Crawley and Reigate
19
and Banstead; and Horsham and Mid Sussex. Reigate and Banstead however sees stronger
migration relationships with Mole Valley and Tandridge than it does with Horsham.
Figure 5: Local Authority Level Migration Flows per 1,000 Population, 2016-17
Source: ONS, 2017
The migration data thus continues to support the definition of a Northern West Sussex housing
market area which includes Crawley, Horsham and Mid Sussex.
Commuting Patterns
The Office for National Statistics (ONS) has defined Travel to Work Areas using 2011 Census data.
This was published in July 2014. Overall the 2011 Census data shows similar patterns of in- and out-
commuting for work to Horsham, Crawley and Mid Sussex as were shown in the 2009 Northern West
Sussex SHMA.4
The Crawley Travel to Work Area (TTWA), as defined by ONS, extends to include Horley, Redhill
Leatherhead and Dorking (essentially extending north to the M25) as well as the main settlements in
both Horsham and Mis Sussex districts. 2011 Census data shows that 73.5% of residents worked in
this area, and 71.7% of those working in this area also lived within it.
4 See 2009 SHMA Paras 2.36 – 2.47

20
Figure 6: ONS 2011-based Travel to Work Areas
Source: ONS, 2011
The TTWA geography is logical and reflects the strength of Gatwick Airport and Manor Royal at the
heart of this area, recognising that this is one of the largest concentrations of employment in the
region. It is realistic that there is a labour market area around this which draws from a number of
different directions. But within this area, the wider analysis does suggest a north/south house price
differential.
Housing Market Geography: Key Findings and Implications
Iceni consider that the evidence continues to support the definition of a Northern West Sussex Housing Market Area which is comprised, as a best fit to local authority boundaries, of Crawley, Horsham and Mid Sussex. This has been tested and endorsed at the three authorities’ local plan examinations.
There is however evidence of an overlap with surrounding housing market areas. In the southern parts of Horsham and Mid Sussex, the evidence points to Steyning, Hurstpierpoint and Hassocks (and potentially Burgess Hill) as falling within this area of overlap. In the northern part of the area, the evidence shows a functional relationship with parts of Surrey – and in particular areas in Surrey to the south of the M25; with the strongest relationship (in house price and commuting terms) being with Horley.
The growth of the economic hub around Crawley/Gatwick could over time influence the housing market geography, and it will be important that the authorities therefore continue to monitor trends and recognise that the HMA geography could change over time, particular as Gatwick Airport grows.
Whilst the core focus of joint working on housing issues should therefore remain within the three-authority HMA geography, it will be important that the Councils actively engage with authorities in

21
the Coastal West Sussex HMA and authorities within Surrey to the north through the Duty to Cooperate on any cross-boundary issues arising in respect of housing provision.
Spatial Relationship with London’s Housing Market
In many areas across the greater South East there is a functional inter-relationship with London,
reflecting the movement of people from London to areas within the South East and East of England
regions, commuting flows back to London and wider economic ties between businesses in the region
and the London economy. As this is an influence on the profile of housing need/demand in Northern
West Sussex, we have sought to consider this relationship in this Strategic Housing Market
Assessment. To understand the relationship with London it is necessary to look at some of the factors
which are causing people to look for housing outside of London (“push factors”) and why some people
and households from London are moving to Northern West Sussex (“pull factors”). We have
approached this using both quantitative and qualitative research.
Quantifying the Strength of the Relationship with London
Migration flows between the NWS HMA and London have been analysed based on 2017 ONS data.
In Crawley, the proportion of people moving from London (as a whole) is 27%. This proportion is
15% for Horsham and 21% for Mid Sussex respectively over the course of a year. The highest
numbers of migrants have been recorded for some of the outer London Boroughs including Croydon,
Sutton and Bromley.
In terms of proportion of people moving from the NWS HMA to London (as a whole), the proportion
of people moving from Crawley is 18%, 10% from Horsham and 11% from Mid Sussex. Largest
concentrations have been recorded to move to Croydon, Sutton and Wandsworth.
What is underlying household movement?
What underlies the movement of households from London is a range of both push and pull factors.
We have used qualitative evidence from discussions with estate and letting agents to understand the
drivers behind some moves. Agents in particular describe flows of younger couples who are looking
for larger housing moving to the HMA. There is a clear focus of moves towards Crawley, due to:
• its location and better transport links relative to Horsham which result in lower journey times
to/from London;
• lower relative house prices in Crawley compared to other parts of the HMA and relative to
London, which make it more affordable meaning some households can afford to buy a home in
Crawley (when they couldn’t do so in London) or can afford more space.
Agents indicate that moves are particularly from south London Boroughs, which is affirmed by the
ONS data on migration flows which particularly shows movement to from London Boroughs to the
HMA are from Croydon and Sutton. This is mainly due to the fact that cheaper housing options can

22
be found within Crawley and Horsham when compared to similar types of housing within the London
Boroughs. This can be witnessed in the graph below:
Figure 7: House price comparison by type
Source: ONS, House price statistics for small areas in England and Wales, year ending September 2018
At a more strategic level, whilst a movement of households from cities to areas around them is
common around all UK cities (and many internationally),5 the outflow of people from London is also
clearly influenced by a sustained under-supply of housing delivered within London, and of limited
delivery of houses (as opposed to flats) within London.
Since the 1980’s London's population has increased rapidly, now surpassing its previous population
peak (from the 1930’s) in 2015 with a total population of some 8.67 million. Population growth is
recorded as increasing by some 825,000 from 2000 – 2010. It has been accelerating with 1.19 million
growth in London’s population seen in the decade from 2006 – 2016.6 This growth has been driven
by a rapid expansion in London's economy, linked to its strong skills base and unique position in
national, European and global markets. In the last decade the number of jobs in London has grown
by around one million (a 44% increase)7, a significantly faster rate of growth than seen in the rest of
the country, and with particularly rapid growth in the last five years. However, nominal earnings
growth has been very low, and below the rate of growth of both consumer prices and housing costs.
Yet whilst this population and economic growth has increased demand for homes, housing delivery
has been increasing more slowly. Net housing stock increases in Greater London are set out in
Figure 4 of the London SHMA indicating positive net growth of some 27,000 dwellings per annum
from 2001 – 2011 and some 26,000 per annum from 2011 – 2016. The trend in delivery is clearly
5 A typical pattern is of net international migration to cities, and then from net domestic out-migration from cities to surrounding areas 6 Figure 1 and paragraph 3.23 – 2017 London Strategic Housing Market Assessment, Greater London Assembly (November
2017) 7 Figure 2 - 2017 London Strategic Housing Market Assessment, Greater London Assembly (November 2017)
Crawley Horsham London Croydon Sutton
Detached £468 000 £533 750 £773 000 £656 000 £685 000
Semi-detached £345 000 £375 000 £530 000 £490 000 £507 500
Terraced £290 000 £317 000 £487 500 £381 500 £408 000
Flat £215 000 £226 250 £422 500 £283 500 £280 500
£0
£100 000
£200 000
£300 000
£400 000
£500 000
£600 000
£700 000
£800 000
£900 000
Detached Semi-detached Terraced Flat
23
upwards, with 31,700 net additions to the stock in 2017/18; but remains well below London Plan
housing requirements.
The affordability of housing to purchase or rent in Greater London is a key driving factor affecting the
wider south-east regional housing markets. Net housing provision has failed to meet with rising
demands or to provide sufficient affordable homes for households in need. The Northern West
Sussex HMA Affordable Housing Needs Update concluded (paragraph 2.34) that there was a lower
quartile price to earning affordability ratio of some 10:1 in London in 2013. The 2017 London SHMA
provides updated evidence on affordability in the capital. Figure 59 charts affordability ratios up to
2016, highlighting a lower quartile house price to earnings ratio of some 12.5:1 and a median price
to earnings ratio of 12:1. For market rents, the 2017 London SHMA notes (paragraph 5.14 and Figure
61) that private rental values have increase rapidly despite stagnant earnings with private rental costs
outstripping growth in median full-time weekly earnings.
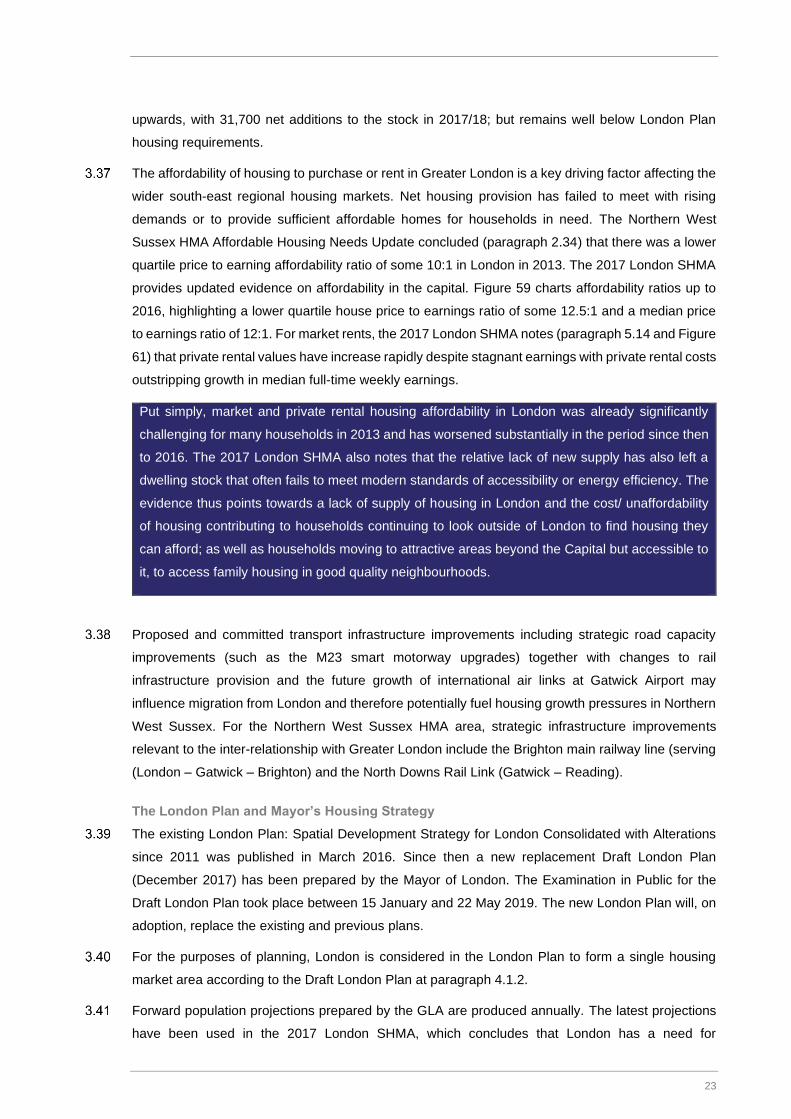
Put simply, market and private rental housing affordability in London was already significantly
challenging for many households in 2013 and has worsened substantially in the period since then
to 2016. The 2017 London SHMA also notes that the relative lack of new supply has also left a
dwelling stock that often fails to meet modern standards of accessibility or energy efficiency. The
evidence thus points towards a lack of supply of housing in London and the cost/ unaffordability
of housing contributing to households continuing to look outside of London to find housing they
can afford; as well as households moving to attractive areas beyond the Capital but accessible to
it, to access family housing in good quality neighbourhoods.
Proposed and committed transport infrastructure improvements including strategic road capacity
improvements (such as the M23 smart motorway upgrades) together with changes to rail
infrastructure provision and the future growth of international air links at Gatwick Airport may
influence migration from London and therefore potentially fuel housing growth pressures in Northern
West Sussex. For the Northern West Sussex HMA area, strategic infrastructure improvements
relevant to the inter-relationship with Greater London include the Brighton main railway line (serving
(London – Gatwick – Brighton) and the North Downs Rail Link (Gatwick – Reading).
The London Plan and Mayor’s Housing Strategy
The existing London Plan: Spatial Development Strategy for London Consolidated with Alterations
since 2011 was published in March 2016. Since then a new replacement Draft London Plan
(December 2017) has been prepared by the Mayor of London. The Examination in Public for the
Draft London Plan took place between 15 January and 22 May 2019. The new London Plan will, on
adoption, replace the existing and previous plans.
For the purposes of planning, London is considered in the London Plan to form a single housing
market area according to the Draft London Plan at paragraph 4.1.2.
Forward population projections prepared by the GLA are produced annually. The latest projections
have been used in the 2017 London SHMA, which concludes that London has a need for
24
approximately 66,000 additional dwellings per year8. Government however wrote to the Mayor of
London setting out that it considers London’s housing need to have been under-estimated and has
engaged in the London Plan Examination to emphasise that the Plan will therefore require immediate
review. The Inspectors Report, released in October 2019, found the 66,000 homes per year figure to
be sound, however, housing targets were considered undeliverable. Therefore, the Inspectors have
recommended that the 10-year housing target should be cut from 649,350 to 522,850 equating to
52,285 a year.
The Draft London Plan’s Strategic Housing Land Availability Assessment (SHLAA) indicates a
capacity for some 65,000 new homes per year and the Draft Plan’s housing target, set out in Policy
H1 and at Table 4.1, reflects this over the ten-year period 2019/20 – 2028/29. However, to achieve
these housing targets the Draft London Plan concludes that the overall average rate of housing
delivery on both large and small sites will need to approximately double compared to current average
completion rates (paragraph 4.1.3). Essentially the Inspectors Report concludes that Policy H2 and
H2A ‘Presumption in favour of small sites’ is relied upon too heavily in the plan and it is not justified
or achievable. The Inspectors recommend that the small sites housing target should be cut by half
from 245,730 homes to 119,250 over the 10-year period.
The Inspectors Report also identified that the Mayor should progress a Strategic Review of the Green
Belt within London.
The Mayor’s response to the Inspectors Report and whether he elects to make changes to the
London Plan in this respect, and whether the Secretary of State intervenes, is as yet unknown.
The Mayor’s London Housing Strategy (May 2018), in conjunction with the Draft London Plan does
seek to establish a range of actions and interventions to help achieve additional housing delivery
sought in London and to address issues of affordability, including:
• Proactive intervention in the London land market to unlock and accelerate housing delivery;
• Increased and targeted investment to de-risk development and maximise opportunities arising
from new transport infrastructure;
• Diversification of the house building industry to encourage Build to Rent development and
support smaller house builders; and
• Support to reduce construction skills gaps and modern construction methods.
The Draft London Plan identifies the importance of addressing strategic housing need and delivery
challenges. The Inspector’s report recognises the Plan is based on the premise that the vast majority
of London’s development needs can be met in the city. However, the inextricable functional
8 Draft London Plan (July 2018) at paragraph 2.3.3
25
relationships with the wider South East have also been recognised. Because of these cross boundary
strategic matters, and also because the Plan does include some policies that have implications for
development and infrastructure beyond the boundaries of London, the Plan contains two policies
relating to the wider South East. Draft Policy SD2 (Collaboration in the Wider South East) highlights
that the Mayor will work with partners in the Wider South East (WSE) to address strategic matters
including long term migration, economic and demographic trends arising. A strategic structure has
been put in place to address such matters and that is facilitated by the South East England Councils,
the East of England Local Government Association, London Councils and the Mayor. The policy has
been found by the Inspector to be a reasonable and justified response to policy expectations and the
recognition by the Mayor and partners in the wider South East of the need to work together.
Draft London Plan Policy SD3 (Growth Locations in the Wider South East and Beyond) confirms that
the Mayor will work to realise the growth potential of the WSE through investment in strategic
infrastructure to support housing and business development.
However, supporting text in paragraph 2.3.1 confirms that the Plan aims to accommodate “the vast
majority” of London’s growth within its boundaries without intruding into the Green Belt and other
protected spaces. Paragraph 2.3.4 continues, highlighting that the Mayor is interested in working
with partners to explore if there is potential to accommodate more growth in sustainable locations
outside the capital, including those areas where new / enhanced strategic infrastructure will be
provided.
The implications for the level of housing provision to be made in London both through the existing
London Plan and the emerging Draft New London Plan are significant and it is currently unclear to
what degree this may result in an ‘unmet need’ arising from London.
Any unmet housing needs that may ultimately be identified as arising from London may place
pressure on other locations in the southeast region. This is likely to include pressure towards the
Northern West Sussex Housing Market Area given the existing commuting and migration flow
relationships as well as the potential future improvements to transport connections, differential
affordability of market and rental housing and with respect to the ability to secure a range and choice
of housing.
It is also important to note that the Draft London Plan does not use the Government’s Standard
Method to calculate housing need and that this may, in future, alter the total housing requirements
and consequently a future revision to the London Plan’s housing policies. It is likely that the London
Plan will require an immediate review.
Crawley, Horsham and Mid Sussex are choice residential locations for those working in London and
this is anticipated to continue. Further, future growth pressures with the potential to push household
formation and migration outwards from London towards Northern West Sussex include:
• The Government’s presumption in national policy to retain the Metropolitan Green Belt as a
permanent restriction on the availability of housing (and commercial) development land. The
London Plan is currently indicating that it will ‘consume its own smoke’ with housing land supply

26
largely meeting evidenced demand and needs, however over time this supply demand pressure
and the national restrictions on Green Belt release and development are likely to increase
pressure on areas outside the Green Belt (including the Northern West Sussex HMA) to
accommodate unmet housing needs arising in from London’s population growth. Both Crawley
and Horsham benefit from direct public transport and strategic road linkages with London and
will undoubtedly see increased pressure as result of these movement corridors in future.
• Aligned with the above, there remain evident sales price and rental value differentials between
housing in Greater London with many parts of the Northern West Sussex HMA. The extent of
those differentials do rise and ebb over time however there has been (and remains) a long
standing affordability difference between the Capital and surrounding areas of the inner and outer
South-east region. Continued long-term household growth demand in London coupled with
supply restrictions over time will support this dynamic leading to household growth suppression
in London and therefore pressure growing on accessible towns and smaller settlements outside.
• Proposed and committed transport infrastructure improvements including strategic road capacity
improvements (such as the M23 smart motorway upgrades) together with changes to rail
infrastructure provision and the future growth of international air links at Gatwick Airport are also
likely to help migration from London and therefore potentially fuel housing growth pressures in
Northern West Sussex.
Although these drivers of future change arising from London’s continued population and household
growth and its housing market dynamics are not unique to Northern West Sussex, it is clear that the
HMA is (and has been) a recipient of outward household growth pressure and influence already; and
will, along with other HMA’s in London’s commuting and economic sphere of influence continue to
be so.
Housing Market Relationships with London: Key Findings and Implications
There are functional housing market relationships between Northern West Sussex and London, as there are for many areas across the South East and East of England regions.
If in the instance that an unmet housing need arises from London, and it is accepted that this cannot be met within London’s boundaries, taking account for instance of a review of Metropolitan Urban Land/ Green Belt within London, it will be important that the two authorities engage through the wider South East Councils Group to consider whether it is possible to contribute to addressing the unmet need. However, at the current time the London Plan has not reached a firm conclusion on whether an unmet need exists, and this may need to be considered further through the review of the London Plan.
However, whilst this is a potential strategic issue across the wider region, it is important to recognise that there is potential unmet need more specifically within the HMA and immediately adjoining areas with which there is an arguably closer spatial relationship.

27
HOUSING OFFER AND SUPPLY TRENDS
In this section we move on to profile the current housing offer. An important starting point for
considering the future mix of homes needed is an understanding of the existing housing offer (by
type, tenure and size) and how the mix of properties varies between tenures and within each area.
This recognises that the majority of the housing stock in 2036 will be that which already exists today.
We therefore profile in this section the current housing offer; and housing supply trends.
Housing Offer
Tenure Profile
There were 169,400 dwellings in the Northern West Sussex HMA in 2017. Of these, 85% are in the
private sector (which includes both owner-occupied and private rented properties) and 15% owned
by public sector organisations (including the Councils and Registered Providers).
Within the HMA, public sector ownership of homes is significantly higher in Crawley (23%) than in
Horsham (11%). It is 13% in Mid Sussex.
Figure 8: Tenure Profile, 2017
Source: MHCLG Table 100
The housing stock in public sector ownership in Crawley has fallen by around 180 dwellings over the
period from 2011-17 in absolute terms. Within this there has been a decline in local authority housing
(driven by right-to-buy sales) and whilst ownership by Registered Providers has increased through
new development, it has failed to offset these losses. As at 2017, Crawley Borough Council owned
7,780 properties representing 76% of all public-sector ownership in the Town. In proportional terms,
public sector ownership (the majority of which will be affordable housing) has fallen from 24.1% in
2011 to 22.7% in 2017.
17%
5%
7%
6%
11%
11%
9%
10%
77%
89%
87%
85%
83%
0% 10% 20% 30% 40% 50% 60% 70% 80% 90% 100%
Crawley
Horsham
Mid Sussex
Northern West Sussex HMA
England
Local Authority Registered Provider Other Public Sector Private Sector

28
In contrast in Horsham, the stock of homes in Registered Provider ownership (again most of which
will be affordable housing) has increased year-on-year in absolute terms over the 2011-17 period
but has remained relatively stable as a proportion of the overall housing stock at around 11.4%. This
has been driven by growth in ownership by Registered Providers.
Within the Private Sector, there is limited reliable local data available on the split between owner
occupied housing and private renting. The 2011 Census showed:
• Levels of home ownership in the Housing Market Area which at 71% of households was slightly
above the regional average; and within the HMA was stronger in Horsham and Mid Sussex (75%)
than in Crawley (60%), the latter influenced by how Crawley as a New Town was developed;
• A larger and more established Private Rented Sector in Crawley, which accommodated 14.5%
of households, compared to 11.8% in Horsham. In both cases the size of the sector was below
that seen across the region (16.3%).
The English Housing Survey can be used to assess trends at a national level. What this shows is
that across England, the Private Rented Sector now accommodates 20% of all households, with this
proportion having doubled since 2006-7. Growth in Private Rented accelerated from 2006/7 but
appears to have slowed in more recent years (since 2014).
It seems likely that growth in private renting will also have been seen within the HMA, and indeed a
survey undertaken by Shelter in 2018 estimated that it might now accommodate 25% of households
in Crawley and 27% in Horsham. We would however treat these figures with a degree of caution
given that the sample size at a local authority level was small.
House Types and Sizes
To assess the profile of homes of different sizes, we have used 2011 Census data as a baseline.
This showed that 3-bed properties were the most prevalent in both Horsham and Crawley, and
indeed in Crawley accounted for 48% of properties. As a result, Crawley had a lower representation
of other sized properties and particularly larger homes with 4 or more bedrooms. Horsham displays
a larger proportion of 4+ bedroom properties when compared to wider benchmarks, with 28% of
homes having 4 or more bedrooms. In contrast, Horsham had a low proportion of 1-bed properties.
29
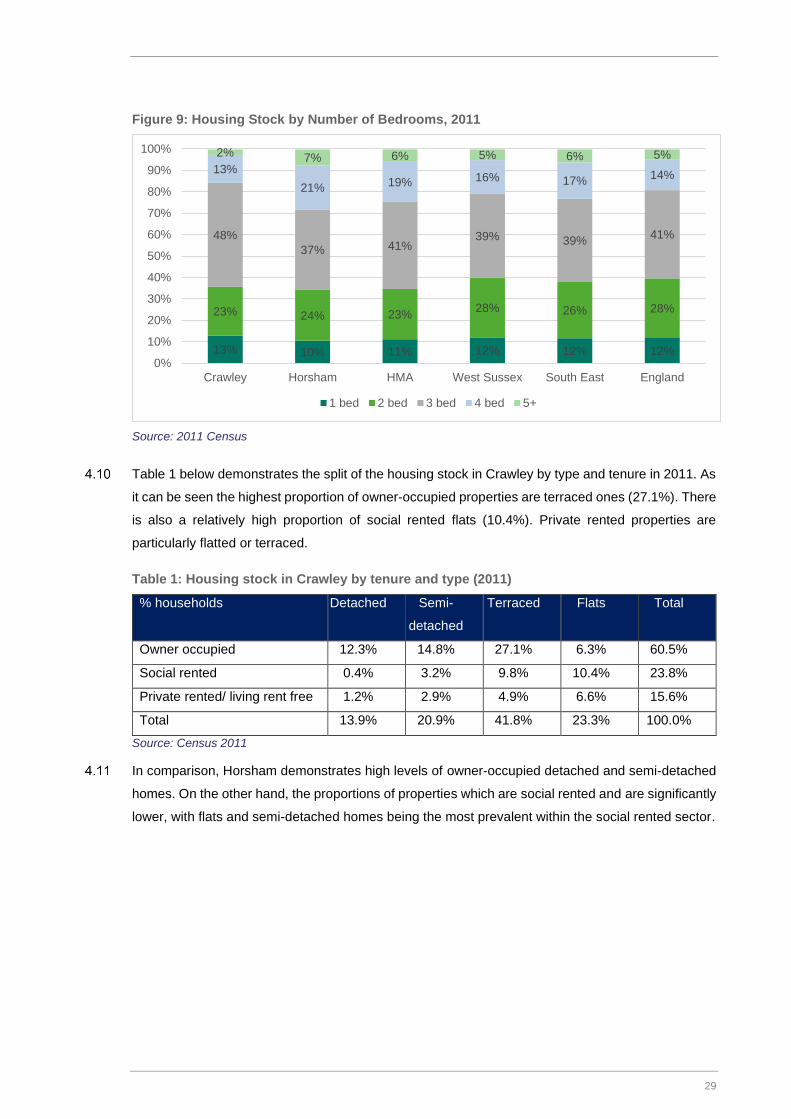
Figure 9: Housing Stock by Number of Bedrooms, 2011
Source: 2011 Census
Table 1 below demonstrates the split of the housing stock in Crawley by type and tenure in 2011. As
it can be seen the highest proportion of owner-occupied properties are terraced ones (27.1%). There
is also a relatively high proportion of social rented flats (10.4%). Private rented properties are
particularly flatted or terraced.
Table 1: Housing stock in Crawley by tenure and type (2011)
% households Detached Semi-
detached
Terraced Flats Total
Owner occupied 12.3% 14.8% 27.1% 6.3% 60.5%
Social rented 0.4% 3.2% 9.8% 10.4% 23.8%
Private rented/ living rent free 1.2% 2.9% 4.9% 6.6% 15.6%
Total 13.9% 20.9% 41.8% 23.3% 100.0%
Source: Census 2011
In comparison, Horsham demonstrates high levels of owner-occupied detached and semi-detached
homes. On the other hand, the proportions of properties which are social rented and are significantly
lower, with flats and semi-detached homes being the most prevalent within the social rented sector.
13% 10% 11% 12% 12% 12%
23% 24% 23%28% 26% 28%
48%
37% 41%39% 39%
41%
13%
21% 19% 16% 17%14%
2% 7% 6% 5% 6% 5%
0%
10%
20%
30%
40%
50%
60%
70%
80%
90%
100%
Crawley Horsham HMA West Sussex South East England
1 bed 2 bed 3 bed 4 bed 5+

30
Table 2: Housing stock in Horsham by tenure and type (2011)
Detached Semi-detached
Terraced Flats Total
Owner occupied 35.9% 20.3% 12.7% 6.2% 75.1%
Social rented 0.2% 3.6% 2.2% 5.6% 11.6%
Private rented/ living rent free 2.7% 2.9% 2.2% 5.5% 13.3%
Total 38.8% 26.8% 17.1% 17.3% 100.0%
Source: Census 2011
Within Horsham District, we have also sought to consider how the profile of homes differs between
the more urban and more rural parts of the District. The urban area is defined as including Horsham
Town and Broadbridge Heath, with the Rural Area comprising the remainder of the Borough.
There are higher levels of owner occupation in the rural areas compared to the urban area in
Horsham, however the proportions of home ownership in both are above the regional and national
average. The urban area saw slightly higher proportions of social renting (13.5%) and private renting
(13.4%) in 2011, but in both cases this was below regional/ national levels.
Table 3: Urban/ Rural split of tenures in Horsham, 2011
% Households Urban Rural
Owner Occupied 71.5% 76.6%
Shared ownership 0.7% 0.7%
Social rented 13.5% 10.2%
Private rented 13.4% 10.7%
Living rent free 0.9% 1.8%
Source: Census 2011
The Ministry of Housing, Communities and Local Government (MHCLG) provides data on the total
number of dwellings owned by a local authority between 2017 and 2018. The table below provides
a breakdown of the total number of dwellings owned by CBC and HDC as at 1 April 2018 by size of
dwelling.9
Crawley Borough Council has retained ownership of its housing stock and owns over 15,000
properties. This is particularly focused towards 3-bed properties which account for 46% of the total
stock, with a more moderate provision of 1-beds (20% of stock). Horsham District Council in contrast
has limited stock ownership.
9 The total number of dwellings has been achieved by combining figures for PFI & Shared Ownership, Social Rent and
Affordable Rent properties.

31
Table 4: Total number of dwellings owned by Crawley and Horsham, 2017-2018
Type Crawley Horsham
Bedsits 142 18
One bedroom 3,076 60
Two bedrooms 4,774 38
Three bedrooms 7,182 24
Four bedrooms 502 0
Five bedrooms 20 0
Equivalent of HMOs Hostels10 48 0
Total 15,743 140
Source: MHCLG, 2018
Whilst Table 4 addresses housing owned by the two Councils, it is also important to consider housing
owned by other Registered Social Landlords. The Regulator of Social Housing provides summary
overview of social rented units by type for local authorities in England. There are currently 19 private
registered providers (RPs) in Crawley and 24 in Horsham. Currently in Crawley 7.9% of the stock is
owned by small RPs11 and 92.1% is owned by large PRPs12. In comparison, in Horsham small RPs
own 2.3% of the stock and large PRPs own 79.7%.
Currently, the total numbers of social housing units are higher in Horsham when compared to
Crawley. In Horsham, there is a significantly higher proportion of affordable housing for older people
when compared to Crawley.
Table 5: Total social units by provision type in Crawley and Horsham, 2018
Crawley Horsham
General needs rented 4,023 11,521
LCHO (Shared ownership/ equity) 412 661
Supported housing 175 208
Housing for older people 498 2,109
Total 5,108 14,499
Source: The Regulator of Social Housing, 2018
How Households occupy Housing
Overcrowding is defined as the number of properties which have fewer rooms than their households
require. The requirement is calculated based on the size, age and relationship of household
members. Under-occupied properties on the other hand are those with more bedrooms than the
10 Dwelling equivalents of HMOs - This should equal the sum of multi-occupied dwellings plus the authority's share of any dwellings of multiple occupancy in shared ownership. The Dwelling Equivalents of Multi-occupied Dwellings have two components - a figure derived from bed spaces in hostels and a figure derived from "clusters" in Houses in Multiple Occupation 11 <1,000 units owned
12 1,000+units owned. PRPs refer in this document to providers of social housing in England that are registered with the social housing regulator and are not LAs (this is the definition of PRP in the 2008 Housing Act).

32
household needs. For instance, an under-occupied property can relate to a couple with no children
living in a two or more-bedroom property.
There has been a notable increase in overcrowded households at a national level (including young
people living with their parents for longer) and Houses in Multiple Occupation (HMOs). This has been
a symptom of affordability pressures, restrictions on access to mortgage finance and housing under-
supply. The English Housing Survey (2016-2017) states the rate of overcrowding in England for
2016/17 was 3%, with approximately, 682,000 households living in overcrowded conditions.
Overcrowding was more prevalent in the rented sectors than for owner occupiers. Only 1% of owner
occupiers nationally (183,000 households) were overcrowded in 2016-17 compared with 7% of social
renters (268,000) and 5% of private renters (231,000).
The English Housing Survey indicates that number and proportion of overcrowded households in the
owner-occupied sector has remained relatively stable over the last 20 years or so. In the social rented
sector, overcrowding peaked at 7% in 2010-11, before dropping to 6% in 2012-13. It remained at 6%
until 2014-15 but increased back up to 7% in 2015-16 where it remained in 2016-17. However, the
proportion of overcrowded households in the private rented sector increased from 3% in 1995-96 to
a peak of 6% in 2011-12, and since then has decreased slightly to 5%. The rapid overall growth in
private renters between 1995-96 and 2016-17 explains the pronounced increase in actual numbers
of overcrowded households from 63,000 in 1995-96 to 231,000 in 2016-17.
This national trend is evident in both Crawley and Horsham where the proportion of residents living
in over-occupied properties increased by 37% and 36% respectively between 2001 and 2011. Given
increasing affordability pressures, it is likely to have growth further since.
We have measured the occupancy of housing against the Census occupancy rating initially which
allows comparison of trends over time. In 2011, the proportion of overcrowded dwellings was 10%
for Crawley and 5% for Horsham (as a total of the current housing stock). This shows that
overcrowding in Crawley is generally higher when compared to the wider HMA, the region and the
country.
Table 6: Changes in Under - and Over- Occupied households – Occupancy Rating (2001-2011)
Under – Occupying Households Over -Occupied Households
2001 2011 % Change 2001 2011 % Change
Crawley 29,412 28,850 -2% 3,064 4,196 37%
Horsham 40,631 43,903 8% 2,158 2,929 36%
HMA 37,480 39,253 5% 2,412 3,441 43%
West Sussex 250,563 262,241 5% 16,994 23,155 36%
South East 2,539,347 26,605,53 5% 195,392 265,974 36%
England 15,274,290 16,027,853 5% 1,457,512 1,928,596 32%
Source: 2001 and 2011 Census
Under-occupation in Crawley fell marginally by 2% between 2001-11; whereas in Horsham it
increased by 8%, influenced in particular by a growing population of older persons in the District.
33
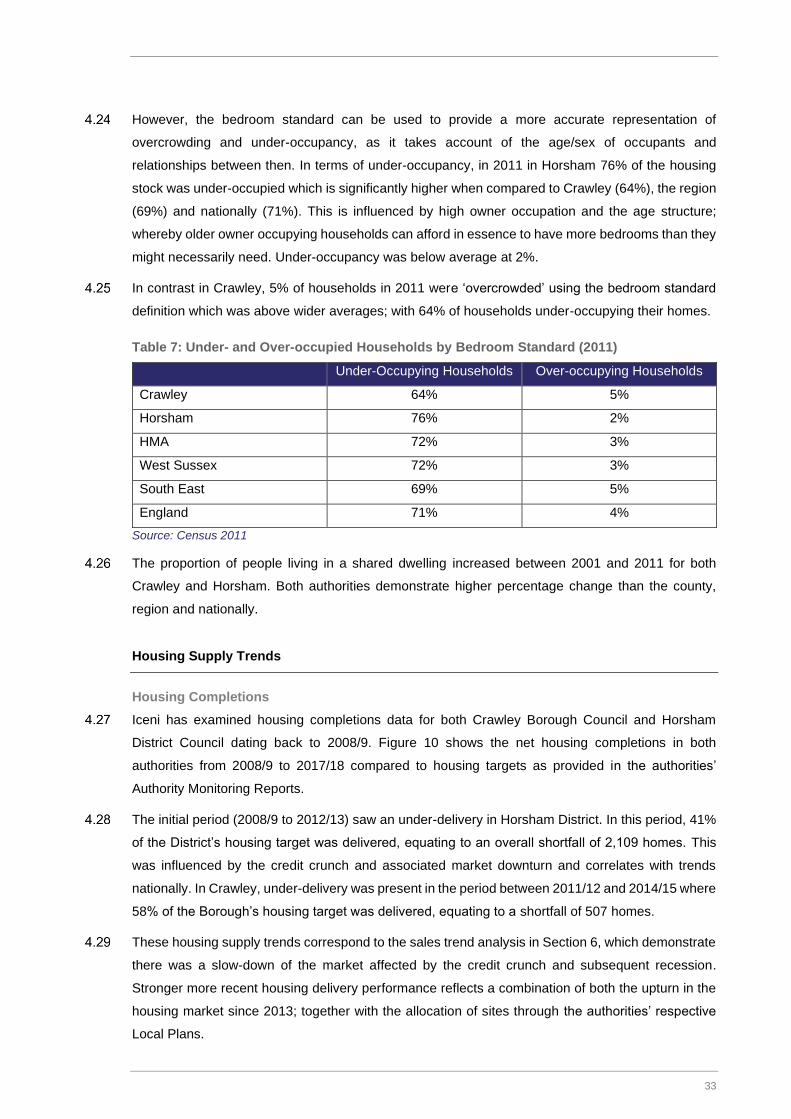
However, the bedroom standard can be used to provide a more accurate representation of
overcrowding and under-occupancy, as it takes account of the age/sex of occupants and
relationships between then. In terms of under-occupancy, in 2011 in Horsham 76% of the housing
stock was under-occupied which is significantly higher when compared to Crawley (64%), the region
(69%) and nationally (71%). This is influenced by high owner occupation and the age structure;
whereby older owner occupying households can afford in essence to have more bedrooms than they
might necessarily need. Under-occupancy was below average at 2%.
In contrast in Crawley, 5% of households in 2011 were ‘overcrowded’ using the bedroom standard
definition which was above wider averages; with 64% of households under-occupying their homes.
Table 7: Under- and Over-occupied Households by Bedroom Standard (2011)
Under-Occupying Households Over-occupying Households
Crawley 64% 5%
Horsham 76% 2%
HMA 72% 3%
West Sussex 72% 3%
South East 69% 5%
England 71% 4%
Source: Census 2011
The proportion of people living in a shared dwelling increased between 2001 and 2011 for both
Crawley and Horsham. Both authorities demonstrate higher percentage change than the county,
region and nationally.
Housing Supply Trends
Housing Completions
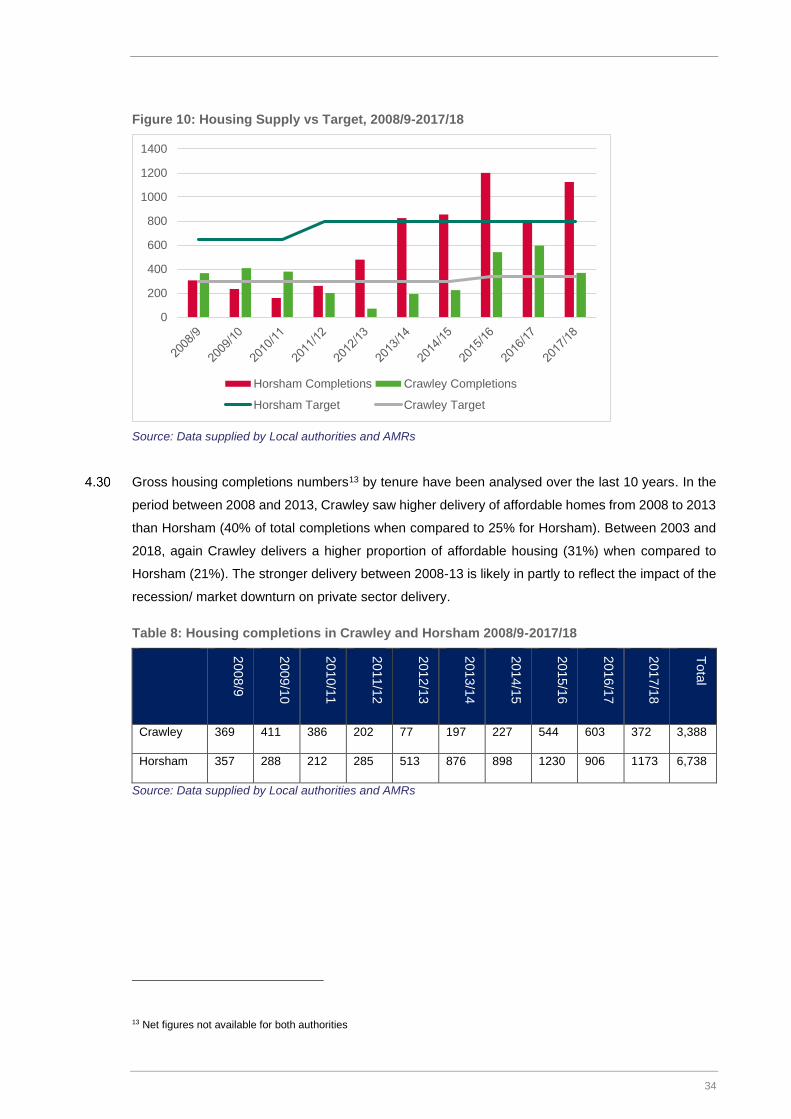
Iceni has examined housing completions data for both Crawley Borough Council and Horsham
District Council dating back to 2008/9. Figure 10 shows the net housing completions in both
authorities from 2008/9 to 2017/18 compared to housing targets as provided in the authorities’
Authority Monitoring Reports.
The initial period (2008/9 to 2012/13) saw an under-delivery in Horsham District. In this period, 41%
of the District’s housing target was delivered, equating to an overall shortfall of 2,109 homes. This
was influenced by the credit crunch and associated market downturn and correlates with trends
nationally. In Crawley, under-delivery was present in the period between 2011/12 and 2014/15 where
58% of the Borough’s housing target was delivered, equating to a shortfall of 507 homes.
These housing supply trends correspond to the sales trend analysis in Section 6, which demonstrate
there was a slow-down of the market affected by the credit crunch and subsequent recession.
Stronger more recent housing delivery performance reflects a combination of both the upturn in the
housing market since 2013; together with the allocation of sites through the authorities’ respective
Local Plans.
34
Figure 10: Housing Supply vs Target, 2008/9-2017/18
Source: Data supplied by Local authorities and AMRs
Gross housing completions numbers13 by tenure have been analysed over the last 10 years. In the
period between 2008 and 2013, Crawley saw higher delivery of affordable homes from 2008 to 2013
than Horsham (40% of total completions when compared to 25% for Horsham). Between 2003 and
2018, again Crawley delivers a higher proportion of affordable housing (31%) when compared to
Horsham (21%). The stronger delivery between 2008-13 is likely in partly to reflect the impact of the
recession/ market downturn on private sector delivery.
Table 8: Housing completions in Crawley and Horsham 2008/9-2017/18
2008
/9
2009
/10
2010
/11
2011
/12
2012
/13
2013
/14
2014
/15
2015
/16
2016
/17
2017
/18
Tota
l
Crawley 369 411 386 202 77 197 227 544 603 372 3,388
Horsham 357 288 212 285 513 876 898 1230 906 1173 6,738
Source: Data supplied by Local authorities and AMRs
13 Net figures not available for both authorities
0
200
400
600
800
1000
1200
1400
Horsham Completions Crawley Completions
Horsham Target Crawley Target

35
Figure 11: Housing completions by tenure in Crawley and Horsham 2008/9-2017/18
Source: Data supplied by Local authorities and AMRs
Housing Offer and Supply Trends: Key Points and Implications
A growing proportion of the housing stock in both Crawley and Horsham is within the private rented sector. Local authority ownership has decreased in Crawley; however, it has increased in Horsham in absolute terms and remained relatively stable as a proportion of the overall housing stock.
Within the Private Sector, the 2011 Census showed that a combination of deteriorating affordability, restricted access to mortgage products and a lack of social housing supply over the 2001-11 decade had resulted in fewer households being able to buy and thus increased pressures on the existing affordable housing stock.
In terms of types of housing stock in the HMA, 3-bedroom properties are most prevalent in both Crawley and Horsham, with Crawley displaying a lower proportion of 4-bedroom properties and Horsham showing a lower proportion of 1-bedroom properties as a whole.
In Crawley, the highest proportion of owned with a mortgage properties are terraced ones whilst Horsham demonstrates high levels of detached and semi-detached properties in both owned outright and owned with a mortgage category.
In terms of urban/rural split of tenures in Horsham, there are higher proportions of owned outright and with mortgages properties in Horsham Rural areas, however, the proportions of these two categories are also high in the urban areas of Horsham. The proportions of social and private rented are generally similar for both urban and rural areas. There is a slightly higher proportion of people living rent free in Horsham rural areas when compared to the urban category.
Currently Crawley Borough Council owns higher numbers of one, two and three-bedroom properties when compared to Horsham. Moreover, Horsham District Council has no record of owning any four, five or more-bedroom properties.
The proportion of over-occupied properties in both authorities has increased between 2001 and 2011. In terms of under-occupied properties, the proportion has fallen in Crawley but increased in Horsham as a result of an aging population in the District. Shared housing has increased in both authorities between 2001 and 2011.
In terms of delivery, there was a slow-down of the market during the recession for both authorities. Horsham completions correspond to the sales market recovery between 2011 and 2014, however in Crawley the levels of sales remained lower than the HMA and region which is reflected in the housing completions trend for the authority.
0
200
400
600
800
1000
1200
2008/9 2009/10 2010/11 2011/12 2012/13 2013/14 2014/15 2015/16 2016/17 2017/18
Crawley Private Crawley Affordable Horsham Private Horsham Affordable

36
37
LOCAL HOUSING NEED
This section of the report considers demographic trends and overall housing need. Government has
established a new standardised methodology for calculating ‘local housing need’ and the analysis
herein considers what this shows; but also, critically appraises the demographic projections which
feed into this methodology and assesses whether other factors might provide a basis for considering
higher housing provision.
The existing local plans in the three HMA authorities – Crawley, Horsham and Mid Sussex – were
each prepared in the context of the 2012 NPPF. The Plans across the three authorities essentially
meet the total need arising across the HMA assessed on this basis, with Horsham and Mid Sussex
contributing to meet an unmet housing need in Crawley. The basis of the housing requirement figures
in the existing local plans within the HMA are set out within the box below. However, the Government
has since published a revised NPPF (first in July 2018 and then updated in July 2019) which sets
out the revised approach to meeting housing need informed by the standard method; and therefore
it is necessary to appraise in this report the latest evidence regarding local housing needs.
Calculating Local Housing Need using the Standard Method
Planning Practice Guidance (PPG) on Housing Need Assessment sets out a standard method to be
used in calculating a housing need. The PPG then sets out a three-step process.
Basis of the Housing Requirement in Existing Local Plans within the HMA
The current adopted local plans across the HMA are based on housing needs evidence prepared in accordance with the 2012 NPPF, and prior to the introduction of the standard method.
The Crawley Local Plan 2015-30 (adopted in Dec 2015) was based on an objectively-assessed housing need (OAN) for 10,125 dwellings over the plan period (675 dpa). This was based on a demographic need for 614 dpa, together with a 10% market signals uplift. Policy H1 in the Local Plan sets a housing requirement for a minimum of 5,100 dwellings, resulting in an unmet need for c. 5,000 dwellings.
The Horsham District Planning Framework (adopted in Nov 2015) was based on an OAN for 13,000 dwellings over the 2011-31 plan period (650 dpa). This was based on a demographic need for 615 dpa, together with an uplift of c. 6% to support workforce growth and reduce affordability pressures. Policy 15 within the Plan makes provision for this and a 3,000 home contribution to meeting unmet housing needs from Crawley.
Mid Sussex’s Local Plan (adopted in 2018) was based on an OAN for 14,892 dwellings over the 2014-31 plan period (876 dpa) which was made up of a demographic need for 730 dpa and 20% market signals uplift. In addition the Plan makes provision for an unmet need of 1,498 dwellings from Crawley, this judged to be essentially the residual need taking account of evidence of higher capacity/land supply in Crawley.
The current round of plans across the three authorities thus made collectively provision to meet the housing market area’s housing needs in full.

38
Figure 12: Overview of the Standard Method for calculating Local Housing Need
The first step is to establish a demographic baseline of household growth. This is to be taken directly
from published household projections, with the Government directing use of the 2014-based
Household Projections in the methodology at the current time. Projected annual average household
growth over a 10-year period from the current year is calculated. For the purposes of this report a
10-year period from 2019 to 2029 has been used.
The second step of the proposed methodology seeks to adjust the demographic baseline on the
basis of affordability characteristics of the area. This uses the published ONS ratio of median house
prices to median (workplace based) earnings ratio for the most recent year for which data is available
(2018 at the time of preparing this report).
Specifically, the PPG says that ‘for each 1% increase in the ratio of house prices to earnings, where
the ratio is above 4, the average household growth should be increased by a quarter of a per cent’.
The equation to work out the adjustment factor is as follows:
Adjustment factor = ( Local affordability ratio – 4
) × 0.25 4
As an example, if the workplace affordability ratio in an area was 8.00; i.e. median house prices were
eight times the median earnings of those working in the area, then the adjustment would be 0.25 or
25%. This is calculated as follows: (8 - 4) / 4 × 0.25).
The final step in the proposed standard method is to consider whether the affordability adjustment
should be capped. There are two situations where a cap is applied. The first is where an authority
has reviewed their plan (including developing an assessment of housing need) or adopted a plan
within the last five years. In this instance the need may be capped at 40% above the requirement
figure set out in the plan. The second situation is where plans and evidence are more than five years
old. In such circumstances the cap is applied at 40% above either the projected household growth
or the housing requirement in the most recent plan (where this exists), whichever is the higher.
Government’s Planning Practice Guidance is clear that the cap affects the minimum Local Housing
Need figure, but does not affect the actual scale of housing need; and therefore in circumstances
3. Local Housing
Need
2. Adjustment based on
Affordability
1. Projected Household
Growth
39
where a cap is applied, there may be a need to test whether a higher level of housing provision can
be accommodated, or to consider an early review of a local plan. Specifically, it states:
“The cap reduces the minimum number generated by the standard method but does not reduce
housing need itself. Therefore, strategic policies adopted with a cap applied may require an early
review and updating to ensure that any housing need above the capped level is planned for as soon
as is reasonably possible.
Where the minimum annual local housing need figure is subject to a cap, consideration can still be
given to whether a higher level of need could realistically be delivered. This may help prevent
authorities from having to undertake an early review of the relevant policies.”
The purpose of inclusion of the cap within the methodology was particularly to address issues of
market capacity to deliver higher numbers. However, in Crawley’s case the housing requirement in
its existing local plan is essentially influenced by land supply. Iceni does not consider it appropriate
for essentially a land supply constraint to be applied in assessing housing need. For the purposes of
this report, a cap has not therefore been applied drawing conclusions on housing need.
In October 2018, MHCLG published a technical consultation on updates to national planning policy
and guidance – the main part of this document was around the Standard Method for assessing
housing need. Essentially, whilst Planning Practice Guidance had previously recommended using
the latest evidence where possible, the consultation document suggested setting aside the latest
(2016-based) household projections in preference for the previous (2014-based) set. In February
2019 a revised PPG confirmed that the 2014-based projections should be used as the baseline in
the standard method for calculating Local Housing Need. The reason for using the 2014-based
SNHP is that (at least at a national level) the 2016-based SNHP show a much lower level of
household growth (and hence housing need) in part because of changes in the methodology used
for projecting household growth. The Government has decided ‘it is not right to change its aspirations’
for housing supply to take account of the lower figures and in particular methodological changes and
has therefore proposed to continue using data from the older projections to inform housing need.
The table below, Table 9, therefore sets out a calculation of the need under the proposed Standard
Method. The analysis uses the following data:
• Projected household growth over the 2019-29 period based on the 2014-based Household
Projections;
• An affordability adjustment based on the median house price to workplace-based earnings ratio
published by ONS for 2018.
• A cap of 40% above the existing Local Plan requirement for each of the HMA authorities as in
each case the Plan is less than five years old at the time of writing (and will continue to be at the
intended submission point for Crawley and Horsham’s Local Plans).

40
The analysis (as set out in Table 9) shows a need for 965 dwellings per annum in Horsham and 752
dpa in Crawley.
It the cap is applied, Crawley’s minimum local housing need figure falls to 476 dpa. However as
identified this artificially constrains housing provision based on supply-side factors which we do not
consider appropriate; and therefore, this report has treated 752 dpa as the appropriate local housing
need figure for Crawley.
Taking account of the local housing need in Mid Sussex, the total minimum housing need across the
HMA arising from the standard method is 2,819 dpa using a 2019 baseline.
Table 9: MHCLG Standard Method Housing Need Calculations
Crawley Horsham Mid Sussex
Households 2019 47,386 59,734 63,348
Households 2029 53,083 65,706 70,489
Change in households 5,697 5,972 7,141
Per annum change 570 597 714
Affordability ratio (2018) 9.11 13.86 12.69
Affordability uplift to household growth 32% 62% 54%
Total need (uncapped) 752 965 1,102
Minimum Local Housing Need 752 965 1,102
The local housing need calculations may need to be updated in due course prior to the submission
of local plans to take account of future data releases. New affordability ratio data for 2019 is due to
be published in March 2020. New household projections are due to be released in Summer 2020,
and the Government has indicated that it may change or amend the standard method in due course
to take account of the implications of these new projections.
Interrogating the Demographic Implications of the Standard Method Figures
The sections to follow provide a brief description of some of the latest demographic information from
ONS around population and household growth. This information is then brought together to construct
a demographic projection which seeks to establish how the population can be expected to change
and the changes in household structures arising from delivery of the Local Housing Need figures
shown.
Past Population Growth
Figure 13 below considers population growth in the period from 1991 to 2017. The analysis shows
that generally over this period the population of the two local authority areas has been relatively
strong. In 2017, it is estimated that the population of the two areas had grown by 26%-28% from
1991 levels, this is in contrast with a 16% increase nationally.

41
Figure 13: Indexed population growth (1991-2017)
Source: ONS (mid-year population estimates)
Components of Population Change
The table in Appendix 2 considers the drivers of population change 2001 to 2017. The main
components of change are natural change (births minus deaths), net migration (internal/domestic
and international) and other changes. There is also an Unattributable Population Change (UPC)
which is a correction made by ONS upon publication of Census data if population has been under-
or over-estimated.
For Horsham the data shows that population growth is largely driven by internal migration – i.e.
people moving to the District from other parts of the United Kingdom. There are typically more modest
levels of natural change (births minus deaths) and international migration.
In Crawley, population growth has more strongly been driven by natural change, and this will be a
function of a younger population structure in the area. Crawley also typically sees a notable level of
international migration and net out-migration to other parts of the Country.
Both areas also show a negative level of UPC, suggesting that between 2001 and 2011, ONS may
have overestimated population growth within population estimates (and this was corrected once
Census data had been published).
2016-based Subnational Population Projections (SNPP)
The latest (2016-based) set of subnational population projections (SNPP) were published by ONS in
the May 2018 (replacing the 2014-based release which fed into the household projections used in
the standard method). The projections provide estimates of the future population of local authorities,
assuming a continuation of recent local trends in fertility, mortality and migration which are
constrained to the assumptions made for the 2016-based national population projections. The
projections do not attempt to predict the impact that future government or local policies, changing
economic circumstances or other factors might have on demographic behaviour. The table below
0,9
0,95
1
1,05
1,1
1,15
1,2
1,25
1,3
1991
1992
1993
1994
1995
1996
1997
1998
1999
2000
2001
2002
2003
2004
2005
2006
2007
2008
2009
2010
2011
2012
2013
2014
2015
2016
2017
Inde
xed
popu
latio
n gr
owth
(19
91=
1)
Horsham Crawley West Sussex South East England Column2
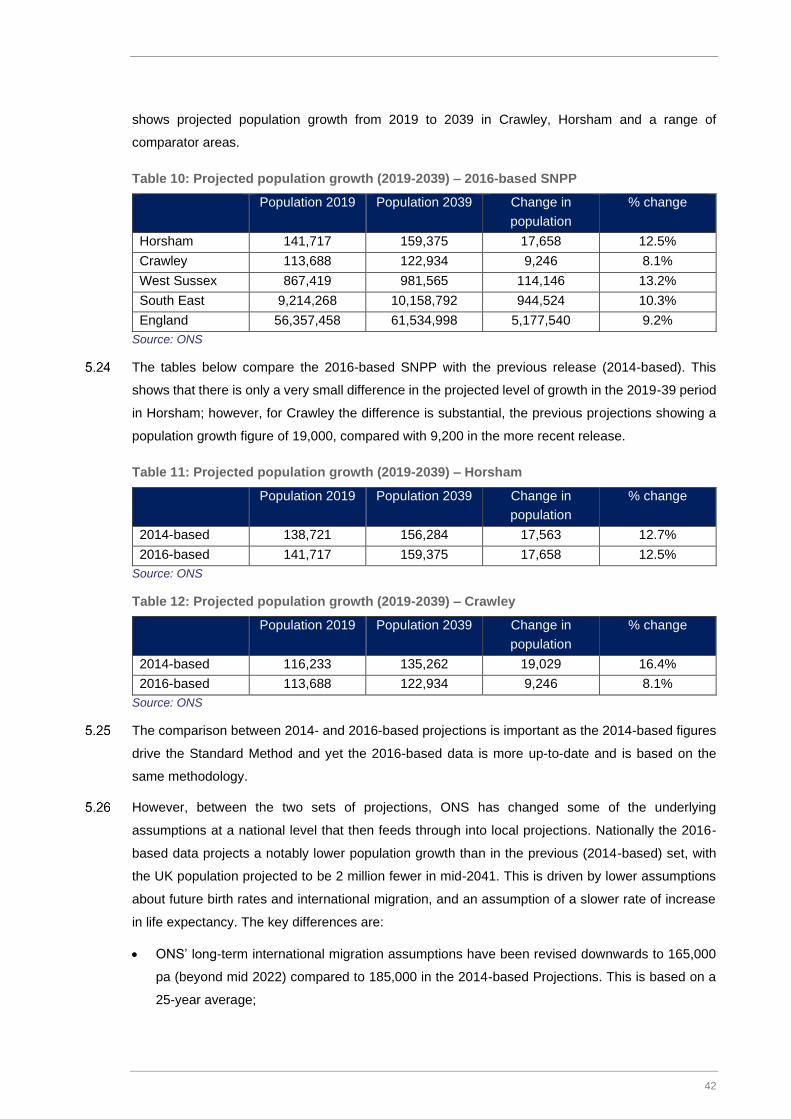
42
shows projected population growth from 2019 to 2039 in Crawley, Horsham and a range of
comparator areas.
Table 10: Projected population growth (2019-2039) – 2016-based SNPP
Population 2019 Population 2039 Change in
population
% change
Horsham 141,717 159,375 17,658 12.5%
Crawley 113,688 122,934 9,246 8.1%
West Sussex 867,419 981,565 114,146 13.2%
South East 9,214,268 10,158,792 944,524 10.3%
England 56,357,458 61,534,998 5,177,540 9.2%
Source: ONS
The tables below compare the 2016-based SNPP with the previous release (2014-based). This
shows that there is only a very small difference in the projected level of growth in the 2019-39 period
in Horsham; however, for Crawley the difference is substantial, the previous projections showing a
population growth figure of 19,000, compared with 9,200 in the more recent release.
Table 11: Projected population growth (2019-2039) – Horsham
Population 2019 Population 2039 Change in
population
% change
2014-based 138,721 156,284 17,563 12.7%
2016-based 141,717 159,375 17,658 12.5%
Source: ONS
Table 12: Projected population growth (2019-2039) – Crawley
Population 2019 Population 2039 Change in
population
% change
2014-based 116,233 135,262 19,029 16.4%
2016-based 113,688 122,934 9,246 8.1%
Source: ONS
The comparison between 2014- and 2016-based projections is important as the 2014-based figures
drive the Standard Method and yet the 2016-based data is more up-to-date and is based on the
same methodology.
However, between the two sets of projections, ONS has changed some of the underlying
assumptions at a national level that then feeds through into local projections. Nationally the 2016-
based data projects a notably lower population growth than in the previous (2014-based) set, with
the UK population projected to be 2 million fewer in mid-2041. This is driven by lower assumptions
about future birth rates and international migration, and an assumption of a slower rate of increase
in life expectancy. The key differences are:
• ONS’ long-term international migration assumptions have been revised downwards to 165,000
pa (beyond mid 2022) compared to 185,000 in the 2014-based Projections. This is based on a
25-year average;

43
• The latest (2016-based) projections assume that women will have fewer children, with the
average number of children per woman expected to be 1.84 compared to 1.89 in the 2014-based
Projections; and
• ONS is no longer assuming a faster rate of increase in life expectancy of those borne between
1923 – 1938, based essentially on more recent evidence. Life expectancy still increases, just not
as fast as previously projected.
For Horsham District, it can be seen that both projections show a similar level of population growth.
However, if looking at the detailed components of population change it can also be seen that net
migration in the base period feeding into the 2016-SNPP (the 2011-16 period for internal migration
and 2010-16 for international migration) is somewhat higher than would have fed into the 2014-
SNPP. The similar level of population growth will therefore be driven by changes made to fertility and
mortality assumptions, as well as the slightly lower assumptions about international migration. Given
that the 2014- and 2016-SNPP essentially show a very similar level of population growth it can
broadly be concluded that the 2014-based figures are reasonable for use in the Standard Method for
Horsham. However, we consider that the latest 2016-SNPP figures should be used when determining
the level of population growth that might occur if housing delivery is in-line with Standard Method
need figures.
In Crawley, Table 12 shows that population growth in the 2016-SNPP is substantially lower than in
the 2014-based version. In looking at the past components of change it can be seen that net
migration does appear to have fallen (when comparing base periods for the 2014- and 2016-based
SNPP). This lower migration will have driven the projections to show a lower future level of
population. This combined with other assumptions (fertility, mortality and international migration) will
explain why there is such a difference between the projection figures. Whilst the 2014-based
projections are potentially questionable on the basis of more recent data, the Government directs
that the 2014-based Household Projections should be used in the standard method and lower need
shown in 2016-based Household Projections does not represent exceptional circumstances justifying
a lower assessed housing need. However, for this report it is suggested that the 2016-SNPP should
be used as a baseline when projecting population growth linked to Standard Method need figures for
the purpose of other elements of the analysis.
With the overall change in the population will also come changes to the age profile. The tables below
summarise findings for key (5 year) age groups. In both areas, the largest growth will be in people
aged 65 and over, with more modest changes (and some decreases) in younger age groups.
Household Representative Rates (Household Formation)
The household projections are derived by applying age and sex specific household representative
rates (HRR) to the population projections. HRRs can be described in their most simple terms as the
number of people who are counted as heads of households (or in this case the more widely used
Household Reference Person (HRP)).

44
The latest HRRs are as contained in the ONS 2016-based subnational household projections
(SNHP) – these were published in September 2018. It would be fair to say that the 2016-based SNHP
have come under some criticism, particularly they are based only on data in the 2001-11 Census
period, a period in which the affordability of housing deteriorated and there was a period of
constrained credit availability and housing market activity. The 2016-based SNHP arguably build in
the suppression of household formation experienced in that time. The previous (2014-based)
projections used a longer time-series (all Census points back to 1971) and are therefore subject to
a much narrower error margin.
Because of the criticisms of the 2016-based SNHP, and the fact that these have driven the
Government to link the Standard Method to the 2014-based version, it is considered prudent to look
at both the 2016- and 2014-based figures. Additionally, consideration is given to an older (2008-
based) SNHP as these may reflect projections developed using data that contains less constraint in
the formation of younger households.
The figures in Appendix 3 compare HRRs in the 2008-, 2014- and 2016-based SNHP. The figures
are essentially the proportion of a particular age group that is considered to be the ‘head of
household’ (HRP as described above). The analysis shows that for many age groups the projections
are really quite different. When looking at some of the younger age groups (25-34 and 35-44) it is
notable that the HRRs in the 2014-based projections are somewhat higher than the 2016-based
version, with 2008-based figures being higher again. This does suggest that there may be some
degree of suppression being built into the 2016-based projections, or certainly not a positive
improvement in the formation rates of younger people. This supports the use of the 2014-based
Household Projections in the standard method, and the HFRs within these within our calculations.
Demographic Projections linked to the Standard Method
Earlier in this section, we calculated that the standard method would result in a need for 752 dwellings
per annum in Crawley, and 965 dwellings per annum in Horsham, looking from 2019 forwards. These
are based on projected household growth plus an affordability adjustment. But if homes are to be
occupied, the affordability adjustment must support additional migration and/or household formation.
Bespoke demographic projections have therefore been developed which increases migration and
the formation of younger households in each area such that there is sufficient population for 752 dpa
in Crawley and 965 dpa in Horsham.
Within the modelling, migration assumptions have been changed so that across each area the
increase in households matches the Standard Method housing need (assuming 3% vacancy homes).
The changes to migration have been applied on a proportionate basis; the methodology assumes
that the age/sex profile of both in- and out-migrants is the same as underpins the 2016-based SNPP
with adjustments being consistently applied to both internal (domestic) and international migration.
Adjustments are made to both in- and out-migration (e.g. if in-migration is increased by 1% then out-
migration is reduced by 1%).
45
The modelling also assumes improvements in household formation amongst younger households
result from the affordability adjustment, using a ‘part-return-to-trend’ methodology. In this the rate of
household formation for younger age groups (25-34 and 35-44) sits somewhere between figures in
the 2014-based projections and those in the older 2008-based version. This approach was widely
used prior to the 2016-based SNHP being published and was an approach previously suggested by
the Local Plans Expert Group (LPEG).
In summary, to develop a Standard Method projection the following key assumptions have been
used:
• 2016-based SNPP as the base for population dynamics (including birth/death schedules and
age/sex profile of migration)
• Population data for mid-2017 to revised 2017 base
• Rolled forward 2017-2019 on the basis of the 2016-based SNPP
• Converting population into households by using the 2014-based SNHP HRRs with a part return
to trend adjustment for the 25-34 and 35-44 age groups (LPEG adjustment)
• Convert households into dwellings with a standard 3% vacancy allowance
In developing this projection, a notably higher level of population growth is derived (particularly in
Crawley) when compared with the 2016-based SNPP. The age structure of the projections is also
slightly different, with the projection linked to the Standard Method showing stronger growth in what
might be considered as ‘working-age’ groups. This arises due to the fact that ONS data shows that
migrants are heavily concentrated in those age groups (along with their associated children).
Tables 13 and 14 show how the age structure of the population is expected to change with delivery
of 965 dwellings per annum over the 20-years to 2039 in Horsham District and 752 dpa (2019-39) in
Crawley.
The population of both authorities is expected to grow by 24% over the 20-year period. In both
authorities, population growth is expected across a range of age groups, but with the strongest
growth expected in those aged over 65 linked to changes in the population age structure and
improving longevity.

46
Table 13: Population change 2019 to 2039 by five-year age bands – Horsham (linked to
delivery of 965 dwellings per annum)
Population 2019 Population 2039 Change in
population
% change from
2019
Under 5 7,174 8,520 1,346 18.8%
5-9 8,396 9,279 883 10.5%
10-14 8,801 10,151 1,350 15.3%
15-19 7,417 9,440 2,023 27.3%
20-24 5,768 6,906 1,138 19.7%
25-29 6,680 8,429 1,749 26.2%
30-34 7,200 8,681 1,481 20.6%
35-39 8,027 8,822 795 9.9%
40-44 8,676 10,243 1,567 18.1%
45-49 10,035 10,956 921 9.2%
50-54 11,408 11,218 -190 -1.7%
55-59 10,887 11,081 194 1.8%
60-64 9,160 10,640 1,480 16.2%
65-69 8,460 11,413 2,952 34.9%
70-74 8,665 12,019 3,354 38.7%
75-79 6,189 10,777 4,588 74.1%
80-84 4,663 8,109 3,446 73.9%
85+ 4,739 10,358 5,619 118.6%
Total 142,343 177,042 34,699 24.4%
Source: Demographic Projections
Table 14: Population change 2019 to 2039 by five-year age bands – Crawley (linked to delivery
of 752 dwellings per annum)
Population 2019 Population 2039 Change in
population
% change from
2019
Under 5 7,867 8,908 1,041 13.2%
5-9 8,354 8,581 227 2.7%
10-14 7,320 8,244 923 12.6%
15-19 6,113 7,791 1,679 27.5%
20-24 5,688 7,607 1,919 33.7%
25-29 7,632 9,950 2,318 30.4%
30-34 9,023 10,260 1,238 13.7%
35-39 9,613 9,624 11 0.1%
40-44 8,308 9,711 1,403 16.9%
45-49 7,771 9,388 1,617 20.8%
50-54 7,471 9,089 1,619 21.7%
55-59 6,854 8,783 1,929 28.1%
60-64 5,722 7,386 1,664 29.1%
65-69 4,451 6,589 2,138 48.0%
70-74 3,977 5,965 1,988 50.0%
75-79 2,521 4,924 2,403 95.3%
80-84 1,979 3,588 1,609 81.3%
85+ 2,374 3,801 1,427 60.1%

47
Total 113,038 140,191 27,153 24.0%
Source: Demographic projections
Tables 15 and 16 show how the profile of different types of household is expected to change. The
strongest growth in Horsham is expected in coupled and single person households aged over 65.
However, growth in both family and other households is expected as well as well as households
which include other adults (such as those include adult children).
Table 15: Change in household types 2019-39 (linked to provision of 965 dwellings per annum)
– Horsham
2019 2039 Change
%
Change
One-person household (aged 65 and over) 8,875 13,537 4,662 52.5%
One-person household (aged under 65)
8,753 11,103 2,349 26.8%
Couple (aged 65 and over)
9,918 16,730 6,812 68.7%
Couple (aged under 65)
9,010 7,420 -1,590 -17.6%
A couple and one or more other adults: No
dependent children 4,655 5,803 1,148 24.7%
Households with one dependent child
7,432 9,949 2,516 33.9%
Households with two dependent children 7,393 9,111 1,717 23.2%
Households with three dependent children 2,162 2,144 -18 -0.8%
Other households
2,923 4,064 1,141 39.1%
TOTAL
61,122 79,860 18,738 30.7%
Total households with dependent children 16,988 21,203 4,216 24.8%
Source: Demographic projections
In Crawley, again couple and single person households aged over 65 see the strongest growth; but
beyond this growth is focused on single person and other households with modest growth in family
households.
Table 16: Change in household types 2019-39 (linked to provision of 752 dwellings per annum)
– Crawley
2019 2039 Change % change
One-person household (aged 65 and over) 4,887 7,707 2,820 57.7%
One-person household (aged under 65) 8,518 12,002 3,485 40.9%
Couple (aged 65 and over) 3,718 6,114 2,396 64.4%
Couple (aged under 65) 5,470 4,220 -1,250 -22.9%
A couple and one or more other adults:
No dependent children 4,241 6,355 2,114 49.8%
Households with one dependent child 7,548 10,579 3,031 40.2%
Households with two dependent children 5,721 6,204 483 8.4%
Households with three dependent children 2,490 2,673 183 7.3%
Other households 3,510 4,851 1,341 38.2%
TOTAL 46,102 60,704 14,602 31.7%
Total households with dependent children 15,758 19,455 3,696 23.5%
Source: Demographic projections

48
Table 17 below shows the growth in the age profile of heads of households in each area. Again, the
strongest growth is in those aged over 65. It is notable that we see more limited growth of those in
their 30s (and particularly 35-39) in Crawley; and minimal growth of those in their 50s in Horsham.
Table 17: Projected change in households by age of household reference person – linked to
Standard Method housing need
Horsham Crawley
House-
holds
2019
House-
holds
2039
Change
in
house-
holds
%
change
House-
holds
2019
House-
holds
2039
Change
in
house-
holds
%
change
16-24 912 1,133 221 24.3% 1,159 1,583 424 36.6%
25-29 2,533 3,354 822 32.4% 2,684 3,609 924 34.4%
30-34 3,621 4,472 851 23.5% 4,294 5,021 728 17.0%
35-39 4,251 4,889 638 15.0% 5,541 5,751 210 3.8%
40-44 4,752 5,856 1,104 23.2% 4,896 5,962 1,066 21.8%
45-49 5,611 6,187 577 10.3% 4,722 5,789 1,066 22.6%
50-54 6,432 6,410 -22 -0.3% 4,548 5,568 1,021 22.4%
55-59 6,375 6,556 181 2.8% 4,284 5,500 1,216 28.4%
60-64 5,322 6,245 923 17.3% 3,575 4,681 1,106 30.9%
65-69 5,101 6,971 1,870 36.6% 2,844 4,488 1,644 57.8%
70-74 5,480 7,896 2,416 44.1% 2,595 4,075 1,480 57.0%
75-79 4,128 7,125 2,997 72.6% 1,746 3,312 1,567 89.7%
80-84 3,247 5,540 2,294 70.6% 1,460 2,601 1,141 78.2%
85 + 3,358 7,225 3,866 115.1% 1,754 2,762 1,008 57.5%
Total 61,122 79,860 18,738 30.7% 46,102 60,704 14,602 31.7%
Source: Demographic projections
Expected Workforce Growth
A further output of the demographic projections developed is an assessment of the growth in resident
workforce which might be supported by the local housing need, and what this means for potential
total labour supply (taking account of commuting and double jobbing).
Growth in Resident Labour-Supply
The approach taken in this report is to derive a series of age and sex specific economic activity rates
and use these to estimate how many people in the population will be economically active. Data on
economic activity rates has been drawn in this instance from the Office for Budget Responsibility
(OBR) July 2018 Fiscal Sustainability Report. These is a standard approach for estimating changes
in labour supply.

49
The charts below show the assumptions made.14 The analysis shows that the main changes to
economic activity rates are projected to be in the 60-69 age groups linked in particular to changes to
pensionable age. The OBR activity rate projections take account of broader trends in the number of
older people working for longer (which in itself is linked to improved health and longevity, pension
age changes and general reductions in pension provision).
Figure 14: Projected changes to economic activity rates (2019 and 2039) – Horsham
Males Females
Source: OBR and Census 2011
14 The detailed age specific assumptions are shown in tables in Appendix 4
0%
10%
20%
30%
40%
50%
60%
70%
80%
90%
100%
16-1
9
20-2
4
25-2
9
30-3
4
35-3
9
40-4
4
45-4
9
50-5
4
55-5
9
60-6
4
65-6
9
70-7
4
75-8
9
Per
cent
eco
nom
ical
ly a
ctiv
e
2019 2039
0%
10%
20%
30%
40%
50%
60%
70%
80%
90%
100%
16-1
9
20-2
4
25-2
9
30-3
4
35-3
9
40-4
4
45-4
9
50-5
4
55-5
9
60-6
4
65-6
9
70-7
4
75-8
9
Per
cent
eco
nom
ical
ly a
ctiv
e
2019 2039

50
Figure 15: Projected changes to economic activity rates (2019 and 2039) – Crawley
Males Females
Source: OBR and Census 2011
Working through an analysis of age and sex specific economic activity rates it is possible to estimate
the overall change in the number of economically active people in each area (see Table 18). The
analysis shows that there would be a notable increase in the economically active population in both
areas.
Table 18: Estimated change to the economically active population (2019-39) – linked to
Standard Method Projection
Economically active
(2019)
Economically active
(2039)
Total change in
economically active
Horsham 74,981 90,088 15,106
Crawley 63,238 79,530 16,292
Source: Derived from demographic projections
Linking Changes to Resident Labour Supply and Job Growth
The analysis above has set out potential scenarios for the change in the number of people who are
economically active. However, it is arguably more useful to convert this information into an estimate
of the number of jobs this would support. The number of jobs and resident workers required to
support these jobs will differ depending on three main factors:
• Commuting patterns – where an area sees more people out-commute for work than in-commute
it may be the case that a higher level of increase in the economically active population would be
required to provide a sufficient workforce for a given number of jobs (and vice versa where there
is net in-commuting);
0%
10%
20%
30%
40%
50%
60%
70%
80%
90%
100%16
-19
20-2
4
25-2
9
30-3
4
35-3
9
40-4
4
45-4
9
50-5
4
55-5
9
60-6
4
65-6
9
70-7
4
75-8
9
Per
cent
eco
nom
ical
ly a
ctiv
e
2019 2039
0%
10%
20%
30%
40%
50%
60%
70%
80%
90%
100%
16-1
9
20-2
4
25-2
9
30-3
4
35-3
9
40-4
4
45-4
9
50-5
4
55-5
9
60-6
4
65-6
9
70-7
4
75-8
9
Per
cent
eco
nom
ical
ly a
ctiv
e
2019 2039

51
• Double jobbing – some people hold down more than one job and therefore the number of workers
required will be slightly lower than the number of jobs; and
• Unemployment – if unemployment were to fall then the growth in the economically active
population would not need to be as large as the growth in jobs (and vice versa).
To provide estimates of the number of jobs supported, we have taken a 2011 Census commuting
ratio; made an allowance for double jobbing based on Annual Population Survey data averaged over
the period 2004-17.
On the basis of current conditions of almost full employment, we have not assumed any reductions
in unemployment. For the purposes of this assessment it has been assumed that around 4.7%
(Horsham) and 3.4% (Crawley) of people will have more than one job moving forward.
Horsham has a commuting ratio of 1.18 meaning that the number of people resident in the area who
are working being about 18% higher than the total number who work in the area. In Crawley the
opposite pattern is seen, with the number of people living in the area (and in work) being around 30%
lower than the number who work in the area. We assume that this commuting ratio remains constant
for modelling purposes.
On the basis of these assumptions, the table below shows how many additional jobs might be
supported by population growth under the Standard Method. Delivery of 15,040 dwellings in Crawley
(2019-39) would support growth of c. 24,200 jobs; whilst in Horsham, delivery of 19,300 dwellings in
Horsham would support jobs growth of 13,500.
Table 19: Jobs supported by Standard Method (2019-39)
Total change in
economically active
Allowance for net
commuting
Allowance for double
jobbing (= jobs
supported)
Horsham 15,106 12,818 13,456
Crawley 16,292 23,341 24,166
Source: Derived from a range of sources as described
Attempts to link housing delivery with estimates of the number of jobs supported should be treated
with some caution, not least because there are a number of assumptions made which do have
alternatives (e.g. the choice of economic activity rate data, the potential for commuting to flex or for
higher migration to be supported rather than additional household formation).
Other Considerations in drawing conclusions on Local Housing Need
Planning Practice Guidance sets out that the standard method does not predict the impact that future
Government policies, changing economic circumstances or other factors may have. The Guidance15
15 Paragraph: 010 Reference ID: 2a-010-20190220
52
states that there will be circumstances where it is appropriate to consider whether actual housing
need is higher than the standard method indicates. These are relevant issues for plan-making.
The circumstances where this may be appropriate include:
• Where funding is in place to promote and facilitate additional growth (i.e. Housing Deals, City
Growth Deals, etc.); or
• Where strategic infrastructure improvements are likely to drive an increase in the homes
needed locally; or
• An authority agreeing to take on unmet need from neighbouring authorities, as set out in a
statement of common ground.
The relevance of this in a Northern West Sussex context relates in particular to the following key
growth drivers related to strategic infrastructure improvements - as well as the potential for unmet
need from neighbouring authorities:
• Growth of Gatwick Airport; and
• Rail Service Enhancements (inc. The Thameslink Programme)
These key growth drivers and their potential impact on housing provision are considered in turn
below.
The Implications of Gatwick Airport Growth
The expansion of Gatwick Airport in respect of a potential second runway for the airport as well as
the desire to increase capacity through its existing runways is well documented and widely
publicised. In September 2012, the Government set up a commission chaired by Sir Howard Davies
– “the Airport Commission” – tasked with examining the need for additional UK airport capacity before
recommending how this can be met in the short, medium and long term.
Over the period from 2013 to 2015 relating to the Airport Commission process, Gatwick Airport made
numerous detailed submissions to promote a second runway at Gatwick Airport as a long-term
proposal. A Final Report was published by the Airport Commission in July 201516 which unanimously
concluded a third runway at Heathrow Airport was the strongest case; before the Government
expressed support for this option in October 201617, as “the right one for the UK”.
16 Airports Commission: Final Report, July 2015
17 https://www.gov.uk/government/news/government-decides-on-new-runway-at-heathrow

53
Gatwick Airport has recently undertaken a 12-week period of public consultation on a draft
masterplan for the airport which ran from 18th October 2018 to 10th January 2019 in order to explain
the airport’s latest thinking on how it can “meet growing demand for air travel and provide the UK
with enhanced global connectivity beyond 2030.”
On 18th July 201918, Gatwick Airport confirmed that two-thirds of respondents to public consultation
support Gatwick’s intention to build capacity by making best use of existing runways in order to meet
demand over the next fifteen years. Consequently, it is no longer actively pursuing plans for an
additional runway. Instead, the Airport plans to use its emergency runway for routine flights; and will
seek development consent to widen the airstrip in order to bring it into full passenger use by the mid-
2020s.
The Airport has also confirmed however that they will recommend planning policy continues to
safeguard land near the airport for a future possible runway. Nevertheless, given the uncertainty
around the timescales and the likelihood of future runway being delivered, it is not appropriate to
consider the impact of this at this stage.
Focussing solely on the existing runways therefore; alongside a report on the public consultation
exercise, Gatwick Airport has published the final version of the Gatwick Airport Masterplan 2019
which provides further detail on the growth strategy of the airport. This includes the following three
scenarios which will be taken forward:
• Scenario 1: where it remains a single runway operation, using technology to increase capacity
on the existing runway;
• Scenario 2: the existing runway standby runway is routinely used together with the main
runway; and
• Scenario 3: continuing to safeguard land for an additional runway to the south.
Gatwick Airport Limited has since formally started the process of seeking development consent to
bring the existing standby (northern) runway into routine use for smaller departing aircraft. This is
therefore the focus of our analysis in this report.
The Masterplan notes that Gatwick’s single runway handled 45.7 million passengers in the year
2017/18. In respect of the impact of the growth scenarios outlined above over the next fifteen years,
18http://mediacentre.gatwickairport.com/pressreleases/2019/19_07_18_master_plan.aspx?_ga=2.194433901.1772212501.1
563957616-733366568.1563795254

54
the Masterplan states that in respect of Scenario 1 i.e. continuing with the existing single runway
operation, by 2032 Gatwick Airport could be processing up to 61 million passengers per annum
(mppa) as a result of air traffic management technologies.
In respect of Scenario 2, by operating both runways simultaneously, the airport would be able to add
between 10 and 15 additional flights in the peak hours which could deliver up to 70 mppa by 2032.
The Masterplan assumes the standby runway could be brought into use alongside the main runway
by the mid-2020s. This is the scenario that it is now taking forwards.
Turning to the consider the potential impact of this, RPS and Optimal Economics were commissioned
by Gatwick Airport Ltd in 2013 to prepare an initial technical report19 (“the 2013 report”) on the
employment implications of providing a second runway and of the likely consequential scale of
additional housing provision that could be needed to house airport related works.
Although now dated and prepared in alternative circumstances, the report is helpful in understanding
the potential impact of growth at Gatwick Airport, in that it considers three options/scenarios of
increased passenger numbers which can be used to broadly review the potential impact of the
airport’s current expansion plans.
The 2013 report and all forecasts within it are based on 2012 estimates of Gatwick Airport related
employment and passenger numbers. The employment figures relate to a study area which is drawn
around local authority areas within which at least 1% of the 2012 Gatwick Airport workforce lived.
The Gatwick related employment across the study area is shown in the Table below at a total of
31,100.
Table 20: Gatwick Related Employment in the Study Area, 2012
Type of Employment Study Area Jobs
Direct On-Airport Employment 21,000
Direct Off-Airport 2,200
Indirect 1,900
Induced 6,000
Total 31,100
Source: Table 2.1, Gatwick Airport Second Runway – Employment and Housing Technical Report, March 2014
19 Gatwick Airport Second Runway – Employment and Housing Technical Report, March 2014

55
In terms of passenger numbers, the report (paragraph 2.12) notes traffic of 33.8 mppa in 2012.
Turning to growth, the report sets out three scenarios for a second runway looking to 2050 i.e. when
the runway would be expected to be at full capacity, as follows:
• Option 1 - 66.3 mppa
• Option 2 - 82 mppa; and
• Option 3 - 87 mppa
In a context whereby the 2019 Masterplan now anticipates that the Airport could process up to 70
mppa with the use of the emergency runway by 2032; the scale of growth now envisaged sits
between Option 1 and Option 2 in the 2013 report.
The 2013 report draws on forecasts which show total Gatwick-related employment by each of the
three options on the basis of low productivity and high productivity assumptions. We have set out the
three traffic growth options looking ahead to 2050/51 alongside the additional employment
associated with the ‘base case’ i.e. continued growth with one runway and growth from second
runway throughout the period for each option. This is shown in the Table below.
Table 21: The 2013 Report Growth Scenarios at 2050/51
Option
Traffic at 2050/51 Traffic Growth 2011/12 - 2050/5120
Total Additional Jobs 2011/12 - 2050/51
Low Productivity
High Productivity
Option 1 66 mppa 32.2 mppa 14,000 11,900
Option 2 82 mppa 48.2 mppa 21,800 19,200
Option 3 87 mppa 53.2 mppa 24,100 21,300
Source: Iceni Analysis of Gatwick Airport Second Runway – Employment and Housing Technical Report, March 2014
It is considered appropriate to focus on the total jobs created using the high productivity assumption
only, given the UK’s Industrial Strategy’s aim is to boost productivity by backing businesses to create
good jobs and increase the earning power of people throughout the UK with investment in skills,
industries and infrastructure. On this basis, we can calculate the ratio of additional jobs to mppa
growth as a result of continued growth with a single runway and with the addition of a second runway.
This is shown in the Table below.
20 Set against the 2011/12 baseline of 33.8 mppa

56
Table 22: Calculating Additional Jobs per MPPA
Option Total Additional Jobs
2011/12 - 2050/51 Traffic Growth
2011/12 - 2050/51 Additional Jobs per MPPA
Option 1 11,900 32.2 mppa 370
Option 2 19,200 48.2 mppa 398
Option 3 21,300 53.2 mppa 400
Source: Iceni Analysis of Gatwick Airport Second Runway – Employment and Housing Technical Report, March 2014
Given that the total proportion of overall growth now being considered sits between Options 1 and 2
overall (i.e. 70 mppa against 66 and 82 mppa respectively), we consider it is appropriate to take the
average jobs per mppa from these two options (Options 1 and 2), which is 384 jobs per mppa. This
can then be applied to expected growth in passengers at the airport, which is to 70 mppa by 2032,
equal to growth of 24.3 mppa from the 2017/18 position (Scenario 2 in the Gatwick Masterplan).
The estimated additional jobs created across the study area is 9,331 jobs over the fifteen-year period
looking to 2032. This is shown in the Table below.
Table 23: Additional Jobs – Current Expansion Plans – Study Area
Scenario Jobs to MPPA Ratio Traffic Growth to 2032 Study Area Additional
Jobs to 2032
Masterplan Scenario 2
384 per mppa 24.3 mppa 9,331
Source: Iceni Analysis of Gatwick Airport Second Runway – Employment and Housing Technical Report, March 2014
The RPS & Optimal Economics Study identified the proportions of the Gatwick Airport workforce
living in different local authorities within the defined Study Area. It identified that 31.8% of Gatwick’s
on-airport workforce lived in Crawley and 7.1% in Horsham. Iceni has assumed that these
proportions hold true. On this basis, it is anticipated that the airport’s expansion would support a need
for 2,967 additional workers in Crawley to 2032 and 663 additional workers in Horsham. These
figures are shown in Tables 24 and 25 below.
Table 24: Proportion of Additional Jobs in Crawley
Scenario Study Area
Additional Jobs to 2032
Proportion of Workforce from
Crawley
Crawley Additional Jobs to 2032
Scenario 2 9,331 31.8% 2,967
Source: Iceni Analysis of Gatwick Airport Second Runway – Employment and Housing Technical Report, March 2014

57
Table 25: Proportion of Additional Jobs in Horsham
Scenario Study Area
Additional Jobs to 2032
Proportion of Workforce from
Horsham
Horsham Additional Jobs to 2032
Scenario 2 9,331 7.1% 663
Source: Iceni Analysis of Gatwick Airport Second Runway – Employment and Housing Technical Report, March 2014
We can then compare these levels of jobs growth with the level of workforce growth set out in Table
19. Over the period to 2039, workforce growth of 16,300 in expected in Crawley. Gatwick expansion
might draw additional workforce of c. 3,000 from Crawley, which equates to around 18% of the
expected workforce growth aligned to the standard method figures. Whilst this is reasonable
substantive, the evidence does not suggest that the airport expansion would necessarily result in
additional housing need over and above the figures generated by the standard method.
For Horsham, over the period to 2039 the analysis in Table 19 indicates that the District’s workforce
would expand by around 15,100 persons. The expansion of Gatwick Airport might result in a draw of
c. 700 persons from Horsham District equating to just 4.4% of the expected growth. This is unlikely
to support additional housing demand over and above the figures generated by the standard method.
It should be noted that as the DCO process progresses, if further information comes to light it may
be necessary to review the above calculations. It should also be noted that the consideration of the
scale of jobs growth and the where the workforce might live could be a study undertaken across the
Gatwick Diamond authorities in its own right in particular given the potential for commuting dynamics
to change.
The Impact of Rail Service Enhancements
Crawley and Horsham are served by two main railway operators – Thameslink and Southern. There
are routes on the Brighton Main Line towards London; which serve Gatwick Airport and Three
Bridges; together with services running to Horsham, along the Arun Valley line; and from Horsham
to London via Dorking. Great Western also operates a service from Gatwick Airport to Reading.
The Government sponsored Thameslink Programme is a notable ongoing 10-year programme of
extensive infrastructure enhancements which began in 2009 with an objective to bring faster, more
frequent and better-connected journeys for north-south travelling passengers through London.
As a result of the Programme relative to the network, new infrastructure, stations, technology and
115 new trains have and are being delivered on an expanded Thameslink network to deliver
significant improvements that respond to the growth in passenger demand. Although most of the
Thameslink Programme work is now completed, some of the work remains ongoing.

58
As a result of the Thameslink Programme, there have been additional – albeit limited - services
added to the timetable which has resulted in an increased level of capacity for existing users of the
line between Peterborough/Cambridge and Brighton, and direct Thameslink train services serving
Horsham as well as intermediate stations between Horsham and Crawley.
Fundamentally however, in the context of considering whether this has an impact on additional
housing provision, the rail service enhancements have not introduced new railway stations or
increased the number of station calling points. Overall therefore, the impact of the rail service
enhancements are not considered to have driven an increase in the need for homes locally albeit
that capacity is likely to have been improved.
At Crawley Position
Crawley Borough’s administrative boundaries have been drawn tightly around Borough’s existing
urban area. The Council and neighbouring authorities have been exploring the potential for wider
development which goes beyond the Borough boundary, but which represents development “at
Crawley” through plan reviews over the past decade. An ‘at Crawley” Study was prepared in 2006
and updated in 2009 looking at development options adjoining Crawley’s urban area, but which in a
number of cases extend beyond the Borough boundaries. Two such development options are now
being progressed – Land at Kilnwood Vale (which falls administratively in Horsham District) and land
at Pease Pottage (which falls administratively within Mid Sussex). A Joint Area Action Plan for the
Kilnwood Vale area (known previously as West of Bewbush) was adopted by Horsham District
Council and Crawley Borough Council in 2009.
Kilnwood Vale is located to the west of Crawley Borough’s boundary. An outline application
(DC/10/1612) was submitted to Horsham District in 2010 for approximately 2,500 dwellings (c.42%
1 and 2-bedroom, c.32% 3-bedroom and c.26% 4+bedroom dwellings) along with various other
services including employment space, retail and community and a new rail station. Planning
permission was granted in September 2011. To date, approximately 686 dwellings have been
completed at Kilnwood Vale.
Pease Pottage is located to the south of Crawley’s borough. An application (DM/15/4711) was
submitted to Mid Sussex Council in 2015 for approximately 600 dwellings (c. 10% 1-bedroom, c.41%
2-bedroom, c.27% 3 -bedroom and c.22% 4+bedrooms), a care facility and additional community
and education uses. Outline consent now exists, and the first phase of development is underway.
Given the constraints which exist to development within Crawley Borough’s administrative
boundaries, it seems likely that an unmet need could arise. This may justify development – subject
to further detailed consideration and infrastructure analysis – adjoining Crawley, but beyond the
Borough’s administrative boundaries. Such development would contribute to meeting Crawley’s
housing needs, and therefore it would be appropriate for discussions regarding the mix of housing to
be taken forward within such development to have regard to the housing needs of Crawley identified
59
within this Study, including both the affordable housing need and findings regarding the mix of homes
needed.
Local Housing Need: Implications
The standard method results in a local housing need for 2,819 dpa across the Northern West Sussex Housing Market Area, within which there is a need for 752 dpa in Crawley and 965 dpa in Horsham (2019-29). Our assessment indicates that these are reasonable projections based on the evidence.
This scale of local housing need would support population growth of 27,200 over the 2019-39 period in Crawley (24%) and a more substantial 34,700 growth in population in Horsham (also 24%).
Our analysis shows that, assuming commuting patterns remain consistent, this would support potential employment growth of 24,200 in Crawley and 13,500 in Horsham over the period to 2039.
The evidence suggests that the expansion of Gatwick Airport will support employment growth at the airport, and presumably within the wider economy. Based on the current evidence, Iceni do not consider that this will necessarily generate additional housing need over and above the standard method figures. This is particularly the case for Horsham. Crawley is the nearest major settlement to the airport, and the growth of over 9,000 direct jobs could have an upwards impact on housing need albeit that the evidence suggests that this could potentially be accommodated within the expected workforce growth within the Borough, depending on assumptions on commuting dynamics. This is an area in which further research and Duty to Cooperate discussions would be warranted and supports the treatment of Crawley’s local housing need figure as a minimum.
It seems likely that Crawley will not be able to meet its local housing need in full within its administrative boundaries. Discussions regarding how and where any unmet need is accommodated within neighbouring authorities will need to take place through the Duty to Cooperate. Development ‘at Crawley’ should take into account the conclusions of this report regarding the nature of the housing need in Crawley, including the need for different types and sizes of housing.

60
HOUSING MARKET DYNAMICS
In this section we have moved on to consider housing market dynamics. Our analysis considers
trends in housing costs (house prices and rents), how these vary across the area, and the affordability
of market housing. Statistical analysis is augmented through engagement with estate and letting
agents to understand market dynamics, and demand for different types of homes.
House Prices
The average (mean) house price across Northern West Sussex was around £420,000 in 2018 whilst
the median price was around £370,000. The lower quartile house price was just under £285,000.
The median house price in Crawley is 8% below the South East average. Median house prices in
Horsham are in contrast 12% above the South East average – influenced by the higher volume of
sales of larger homes and quality of life offer.
Table 26: Average and Lower Quartile House Prices in the Housing Market Area (Year to
September 2018)
Area Median Mean Lower Quartile
Crawley £295,000 £310,241 £249,995
Horsham £380,000 £424,828 £298,000
HMA £370,000 £419,038 £285,000
West Sussex £325,000 £368,477 £250,000
South East £348,333 £371,495 £255,000
England and Wales £320,000 £378,875 £240,000
Source: ONS, House price statistics for small areas in England and Wales, year ending June 2018
Figure 16 illustrates house price distribution across Northern West Sussex. To the north of the NWS
HMA boundary, prices gradually increase, demonstrating London’s influence on the residential
property market in the area. In comparison, the house prices in the HMA generally remain lower, with
small clusters of higher prices in some of Horsham’s rural parts such as Amberley, Dial Post, West
Chiltington and West Grinstead. Prices in Crawley and Horsham Town remain in the lower ranges,
between £100,000 up to £400,000.

61
Figure 16: Median House Price Heat- Map (2018)
Source: Land Registry Data (2018)
Overall House Prices
Figure 17 profiles the house price change across the HMA authorities, the region and nationally from
1998 to 2018. House price trends in the HMA have closely followed the country-wide trend over this
period albeit at a higher level.
Between 1998 and 2008, median prices in the HMA increased from £89,000 to £234,000 – an
increase of almost £145,000 (163%). This represented average house price growth of 8% per
annum. The median house price across the South East rose by £139,000 (172%) and across
England and Wales prices increased by £112,000 (173%). This period was characterised by macro-
economic stability and growth, historically low interest rates and of increasing availability of mortgage
finance supporting households’ ability to purchase homes.

62
Figure 17: Median House Price Trends, 1998-2018
Source: ONS, House price statistics for small areas in England and Wales, year ending June 2018
Reflecting the economic backdrop, trends in house prices since 2007 have understandably been
very different. Crawley experiences a significant fall in median prices from 2008 to 2009 (14%
decrease) as was the case nationally although at a slightly lower rate (6% decrease).
House price growth remained modest over the 2010-13 period, with levels of housing market activity
subdued. With improving economic performance, increased access to mortgage finance and
Government support (such as through the Help-to-Buy scheme) the market began to recover more
strongly from 2013 onwards.
Since 2013, there has been a steady increase in house prices nationally. However, both Crawley
and Horsham have seen relative rapid house price growth, with price increases notable above the
South East average. Since 2013 house prices have grown at 3% per annum in Crawley and 1% pa
in Horsham.
It needs to be borne in mind however that median house prices are influenced by the mix of properties
sold. It is therefore instructive to assess house prices by profile of sales across the Housing Market
Area.
Sales Trends
We have benchmarked sales performance against long-term trends to assess the relative demand
for market homes for sale. Figure 18 benchmarks annual sales over the period 1998-2018 against
£0
£50 000
£100 000
£150 000
£200 000
£250 000
£300 000
£350 000
£400 000
Crawley Horsham NWS HMA South East England West Sussex

63
the pre-recession average21 for both authorities and wider benchmarks. There is a relative similarity
in trends across areas, reflecting the influence of macro-economic factors.
Sales volumes nationally experienced a significant drop between 2008-9 influenced by the credit
crunch and subsequent housing market downturn. During 2009-2013 the recovery in sales volumes
was very modest with housing market activity over this period significantly subdued (around 40%
below the pre-recession trend). Between 2013 and 2016 there had been a gradual recovery in sales
volumes influenced by a combination of increasing availability and choice of mortgages together with
Government support through the Funding for Lending and Help-to-buy scheme, however since 2016
a decrease in sales can be witnessed. This is likely to reflect wider macro-economic uncertainty
associated with Brexit.
Figure 18: Indexed Analysis of Sales Trends, 1998-2018
Source: ONS, House price statistics for small areas, 2018
House Price by Type
We have examined sales data by type of property for year ending September 2018. As it can be
seen in Figure 19, there is some variance in the median house prices across the Northern West
Sussex HMA. House prices for all types of properties in Horsham District are significantly higher than
Crawley (and the wider HMA and County averages). The price differential is greatest for detached
properties; and lowest for flats.
21 The average annual sales over the pre-recession decade (1998-2008)
0
0,2
0,4
0,6
0,8
1
1,2
1,4
Crawley Horsham HMA West Sussex South East England

64
Figure 19: Median House Prices by Type, 2018
Source: ONS, House price statistics for small areas, 2018
Comparing median prices in Crawley to the South East average suggests greater relative demand
for semi-detached and terraced stock where prices are around 5% above the regional average. In
contrast, detached prices are around 5% below the regional average. In Horsham, prices for all types
of properties are above the South East average, with the strongest premium being for terraced (14%)
and semi-detached stock (12%) in proportional terms (and detached housing in absolute terms).
Analysing the profile of sales, Figure 20 shows that there were considerably more detached house
sales in Horsham (35% of total sales) which influence the higher average house price. Horsham
demonstrates notably higher proportions of sales for both detached and semi-detached properties
(62% of total), while Crawley shows higher proportions of sales of (typically cheaper) terraced and
flatted sales (65% of total).
Detached Semi-detached Terraced Flat
Crawley £468 000 £345 000 £290 000 £215 000
Horsham £533 750 £375 000 £317 000 £226 250
HMA £518 917 £365 000 £306 367 £226 083
West Sussex £485 000 £336 995 £292 500 £209 950
South East £491 500 £334 000 £277 000 £213 075
England £339 995 £212 995 £187 000 £215 000
£0
£100 000
£200 000
£300 000
£400 000
£500 000
£600 000
Crawley Horsham HMA West Sussex South East England

65
Figure 20: Sales by Dwelling Type (2018)
Source: ONS, House Price statistics for small areas, 2018
House Prices for Horsham Sub-Areas
Sub-area analysis of house prices in Horsham has been undertaken considering prices in Horsham
and Broadbridge Heath; and in the rural parts of the District. For this analysis, MSOA level has been
utilised to provide the necessary spatial boundaries.
As it can be seen from Figure 21 below, the house prices in Horsham Rural areas have been
traditionally higher than Horsham Town across the past 20 years. A largely similar trend can be
traced over the years for the two sub-areas, showing a slight decrease in house prices in the period
during the recession.
Between 1998 and 2008, average house price growth in Horsham Rural per annum was 10%, whilst
in Horsham Town it was 11%. Following the recession, the house price drop for Horsham Rural was
more substantial at 22% compared to decreases in house prices in Horsham Town which reached
11%. Since 2009, the average house price growth per annum for Horsham Rural was 5% while in
Horsham Town it was 6%. The evidence does not point towards a particular distinction in price trends.
15%
35%29% 29% 27% 25%
19%
27%
25% 25% 26% 29%
41%
21%25% 24% 25% 28%
25%18% 21% 22% 22% 18%
0%
10%
20%
30%
40%
50%
60%
70%
80%
90%
100%
Crawley Horsham HMA West Sussex South East England andWales
Detached Semi-detached Terraced Flat
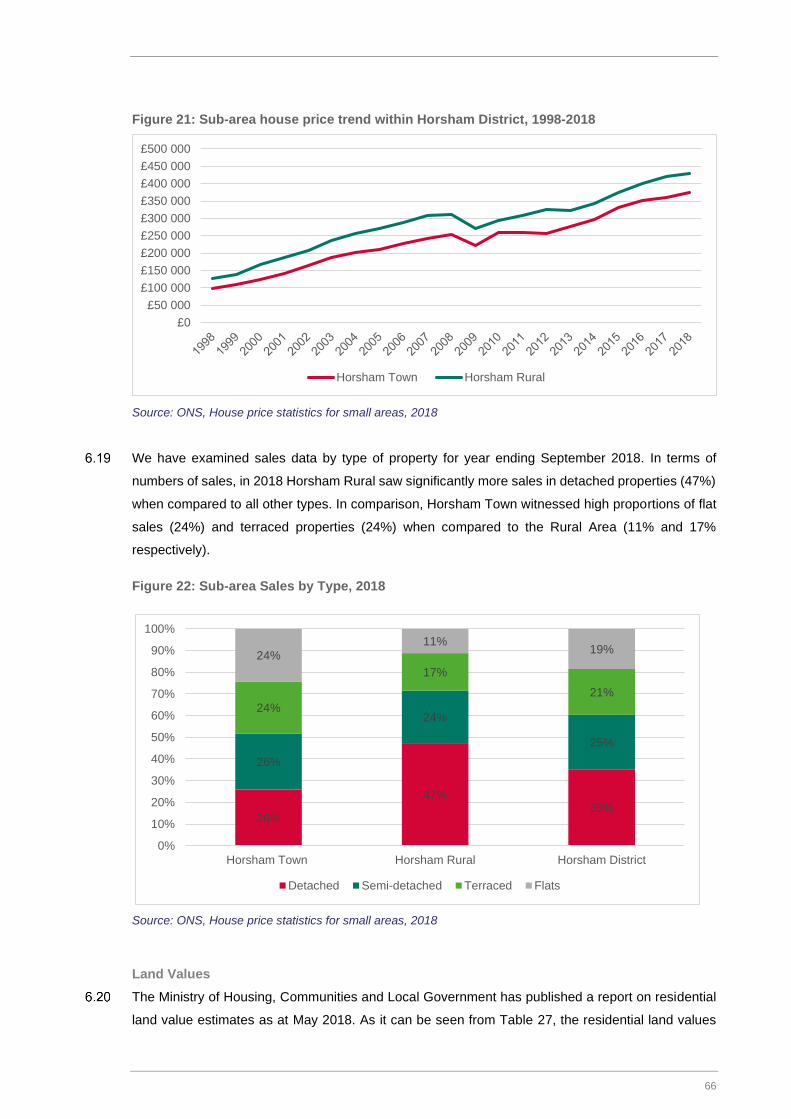
66
Figure 21: Sub-area house price trend within Horsham District, 1998-2018
Source: ONS, House price statistics for small areas, 2018
We have examined sales data by type of property for year ending September 2018. In terms of
numbers of sales, in 2018 Horsham Rural saw significantly more sales in detached properties (47%)
when compared to all other types. In comparison, Horsham Town witnessed high proportions of flat
sales (24%) and terraced properties (24%) when compared to the Rural Area (11% and 17%
respectively).
Figure 22: Sub-area Sales by Type, 2018
Source: ONS, House price statistics for small areas, 2018
Land Values
The Ministry of Housing, Communities and Local Government has published a report on residential
land value estimates as at May 2018. As it can be seen from Table 27, the residential land values
£0
£50 000
£100 000
£150 000
£200 000
£250 000
£300 000
£350 000
£400 000
£450 000
£500 000
Horsham Town Horsham Rural
26%
47%35%
26%
24%
25%
24%
17%
21%
24%
11%19%
0%
10%
20%
30%
40%
50%
60%
70%
80%
90%
100%
Horsham Town Horsham Rural Horsham District
Detached Semi-detached Terraced Flats

67
across the authorities in the HMA are reasonably consistent, with Crawley demonstrating slightly
lower residential land values. This is likely to be influenced by sales prices. As set out in Footnote 26
below, these do not represent a market value for land as they take no account of contamination,
abnormal costs, affordable housing provision or other planning obligations or the skewing effect of
land with a current existing use (i.e. occupied brownfield) which has a much greater value than
agricultural land (greenfield). They should thus be considered indicative figures for the purposes of
assessing differentials by area. In Crawley Borough, the high proportion of the land supply which
constitutes brownfield land will likely result in a lower relative land values to those shown.
Table 27: Residential Land Values per hectare, May 2017
Area Land Value22
Crawley £4,810,000
Horsham £5,320,000
HMA* £5,088,333
South East (excl. London) £4,953,358
England £6,220,086
Source: MHCLG, May 2018; * as an average of Crawley, Horsham and Mid Sussex) – based on data
availability that is the best fit to the HMA.
Rental Trends
Median rental costs are relatively similar across Northern West Sussex, averaging £973 per calendar
month. This is above county and regional averages. The highest rents are seen in Horsham, which
are 7% above the South East average.
Table 28: Median Rents, October 2017 to September 2018
Area Median Average Rent (p.c.m.)
Crawley £975
Horsham £995
NWS HMA £973
West Sussex £875
South East £929
England £690
Source: VOA Private Rental Data Table 2.7
22 The residual residential values in this publication are based on a hypothetical 1 ha site with planning permission. No major
allowances are made for s.106/ s.278 costs nor for contamination or abnormal costs. Nor is any allowance made for affordable
housing. The MHCLG analysis thus gives a residential use value rather than a market value. In reality the market value of
land should reflect the cost of affordable housing provision, other s.106 costs and contamination/site abnormals as well as
the skewing effect of land with a current existing use (i.e. occupied brownfield) having a much greater value than agricultural
land (greenfield).

68
An analysis of median rents by number of bedrooms (see Figure 23) indicates that the authorities
within the HMA show higher rents by size of dwelling when compared to the county, region and
nationally. Rental costs in Crawley for smaller properties (up to 2-beds) are higher than the HMA
average and those in Horsham. Horsham sees higher comparative rents for 3- and 4-bed properties.
Figure 23: Rental Costs by Property Size, October 2017 to September 2018
Source: VOA Private Rental Data
More specifically, in Crawley the median rental prices were overall higher in terms of studios, one
and two-bedroom properties, however Horsham demonstrated higher median monthly rents for
three- and four-bedroom properties.
Table 29: Median monthly rents per property size for Crawley and Horsham, October 2017 to
September 2018
Room Studio 1 bed 2 bed 3 bed 4 bed
Crawley £550 £660 £825 £995 £1,200 £1,475
Horsham £500 £600 £750 £950 £1,250 £1,700
Source: VOA Private rental data
Figure 24 shows the trend in the rental costs recorded by the VOA. The figure demonstrates the
increase in rents in Crawley and Horsham relative to wider comparators. An increase in median
monthly rents between 2011 and 2017 in Horsham of 25% was shown, while in Crawley the increase
was 23%, both slightly higher than the HMA average of 22%. This represents a lower increase than
the regional growth (28%), but higher than England (20%).
£0
£200
£400
£600
£800
£1 000
£1 200
£1 400
£1 600
£1 800
Room Studio 1 bed 2 bed 3 bed 4 bed
Crawley Hosham HMA West Sussex South East England

69
Figure 21: Increase in Private Rents, 2011 to 2017
Source: VOA Private Rental Data
In Crawley, one-bedroom properties saw the highest median monthly rent increase between 2011
and 2017 (27%). In comparison, the highest monthly rental increase by size of property in Horsham
was in three-bedroom properties (28%). It is notable that rental growth for 4+ bed properties in both
authorities has been notably more modest than for other sizes of homes.
Table 30: Rental increase by size of dwelling between 2011 and 2017 in Horsham and Crawley
Room Studio 1 bed 2 bed 3 bed 4 bed
Crawley 33% 20% 27% 21% 26% 6%
Horsham 43% 20% 21% 27% 28% 8%
Source: VOA Private Rental Data
Housing Affordability
We have considered evidence relating to the affordability of market housing by looking specifically
at the relationship between lower quartile and median house prices and incomes.
Figure 25 shows that workplace affordability has worsened since 2013 in the NWS HMA authorities
and Horsham in particular. Overall, this follows the national and regional trends post 2009, albeit at
a higher level.
0,9
0,95
1
1,05
1,1
1,15
1,2
1,25
1,3
1,35
2011 2012 2013 2014 2015 2016 2017
Index (
1 =
2011 r
ents
)
Crawley Hosham HMA West Sussex South East England

70
Figure 25: Workplace-based Median Affordability Ratio, 2002-2017
Source: ONS, Ratio of house price to workplace-based earnings (lower quartile and median) 2002-2017
Table 31 presents the most recent median and lower quartile workplace-based affordability ratios. In
2018 the median house price was a significant 9.1 times median earnings in Crawley and a
substantial 13.9 times median earnings in Horsham.
Lower quartile house prices in Horsham were 14.4 times earnings; compared to 10.7 times earnings
in Crawley and a ratio of 10.8 across the South East. This points to significant barriers for households
in both authorities in being able to afford to own a home.
Table 31: Affordability Ratio 2018 (Workplace Based)
Area Lower Quartile Ratio Median ratio Difference
Crawley 10.70 9.11 1.59
Horsham 14.35 13.86 0.49
NWS HMA 12.70 11.99 0.71
West Sussex 12.19 11.38 0.81
South East 10.81 10.38 0.43
England 7.29 8.0 -0.71
Source: ONS, 2019
Engagement with Estate and Letting Agents
Iceni has engaged with a range of estate agents within Horsham and Crawley in June 2019, who are
involved in marketing properties in both sales and lettings. The strength of the market in both sales
and lettings is underpinned by:
• Proximity to Central London (maximum 1-hour commute via public transport);
0,00
2,00
4,00
6,00
8,00
10,00
12,00
14,00
16,00
Crawley Horsham Mid Sussex NWS HMA
West Sussex South East England

71
• Employment opportunities (specifically the employment opportunities at Gatwick Airport and the
surrounding industrial areas such as Manor Royal which is one of the largest concentrations of
employment in the South East region);
• Good range of facilities, including schools; and
• Feeling ‘part of the country’, including more green space and open countryside.
The assessment and analysis of market conditions represent the position at the time of the
assessment in June 2019.
Sales
Horsham Town
Within Horsham Town, agents described the sales market as being “pretty buoyant” and “generally
active” with the number of sales years on year being similar for the last three years. One agent stated
that there is a gap between supply and demand within Horsham Town, with another agent stating
they have been very busy for viewings, but their sales volumes have remained similar.
The profile of buyers within Horsham Town is varied, however their strongest demand is from buyers
under the age of 30 years, usually young professionals and young couples looking to start families
and seeking family housing typically with a garden and off-road parking. The greatest demand in
Horsham Town for sales is for “cheap housing rather than flats” with values up to £300,000; however,
the expectation of owners is for houses to be in the excess of £300,000 so any below this value, tend
to be sold very quickly. Based on the profile of buyers, the greatest demand overall is for 3 / 4-
bedroom family housing.
Within Horsham Town, agents describe a relatively low percentage of first-time buyers, with a higher
demand for people wanting to up-size locally. Other agents within Horsham Town suggested that
there is a high demand for help-to-buy schemes, however the current housing stock still tends to be
more expensive for buyers even with this incentive, with one agent mentioning 2-bedroom flats
available with help-to-buy for £320,000. One agent commented that this could be down to the lack
of supply for “cheaper” houses in the area, against demand.
Agents discussed that within Horsham Town, there is on average a mix of buyers (50/50 split) moving
into the area against moving locally, with the 50% moving into Horsham Town coming from south
London Boroughs including Croydon, Surrey, and other areas in South East England. One agent
described that there is a fairly equal demand from local workers and those that rely on public transport
for their commute, but other agents suggested Horsham Town is “mostly commuters” due to the good
one-hour connection to London.
On average, values within Horsham Town are currently around £380-£420 per sq.ft. Agents
highlighted that values at the time of writing are “pretty static” at the moment for all sales within
Horsham Town. One agent described that the cycle of homes (usually every 7-8 years) means that
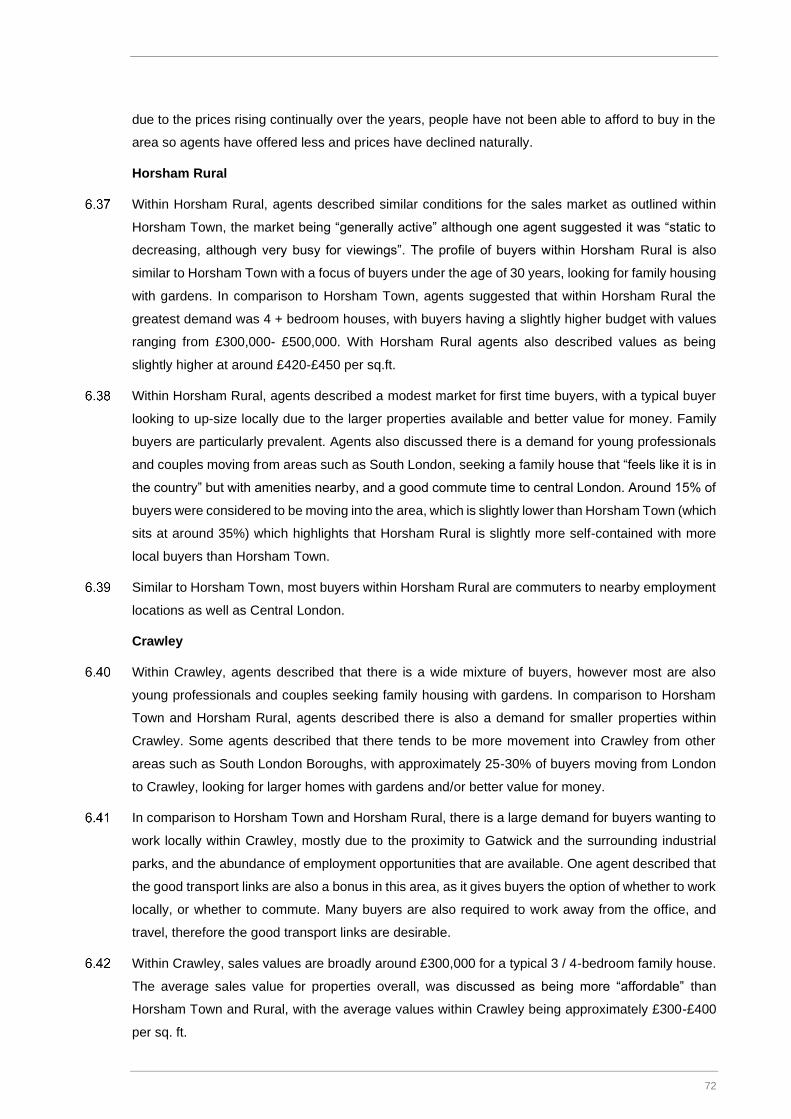
72
due to the prices rising continually over the years, people have not been able to afford to buy in the
area so agents have offered less and prices have declined naturally.
Horsham Rural
Within Horsham Rural, agents described similar conditions for the sales market as outlined within
Horsham Town, the market being “generally active” although one agent suggested it was “static to
decreasing, although very busy for viewings”. The profile of buyers within Horsham Rural is also
similar to Horsham Town with a focus of buyers under the age of 30 years, looking for family housing
with gardens. In comparison to Horsham Town, agents suggested that within Horsham Rural the
greatest demand was 4 + bedroom houses, with buyers having a slightly higher budget with values
ranging from £300,000- £500,000. With Horsham Rural agents also described values as being
slightly higher at around £420-£450 per sq.ft.
Within Horsham Rural, agents described a modest market for first time buyers, with a typical buyer
looking to up-size locally due to the larger properties available and better value for money. Family
buyers are particularly prevalent. Agents also discussed there is a demand for young professionals
and couples moving from areas such as South London, seeking a family house that “feels like it is in
the country” but with amenities nearby, and a good commute time to central London. Around 15% of
buyers were considered to be moving into the area, which is slightly lower than Horsham Town (which
sits at around 35%) which highlights that Horsham Rural is slightly more self-contained with more
local buyers than Horsham Town.
Similar to Horsham Town, most buyers within Horsham Rural are commuters to nearby employment
locations as well as Central London.
Crawley
Within Crawley, agents described that there is a wide mixture of buyers, however most are also
young professionals and couples seeking family housing with gardens. In comparison to Horsham
Town and Horsham Rural, agents described there is also a demand for smaller properties within
Crawley. Some agents described that there tends to be more movement into Crawley from other
areas such as South London Boroughs, with approximately 25-30% of buyers moving from London
to Crawley, looking for larger homes with gardens and/or better value for money.
In comparison to Horsham Town and Horsham Rural, there is a large demand for buyers wanting to
work locally within Crawley, mostly due to the proximity to Gatwick and the surrounding industrial
parks, and the abundance of employment opportunities that are available. One agent described that
the good transport links are also a bonus in this area, as it gives buyers the option of whether to work
locally, or whether to commute. Many buyers are also required to work away from the office, and
travel, therefore the good transport links are desirable.
Within Crawley, sales values are broadly around £300,000 for a typical 3 / 4-bedroom family house.
The average sales value for properties overall, was discussed as being more “affordable” than
Horsham Town and Rural, with the average values within Crawley being approximately £300-£400
per sq. ft.

73
In comparison, within Crawley, agents discussed on average, around 50% of buyers are first time
buyers which is higher than both Horsham Town and Rural, with the remainder of buyers mostly up-
sizing.
North Western Sussex HMA
Across the North Western Sussex HMA, agents describe that they do not see a large demand for
housing for older persons housing or custom-build development. Agents occasionally see a demand
for buyers wanting to build their own homes, however this depended on an agent by agent basis and
the available plots on sale. Many agents described that they rarely sell plots of land.
All agents across the North West Sussex HMA stated that Brexit and market uncertainty were the
main factors impacting on house values in both Horsham and Crawley, and the reason for the market
currently being relatively static.
Lettings
Horsham Town
Within Horsham Town agents describe the lettings market as being busier than sales recently,
however there was a variance with some agents seeing good supply and demand, with other agents
describing limited stock. An agent within Horsham Town discussed that within lettings there had been
an improved start to the year, however they have recently (at the time of writing) seen a downward
turn in the last 8 weeks, with the market leading to low end properties with 1 / 2 bedrooms rather
than the demand for family housing like they usually experience.
Similar to sales in Horsham Town, agents describe the profile of buyers as being very varied, but
with a larger proportion of young professionals / young families and young couples all under the age
of 35 years. Generally, within Horsham Town, 2 – 3-bedroom houses or large flats are in greatest
demand however there is also a demand for 1-bedroom properties for single professionals, and 4-5
bedroom houses for larger families predominately in school catchment areas, therefore reflecting the
varied market for lettings within Horsham Town. Some agents discussed the increase in demand for
1- and 2-bedroom properties recently, although are unsure whether this trend will continue.
Within Horsham Town, agents describe that a majority of rental demand is from people moving
locally (on average approximately 75%), with the remaining 25% being tenants moving into the area
from south London Boroughs, Surrey and Croydon. Agents described that within Horsham Town, a
majority of tenants work locally with a small percentage working in London (although working from
home at least once a week too).
Within Horsham Town, the average length of tenancy tended to be between 12-16 months with some
tenants requesting a break clause in the event they are able to buy a property and wanting to get
onto the property ladder.
With regards to build-to-rent, some agents had experience of build-to-rents stating “the demand is
definitely there” within Horsham Town, however they also suggested this is relatively new concept
and is still evolving within the market. One agent within Horsham Town made reference to one build-
74
to-rent development where all 12 units were let within 4 weeks of completion and another agent
made reference to a 10 unit build-to-rent development which were also let within weeks of
completion, clearly showing the demand in the area for this type of development.
Within Horsham Town, on average, agents described average rents as being the following;
• 1 bedroom - £800pcm;
• 2 bedroom - £900-£950pcm; and
• 3 bedroom- £1,000pcm - £1,500pcm.
Horsham Rural
Similar to Horsham Town, there is a strong demand for lettings in Horsham Rural, with more demand
for lettings than sales in the area.
In comparison to Horsham Town, within Horsham Rural there is a greater demand for families who
are looking for 4 / 5-bedroom properties, however these tend to be of a slightly older demographic
(approximately 40 years old plus). Due to the demand for larger properties, rental values are higher
than Horsham Town, as buyers tend to demand more space than buyers looking for properties in
Horsham Town. Other agents also discussed the demand for 2 / 3-bedroom houses for young
couples and families looking for an affordable family house. On average, tenancies within Horsham
Rural are on average around 18 months minimum, which is slightly longer than Horsham Town.
Similar to Horsham Town, most buyers work locally, however some also wish to commute to work in
Central London and move to the area due to the good transport links and the opportunity to be able
to commute if needed to.
In comparison to Horsham Town, according to agents, there is no experience with build-to-rent
developments in Horsham Rural.
Crawley
Within Crawley, the profile of tenants is also varied, from single professionals looking for 1 bed flats,
up to families looking for 3 / 4-bedroom properties. Agents did discuss that on average, the greatest
demand is for the smaller houses of around 2 / 3 bedrooms for young families, professionals and
couples. Overall, agents described Crawley as more desirable for tenants as it is perceived to be
more affordable than Horsham Town and Rural and also offers better value for money. In addition to
it being considered “better value for money”, Crawley was also considered more desirable for renters
due to its accessibility and easy commute to central London, he variety of smaller housing available,
and the employment opportunities available locally.
Within Crawley, agents described that there is more demand from people moving into the area from
south London Boroughs and Surrey in comparison to Horsham Town and Rural. Agents discussed
that there is still demand for tenants moving locally including those moving from Horsham to Crawley,
and from tenants that already live within Crawley looking for new properties.

75
In comparison to Horsham Town and Rural, agents described that nearly all tenants work locally with
very few travelling to Central London due to the employment opportunities at Gatwick Airport and
surrounding Industrial Parks. Agents also described that they did not have any direct experience with
build-to-rent developments, however stated that this area of the market is still evolving.
Housing Market Dynamics: Key Points and Implications
The sales market in Horsham and Crawley is relatively active although remains similar to previous years. There is a wide portfolio of buyers however nearly all tend to be under the age of 30 years, therefore young professionals, couples or families looking to up-size from their flats to 3 / 4-bedroom, detached houses with gardens and off-road parking. The main influences for buying within Horsham and Crawley are the employment opportunities located both at Gatwick Airport and the Industrial Parks surrounding which has led to a majority of buyers working locally, together with accessibility to employment opportunities in London. Many buyers have moved out from South London Boroughs, to get more for their money, with a “countryside feel” but close to facilities and amenities. The profile of demand is on “cheaper housing rather than flats” with values up to £300,000, however the expectation of owners is for properties to be in the excess of £300,000 so any below this value, tend to be sold very quickly.
The lettings market in Horsham and Crawley is busier than sales recently with varied profile of tenants although a large proportion of tenants are under the age of 35 years looking to up-size locally. Overall there is a large variety of demand for all sizes of properties however there is a slightly higher demand for 2 / 3-bedroom properties that are suitable for young families with one child. Within Horsham, tenancies are on average between 12-16 months, with a variety of tenancies within Crawley from short term lets to up to 18 months. Overall, rent values average at £800 pcm for 1-bedroom properties, £800-950 pcm for 2-bedroom properties, and around £1,000-£1,050 pcm for 3-bedroom properties.
Both the sales and lettings market have been impacted by Brexit and market uncertainty, with agents suggesting this has affected prices in the area which are now relatively stagnant and have remained unchanged over the last year.

76
AFFORDABLE HOUSING NEED
This section provides an analysis of the need for affordable housing in Horsham and Crawley. It
takes account of the amended definition of affordable housing in Annex 2 of the National Planning
Policy Framework (NPPF).
The NPPF defines affordable housing, as “housing for sale or rent, for those whose needs are not
met by the market (including housing that provides a subsidised route into home ownership and/or
is for essential local workers)” and then goes on to set out that this includes affordable housing for
rent; starter homes; discounted market sale housing; and other affordable routes into home
ownership.
There are thus a range of different affordable housing products. Social rented housing is housing
owned or managed by Registered Providers or the Councils where the rent is set in accordance with
Government ‘target rents’ which are generally lower than for other affordable housing products.
Affordable rented housing is similar but subject to rent controls which require the rent to be no more
than 80% of the local market rent (inclusive of service charges). With shared ownership homes, a
household can buy a share of the property (typically from 25% to 75%) often with a mortgage and
pays a subsidised rent on the remaining share. For Help-to-Buy Shared Equity properties, a 20%
equity loan is provided (interest free for the first five years) to help households onto the housing
market. Intermediate rented homes are rented at 80% of the market rate. Discounted market sale
housing is priced at a discount to the open market value of a property, with provisions that it must be
sold on a similar basis.
In this report we have assess affordable housing need using the methodology set out by Government
in Planning Practice Guidance (PPG). This is however largely the same as the method in the previous
PPG and does not really address those households who require support to become homeowners.
We therefore additionally consider the needs of households who might be able to rent without
financial support but who aspire to own a home and require support to do so.
Our assessment looks at need in the 20-year period from 2019 to 2039, to be consistent with other
analysis developed in the report.
Local Prices and Rents
An important part of the affordable needs modelling is to establish the entry-level costs of housing to
buy and rent. The affordable housing needs assessment compares prices and rents with the incomes
of households to establish what proportion of households can meet their needs in the market, and
what proportion require support and are thus defined as having an ‘affordable housing need’. The
information about local housing costs is also relevant for analysis of the different tenures of affordable
housing needed.

77
Analysis below considers the entry-level costs of housing to both buy and rent. The approach has
been to analyse Land Registry and Valuation Office Agency (VOA) data to establish lower quartile
prices and rents – using a lower quartile figure is consistent with the PPG and reflects the entry-level
point into the market.
Data from the Land Registry for the year to September 2018 (i.e. Q4 of 2017 and Q1-Q3 of 2018)
shows estimated lower quartile property prices by dwelling type. The data shows that entry-level
prices are generally slightly lower in Crawley than Horsham, and within Horsham there are not
substantial differences in pricing between urban and rural areas.
Table 32: Lower quartile cost of housing to buy – year to September 2018
Horsham urban Horsham rural Horsham Crawley
Flat/maisonette £194,000 £171,000 £184,000 £178,000
Terraced £290,000 £279,000 £286,000 £264,000
Semi-detached £335,000 £330,000 £334,000 £315,000
Detached £450,000 £450,000 £450,000 £410,000
All dwellings £286,000 £307,000 £295,000 £240,000
Source: Land Registry
It is arguably more useful to consider the lower quartile prices by size of accommodation (number of
bedrooms) and the table below shows an estimate of this. The information has been drawn from
internet sources (such as Rightmove) and then constrained to be consistent with the figures shown
from the Land Registry source. No urban/rural split has been provided although given the similarity
of pricing in the different areas it is likely that the estimates below are fairly representative of the
different parts of Horsham District.
Table 33: Lower Quartile to buy by size, year to September 2018
Horsham Crawley
1-bedroom £142,000 £142,000
2-bedrooms £227,000 £216,000
3-bedrooms £321,000 £284,000
4-bedrooms £449,000 £372,000
All properties £295,000 £240,000
Source: Valuation Office Agency
A similar analysis has been carried out for private rents using Valuation Office Agency (VOA) data –
this again covers a 12-month period to September 2018. The analysis shows an average lower
quartile cost (across all dwelling sizes) of £825 per month in both local authorities. Additional analysis
was carried out to consider urban/rural differences, but from the volume of data available it was
difficult to find any significant difference in pricing in different locations.

78
Table 34: Lower Quartile Market Rents, year to September 2018
Horsham Crawley
Room only £500 £500
Studio £550 £625
1-bedroom £695 £780
2-bedrooms £850 £950
3-bedrooms £1,100 £1,100
4-bedrooms £1,475 £1,400
All properties £825 £825
Source: Valuation Office Agency
Income Levels
Following on from the assessment of local prices and rents it is important to understand local income
levels as these (along with the price/rent data) will influence the ability of a household to afford to
buy or rent housing in the market without the need for some sort of subsidy. Data about total
household income has been based on ONS modelled income estimates, with additional data from
the English Housing Survey (EHS) being used to provide information about the distribution of
incomes.
We have used these data sources to construct an income distribution for the two local authorities
and Horsham sub-areas for 2018. The table below shows average (mean) incomes and also the
median and lower quartile estimates for the two local authorities. The analysis shows higher
household incomes in Horsham than Crawley and that there is limited difference between the two
Horsham sub-areas.
Table 35: Estimated average (mean) household income by local authority and sub-area (mid-
2018 estimate)
Mean Median Lower quartile
Horsham urban £58,300 - -
Horsham rural £56,500 - -
Horsham £57,400 £43,700 £25,300
Crawley £49,300 £37,500 £21,700
Source: Derived from EHS and ONS data
Affordability
A household is considered able to afford market rented housing in cases where the rent payable
would constitute no more than a particular percentage of gross income. The choice of an appropriate
threshold is an important aspect of the analysis. CLG 2007 SHMA Practice Guidance suggested that
25% of income is a reasonable start point but also noted that a different figure could be used. Analysis
of current letting practice suggests that letting agents typically work on a multiple of 40%.
Government policy (through Housing Benefit payment thresholds) would also suggest a figure of
40%+ (depending on household characteristics).

79
The threshold of income to be spent on housing should be set by asking the question ‘what level of
income is expected to be required for a household to be able to access market housing without the
need for a subsidy (e.g. through Housing Benefit)?’ The choice of an appropriate threshold is
judgement based and we consider should be assessed having regard in particular to the cost of
housing rather than income. Income levels are only relevant in determining the number (or
proportion) of households who fail to meet the threshold. It would be feasible to find an area with
very low incomes and therefore conclude that no households can afford housing, alternatively an
area with very high incomes might show the opposite output. The key here is that local income levels
are not setting the threshold but are simply being used to assess how many can or can’t afford market
housing.
At £825 per calendar month, lower quartile rent levels in Horsham and Crawley are relatively high in
comparison to those seen nationally (a lower quartile rent of £525 per month across England). This
would suggest that a proportion of income to be spent on housing could be higher than the bottom
end of the range.
Across England, the lowest lower quartile rents are around £400 per month, and if these areas are
considered to be at the bottom end of the range (i.e. 25% of income to be spent on housing) then
this would leave a residual income of £1,200 per month. With the same residual income applied to
Horsham/Crawley, the income required to afford an £825 rent would be £2,025 and so the
percentage spent on housing would be 41%.
However, it needs to be considered that the cost of living in Horsham and Crawley is likely to be
higher than in some other parts of England and so a pragmatic approach to determining a reasonable
proportion of income has been to take a midpoint between the bottom (25%) and the equivalent
residual income figure (41%). It has therefore been estimated that a threshold of between 30% and
35% would be appropriate – for modelling purposes a figure of 32.5% has been used.
On the basis of a rent of £825 per month, this would leave a residual income of £1,700 and a total
household income of £30,500 per annum. Therefore, for the purposes of this assessment it is
estimated that any household with an income below £30,500 would not be able to afford a lower
quartile rent without some degree of subsidy. The use of 32.5% is considered to be a reasonable
position to take given the range of evidence available.
Generally, the income required to access owner-occupied housing is higher than that required to rent
and so the analysis to follow is based solely on the ability to afford to access private rented housing.
However, the local house prices are important when looking at the extended definition of affordable
housing in NPPF and are returned to when looking at this new definition.
Need for Rented Affordable Housing
The method for studying the need for affordable housing has been enshrined in Strategic Housing
Market Assessment (SHMA) guidance for many years, with an established approach to look at the

80
number of households who are unable to afford market housing (to either rent or buy). The analysis
below follows the methodology and key data sources in guidance and can be summarised as follows:
• Current need (an estimate of the number of households who have a need now and based on a
range of data modelled from local information);
• Projected newly forming households in need (based on projections developed for this project
along with an affordability test to estimate numbers unable to afford the market);
• Existing households falling into need (based on studying the types of households who have
needed to access social/affordable rented housing and based on study past lettings data);
• These three bullet points added together provide an indication of the gross need (the current
need is divided by 20 so as to meet the need over the 2019-39 period);
• Supply of affordable housing (an estimate of the likely number of letting that will become available
from the existing social housing stock – drawing on data from CoRe23 ); and
• Subtracting the supply from the gross need provides an estimate of the overall (annual) need for
affordable housing.
Table 36: Summary of analytical stages in assessing affordable housing need
Analytical stage Description Method
1 – Current need An estimate of the
number of
households who
have an affordable
need now
Based on the categories of need set out in 2a-020 of
the PPG and based on a range of data sources. For
some analysis (e.g. overcrowding) Census data is
used to provide a baseline which is then updated
with reference to national changes informed by the
English Housing survey (EHS). An affordability test
is applied based on income and housing costs data.
2 – Newly forming
households
An annual estimate
of the number of
new households
forming with a
need for affordable
housing
The number of new households forming is based on
outputs from the demographic projections, looking at
younger households (aged under 45) forming for the
first time. An affordability test is applied, again based
on income and housing costs data. Analysis based
on 2a-021 of the PPG.
3 – Existing
households falling
into need
An annual estimate
of the number of
existing
households who
will have a need in
the future
Based on analysis of data on social housing lettings
where accommodation has been provided to a
household previously living in their own
accommodation (whether rented or owned). No
methodology for this stage is provided in the PPG
23 The continuous recording of lettings and sales in social housing in England (referred to as CoRe) is a national information source that records information on the characteristics of both private registered providers and local authority new social housing tenants and the homes they rent

81
and so the method used links to older SHMA
guidance
4 – Supply of
affordable housing
Annual estimate of
the supply of relets
from the existing
stock
Based on trend data for the past 3-years, the
estimate looks at the number of lettings before
netting off the number of lettings in new homes and
the number or transfers. This is to ensure that the
number reflects the supply available from the
existing stock. Based on 2a-022 of the PPG.
The table below shows the overall calculation of affordable housing need. This excludes supply
arising from sites with planning consent (the ‘development pipeline’). The analysis shows that there
is a need for 344 rented affordable homes per annum to be provided in Horsham, along with a need
for 563 rented affordable homes per annum in Crawley. The net need is calculated as follows:
Net Need = Current Need + Need from Newly-Forming Households + Existing Households
falling into Need – Supply of Affordable Housing
Table 37: Estimated Need for Rented Affordable Housing
Horsham Crawley
Per annum 2019-39 Per annum 2019-39
Current need 42 834 78 1,552
Newly forming households 415 8,298 550 11,005
Existing households falling into need 151 3,012 266 5,318
Total Gross Need 607 12,144 894 17,874
Re-let Supply 263 5,266 331 6,623
Net Need 344 6,878 563 11,251
Source: Census (2011)/CoRe/Projection Modelling and affordability analysis
The analysis shows a need for 344 rented affordable homes per annum in Horsham, and 563 rented
affordable homes per annum in Crawley.
Comparison with 2014 Assessment
The last full assessment of affordable housing need can be found in an October 2014 report by
Chilmark Consulting. It is worth briefly comparing key assumptions and outputs from the two studies.
Overall, the general structure used in this report and by Chilmark is the same, that is to establish a
current need, project future needs and then net off the supply of affordable housing.
The main difference between the Chilmark Report and this Study appears to be the use of data from
the Housing Register to estimate current need (by Chilmark), whereas this report has drawn on a
range of secondary data sources. A key reason for the approach in this report is to ensure a
consistency of approach across areas. Whilst Registers are a valuable source, they can vary in
different locations depending on how needs are assessed (e.g. the criteria used to determine which
households have a need (generally known as being in a reasonable preference category (RPC)).

82
The Chilmark report sets out a ‘high’ and a ‘low’ estimate of current need based on a) the whole
Housing Register and b) only looking at those in an RPC. Generally, the levels of current need shown
in this report are slightly higher than suggested by Chilmark – although differences are not
substantial.
Another difference is that the Chilmark Report made two sets of assumptions around newly forming
households. The first linked to overall household growth, whereas the second used a 16-44 (age
group) cohort approach. The latter method appears to be very similar to that used in this report,
although it should be noted that they do link to a different set of household projections (linking to the
2014-based SNHP in the case of this report).
A final difference between the assessments is regarding assumptions on affordability thresholds.
This report has set out that the higher rent levels mean that a higher threshold (than a start point of
25%) could be used – the Chilmark report used a 25% threshold. The different assumptions would
be expected to see a lower level of need being shown in this report (although differences would not
be expected to be substantial).
The table below compares the annual needs estimates in each of the Chilmark 2014 Report and this
assessment. The Chilmark 2014 figures are based on a range which reflects the use of high and low
Housing Register data. Overall, the analysis suggests a similar level of affordable need in both
assessments (just below the bottom end of the Chilmark range in Horsham and just above for
Crawley). Both studies clearly demonstrate a substantial need for additional affordable housing and
both Councils should seek to maximise delivery where opportunities arise.
Table 38: Comparison of Affordable Housing Needs Assessments, 2014 and 2019
Horsham Crawley
Chilmark (2014) 382-404 456-527
Iceni (2019) 344 563
Source: Chilmark data from Table 13 of 2014 report
How Much Should Rented Affordable Housing Cost?
The analysis above has studied the overall need for affordable housing using a well-established
model. This model focusses on households who cannot afford to rent in the market. These
households are therefore most likely to have a need for rented housing and below is an analysis that
sets out what might be an ‘affordable’ rent for different sizes of accommodation (in different locations)
based on local incomes and housing costs.
The analysis essentially considers what might be a ‘Living Rent’. These calculations are based on
research by JRF/Savills24 and use the following methodology:
24 http://pdf.savills.com/documents/Living%20Rents%20Final%20Report%20June%202015%20-%20with%20links%20-%2019%2006%202015.pdf

83
• Annual Survey of Hours and Earnings (ASHE) lower quartile earnings;
• Adjustment for property size by recognised equivalence model;
• Starting rent set at 28% of net earnings; and
• Rent set at Local Housing Allowance (LHA) limits where calculations show a higher figure.
The analysis shows rents starting at about £330 for a 1-bedroom home (in Crawley) and rising to
£600 for homes with 3-bedrooms in Horsham (the Living Rent method only goes up to 3-bedrooms).
It is notable that all of the Living Rent levels shown are below the maximum level of LHA available
by size of property (see second table below).
As a general rule it is not considered sensible to be charging a rent in excess of LHA, as this would
mean many households having to top up their rent from other income sources. In setting rents, the
local authorities could therefore consider that the affordable level is in the range from a Living Rent
up to the maximum LHA level. It should be noted that the majority of the study area (in population
terms) is within the Crawley & Reigate Broad Rental Market Area (BRMA).
Table 39: Living rents (per month) – 2018
1-bedroom 2-bedroom 3-bedrooms
Horsham £378 £491 £604
Crawley £333 £432 £532
Source: ASHE and Living Rents methodology
Table 40: Maximum Local Housing Allowance (Housing Benefit) by location (Broad Rental
Market Area) and property size (May 2019)
1-bedroom 2-bedroom 3-bedrooms
Crawley & Reigate £696 £854 £993
Brighton & Hove £683 £885 £1,028
Chichester £581 £728 £884
Worthing £536 £683 £827
Source: Valuation Office Agency
Need for Affordable Home Ownership
Using the previously established method to look at affordable need, it was estimated that there is a
substantial need for additional affordable housing – this is for subsidised housing at a cost below that
to access the private rented sector (i.e. for households unable to access any form of market housing
without some form of subsidy). It would be expected that this housing would be delivered primarily
as social/affordable rented housing.
The revised NPPF broadens the definition of affordable housing to include households which might
be able to rent a home in the private sector without financial support but aspire to own a home and

84
require support to do so. There are various ‘affordable home ownership’ products which are can meet
the housing needs of this group.
This section considers the level of need for these types of dwellings in Horsham and Crawley. The
NPPF states “Where major development involving the provision of housing is proposed, planning
policies and decisions should expect at least 10% of the homes to be available for affordable home
ownership, unless this would exceed the level of affordable housing required in the area, or
significantly prejudice the ability to meet the identified affordable housing needs of specific groups.”
(NPPF, para 64).
Establishing a Need for Affordable Home Ownership
The PPG of February 2019 confirms a widening definition of those to be considered as in affordable
need; now including ‘[households] that cannot afford their own homes, either to rent, or to own, where
that is their aspiration’. However, at the time of writing, there is no guidance about how the number
of such households should be measured.
The methodology used in this report therefore draws on the current method as set out in PPG, and
includes an assessment of current needs, projected need (newly forming and existing households).
The key difference is that in looking at affordability an estimate of the number of households in the
‘gap’ between buying and renting is used – i.e. those households who can afford to rent a home
without financial support but require support to access home ownership. There is also the issue of
establishing an estimate of the supply of affordable home ownership homes – this is considered
separately below.
The first part of the analysis seeks to understand what the gap between renting and buying actually
means in Horsham and Crawley – in particular establishing the typical incomes in this bracket.
Using the income distributions developed for use in the previous analysis of affordable housing need,
it has been estimated that of all households living in the private rented sector, around 37% of those
living in Horsham fall into the “rent/buy gap” along with 28% of households in Crawley. These figures
have been based on an assumption that incomes in the private rented sector are around 88% of the
equivalent figure for all households (a proportion derived from the English Housing Survey). These
are used as it is clear that affordable home ownership products are likely to be targeted at households
living in or who might be expected to access this sector (e.g. newly forming households).
To study current need, an estimate of the number of household living in the private rented sector
(PRS) has been established, along with the same (rent/buy gap) affordability test described above.
The starting point is the number of households living in private rented accommodation (as of the
2011 Census). Data from the Survey of English Housing (EHS) suggests that since 2011, the number
of households in the PRS has risen by about 26% and so this proportion is added to the initial
estimate of the size of the sector to provide an estimate of the current size of the PRS.
Additional data from the EHS suggests that 60% of all PRS households expect to become an owner
at some point and of these some 25% would expect this to happen in the next 2-years. This 25%
figure is taken to provide an estimate of the current number of households living in the PRS who are

85
seeking to become a homeowner in the short-term. The analysis then also considers newly forming
households and also the remaining existing households who expect to become owners further into
the future (i.e. those moving beyond the initial 2-year period).
Bringing the various strands of analysis together suggests that there is a gross need for around 468
affordable home ownership homes (priced for households able to afford to rent but not buy) per
annum in the 2019-39 period in Horsham and 381 in Crawley.
Table 41: Estimated Gross Need for Affordable Home Ownership Homes
Horsham Crawley
Per annum 2019-39 Per annum 2019-39
Current need 23 458 16 326
Newly forming households 376 7,519 315 6,305
Existing households falling into need 69 1,374 49 979
Total Gross Need 468 9,352 381 7,611
Source: Census (2011)/Projection Modelling and affordability analysis
Potential Supply of Housing to Meet the Affordable Home Ownership Need
At the current time the PPG does not include specific guidance about how the supply of housing to
meet these needs should be calculated. Our estimates of need are based on households able to
afford something between the lower quartile cost of renting and the lower quartile cost to buy.
Analysis of Land Registry data has therefore been undertaken to assess the number of homes sold
at below lower quartile prices. However, it is the case that market housing is not allocated in the
same way as social/affordable rented homes (i.e. anyone is able to buy a home as long as they can
afford it and it is possible that a number of lower quartile homes would be sold to households able to
afford more, or potentially to investment buyers). Furthermore, some homes sold at below a lower
quartile house price are in poor condition and in need of investment/ repair and may not therefore be
suitable for lower income households. In addition, there will be some ‘resales’ of existing shared
ownership and shared equity housing within the two authorities.
A broad further assumption has been used for modelling purposes that around half of the lower
quartile homes would be available to meet the needs of households with an income in the gap
between buying and renting.
The table below brings together the analysis of need and supply. It shows a potential annual need
for 159 affordable home ownership homes in Horsham per year, and 176 such homes in Crawley.
Table 42: Estimated Need for Affordable Home Ownership – per annum
Horsham Crawley
Current need 23 16
Newly forming households 376 315
Existing households falling into need 69 49
Total Gross Need 468 381
Supply (50% of LQ sales) 308 204
Net need 159 176

86
Source: Derived from Census (2011)/Projection Modelling/Land Registry and affordability analysis
Implications of the Analysis
It is clear from the wider analysis of market dynamics that there has been a significant growth of
households living in the Private Rented Sector over recent years, with Census data showing that the
number of households living in the sector increasing by 71% from 2001 to 2011 in Horsham and by
149% in Crawley (with the likelihood that there have been further increases since). Over the same
period, the number of owners with a mortgage dropped (by 10% in Horsham and 11% in Crawley).
Access to owner occupation is being restricted by both the cost of housing to buy as well as access
to capital (e.g. for deposits, stamp duty, legal costs) as well as potentially some mortgage restrictions
(e.g. where employment is temporary).
The analysis above shows a clear need from households who require support to access home
ownership. But the needs of these households can be met through a variety of means, including:
• The various low-cost home ownership products identified in the NPPF Glossary, including
discounted market sale and starter homes; shared ownership and shared equity housing;
• Other Government initiatives which seek to broaden access to home ownership, including the
Help-to-Buy scheme in which the Government lends up to 20% of the cost of a new-build home
and purchasers only require a 5% deposit.
In bringing together evidence in the review of their local plans, the commissioning authorities need
to consider the evidence of need, the relative acuteness of the need, and issues of residential
development viability. The NPPF advises that at least 10% of all new housing on larger sites should
be for affordable home ownership unless this would exceed the level of affordable housing required
in the area, or significantly prejudice the ability to meet the identified affordable housing needs of
specific groups.
The evidence herein provides sufficient evidence of a need for affordable home ownership products
to justify the 10% provision recommended in the NPPF (subject clearly to further work on the level
of housing provision to be planned for). However, there is also a clear and acute need for rented
affordable housing from lower income households, and it is important that a supply of rented
affordable housing is maintained to meet the needs of this group including those to which the
authorities have a statutory housing duty. Such housing is cheaper than that available in the open
market and can be accessed by many more households (some of whom may be supported by benefit
payments). In contrast, those with an affordable home ownership need in many cases may have
other housing options, such as an ability to rent housing in the market sector without financial support.
It should also be noted that the finding of a ‘need’ for affordable home ownership does not have any
direct impact on the overall need for housing. As is clear from both the NPPF and PPG, the additional
group of households in need is simply a case of seeking to move households from one tenure to
another (in this case from private renting to owner-occupation); there is therefore no net change in
the total number of households, or the number of homes required.
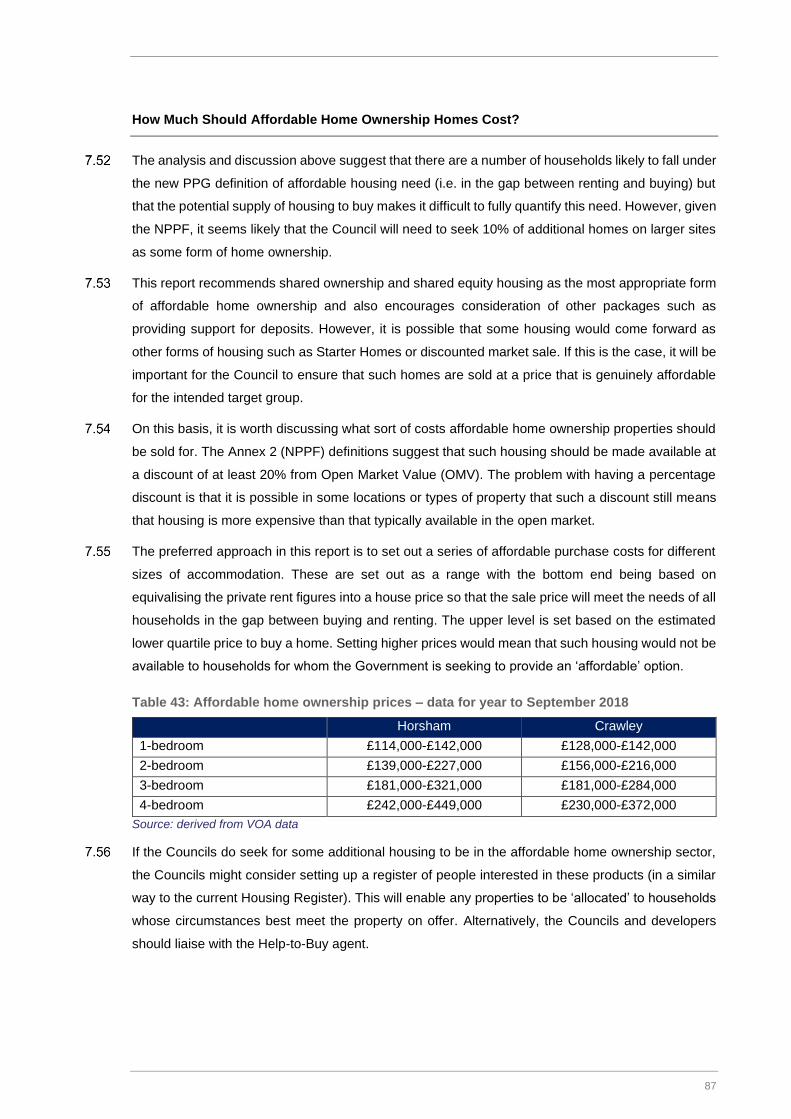
87
How Much Should Affordable Home Ownership Homes Cost?
The analysis and discussion above suggest that there are a number of households likely to fall under
the new PPG definition of affordable housing need (i.e. in the gap between renting and buying) but
that the potential supply of housing to buy makes it difficult to fully quantify this need. However, given
the NPPF, it seems likely that the Council will need to seek 10% of additional homes on larger sites
as some form of home ownership.
This report recommends shared ownership and shared equity housing as the most appropriate form
of affordable home ownership and also encourages consideration of other packages such as
providing support for deposits. However, it is possible that some housing would come forward as
other forms of housing such as Starter Homes or discounted market sale. If this is the case, it will be
important for the Council to ensure that such homes are sold at a price that is genuinely affordable
for the intended target group.
On this basis, it is worth discussing what sort of costs affordable home ownership properties should
be sold for. The Annex 2 (NPPF) definitions suggest that such housing should be made available at
a discount of at least 20% from Open Market Value (OMV). The problem with having a percentage
discount is that it is possible in some locations or types of property that such a discount still means
that housing is more expensive than that typically available in the open market.
The preferred approach in this report is to set out a series of affordable purchase costs for different
sizes of accommodation. These are set out as a range with the bottom end being based on
equivalising the private rent figures into a house price so that the sale price will meet the needs of all
households in the gap between buying and renting. The upper level is set based on the estimated
lower quartile price to buy a home. Setting higher prices would mean that such housing would not be
available to households for whom the Government is seeking to provide an ‘affordable’ option.
Table 43: Affordable home ownership prices – data for year to September 2018
Horsham Crawley
1-bedroom £114,000-£142,000 £128,000-£142,000
2-bedroom £139,000-£227,000 £156,000-£216,000
3-bedroom £181,000-£321,000 £181,000-£284,000
4-bedroom £242,000-£449,000 £230,000-£372,000
Source: derived from VOA data
If the Councils do seek for some additional housing to be in the affordable home ownership sector,
the Councils might consider setting up a register of people interested in these products (in a similar
way to the current Housing Register). This will enable any properties to be ‘allocated’ to households
whose circumstances best meet the property on offer. Alternatively, the Councils and developers
should liaise with the Help-to-Buy agent.

88
Crafting Policies for Affordable Housing
Drawing together the evidence in this section, a total need for 503 affordable homes per annum in
Horsham is identified, and a total need for 739 affordable homes per annum in Crawley. The evidence
base thus clearly justifies policies seeking to deliver affordable housing on new development
schemes.
Planning Practice Guidance sets out that the total affordable housing need should be considered in
the context of its likely delivery as a proportion of mixed market and affordable housing
developments, taking account of the probable percentage of affordable housing to be delivered on
eligible schemes. It sets out that an increase in the total housing figures included in the plan may
need to be considered where it could help deliver the required number of affordable homes.
Current development plan policies seek 35% affordable housing provision in Horsham and 40% in
Crawley. With these levels of provision, notionally over 1,400 homes would be needed each year in
Horsham and over 1,800 per year in Crawley to meet the affordable housing need in full.
This form of calculation should however be treated with a level of caution. The affordable housing
need is based on housing costs relative to incomes at the time of the assessment; and the standard
method already builds in an affordability uplift with the intention of improving housing affordability
over time. Secondly the level of affordable housing which can be delivered is influenced by how
affordable housing is funded, much of which is now through developer contributions. Nonetheless it
does provide some basis for considering, through the plan-making process and associated
sustainability appraisal of development options, whether housing provision above the minimum local
housing need would be justified.
Table 44: Total Affordable Housing Need, and Housing Provision to meet Affordable housing
in Full
Dwellings per annum Horsham Crawley
Need for Rented Affordable Housing 344 563
Need for Affordable Home Ownership 159 176
Total Affordable Housing Need 503 739
Current Affordable Housing Policy Targets 35% 40%
Notional Housing Provision to meet full Affordable Housing Need
1437 1848
Standard Method Local Housing Need 965 752
The level of affordable housing which can be sought through new development schemes will
fundamentally be influenced by their economic viability, as well as contributions which are sought to
other forms of infrastructure (either through s.106 agreements or CIL). The Councils will need to
balance up several factors in determining affordable housing policies including: contributions to
affordable housing as against other forms of infrastructure; trends in residential values relative to
construction costs; and the tenure mix of affordable housing sought. Higher affordable housing
provision overall could be achieved through seeking higher proportions of ‘affordable home

89
ownership’ products or affordable rented (as opposed to social rented) housing; but this needs to be
balanced against evidence regarding the profile of housing need and the need to provide housing for
households whose needs are more acute and do not have other housing options (such as the ability
to live within the private rented sector).
The split of affordable housing need in Crawley is 76% rented against 24% for low cost home
ownership (LCHO) products. At notionally 40% affordable housing provision, 25% LCHO/
intermediate housing would deliver 10% of housing for affordable home ownership consistent with
NPPF Para 64. A 75% rented/ 25% low cost home ownership tenure split may therefore be justified,
subject to viability.
In Horsham, the split of affordable housing need is 68% rented against 32% for low cost home
ownership products. If 40% affordable housing was sought at least 25% LCHO/ intermediate housing
would deliver 10% of housing for affordable home ownership consistent with NPPF Para 64, and this
could be justified based on seeking to deliver rented housing which met the needs of those
households with the greatest housing needs (given that those with an LCHO need in most cases
could afford to rent housing privately). Balanced against this is that higher proportions of LCHO
homes could potentially support either higher affordable housing provision or greater contributions
to wider infrastructure provision. The Council will need to consider these issues, but either a 75/25
or 70/30 tenure split between rented and low-cost home ownership provision could be justified by
the needs evidence.
The Councils in determining policies will need to balance these factors, bringing together evidence
regarding affordable housing need from this study, an understanding of infrastructure requirements
and funding options, and viability evidence.
Given land supply constraints in Crawley, it is likely that a proportion of the Borough’s housing needs
– and this includes its needs for affordable housing - will need to be met within neighbouring areas,
informed by Duty to Cooperate discussions. It is reasonable that where sites are meeting or
contributing to meeting the housing needs of Crawley, that they take account of the nature of
Crawley’s housing need, including its affordable housing needs. Iceni consider that it would be
reasonable for such housing to be priced to be affordable to households in Crawley; and that Duty
to Cooperate discussion take place in respect of the extent to which different authorities have
‘nominations rights’ over affordable housing provision on sites or at locations identified as
contributing to meeting a Crawley unmet need. To support effective joint working in this respect in
regard to sites ‘at Crawley’ it would be appropriate that authorities work together to provide a
consistent assessment of the viability position.

90
Affordable Housing Need: Key Points and Implications
The evidence in this section shows a net affordable housing need for 503 affordable homes per year in Horsham, and 739 affordable homes per year in Horsham. This is based on the widened definition of who has an affordable housing need set out in the 2019 NPPF. The scale of affordable housing need is significant and justifies planning policies seeking to maximise affordable housing provision on eligible development sites, subject to viability. It also provides some basis for considering through the plan-making process and sustainability appraisal higher levels of overall housing provision; albeit recognising that in doing so housing need will need to be balanced against other planning considerations including environmental considerations and infrastructure capacity.
The NPPF seeks to promote provision of at least 10% of housing on major development sites to be provided as low cost home ownership housing. The needs evidence herein justifies this level of provision, but notes that this needs to be balanced against ensuring that the needs of households who require rental housing and do not have other housing options is addressed. Iceni consider that on this basis a tenure split of 75% rented and 25% low cost home ownership housing would be justified in Crawley; and either this or a 70/30 split in Horsham, subject to viability testing. The Councils in determining policies for affordable housing will need to bring together evidence regarding affordable housing need from this study, an understanding of infrastructure requirements and funding options, and viability evidence.
Given the likely land supply constraints in Crawley, it will also be important that consideration is given to affordable housing provision to meet Crawley’s needs through Duty to Cooperate discussions.

91
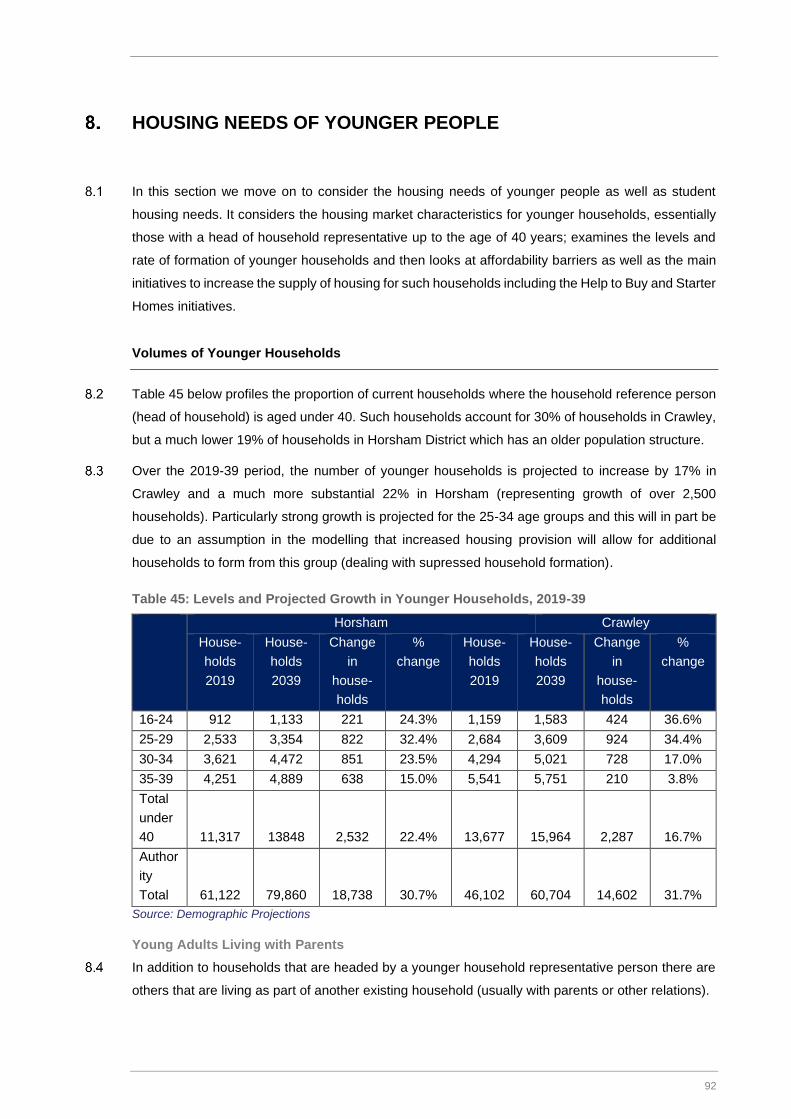
92
HOUSING NEEDS OF YOUNGER PEOPLE
In this section we move on to consider the housing needs of younger people as well as student
housing needs. It considers the housing market characteristics for younger households, essentially
those with a head of household representative up to the age of 40 years; examines the levels and
rate of formation of younger households and then looks at affordability barriers as well as the main
initiatives to increase the supply of housing for such households including the Help to Buy and Starter
Homes initiatives.
Volumes of Younger Households
Table 45 below profiles the proportion of current households where the household reference person
(head of household) is aged under 40. Such households account for 30% of households in Crawley,
but a much lower 19% of households in Horsham District which has an older population structure.
Over the 2019-39 period, the number of younger households is projected to increase by 17% in
Crawley and a much more substantial 22% in Horsham (representing growth of over 2,500
households). Particularly strong growth is projected for the 25-34 age groups and this will in part be
due to an assumption in the modelling that increased housing provision will allow for additional
households to form from this group (dealing with supressed household formation).
Table 45: Levels and Projected Growth in Younger Households, 2019-39
Horsham Crawley
House-
holds
2019
House-
holds
2039
Change
in
house-
holds
%
change
House-
holds
2019
House-
holds
2039
Change
in
house-
holds
%
change
16-24 912 1,133 221 24.3% 1,159 1,583 424 36.6%
25-29 2,533 3,354 822 32.4% 2,684 3,609 924 34.4%
30-34 3,621 4,472 851 23.5% 4,294 5,021 728 17.0%
35-39 4,251 4,889 638 15.0% 5,541 5,751 210 3.8%
Total
under
40 11,317 13848 2,532 22.4% 13,677 15,964 2,287 16.7%
Author
ity
Total 61,122 79,860 18,738 30.7% 46,102 60,704 14,602 31.7%
Source: Demographic Projections
Young Adults Living with Parents
In addition to households that are headed by a younger household representative person there are
others that are living as part of another existing household (usually with parents or other relations).

93
In Northern West Sussex, the 2011 Census showed that 9.9% of households in Crawley and 8.9%
of households in Horsham included non-dependent children.
Nationally, ONS data25 shows that the number of young adults living with their parents has grown
very significantly in the period from 1999 to 2015 (from 5.5m to some 6.6m) with the level tending to
stabilise in the following most recent period. Figure 26 below highlights the national trend and
increase over time. Given increasing affordability pressures, it is likely that an increase in young
adults living with parents will also have been seen within Northern West Sussex.
Figure 26: Young Adults Living with Parents, UK 1996 – 2015
Source: ONS, 2015
Home Ownership amongst Younger Households
The English Housing Survey (EHS) 2017-18 data26 identified that nationally 57% of those households
aged 35-44 years were owner occupiers representing an increase from 52% in 2016-17. The EHS
notes that this change follows from a long period of decline in owner occupation amongst younger
age group households (71% of 35-44-year-old households were owner occupiers in 2007-08). This
may well be a temporary change, set against the longer-term decline in home ownership amongst
younger households.
25 Labour Force Survey, ONS, 2015
26 English Housing Survey: 2017-18 - Headline Report
0,00
1,00
2,00
3,00
4,00
5,00
6,00
7,00
8,00
Mill
ion P
ers
ons

94
The EHS also identified that, while owner occupation remains most prevalent for that age group that
there has been a considerable increase in the proportion of 35-44-year olds in the Private Rented
Sector (rising from 13% in 2007-08 to 28% in 2017-18). The EHS describes this as a particularly
pronounced change. Indeed some 68% of households in the private rental sector had a Household
Reference Person (HRP) aged under 45 years.
Overall the EHS concluded that households with an HRP aged 25-34 years are more likely to be
renting privately than buying their own home.
Within the South East region, data and analysis undertaken by the Resolution Foundation27 in
January 2019 found that home ownership and owner occupation by those families (singles or
couples) in the 25-34 years and 35-44 years cohorts had declined markedly in the period since 2007-
08, although there were tentative signs of an upswing in levels of ownership from 2016-17 albeit with
no particular confidence that this shift would continue. The ability of younger households to become
homeowners is clearly sensitive to housing costs.
Figure 27: Proportion of Families Who Own Their Home, South East Region, 1984 – 2017
Source: The Resolution Foundation, January 2019 – using Labour Force Survey data
Turning to the Northern West Sussex HMA area, tenure of housing by age of the HRP can be
reviewed for younger age cohorts using 2011 Census data. While the data is of course now some
27 https://www.resolutionfoundation.org/data/housing/

95
years old, it remains an important source of information about the levels of home ownership for
different age groups.
Figure 28 below sets out the tenure split of housing in each local authority area for younger household
age cohorts and split between economically active and inactive households. It considers the tenure
of household reference persons and their economic participation by age. This analysis shows the
clear differences in levels of home ownership between economically active and inactive younger age
cohorts; and also, the substantial level of increase in ownership between the 16-34- and 35-49-years
cohorts in each of the constituent Northern West Sussex local authorities. There will be some
younger people living in communal accommodation, house shares or with parents.
The analysis also affirms the relative importance of access to the private rental market for younger
age cohorts including those classed as economically inactive (which includes students, those looking
after the home, those with long-term sickness/disability and those providing care support).
Figure 28: Housing Tenure by Younger Age Cohort and Economic Activity, Northern West
Sussex Authorities, 2011
Source: Census 2011 via Nomis
96
Current Affordability and Barriers for Younger Households
Younger households and individuals often find barriers to accessing a choice and mix of housing
offer to meet their needs. There are increasing barriers arising from lower household incomes, rising
housing sales prices over time and increasing private market rental costs. These difficulties are
compounded by the operation of mortgage lending and finance with increased levels of scrutiny
concerning a household or individuals’ ability to meet repayments and also to find substantial
deposits in order to secure finance.
The affordability barriers that have been evident for some years have continued to restrict younger
household formation and a continuation of the trends in rising levels of young adults living with their
parents in Northern West Sussex (as considered above).
Welfare and Housing Benefits
Changes to welfare and housing benefits have influenced the ability of younger households and
individuals to secure accommodation. Generally, single private renters aged under 35 years can only
claim the shared accommodation rate (even If the property is not shared with others) of housing
benefit or Universal Credit housing costs. Those under 35 years of age will not get the shared
accommodation rate if they live with other family members in a self-contained private home with a
partner, dependent children or adult (non-dependent children or other adult family members).
The shared accommodation rate is set under the Local Housing Allowance (LHA) regulations by the
Valuation Office Agency. For the Northern West Sussex authorities, the current LHA rates for shared
accommodation are set out on the basis of the Crawley & Reigate Broad Rental Market Area (BRMA).
This BRMA encompasses Crawley, Horsham and Mid Sussex. The current LHA rates (April 2019)
are:
• Shared Accommodation rate: £84.40 per week
• One Bedroom rate: £160.73 per week
• Two Bedrooms rate: £197.12 per week
• Three Bedrooms rate: £229.22 per week
• Four Bedrooms rate: £318.96 per week
The housing benefit cap applies to working age people (those not qualifying for exemption) setting
an overall limit of the amount of benefits that are paid. Housing benefit or Universal Credit is reduced
in such situations so that the benefits paid do not exceed the cap. The benefit cap is applied as soon
as total income from benefits exceeds the cap figure. Housing benefit caps do not apply if sufficient
hours of work are undertaken to qualify for Working Tax Credit.
The benefit cap applicable in Northern West Sussex is the ‘Outside London’ rate:
• Single people: £257.69 per week (£1,116.67 per month);
• Families with Children or couples: £384.62 (£1,666.67 per month).

97
Affordability and Access to Finance
Affordability of market housing is a critical issue for many younger households and individuals. High
levels of unaffordability can lead to distortions in the housing market including unmet housing needs,
and inability to support economic and employment growth, increased pressure on commuting for
work, loss of economically active households and increased social pressures on housing benefits,
healthcare and poverty. Increasing unaffordability places greater pressure on social rented housing
needs as well as increasing the demand for intermediate and shared equity housing products,
particularly among younger households who do not usually have existing housing equity or other
sufficient financial savings.
As described in Section 6, lower quartile house prices have now risen to 10.7 times typical earnings
of younger households in Crawley, and to 14.4 times earnings in Horsham. Comparison with the
previous Northern West Sussex HMA Affordable Housing Needs Update (October 2014) highlights
a significant worsening position28 in the period since that report was completed.
Indeed, entry level affordability has consistently worsened over the period from 2008 for each of the
Northern West Sussex authorities. The recessionary period in 2008/09 which saw evident house
price reductions did not support a sustained change or improvement in the affordability of entry-level
market housing or any particular benefit for younger households. The more recent trends from 2013
onwards show no positive improvement in LQ price to earnings ratios, with rising levels of relative
unaffordability in each local authority area at a rate and to levels that are higher than either the South-
east region or for England as a whole.
Overall there remains an acute level for relative unaffordability for entry level market housing and a
challenging context for younger households to secure a home in the private market.
Looking in more detail are first time buyer earnings to house price ratios in the longer-term context,
the Nationwide Building Society has tracked lower quartile house prices for first time buyers and
mean average household earnings from 1983 to 2019.
Figure 29 below sets out the latest data from Nationwide drawing on their mortgage lending statistics
on a quarter by quarter basis. Although the data cannot be disaggregated for the Northern West
Sussex HMA, it does set the wider context for the South East, including separating the Outer South
East (within which the Northern West Sussex HMA sits) with the Outer Metropolitan Area and then
for London itself. The UK figures are also shown for wider reference.
The Figure identifies the growth in first time buyer house price to earnings during the 1990s and early
2000s followed by a significant decline in 2008 – 2010 before a marked increase and, indeed, rapid
upward change in the period from Q4 2013/Q1 2014 to Q4 2016 before stabilising and showing a
slight downward trend since then. The ratio growth for London is most marked as it has witnessed a
28 See Figure 8 – Ratio of Lower Quartile Price to Earnings 2009 – 2013, page 41 of Northern West Sussex

98
very substantial surge in the period from Q12013 to Q4 2016 hitting 10:1 before dropping back to
circa 9:1.
The recent position, since 2016, appears to reflect more subdued house price growth for the South-
east and for London, potentially in the context of the uncertainty arising from Britain’s vote to withdraw
from the European Union.
Despite a recent decline and more stability in the LQ price to mean average earnings for first time
buyers, limited change to household incomes and earnings and a continued overall housing
supply/demand imbalance have continued to sustain price to earnings ratios that represent a
substantial affordability barrier for many first-time buyers.
Figure 29: First Time Buyer House Price to Earnings Ratio, South East, Metropolitan Area,
London and UK, 1983 - 2019
Source: Nationwide Building Society, April 2019
Previous Northern West Sussex SHMA reports have however noted the importance of the ratio of
mortgage payments to earnings, rather than simply house prices to earnings. Table 46 below sets
out the mortgage payments (interest and capital) relative to household disposable income on a
regional basis in the last two years (2016 and 2017) benchmarked against the long-term average
(1983 – 2017).

99
The data highlights that typical mortgage payments account for some 30% of homeowners’
disposable income for the UK as a whole. However, this masks a considerable difference between
the UK-wide figure and those for the South East region (40.2%) and London (44.8%) as at Q4 2017.
The Table also shows that the current levels of mortgage payments to disposable income in the
South East region is slightly below the long-term average (46.6%) and the peak position recorded in
Q4 2007 of 54.6%. The levels are however substantially higher than the position recorded in the
Northern West HMA: Affordable Housing Need Update (October 2016), where Figure 11 and
paragraph 3.68 demonstrated that mortgage payments were around 34% of household disposable
income as at Q4 2013 / Q1 2014. Affordability has therefore tended to worsen since the previous
analysis was undertaken and represents a continuing trend towards increasing unaffordability in the
South-east region.
Table 46: Mortgage Re-payments as a Proportion of Household Disposable Incomes
2007 Q4 2016 Q4 2017 Q4 Long Term Average
(1983 - 2017)
South East 54.6% 41.1% 40.2% 46.6%
London 52.4% 47.9% 44.8% 43.6%
UK 47.3% 29.6% 29.0% 35.2% Source: Lloyds Banking Group (Halifax Housing Research Data), 2019
Local Pricing Barriers
There are evident house price barriers for younger households to secure private market housing for
sale or rent in each of the Northern West Sussex local authority areas. Current data for 2018 shows
that in Crawley LQ prices averaged £247,000 in 2018; for Horsham the LQ sale price was £295,000;
while in Mid Sussex it was £282,000.
Based on loan to income ratios used by most mortgage lenders of 4.5-time annual income,29 Table
40 sets out the monthly entry-level housing costs.
Table 47: Entry Level House Purchase Costs, 2018
Area LQ Purchase Price 2018
Monthly Mortgage Cost (3% interest)
Stress-Test Monthly Mortgage Cost (6%
interest)
Crawley £247,000 £1,054.17 £1,432.28
Horsham £295,000 £1,259.03 £1,710.62
Mid Sussex £282,000 £1,203.55 £1,635.24
Northern West Sussex HMA
£274,944 £1,170.09 £1,589.78
Source: HM Land Registry, CCL calculation and The Money Advice Service, April 2019
The LQ average sales prices in Northern West Sussex HMA have witnessed significant increases
over recent years. The Northern West Sussex Affordable Housing Needs Update recorded LQ house
29 Calculations assume a 10% deposit, repayment term of 25 years and a 3% interest rate over the term (6% for the Stress-
Test). It is assumed that there is no existing housing equity available to purchasers

100
prices as at October 2014 as: £134,740 in Crawley; £174,249 in Horsham; and £168,432 in Mid
Sussex30 .
The analysis in Section 7 showed that lower quartile house prices are (at the time of writing) around/
£142,000 for a 1-bed property in both Crawley and Horsham, and are £216,000 for a 2-bed property
in Crawley and £227,000 in Horsham. A household would thus typically require an annual income at
least £32,000 to be able to afford a 1-bed property to buy, and over £48,600 to afford a 2-bed property
to buy. To rent a 1-bed property without financial support, a household would require an annual
income of £25,700 in Horsham and £28,800 in Crawley based on current rental values. There are a
range of younger households who have incomes below this.
The Lower Quartile sales prices place much of the Northern West Sussex Housing Market Area at
or above the threshold for prices supported by the Government’s Starter Homes initiative (a flat cap
of £250,000 price applies outside Greater London - see below for more detail) although they fall well
within the ambit of the Help to Buy scheme which supports new property purchases up to £600,000.
Overall, the entry level house purchase costs represent a significant barrier and challenge for many
younger households with monthly mortgage payments well in excess of £1,000 alongside other
housing costs such as the savings necessary to provide a mortgage deposit of at least 10% (although
this is reduced to by virtue of a loan to 5% under Help to Buy sales) as well as household insurance
and other ongoing maintenance and utilities bills.
National Interventions to Support Younger Households
The Help to Buy Programme
The Help to Buy programme represents a suite of Government-supported schemes intended to
expand the number of households that are able to purchase market housing either through mortgage
finance or via a shared ownership product. The Help to Buy programme is aimed more towards
younger households and first-time buyers but is not (currently) exclusively available to such groups.
The Help to Buy programme has expanded since it was originally established and now includes:
• Help to Buy ISA – is a savings product aimed at first time buyers. The ISA boosts the amount
saved by 25% with the total Government contribution capped at £3,000. The ISA can be used in
combination with the Equity Loan or Shared Ownership schemes.
• Help to Buy Equity Loan – The scheme, for new homes, is open to first time buyers and existing
homeowners. There is no income cap and properties can be purchased up to a value of
£600,000. A 5% deposit is required and the Help to Buy Equity Loan lends up to 20% of the
30 Table 11: Entry Level Housing Costs and Incomes Thresholds, 2014 – Northern West Sussex HMA: Affordable Housing Needs Update (October 2014)
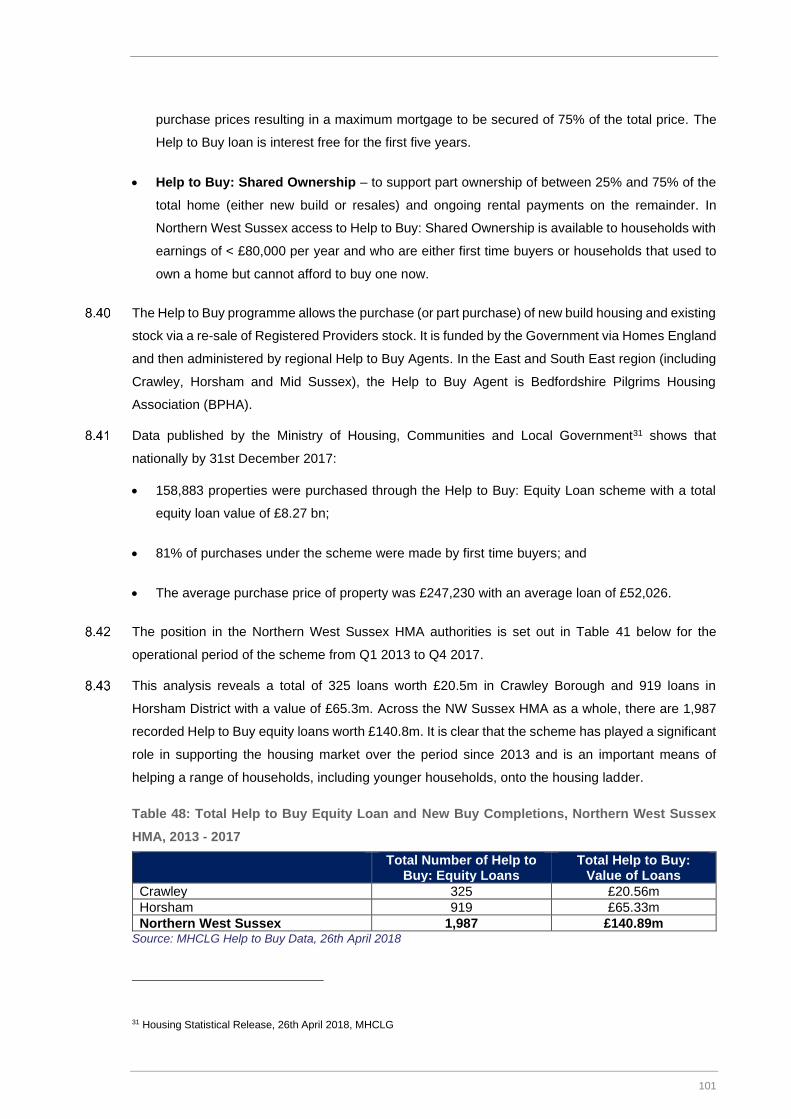
101
purchase prices resulting in a maximum mortgage to be secured of 75% of the total price. The
Help to Buy loan is interest free for the first five years.
• Help to Buy: Shared Ownership – to support part ownership of between 25% and 75% of the
total home (either new build or resales) and ongoing rental payments on the remainder. In
Northern West Sussex access to Help to Buy: Shared Ownership is available to households with
earnings of < £80,000 per year and who are either first time buyers or households that used to
own a home but cannot afford to buy one now.
The Help to Buy programme allows the purchase (or part purchase) of new build housing and existing
stock via a re-sale of Registered Providers stock. It is funded by the Government via Homes England
and then administered by regional Help to Buy Agents. In the East and South East region (including
Crawley, Horsham and Mid Sussex), the Help to Buy Agent is Bedfordshire Pilgrims Housing
Association (BPHA).
Data published by the Ministry of Housing, Communities and Local Government31 shows that
nationally by 31st December 2017:
• 158,883 properties were purchased through the Help to Buy: Equity Loan scheme with a total
equity loan value of £8.27 bn;
• 81% of purchases under the scheme were made by first time buyers; and
• The average purchase price of property was £247,230 with an average loan of £52,026.
The position in the Northern West Sussex HMA authorities is set out in Table 41 below for the
operational period of the scheme from Q1 2013 to Q4 2017.
This analysis reveals a total of 325 loans worth £20.5m in Crawley Borough and 919 loans in
Horsham District with a value of £65.3m. Across the NW Sussex HMA as a whole, there are 1,987
recorded Help to Buy equity loans worth £140.8m. It is clear that the scheme has played a significant
role in supporting the housing market over the period since 2013 and is an important means of
helping a range of households, including younger households, onto the housing ladder.
Table 48: Total Help to Buy Equity Loan and New Buy Completions, Northern West Sussex
HMA, 2013 - 2017
Total Number of Help to Buy: Equity Loans
Total Help to Buy: Value of Loans
Crawley 325 £20.56m
Horsham 919 £65.33m
Northern West Sussex 1,987 £140.89m Source: MHCLG Help to Buy Data, 26th April 2018
31 Housing Statistical Release, 26th April 2018, MHCLG

102
The largest take-up by value and the number of equity loans made in the HMA is in Horsham followed
by Mid Sussex. The total value of loans in Crawley reflects a lower level of loans made and also
reflects the lower average value of housing stock in the Borough compared with Horsham and Mid
Sussex.
Turning to the type of stock purchased using Buy to Help: Equity Loans, Table 49, below, shows that
the majority of purchases have been freehold houses with relatively lower levels of flatted stock.
Table 49: Number of Help to Buy Equity Loans by Type and Tenure, Northern West Sussex
HMA, 2013 – 2017
Total Houses Total Flats
Crawley 235 (of which 3 leasehold) 90 (of which 82 leasehold)
Horsham 756 (of which 3 leasehold) 161 (of which 155 leasehold)
Northern West Sussex*
1599 386
Source: MHCLG Help to Buy Data, 26th April 2018 * note – total figures under-record by two units that were not recorded
The scale and expansion of the Help to Buy equity loan scheme in Northern West Sussex is sharply
demonstrated when comparing the current total and value of equity loans against the levels
recorded32 in the Northern West Sussex HMA: Affordable Housing Needs Update (2014). At that
time, the Help to Buy: Equity Loan scheme was in its infancy with a total of only some £7.9m having
been advanced. The overall level of loan value will have provided a significant amount of support for
particularly younger households seeking to access private market housing.
The Communities Secretary Rt Hon James Brokenshire MP announced in November 2018 that the
Help to Buy scheme would continue with a new scheme from April 2021 (understood to be more
restricted to just first time buyers and with regional property price caps imposed to more closely target
those that the Government considers are most in need of the support). The confirmation of a future
Help to Buy scheme, post 2021 does offer some further certainty that this form of housing market
intervention and support will continue for the foreseeable future.
32 Paragraph 3.49 et seq. Northern West Sussex HMA: Affordable Housing Needs Update, October 2014, Chilmark Consulting
Ltd.

103
Starter Homes
The former Coalition Government signalled strong support for the delivery of 200,000 Starter Homes
for sale by 2020 in England. The intention of providing Starter Homes was to ensure that there is a
greater emphasis on the construction and delivery of new Starter Homes for first time buyers under
the age of 40 years.
The legislative and national policy basis for local authorities to provide Starter Homes in their areas
is set out in:
• The Housing and Planning Act, 2016;
• The National Planning Policy Framework (February 2019);
• The National Planning Practice Guidance at Section ID-55; and
• Written Ministerial Statement (Secretary of State for Communities and Local Government)
(March 2015).
The Housing and Planning Act, 2016 was passed into law on 12th May 2016. Part I (New Homes in
England) of the Housing and Planning Act (2016) is concerned with Starter Homes at Chapter 1.
This highlights the Government’s intention to promote the supply of Starter Homes in England.
Paragraph 2 defines a Starter Home as a building or part of a building that is a new dwelling, available
for purchase by qualifying first-time buyers, sold at a discount of at least 20% of the market value
and for less than the price cap, and is subject to any restrictions on sale or letting specified in
regulations made by the Secretary of State. Paragraph 3 defines a ‘qualifying first time buyer’ as an
individual who is a first-time buyer, aged at least 23 but under the age of 40 and meets another
criteria specified in regulations. Paragraph 6 sets out the ‘price cap’ which is £250,000 outside
Greater London (applicable to both Crawley Borough and Horsham District) and £450,000 in Greater
London.
Clause 4 prescribes a general duty to promote the supply of Starter Homes. In Paragraph 1, the Act
requires local authorities to carry it out relevant planning functions with a view to promoting the supply
of Starter Homes in their areas. However, it should also be noted that, at the time of writing, the
legislative provisions in the 2016 Act for Starter Homes have not yet come into force.
Indeed, as set out below, the Government has, since 2017, shifted its approach and emphasis on
Starter Homes towards a policy basis and general duty rather than a legislatory statutory
requirement.
The National Planning Policy Framework (NPPF) (February 2019) includes Starter Homes within the
definition of Affordable Housing set out in Annex 2 (Glossary). It states that the definition of a Starter
Home is as set out in statute and any secondary legislation at the time of plan-making/decision-
taking. It is clear that Starter Homes are, for the purposes of local planning, considered to be an
affordable housing product that helps provide a subsidised route to home ownership.
Paragraph 1 of Section 55 in the Planning Practice Guidance (PPG) establishes that there is an
exception sites policy for the provision of Starter Homes enabling applications for development on

104
under-used or unviable industrial and commercial land that has not been currently identified for
housing. Local planning authorities are expected to work with landowners and developers to secure
a supply of land suitable for Starter Homes exception sites to deliver housing for young first-time
buyers in their area. The PPG also advises at Section 55, paragraph 005 that there should be
appropriate restrictions to ensure that Starter Homes are not resold or let at their market value for
five years following the initial sale. The restrictions of eligibility and resale are to be secured by way
of planning obligations.
In April 2016 a £1.2 billion fund was announced by the Government to help “deliver 200,000 quality
starter homes by 2020 exclusively for first-time buyers at a 20% discount on market value”. The first
30 Starter Home Land Fund Partnerships were announced in January 2017 with local authorities
working with Homes England to identify and take forward further land opportunities for the fund. In
the Northern West Sussex HMA, Mid Sussex District was selected as one of the 30 Starter Home
Land Fund Partnerships. Neither Crawley Borough nor Horsham District were selected. In May 2018,
the Housing Minister confirmed in a response to parliamentary questions that £250m of the fund had
been expended but no specific Starter Home stock had yet been constructed.
The Government’s emphasis of the central importance of Starter Homes to provide a subsidised
route to home ownership has been somewhat diluted from the approach originally envisaged. The
2015 Conservative Government published its Housing White Paper (7th February 2017), together
with its response to the consultation on the Starter Homes Technical Regulations. The White Paper
marked a shift in the Government’s housing policy from a strong focus on Starter Homes, to delivering
a wider range of affordable housing.
The Government has emphasised that it expects Starter Homes to be delivered alongside shared
ownership, rent-to-buy, and other affordable housing products. Reflecting this policy, it expects to
help over 200,000 people become homeowners through a range of Government programmes by
2020.
The 2017 White Paper announced that there would be a general duty on local authorities to promote
the supply of Starter Homes but that the statutory Starter Homes requirement (as set out in the 2016
Act) would not be implemented at that time. Secondary regulations were proposed to finalise the
Starter Homes definition and monitoring and the NPPF would be used to include Starter Homes as
part of the wider definition of affordable housing.

105
Local Starter Homes Policy Context
Both Crawley and Horsham’s adopted Development Plans include policies for the provision of
affordable housing as part of their overall approach to ensuring that identified housing needs are
met.
For Crawley, Policy H4 (Affordable and Low-Cost Housing) identifies that 40% of new residential
development should be affordable housing with a 70:30 affordable rent and intermediate tenure split.
Policy H4 also requires 10% low cost housing provision in addition to the 40% affordable housing
requirement. Low cost housing is defined as offering up to 10% discount to first time buyers (and
would not therefore accord with the statutory or NPPF definition of Starter Homes). Crawley’s current
Development Plan policies do not therefore include explicit provision for Starter Homes as the Plan
pre-dates the Government’s intention to deliver such housing and also pre-dates the latest version
of the NPPF.
In Horsham District, the Development Plan policy I6 (Meeting Local Housing Needs) establishes a
35% affordable housing provision on sites of more than 15 dwellings or over 0.5 Ha and a 20%
provision on sites of 5-14 dwellings. A tenure split of 70:30 affordable rent-to-intermediate tenures is
sought. Similar to the position in Crawley, Horsham’s development plan policies do not include
explicit provision for Starter Homes as at the time of its preparation, such housing products were not
actively promoted by Government nor were they included within the definition of Affordable Housing
set out in the NPPF.
Local Eligibility and Provision of New Starter Homes in Northern West Sussex
Work undertaken by Chilmark Consulting for both Crawley and Horsham in 201633 identified (in the
context of an emerging legislative and regulatory basis for Starter Homes at that time) identified a
significant pool of potential, eligible households in both local authority areas taking account of
household eligibility (age restrictions and requirement to be first time buyers) as well as the ability of
those eligible households to afford the requisite deposit and mortgage payments.
That analysis is not replicated herein but the clear conclusion of the 2016 report was that there was
a significant level of eligible households in both Crawley and Horsham and a relative lack of housing
available that would be within the sales market price cap including discount (£250,000). Indeed, the
current lower quartile average prices (see Section 6) for Crawley Borough now sit at the market cap
level; and are well above this for Horsham District.
While the level of potential local household eligibility for Starter Homes is evident, there has not been
any recorded development or completion of Starter Homes (including Starter Homes exception sites)
in either Crawley Borough or Horsham District since 2015.
Overall, whilst a potential ‘need’ for Starter Homes remains, there are other low cost home ownership
products which are capable of meeting a greater range of needs, including those of households on
33 Starter Homes Needs and Implications, Chilmark Consulting Ltd. (November 2016)

106
lower incomes, and we do not consider that a specific policy requirement in new Local Plans which
specifically sought to promote delivery of Starter Homes instead of other affordable housing products
would be appropriate.
Rural and Entry-Level Exception Sites
This sub-section considers the role of rural exception site development and the new ‘entry level
exception sites’ in assisting younger households to secure suitable housing and often to remain living
in the area where they may have grown up.
Paragraph 71 of the NPPF identifies that local planning authorities should support the development
of entry-level exception sites, suitable for first time buyers (or those looking to rent their first home),
unless such needs are already being met within the authority’s area. The paragraph requires that
such sites should not be on land already allocated for residential development and should comprise
affordable housing as defined in the NPPF. It also states that such entry-level exception sites should
be adjacent to existing settlements and proportionate in size to them. In this respect Footnote 33
indicates that entry-level sites should not be larger than 1 Ha or exceed 5% of the size of the existing
settlement. Iceni consider that these sites should be seen as a means of delivering additional
affordable housing to meet a (authority-level) need.
Rural exceptions sites are different and are addressed in the Glossary and Para 77 in the NPPF.
Annex 2 of the NPPF defines rural exception sites as:
“Small sites used for affordable housing in perpetuity where sites would not normally be used for
housing. Rural exception sites seek to address the needs of the local community by accommodating
households who are either current residents or have an existing family or employment connection. A
proportion of market homes may be allowed on the site at the local planning authority’s discretion,
for example where essential to enable the delivery of affordable units without grant funding”.
Para 77 confirms that local planning authorities should support opportunities to bring forward rural
exception sites that will provide affordable housing to meet identified local needs and also to consider
whether some market housing on such sites would help facilitate this. The purpose of rural exception
site development is to recognise that more rural communities need new housing to help maintain
their vitality and also to assist residents to find accommodation that meets their changing needs. For
younger individuals and households this includes offering genuine opportunities to secure affordable
housing in the area where they have grown up. Rural exception housing therefore offers a policy and
financial mechanism by which the choice and mix of accommodation available to younger age groups
can help support access to appropriate housing.
Rural exception sites have the advantage of giving people with a local connection and where there
is an identified local housing need, a priority in the affordable housing allocation process. Homes are
offered first and foremost to households in the parish within which it is located. The development and
occupancy of rural exception sites is controlled through a s106 legal agreement. This agreement

107
ensures that the dwellings on the exception site are affordable in perpetuity and have occupancy
clauses.
Rural exception housing provision is relevant only to Horsham District and Mid Sussex District within
the Northern West Sussex HMA. Crawley Borough’s administrative area does not include areas
defined as rural given its tightly drawn administrative boundary to the existing built-up area. The
Horsham District Planning Framework includes a Policy (Policy 17) which guides the development
of Rural Exception Sites.
The affordable housing provided on rural exception sites should only be used to meet a clearly
identified local housing need and a community will need to show a parish-wide housing needs survey
to identify localised needs. The results of the survey should demonstrate that there are people living
in the parish/village who are in housing need and are unable to compete in the general housing
market (to rent or buy) due to the low level of their income.
In contrast on ‘entry level exception sites’ there is no requirement for an applicant to demonstrate a
local need. What is required is evidence that there is an unmet need for entry-level housing to rent
or buy at the local authority level. Schemes must however deliver 100% affordable housing.
For the purposes of this update, the provision of rural exception housing in Horsham District has
been examined using information made available from the Council’s planning register. The register
shows that there have been a very limited number of rural or entry-level exception schemes permitted
and completed in the District (some 41 dwellings in total) and one application (four dwellings)
currently awaiting determination. A snapshot of the position is set out in Table 43 below.
The characteristics of each permitted scheme shows that exception sites are capable of delivering
both houses and flatted accommodation including smaller 1-bed and 2-bed dwellings. While the total
level of delivery of exception site dwellings is small, the range of units is welcomed in helping to meet
evident localised rural housing needs.
Table 50: Rural Exception Housing Schemes in Horsham District
Location and Description No. Size Detail Registered
Provider
Cowfold
20 affordable housing
dwellings
20 4 x 1 bed flats
9 x 2 bed houses,
7 x 3 bed houses
Completed Saxon Weald
West Chiltington
Affordable housing (14
dwellings) and private
market (1 dwelling)
15 2 x 2 bed flats
6 x 2 bed houses
5 x 3 bed houses
Under
construction
Saxon Weald

108
Warnham
Intermediate market
housing
6 1 x 1 bed flat
1 x 2 bed flat
2 x 2 bed houses
2 x 3 bed house
Under
construction
Not delivered by
an RP
Thakeham
Affordable Housing
4 2 x 2 bed houses
2 x 3 bed houses
Decision
pending (May
2019)
Hyde Housing
Association
Source: Horsham District Council planning register, April 2019
From the evidence available there is potential for a greater level of rural exception sites
development to come forward to help support smaller communities in the District (subject to
their own localised needs assessment). Horsham District’s adopted planning policies support the
provision of such rural and entry-level exception sites on a case-by-case basis (in accordance with
the NPPF), but there is an opportunity to highlight and more strongly promote the benefits of
exception sites housing to encourage housing opportunity for younger households (and families)
connected to rural areas.
A number of Registered Providers (including Saxon Weald and Hyde Housing are active in promoting
and securing exception sites housing but given underlying levels of relative unaffordability of new
housing in the District (particularly for younger households) it is considered that the level of activity
could be expanded in future.
Action in Rural Sussex (an independent charity for people living in rural areas of Sussex) has, for
example, identified a significant shortage of affordable housing in rural areas of the County (including
Northern West Sussex) leading to making rural areas unaffordable for key workers, low income
families and first time buyers/younger age households. Their work, over the past 25 years, has
supported the development of rural exception sites in partnership with a range of housing providers
as well as through the establishment of Community Land Trusts.
Their work supports both the research (localised housing needs in rural communities) as well as site
specific negotiations and advocacy to support rural housing delivery. It is intended to help enable
housing delivery and offer a positive and proactive approach to securing a mix and choice of housing
in more rural locations, particularly helping to address supply-side and financial barriers for younger
and first time buyer households in Horsham (and elsewhere in the Northern West Sussex HMA).
Student Accommodation
Finally, in respect of younger persons housing needs, this section considers whether there are any
issues associated with student populations within the two authorities.
Neither of the two authorities currently has a university, the nearest universities being located in
Brighton and Hove. As a result, there are limited student housing issues within the local market,
these being focused on further education students.

109
There is currently one Further Education (FE) college in Horsham – Collyer’s (offering Sixth Form
and Adult Evening Courses), and one FE college in Crawley – Crawley College (offering Sixth Form,
Adult education and undergraduate courses through partnerships with universities).
According to 2011 Census data there were 2,490 full-time students aged between 16 and 74 in
Crawley in 2011 (or 3% of the overall population). There were 2,423 full-time students aged between
16 and 74 in Horsham in 2011 equating to 2% of the overall population. Table 44 below demonstrates
the percentage change of full-time students between 2001 and 2011 in the two authorities.
Table 51: Changes in Full-Time Students aged 16-74 in Crawley and Horsham 2001-11
Authority 2001 2011 % Change
Crawley 1,658 2,490 50%
Horsham 1,760 2,423 38%
Source: Census data 2001 and 2011
Figure 30 illustrates the percentage of full-time students aged over 16 living in Crawley and Horsham
by their accommodation status based on 2011 Census data. Students in both authorities are
predominantly living with their parents, comprising 79% for Crawley and 80% for Horsham. In
Horsham, 9% of the full-time students live in a communal establishment, 5% live in a one family
household with spouse and 4% live in other household types. In Crawley, 10% of the full-time student
population lives in other household type and 6% live in a one family household with spouse.
Figure 30: Profile of Students aged 16 and over in Crawley and Horsham, 2011
Source: Census 2011
We have sought to consider the change in students’ accommodation structure between the 2001
and 2011 Census in Crawley and Horsham. The table below considers the net change between 2001
and 2011 in total students resident in the authorities aged 16 and over. As it can be seen in both
authorities, there has been a significant increase in students living with parents. In Horsham, the
students living in communal establishments have actually decreased with 81 students and the
numbers have also decreased for students living in other household types (-98).
0% 10% 20% 30% 40% 50% 60% 70% 80% 90%
Living with parents
Living in a communal establishment: Total
Living in all student household
Student living alone
Living in a one family household with spouse,partner or children
Living in other household type
Horsham Crawley

110
Table 52: Changes in Students by Different Accommodation Types, 2011-11
Crawley Net change (2001-2011)
Horsham Net change (2001-2011)
Living with parents 777 1,112
Living in a communal establishment 26 -81
Living in all student household 84 58
Student living alone 13 11
Living in other household type -3 -98
Source: Census 2001 and 2011
Overall, the evidence points to modest numbers of students resident in Crawley and Horsham who
have particular housing needs; and does not suggest any substantive interventions or purpose build
housing provision is necessary.
Housing Needs of Younger People: Summary and Implications
Crawley currently has a higher proportion of younger people (30% of total households) than Horsham (18%) and a housing stock which is more focused towards smaller and more affordable homes, Crawley is projected to see growth of 17% in younger households aged under 40 over the 2019-39 period. In contrast, Horsham is projected to see 22% growth in households headed by someone under 40, representing absolute growth of over 2,500 households to 2039.
From the analysis it is clear that the particular issue affecting younger households is housing affordability. The affordability of housing to buy, and the ability of younger households to access it, has deteriorated further since the previous SHMA; and is now out-of-reach of many younger households. Linked to this, growth has been seen in both households renting and younger people living with parents for younger.
The implications of this is that the delivery of (and access to) affordable housing is very important for younger households and will be important in ensuring that a balanced population profile is maintained in Crawley and Horsham. Constrained availability of housing for younger households’ risks inhibiting their ability to move to or stay within the local area, and this could harm the economy (through affecting the ability of employers to recruit) and may lead to (unsustainable) longer-distance commuting patterns.
A multi-pronged strategy is needed to address the needs of younger households, through promoting delivery of affordable housing through planning policy, including through S106 agreements securing affordable housing on mixed-tenure development schemes as well as supporting affordable housing provision on rural exception and entry-level exception sites. The potential for public sector land to contribute to affordable housing delivery should also be investigated.
It is important to recognise that not all younger households can afford to buy a home, and provision of rented affordable housing will be very important in meeting the needs of those on lower incomes. Similarly, the evidence points to significant growth in households in the Private Rented Sector in recent years, and interventions to improve standards within the sector are clearly justified; as well as support for purpose-built ‘Build-to-Rent’ development. This is considered further in Section 12.

111
NEEDS OF FAMILY HOUSEHOLDS
This section considers the housing needs of family households (generally described as households
with dependent children).
Volumes of Family Households
The number of family households totalled 15,500 in Horsham and 14,100 in Crawley as of the 2011
Census, accounting for 28% and 33% of households respectively. The proportion in Horsham is
similar to that seen in other areas, whilst Crawley has a notably higher proportion of households with
dependent children.
The consultants’ team has used the household projections developed (linked to the standard method)
to estimate growth in family households over the plan period. The detailed profile of these households
is shown in Tables 15 and 16 in Section 5.
Table 53: Expected Growth in Family Households, 2019-39
Family Households, 2019
Family Households, 2039
Change % Change
Horsham 16,988 21,203 4,216 24.8%
Crawley 15,758 19,454 3,696 23.5%
Source: Demographic Modelling
The level of growth in family households does not automatically translate into an equivalent need for
family-sized accommodation, not least as many older households will continue to live in family-sized
properties that offer space for friends and relatives to come and stay. We consider the interaction
between demographics and the need for different sizes of homes further in Section 11.
Housing Characteristics of Family Households
The figures below show the tenure of family households in 2011. There are some considerable
differences by household type with lone parents having a very high proportion living in the social
rented sector and also in private rented accommodation. Only 44% of lone parent households are
owner-occupiers in Horsham compared with 84% of married couples with children – in Crawley these
figures are 26% and 70% respectively.
As well as households containing dependent children, there will be other (non-dependent) children
living as part of another household (typically with parents/grandparents). As considered in Section 5,
9.9% of households in Crawley and 8.9% of households in Horsham included non-dependent
children; with numbers likely to be growing reflecting affordability issues.
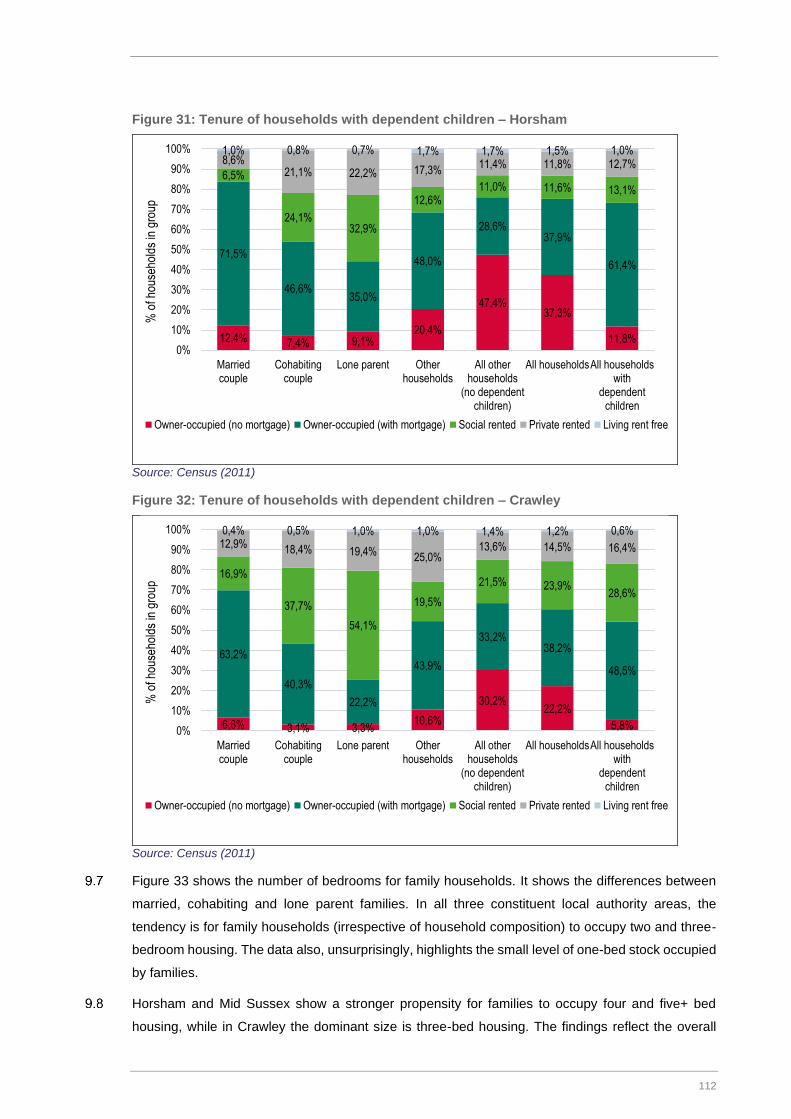
112
Figure 31: Tenure of households with dependent children – Horsham
Source: Census (2011)
Figure 32: Tenure of households with dependent children – Crawley
Source: Census (2011)
Figure 33 shows the number of bedrooms for family households. It shows the differences between
married, cohabiting and lone parent families. In all three constituent local authority areas, the
tendency is for family households (irrespective of household composition) to occupy two and three-
bedroom housing. The data also, unsurprisingly, highlights the small level of one-bed stock occupied
by families.
Horsham and Mid Sussex show a stronger propensity for families to occupy four and five+ bed
housing, while in Crawley the dominant size is three-bed housing. The findings reflect the overall
12,4% 7,4% 9,1%20,4%
47,4%37,3%
11,8%
71,5%
46,6%35,0%
48,0%
28,6%37,9%
61,4%
6,5%
24,1%32,9%
12,6%11,0% 11,6% 13,1%
8,6%21,1% 22,2% 17,3%
11,4% 11,8% 12,7%1,0% 0,8% 0,7% 1,7% 1,7% 1,5% 1,0%
0%
10%
20%
30%
40%
50%
60%
70%
80%
90%
100%
Marriedcouple
Cohabitingcouple
Lone parent Otherhouseholds
All otherhouseholds
(no dependentchildren)
All householdsAll householdswith
dependentchildren
% o
f hou
seho
lds
in g
roup
Owner-occupied (no mortgage) Owner-occupied (with mortgage) Social rented Private rented Living rent free
6,6% 3,1% 3,3%10,6%
30,2%22,2%
5,8%
63,2%
40,3%
22,2%
43,9%
33,2%38,2%
48,5%
16,9%
37,7%
54,1%
19,5%
21,5% 23,9%28,6%
12,9%18,4% 19,4%
25,0%13,6% 14,5% 16,4%
0,4% 0,5% 1,0% 1,0% 1,4% 1,2% 0,6%
0%
10%
20%
30%
40%
50%
60%
70%
80%
90%
100%
Marriedcouple
Cohabitingcouple
Lone parent Otherhouseholds
All otherhouseholds
(no dependentchildren)
All householdsAll householdswith
dependentchildren
% o
f hou
seho
lds
in g
roup
Owner-occupied (no mortgage) Owner-occupied (with mortgage) Social rented Private rented Living rent free
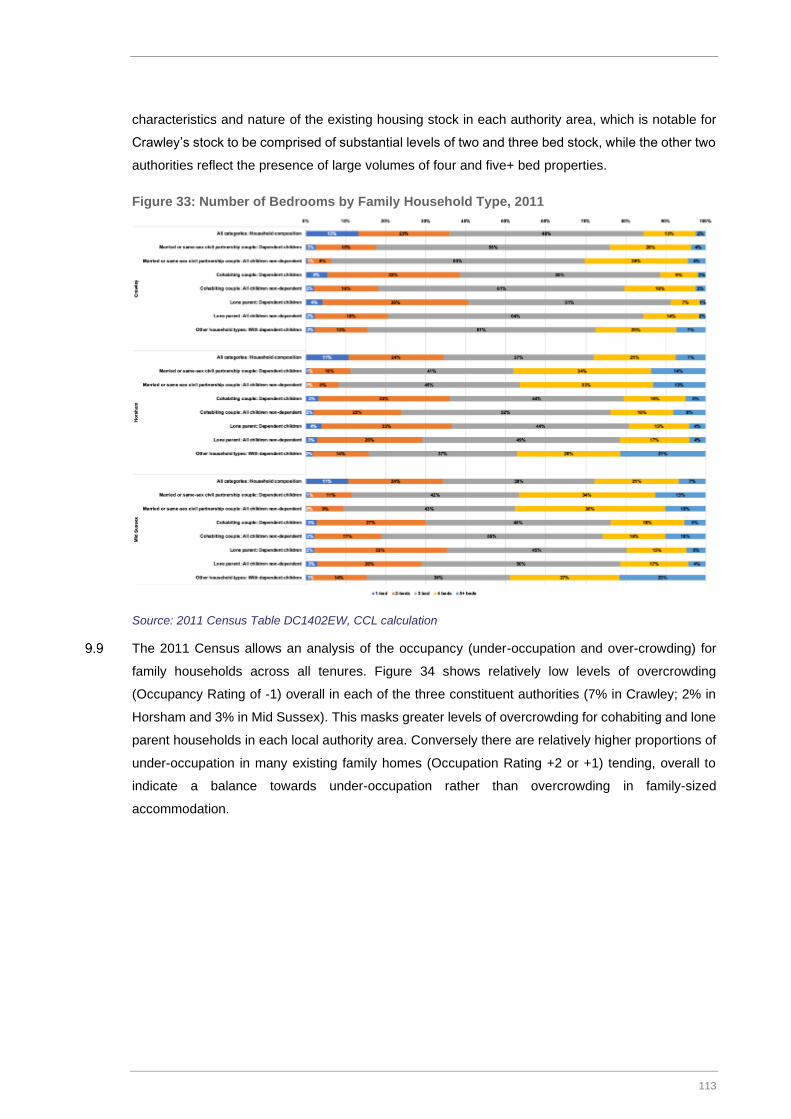
113
characteristics and nature of the existing housing stock in each authority area, which is notable for
Crawley’s stock to be comprised of substantial levels of two and three bed stock, while the other two
authorities reflect the presence of large volumes of four and five+ bed properties.
Figure 33: Number of Bedrooms by Family Household Type, 2011
Source: 2011 Census Table DC1402EW, CCL calculation
The 2011 Census allows an analysis of the occupancy (under-occupation and over-crowding) for
family households across all tenures. Figure 34 shows relatively low levels of overcrowding
(Occupancy Rating of -1) overall in each of the three constituent authorities (7% in Crawley; 2% in
Horsham and 3% in Mid Sussex). This masks greater levels of overcrowding for cohabiting and lone
parent households in each local authority area. Conversely there are relatively higher proportions of
under-occupation in many existing family homes (Occupation Rating +2 or +1) tending, overall to
indicate a balance towards under-occupation rather than overcrowding in family-sized
accommodation.

114
Figure 34: Family Housing Under and Over-Occupation, 2011 Census
Source: 2011 Census Table DC4104EWla, CCL Calculation
Concealed families are another important consideration when looking at issues of family sized
housing and provision of suitable housing choice. A concealed family is defined for the Census as
one family living in a multi-family household in addition to the primary family, such as a young couple
living with parents. It is possible to analyse the levels of concealed families with dependent children
and to look at the difference between lone parent and couple concealed families using Census data.
The 2011 Census indicates that there are relatively modest levels of concealed family households
with dependent children in Northern West Sussex; but clearly provision of family-sized housing may
help to address these needs. Table 54 below provides a summary.
Table 54: Concealed Families with Dependent Children, 2011 Census
Crawley Horsham Mid Sussex
All Families 28,829 38,935 40,284
Concealed: Lone Parent + dependent children 149 93 107
Concealed: Couple + dependent children 107 54 67
Source: Census 2011, Table DC1110EW

115
Barriers for Families in Accessing Suitable Housing
Available Mix and Choice of Housing
The 2009 and 2012 Northern West Sussex SHMAs identified that much of the existing housing
provision is of two- and three-bedroom properties. This 2019 update has also shown that the
dominant housing stock remains two and three bed property.
Demand for family housing is strong across each of the constituent local authorities in the Northern
West Sussex HMA due to a range of factors, including relative affordability compared to London and
other parts of the South East; growing numbers of newly forming family (and younger age)
households; and outward demand pressures arising from Greater London that are increasingly likely
to be unmet.
Delivery of family sized housing remains needed in both urban and rural locations of the HMA. This
includes providing the widest possible choice and mix of housing locations including town centres,
suburban and urban extensions as well as through the sustainable expansion of rural and smaller
settlements (particularly helping to support economic and social vitality).
It is important to deliver a range of housing sizes and to actively promote this through appropriate
planning policies and consideration of the operation of the market. Smaller sized properties have,
anecdotally, been increasingly developed from re-development of former commercial properties in
town centre locations (particularly through the use of Permitted Development Rights to convert
former commercial stock to residential) as well as through purpose-built flatted accommodation and
early signs of a Build to Rent market supporting wider growth in private rental stock.
There is however still a relatively restricted available mix and choice of housing, particularly within
Crawley Borough (less so in Horsham District) available to family sized households and crucially
limitations as to the affordability of larger properties in the context of continued growth in sales prices
and rental values evident across the HMA since the previous SHMA updates were published.
In more rural areas, the opportunity to broaden and secure a choice and mix of family sized
accommodation is supported in terms of relevant Development Plan policies and in many
Neighbourhood Plans (where these have been made) but from analysis of price and rental value
mapping (as shown in Section 4) continues to show a distinct pattern of higher value property prices
and smaller volumes of available stock in smaller settlements and more rural communities. Evidence
of the development of Rural Exception Sites in Horsham (see Section 8) reflects limited delivery of
family sized affordable housing focused on a handful of sites in the District.

116
Affordability and Local Housing Allowance
Affordable rents for family households (as well as securing the initial rental deposit) constitute a key
barrier to accessing housing for some households, as private rents have grown faster than household
incomes and above housing benefit allowances. The relative un-affordability of larger, family sized,
homes for rent can often result in distortions and inefficiency in the market limiting the development
of larger properties despite evident local needs.
The Local Housing Allowance (LHA) sets the amount of housing benefit or Universal Credit housing
element that households in the Private Rented Sector can claim (it is intended to reflect the lowest
30th percentile of local private rents to allow welfare claimants access to the market). LHA has fallen
below market rents, including in Northern West Sussex. Table 55 below shows the difference
between the LHA cap for the Crawley and Reigate Broad Rental Market Area34 and lower quartile
rents (Year to Sept 2018). There is a particular large differential for 3-bed properties. This points to
a restricted ability for the Private Rented Sector in meeting the needs of family-sized households on
lower incomes.
Table 55: Comparison of LQ Rents and LHA Rates
Property Size Monthly LQ Rent, Crawley
Monthly LQ Rent, Horsham
LHA Rates Difference: Crawley
Difference: Horsham
2-bed £950 £850 £854 -£96 £4
3-bed £1,100 £1,100 £993 -£107 -£107
4-bed £1,400 £1,475 £1,382 -£18 -£93
The LHA cap was frozen in 2015, but raised subsequently again by 3% in 2018, relieving some
pressure in higher rental value areas and reducing the pressure, to some limited degree, on local
authority Discretionary Housing Payments. There has however been no increase to the LHA rates
themselves which remain frozen.
Initial Housing Purchase Costs
Initial purchase housing costs, in terms of both deposit sums and Stamp Duty Land Tax (SDLT),
affect all households seeking to purchase market housing.
House purchase deposits have a usual minimum of 10% of sale price, however there is clear
evidence that increased deposits, particularly above 20% are able to attract better value mortgage
finance deals.
For current average lower quartile purchase prices in Cawley and Horsham (£247,000 and £295,000)
respectively, a 10% purchase deposit represents £24,700 - £29,500 respectively. At the 20% level
the sums increase to £49,400 - £59,000. In absolute terms the level of deposit required in order to
secure a market housing purchase have increased substantially linked to increasing sales prices
34 This includes Crawley and most of the main settlements in Horsham District
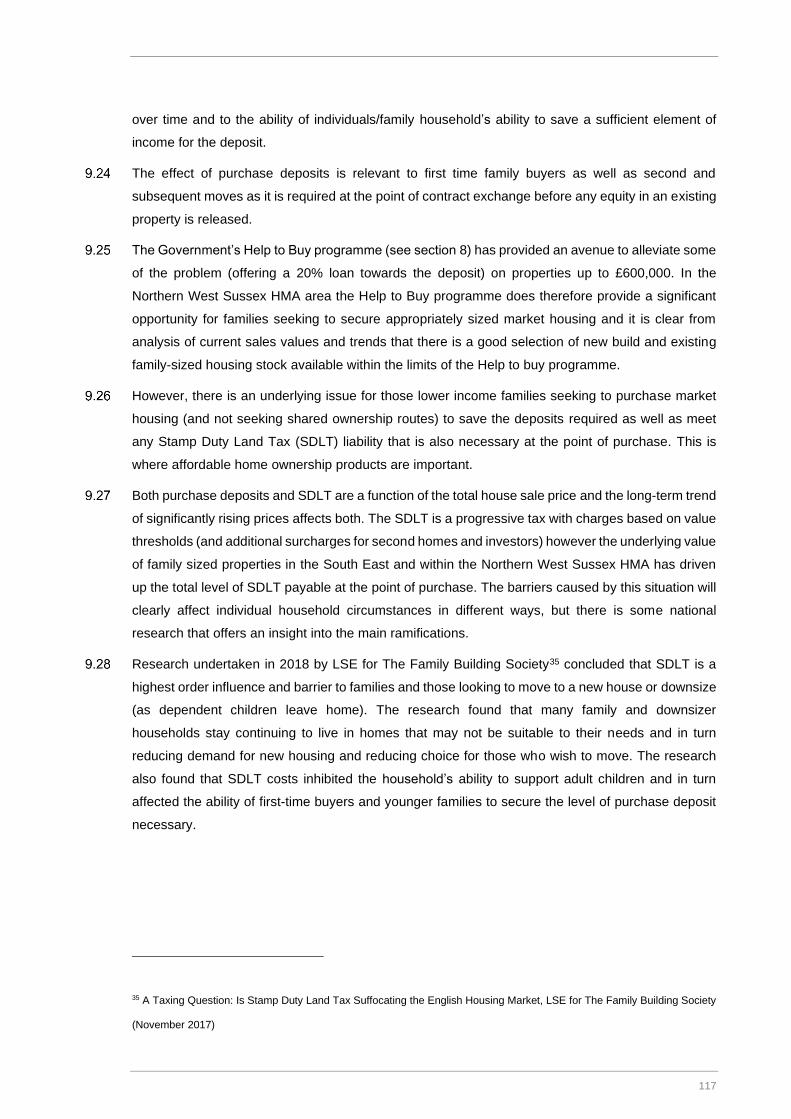
117
over time and to the ability of individuals/family household’s ability to save a sufficient element of
income for the deposit.
The effect of purchase deposits is relevant to first time family buyers as well as second and
subsequent moves as it is required at the point of contract exchange before any equity in an existing
property is released.
The Government’s Help to Buy programme (see section 8) has provided an avenue to alleviate some
of the problem (offering a 20% loan towards the deposit) on properties up to £600,000. In the
Northern West Sussex HMA area the Help to Buy programme does therefore provide a significant
opportunity for families seeking to secure appropriately sized market housing and it is clear from
analysis of current sales values and trends that there is a good selection of new build and existing
family-sized housing stock available within the limits of the Help to buy programme.
However, there is an underlying issue for those lower income families seeking to purchase market
housing (and not seeking shared ownership routes) to save the deposits required as well as meet
any Stamp Duty Land Tax (SDLT) liability that is also necessary at the point of purchase. This is
where affordable home ownership products are important.
Both purchase deposits and SDLT are a function of the total house sale price and the long-term trend
of significantly rising prices affects both. The SDLT is a progressive tax with charges based on value
thresholds (and additional surcharges for second homes and investors) however the underlying value
of family sized properties in the South East and within the Northern West Sussex HMA has driven
up the total level of SDLT payable at the point of purchase. The barriers caused by this situation will
clearly affect individual household circumstances in different ways, but there is some national
research that offers an insight into the main ramifications.
Research undertaken in 2018 by LSE for The Family Building Society35 concluded that SDLT is a
highest order influence and barrier to families and those looking to move to a new house or downsize
(as dependent children leave home). The research found that many family and downsizer
households stay continuing to live in homes that may not be suitable to their needs and in turn
reducing demand for new housing and reducing choice for those who wish to move. The research
also found that SDLT costs inhibited the household’s ability to support adult children and in turn
affected the ability of first-time buyers and younger families to secure the level of purchase deposit
necessary.
35 A Taxing Question: Is Stamp Duty Land Tax Suffocating the English Housing Market, LSE for The Family Building Society
(November 2017)

118
Welfare Benefits, Universal Credit and Local Housing Allowance
The changing nature of welfare benefits payments, particularly housing benefits and the introduction
and shift to Universal Credit have direct implications for lower earning and economically inactive
households.
The operation of the welfare benefit cap has been in place now for a number of years, restricting the
total amount of benefit (including housing benefits) which in turn serves to restrict housing (and
locational) choice and opportunity for those family households affected. This has served to form a
potential barrier to accessing family housing.
The maximum amount of welfare and housing benefit is capped currently at £384.62 per week or
£1,666.67 per month (outside London) for families with children and couples. The benefit cap applies
as soon as the household income from benefits would otherwise exceed it.
The welfare cap does not apply to housing benefits if sufficient hours are worked to qualify for working
tax credit. For a lone parent this is 16 hours worked per week; for families this is 24 hours per week
(with one person working at least 16 hours). There are exemptions for those with disabilities or carer
attendance responsibilities.
In addition to restrictions arising from welfare caps, those households that are Universal Credit
claimants are limited (after 6th April 2017) in terms of claiming additional amounts for a third or
subsequent child which inevitably restricts larger family household incomes for those claiming
Universal Credit.
A further difficulty has been widely reported in terms of individuals and family households switching
from benefit payments into the Universal Credit system with widely reported delays and significant
gaps between the last benefit payment and the first payment by Universal Credit. This has, in some
instances been compounded by Universal Credit payments (including money to cover housing costs)
being paid directly to the individual/household rather to the local authority or landlord. There are,
anecdotally, significant instances where such individuals/households have been unable to budget
appropriately leading to a failure to pay housing rental charges when they are due.
Private Landlord Attitudes to Low Income Family Households
At a national level, there are well documented changes in the attitudes of private rental landlords to
let properties to low income families and particularly those in receipt of LHA benefits or the Universal
Credit housing elements. Survey work undertaken by Shelter36 indicates that landlord reluctance has
increased over time driven by the welfare reforms and increasing negative perceptions of uncollected
rents and difficulties in securing tenant arrears and longer-term housing debts. This affects the ability
of low-income family (and other) households to access housing in the Private Rented Sector.
36 Shut Out: The Barriers Low Income Households Face in Private Renting (June 2017), Shelter

119
Military Service Families
Paragraph 61 of the NPPF seeks to ensure that the housing needs of different groups are assessed
and reflected in planning policies. The paragraph lists various different groups including service
families. Military personnel are listed as part of the definition of essential local workers in Annex 2 of
the NPPF.
The Armed Forces Covenant (May 2011) was published by the Ministry of Defence and describes a
moral obligation that the Government and the Nation owe to those who serve or have served in the
Armed Forces and to their families. With respect to housing (page 7) the Covenant states:
In addressing the accommodation requirements of Service personnel, the MOD seeks to
promote choice, recognising the benefits of stability and home ownership amongst members of
the Armed Forces where this is practicable and compatible with Service requirements, and also
that their needs alter as they progress through Service and ultimately return to civilian life.
Where Serving personnel are entitled to publicly provided accommodation, it should be of good
quality, affordable, and suitably located. They should have priority status in applying for
Government-sponsored affordable housing schemes, and Service leavers should retain this
status for a period after discharge. Personnel may have access to tailored Armed Forces
housing schemes or financial arrangements, depending on their circumstances, to help them in
purchasing their own property. Those injured in Service should also have preferential access to
appropriate housing schemes, as well as assistance with necessary adaptations to private
housing or Service accommodation whilst serving. Members of the Armed Forces Community
should have the same access to social housing and other housing schemes as any other citizen,
and not be disadvantaged in that respect by the requirement for mobility whilst in Service.
Government has acted to implement various measures aimed at strengthening the position of ex-
military personnel when seeking to access housing and support.
From 2012, Government revised national guidance to include measures to: set new “priority need”
categories to assist homeless ex-service personnel in accordance with the Housing Act 1996;
change the rules on local connection to ensure that barriers are removed in accessing social housing;
and include ex-military personnel as a priority category in terms of eligibility for certain low-cost home
ownership initiatives.
There has therefore been a national emphasis and obligation to support ex-service personnel in
terms of their housing and the rehabilitation care needed to honour the implementation of the Armed
Forces Covenant.
There are a number of housing schemes that are available to the Service and Ex-Service community
under the HomeBuy umbrella. In addition, the MoD Referral Scheme aims to provide low-cost, rented
accommodation for service personnel on leaving the Services.
Analysis of 2011 Census data for members of the military services (aged 16+ years) who are usually
resident in the constituent Northern West Sussex HMA local authorities does not identify any service

120
personnel. This does not mean that there are no such personnel within the local authority areas, but
the Census data disclosure policy prevents data from being produced for local authorities which fail
to meet a minimum threshold in the number of Armed Forces persons resident or working in the area.
In this case, that threshold is not met.
The overall number of service personnel living in Northern West Sussex HMA must therefore (as at
the date of the 2011 Census) represent a very small proportion of the total population aged 16+. The
housing needs of service families are included within the overall housing needs for the Northern West
Sussex HMA.
Housing Needs of Family Households: Summary and Implications Families (households with dependent children) represent a significant component of households in Horsham and Crawley (28% and 33% respectively). Both areas are projected to see substantive growth in family households moving forwards, with 25% growth in family households in Horsham and 23% in Crawley. Families typically occupy properties of two or more bedrooms. The analysis does not point towards significant current levels of overcrowded households or concealed families, albeit that overcrowding is higher in Crawley (7% of households in 2011). The strength of the flatted market in recent years together with permitted development rights have seen strong levels of delivery of flatted development; and the analysis undertaken points in particular to a restricted mix and choice of housing in Crawley for family households in both market and affordable sectors. In Horsham there has been limited development of affordable family housing. Looking forwards, it is important to recognise that it is not just families which occupy family-sized accommodation; with many older people typically occupying homes which have more bedrooms that they might ‘need’ given the size of the household. This is particularly the case in the market sector, and many older persons seek additional space to allow friends and relatives to come and stay. Providing suitable housing for older households to downsize is one (and an important) means of supporting fluidity in the housing market and maintaining a supply of family housing for younger households. Delivery of family housing will however also remain important. The analysis in this section has highlighted particular issues around the affordability of market housing for family households on lower incomes, in particular as lower quartile house prices are above Local Housing Allowance rates (and particularly so for 3-bed properties). This emphasises the important role for the delivery of family-sized affordable housing in ensuring that there is adequate supply of housing available for lower income households and promotes setting rents for larger properties at levels which do not exceed LHA levels.

121
NEEDS OF OLDER PERSONS & THOSE WITH DISABILITIES
This section studies the characteristics and housing needs of the older person population and the
population with some form of disability. The two groups are taken together as there is a clear link
between age and disability. It includes an assessment of the need for specialist accommodation for
older people and the potential requirements for housing to be built to M4(2) and M4(3) housing
technical standards (accessibility and wheelchair standards).
Understanding the Implications of Demographic Changes
The population of older persons is increasing driven by demographic changes including increasing
life expectancy. This is a key driver of the need for housing which is capable of meeting the needs
of older persons, and therefore a sensible first stage of analysis.
Current Population of Older People
The table below provides baseline population data about older persons and compares this with other
areas. The data for has been taken from the published 2017 ONS mid-year population estimates.
Horsham has a relatively old population structure, with the opposite being true in Crawley. There is
also a notable difference when comparing urban and rural parts of Horsham District.
Table 56: Older Person Population (2017)
Horsham
– urban
Horsham
– rural
Horsham
District Crawley
West
Sussex
South
East England
Under 65 81.6% 73.2% 77.7% 86.7% 77.4% 80.9% 82.0%
65-74 9.9% 14.4% 12.0% 7.2% 11.9% 10.3% 9.9%
75-84 5.8% 8.6% 7.1% 4.0% 7.2% 6.0% 5.7%
85+ 2.7% 3.9% 3.2% 2.2% 3.5% 2.8% 2.4%
Total 100.0% 100.0% 100.0% 100.0% 100.0% 100.0% 100.0%
Total 65+ 18.4% 26.8% 22.3% 13.3% 22.6% 19.1% 18.0%
Source: ONS 2017 mid-year population estimates
Future Change in the Population of Older People
As well as providing a baseline position for the proportion of older persons in the District, population
projections can be used to provide an indication of how the numbers might change in the future
compared with other areas. The data presented below uses information from the projections
previously developed to link to the Standard Method.
Both local authorities are projected to see a notable increase in the older person population, with the
total number of people aged 65 and over projected to increase by 61% over the 20-years to 2039 in
Horsham and 63% in Crawley. This compares with overall population growth of 24% in each case
and a more modest increase in the Under 65 population.

122
In total population terms, the projections for Horsham show an increase in the population aged 65
and over almost 20,000 people. This is against a backdrop of an overall increase of 34,700 –
population growth of people aged 65 and over therefore accounts for 58% of the total projected
population change.
In Crawley, growth in the 65 and over population accounts for 35% of the total projected change with
growth of 9,600 persons between 2019-39 aged 65+.
Table 57: Projected Change in Population of Older Persons (2019 to 2039) – Horsham
2019 2039 Change in population % change
Under 65 109,628 124,366 14,739 13.4%
65-74 17,125 23,432 6,306 36.8%
75-84 10,851 18,886 8,035 74.0%
85+ 4,739 10,358 5,619 118.6%
Total 142,343 177,042 34,699 24.4%
Total 65+ 32,716 52,676 19,960 61.0%
Source: Demographic Projections
Table 58: Projected Change in Population of Older Persons (2019 to 2039) – Crawley
2019 2039 Change in population % change
Under 65 97,736 115,324 17,588 18.0%
65-74 8,427 12,554 4,126 49.0%
75-84 4,501 8,512 4,012 89.1%
85+ 2,374 3,801 1,427 60.1%
Total 113,038 140,191 27,153 24.0%
Total 65+ 15,302 24,866 9,565 62.5%
Source: Demographic Projections
Characteristics of Older Person Households
The figures below show the tenure of older person households. The data has been split between
single older person households and those with two or more older people (which will largely be
couples). The data shows that older person households are relatively likely to live in outright owned
accommodation (74% in Horsham and 59% in Crawley) and are also more likely than other
households to be in the social rented sector. The proportion of older person households living in the
private rented sector is relatively low (4% in Horsham and 2% in Crawley). Overall 60% of older
persons in Crawley are home-owners and 75% in Horsham.
There are also notable differences for different types of older person households with single older
people having a much lower level of owner-occupation than larger older person households – this
group also has a much higher proportion living in the social rented sector.
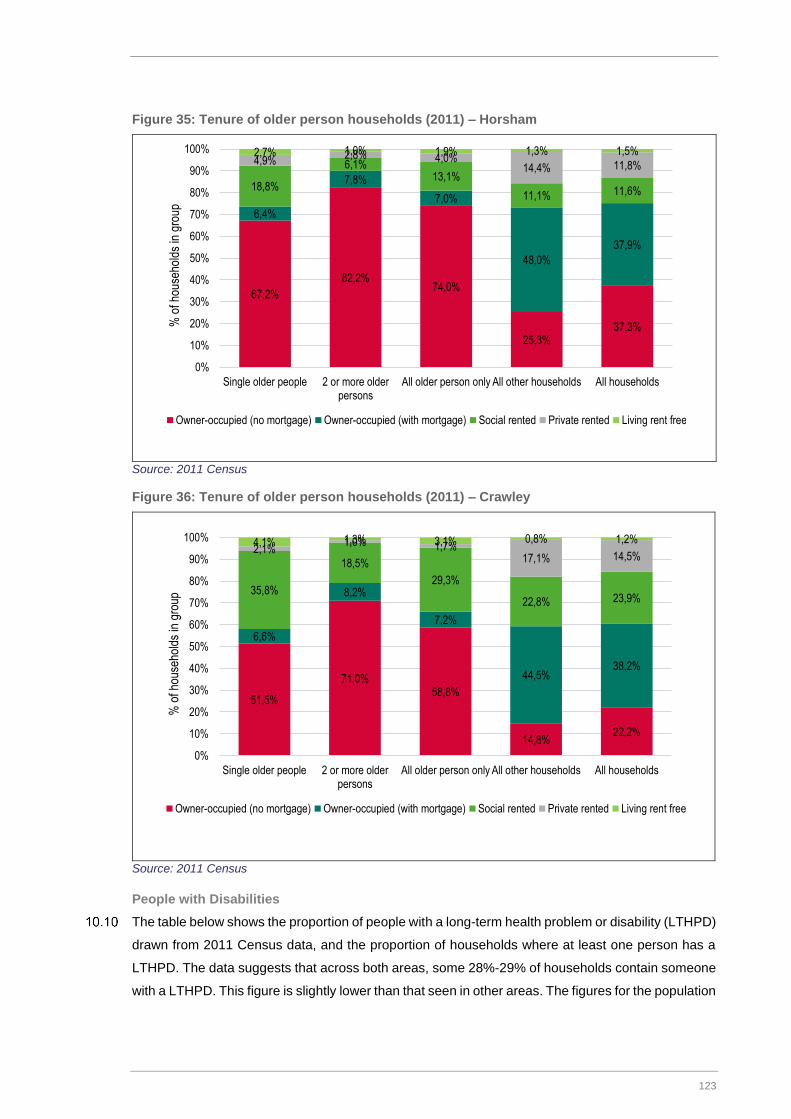
123
Figure 35: Tenure of older person households (2011) – Horsham
Source: 2011 Census
Figure 36: Tenure of older person households (2011) – Crawley
Source: 2011 Census
People with Disabilities
The table below shows the proportion of people with a long-term health problem or disability (LTHPD)
drawn from 2011 Census data, and the proportion of households where at least one person has a
LTHPD. The data suggests that across both areas, some 28%-29% of households contain someone
with a LTHPD. This figure is slightly lower than that seen in other areas. The figures for the population
67,2%
82,2%74,0%
25,3%37,3%
6,4%
7,8%
7,0%
48,0%
37,9%
18,8%
6,1%13,1%
11,1% 11,6%
4,9%2,8% 4,0%
14,4% 11,8%2,7% 1,0% 1,9% 1,3% 1,5%
0%
10%
20%
30%
40%
50%
60%
70%
80%
90%
100%
Single older people 2 or more olderpersons
All older person only All other households All households
% o
f hou
seho
lds
in g
roup
Owner-occupied (no mortgage) Owner-occupied (with mortgage) Social rented Private rented Living rent free
51,5%
71,0%58,8%
14,8%22,2%
6,6%
8,2%
7,2%
44,5%38,2%
35,8%
18,5%
29,3%
22,8% 23,9%
2,1%1,0% 1,7%
17,1% 14,5%4,1% 1,3% 3,1% 0,8% 1,2%
0%
10%
20%
30%
40%
50%
60%
70%
80%
90%
100%
Single older people 2 or more olderpersons
All older person only All other households All households
% o
f hou
seho
lds
in g
roup
Owner-occupied (no mortgage) Owner-occupied (with mortgage) Social rented Private rented Living rent free
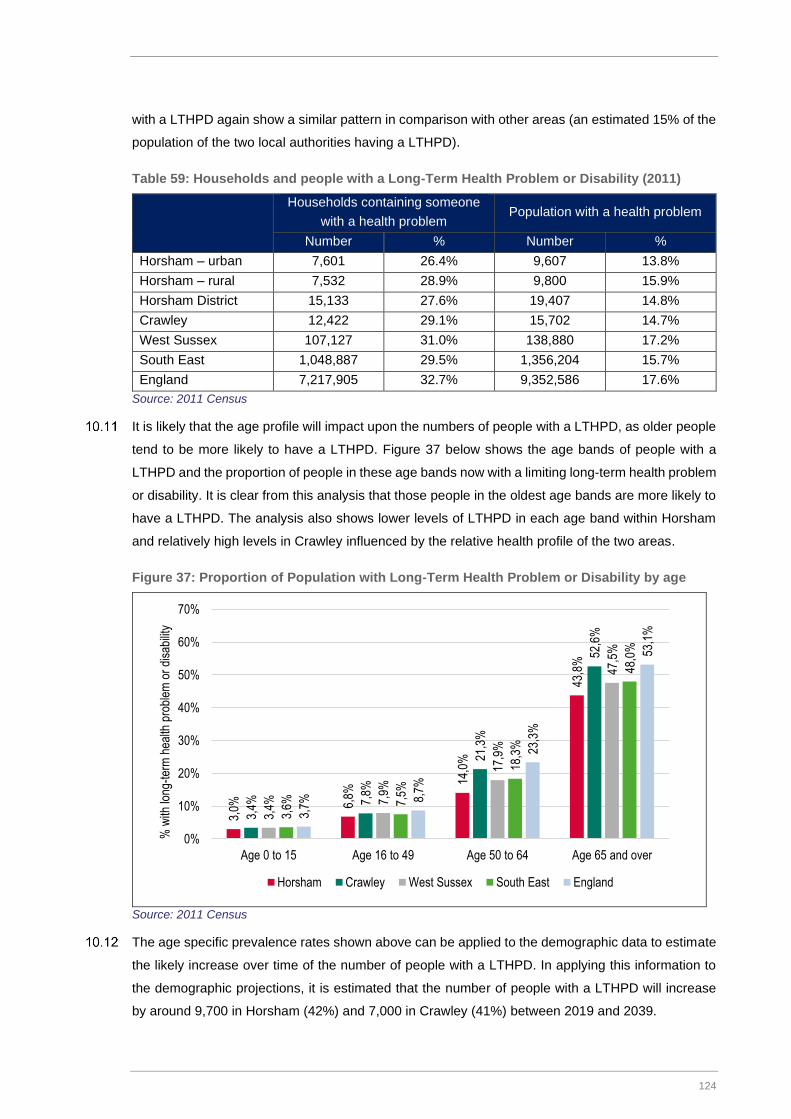
124
with a LTHPD again show a similar pattern in comparison with other areas (an estimated 15% of the
population of the two local authorities having a LTHPD).
Table 59: Households and people with a Long-Term Health Problem or Disability (2011)
Households containing someone
with a health problem Population with a health problem
Number % Number %
Horsham – urban 7,601 26.4% 9,607 13.8%
Horsham – rural 7,532 28.9% 9,800 15.9%
Horsham District 15,133 27.6% 19,407 14.8%
Crawley 12,422 29.1% 15,702 14.7%
West Sussex 107,127 31.0% 138,880 17.2%
South East 1,048,887 29.5% 1,356,204 15.7%
England 7,217,905 32.7% 9,352,586 17.6%
Source: 2011 Census
It is likely that the age profile will impact upon the numbers of people with a LTHPD, as older people
tend to be more likely to have a LTHPD. Figure 37 below shows the age bands of people with a
LTHPD and the proportion of people in these age bands now with a limiting long-term health problem
or disability. It is clear from this analysis that those people in the oldest age bands are more likely to
have a LTHPD. The analysis also shows lower levels of LTHPD in each age band within Horsham
and relatively high levels in Crawley influenced by the relative health profile of the two areas.
Figure 37: Proportion of Population with Long-Term Health Problem or Disability by age
Source: 2011 Census
The age specific prevalence rates shown above can be applied to the demographic data to estimate
the likely increase over time of the number of people with a LTHPD. In applying this information to
the demographic projections, it is estimated that the number of people with a LTHPD will increase
by around 9,700 in Horsham (42%) and 7,000 in Crawley (41%) between 2019 and 2039.
3,0% 6,
8%
14,0
%
43,8
%
3,4% 7,
8%
21,3
%
52,6
%
3,4% 7,
9%
17,9
%
47,5
%
3,6% 7,
5%
18,3
%
48,0
%
3,7%
8,7%
23,3
%
53,1
%
0%
10%
20%
30%
40%
50%
60%
70%
Age 0 to 15 Age 16 to 49 Age 50 to 64 Age 65 and over
% w
ith lo
ng-t
erm
hea
lth p
robl
em o
r di
sabi
lity
Horsham Crawley West Sussex South East England

125
Across the area, most of this increase is expected to be in age groups aged 65 and over. The
population increase of people with a LTHPD represents between 26% (Crawley) and 28% (Horsham)
of the total increase in the population estimated by the projections.
Table 60: Estimated change in population with LTHPD (2019-2039) – linked to Standard
Method housing need
Population with LTHPD Change (2019-
39)
% change from
2019 2019 2039
Horsham 23,045 32,738 9,693 42.1%
Crawley 17,269 24,264 6,995 40.5%
Source: Derived from demographic modelling and Census (2011)
The figure below shows the tenures of people with a LTHPD in 2011 – it should be noted that the
data is for 'population living in households' rather than 'households'. The analysis clearly shows that
people with a LTHPD are more likely to live in social rented housing or are also more likely to be
outright owners (this will be linked to the age profile of the population with a disability). Given that
typically the lowest incomes are found in the social rented sector, and to a lesser extent for outright
owners, the analysis would suggest that the population/households with a disability are likely to be
relatively disadvantaged when compared to the rest of the population.
Figure 38: Tenure of people with LTHPD (2011)
Source: Census (2011)
The table below shows further information about the tenure split of the household population with a
LTHPD. This shows that people living in the social rented sector are around twice as likely to have a
LTHPD than those in other tenures.
50,9%
27,5% 30,8% 32,0%
15,1% 17,6%
20,2%
50,2% 45,9%
22,9%46,6% 43,2%
19,5% 9,4% 10,8%
35,7% 20,8% 22,9%
9,4% 12,9% 12,4% 9,4%17,5% 16,3%
Horsham - withLTHPD
Horsham -without LTHPD
Horsham - totalhouseholdpopulation
Crawley - withLTHPD
Crawley -without LTHPD
Crawley - totalhouseholdpopulation
% o
f hou
seho
lds
in g
roup
Owner-occupied (no mortgage) Owner-occupied (with mortgage) Social rented Private rented & other

126
Table 61: Tenure of people with a LTHPD
% of social rent with LTHPD % of other tenures with
LTHPD
Horsham 25.5% 12.7%
Crawley 22.4% 12.0%
Source: Census (2011)
Health-related Population Projections
In addition to providing projections about how the number and proportion of older people is expected
to change in the future the analysis can look at the likely impact on the number of people with specific
illnesses or disabilities. For this, data from the Projecting Older People Information System (POPPI)
website has been used. The website provides prevalence rates for different disabilities by age and
sex for those aged 65+. For the purposes of this study, analysis has focussed on estimates of the
number of people with dementia and mobility problems.
The table below shows that both of the illnesses/disabilities are expected to increase significantly in
the future as the population grows. In particular, there is projected to be a large rise in the number of
people with dementia with an increase of 68% in Crawley and 92% in Horsham to 2039; along with
an increase in the number with mobility problems of 76% in Horsham and 63% in Crawley.
When related back to the total projected change to the population, the increase of 4,700 people with
a mobility problem in Horsham represents 13% of the total population growth projected by linking to
the Standard Method, with a lower 7% figure for Crawley.
It should be noted that there will be an overlap between dementia and mobility problems (i.e. some
people will have both types of illness/disability). Hence the numbers for each of the
illnesses/disabilities should not be added together to arrive at a total.
Table 62: Estimated Population Change for range of Health Issues (2019 to 2039) – linked to
Standard Method housing need
Type of illness/
disability 2019 2039 Change % increase
Horsham Dementia 2,374 4,561 2,187 92.1%
Mobility problems 6,121 10,800 4,679 76.4%
Crawley Dementia 1,109 1,866 757 68.2%
Mobility problems 2,869 4,677 1,808 63.0%
Source: Data from POPPI and demographic projections
Whilst many older persons will continue to live in mainstream housing, Iceni consider that it would
be sensible to design housing so that it can be adapted to households changing needs. Subject to
viability testing, we would recommend that new housing is delivered to Part M4(2) ‘accessible and
adaptable’ standards.

127
Need for Specialist Accommodation for Older Persons
Given the ageing population and higher levels of disability and health problems amongst older people
there is likely to be an increased requirement for specialist housing options moving forward.
The prevalence rates used in analysis are based on the Housing LIN Strategic Housing for Older
People Analysis Tool (SHOP@). This sets out a series of baseline rates which form a starting point
for assessing appropriate prevalence rates to apply. These baseline rates are:
• Housing with Support (retirement/sheltered housing) – 125 units per 1,000 population aged 75
and over;
• Housing with Care (enhanced sheltered and extra-care housing) – 45 units per 1,000 population
aged 75 and over; and
• Residential care bedspaces (residential and nursing care) – 110 units (bedspaces) per 1,000
population aged 75 and over.
Following the Housing LIN methodology, an initial adjustment has then been made to these rates to
reflect the relative health of the local older person population. This has been based on Census data
about the proportion of people aged 65 and over who have a long-term health problem or disability
compared with the England average. In Horsham, the data shows a fairly healthy older person
population and so the prevalence rates used have been reduced. In Crawley, the health of older
persons looks to be roughly similar to the national position and so only a modest adjustment has
been made.
A second local adjustment has been to estimate a tenure split for the housing with support and
housing with care categories (no tenure is associated with residential care bedspaces). This again
draws on suggestions in the Shop@ tool which suggests that less deprived local authorities could
expect a higher proportion of their specialist housing to be in the market sector. Using the 2015 Index
of Multiple Deprivation the analysis therefore suggests a slightly higher need for market homes in
Horsham than Crawley (as a proportion of totals).
This analysis suggests a need for 140 units of accommodation per 1,000 population aged 75 and
over in Horsham, and of these 88 (63%) are for market housing. In Crawley, the analysis is based
on a need for 168 units per 1,000, with 94 (56%) being in the market sector.
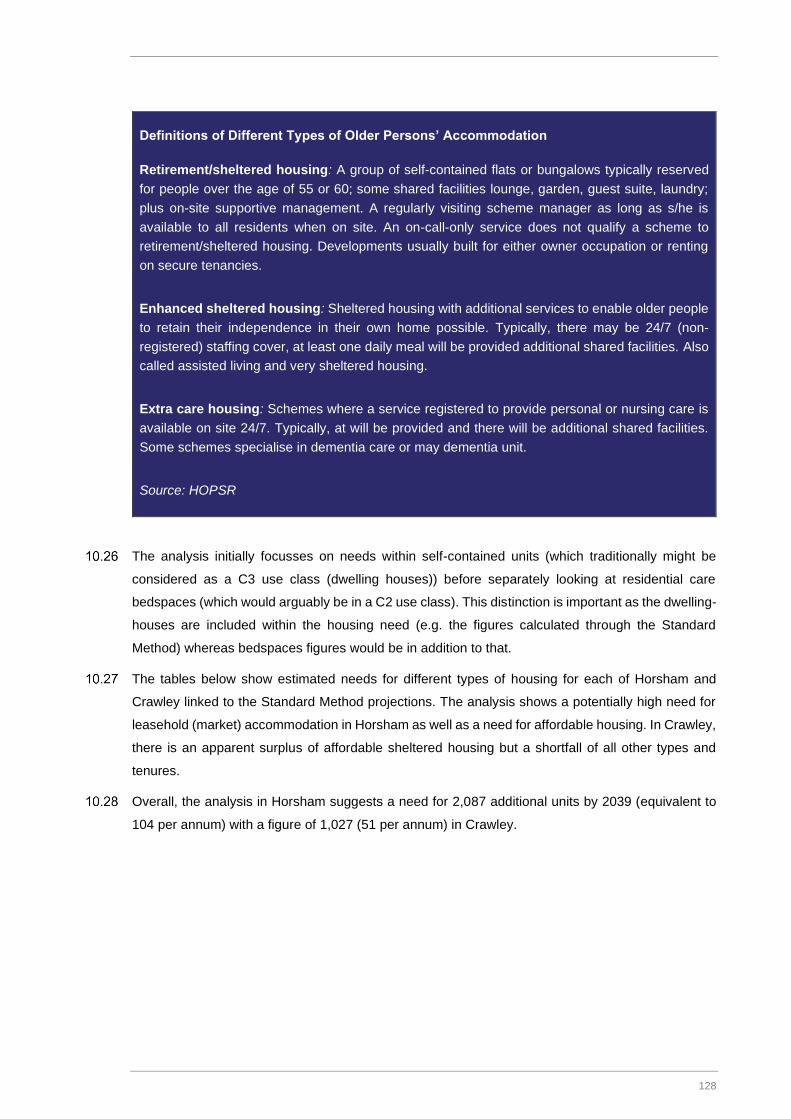
128
Definitions of Different Types of Older Persons’ Accommodation
Retirement/sheltered housing: A group of self-contained flats or bungalows typically reserved
for people over the age of 55 or 60; some shared facilities lounge, garden, guest suite, laundry;
plus on-site supportive management. A regularly visiting scheme manager as long as s/he is
available to all residents when on site. An on-call-only service does not qualify a scheme to
retirement/sheltered housing. Developments usually built for either owner occupation or renting
on secure tenancies.
Enhanced sheltered housing: Sheltered housing with additional services to enable older people
to retain their independence in their own home possible. Typically, there may be 24/7 (non-
registered) staffing cover, at least one daily meal will be provided additional shared facilities. Also
called assisted living and very sheltered housing.
Extra care housing: Schemes where a service registered to provide personal or nursing care is
available on site 24/7. Typically, at will be provided and there will be additional shared facilities.
Some schemes specialise in dementia care or may dementia unit.
Source: HOPSR
The analysis initially focusses on needs within self-contained units (which traditionally might be
considered as a C3 use class (dwelling houses)) before separately looking at residential care
bedspaces (which would arguably be in a C2 use class). This distinction is important as the dwelling-
houses are included within the housing need (e.g. the figures calculated through the Standard
Method) whereas bedspaces figures would be in addition to that.
The tables below show estimated needs for different types of housing for each of Horsham and
Crawley linked to the Standard Method projections. The analysis shows a potentially high need for
leasehold (market) accommodation in Horsham as well as a need for affordable housing. In Crawley,
there is an apparent surplus of affordable sheltered housing but a shortfall of all other types and
tenures.
Overall, the analysis in Horsham suggests a need for 2,087 additional units by 2039 (equivalent to
104 per annum) with a figure of 1,027 (51 per annum) in Crawley.

129
Table 63: Older Persons’ Dwelling Requirements 2019 to 2039 - Horsham
Housing
demand
per
1,000
75+
Current
supply
2019
demand
Current
shortfall/
(surplus)
Additional
demand
to 2039
Shortfall/
(surplus)
by 2039
Housing with
support 37
Rented 36 912 556 -35638 487 131
Leasehold 67 968 1,050 82 919 1,001
Housing with
care
Rented 16 97 244 147 213 360
Leasehold 21 32 334 302 293 595
Total 140 2,009 2,183 174 1,912 2,087
Source: Derived from demographic projections and Housing LIN/HOPSR/EAC
Table 64: Older Persons’ Dwelling Requirements 2019 to 2039 – Crawley
Housing
demand
per
1,000
75+
Current
supply
2019
demand
Current
shortfall/
(surplus)
Additional
demand
to 2039
Shortfall/
(surplus)
by 2039
Housing with
support
Rented 52 781 359 -422 284 -138
Leasehold 72 167 492 325 389 715
Housing with
care
Rented 22 98 152 54 120 175
Leasehold 22 0 154 154 122 276
Total 168 1,046 1,157 111 916 1,027
Source: Derived from demographic projections and Housing LIN/HOPSR/EAC
The figures provided above should be treated as indicative as there is no nationally agreed set of
prevalence rates (or how these might be adjusted for local factors). The Councils should consider
reviewing this evidence if a specific application comes in for older persons housing, where this is
supported by its own needs assessment.
Older Persons’ Housing Needs (Residential Care Bedspaces)
The analysis below provides the same style of outputs (drawing on the same sources) for the
estimated need for care home bedspaces. The analysis draws on that above, including making
adjustments for the relative health of the population of the two local authorities. It should be noted
that the rows in tables are for bedspaces and do not have an associated tenure. The box below
shows the definition of care beds assumed for this assessment.
37 These terms are defined at Para 10.22
38 The negative figure here denotes a notional current surplus of rented ‘housing with support’ albeit that there is a shortfall of
leasehold provision.

130
Definitions of Different Types of Older Persons’ Accommodation (C2 use class)
Care homes: Residential settings where a number of older people live, usually in single rooms,
and have access personal care services (such as help with washing and eating).
Care homes with nursing: These homes are similar to those without nursing care, but they also
have registered provide care for more complex health needs.
Source: HOPSR
The table below shows the prevalence rates used and the need associated with these. The analysis
shows a current shortfall in both areas and notable projected future need. Overall, it is estimated that
there is a need for around 1,500 additional bedspaces in Horsham to 2039 and just over 1,000 in
Crawley.
Table 65: Older Persons’ Care Bedspace requirements 2019 to 2039
Housing
demand
per 1,000
75+
Current
supply
2019
demand
Current
shortfall/
(surplus)
Additional
demand to
2039
Shortfall/
(surplus)
by 2039
Horsham 91 1,133 1,413 280 1,237 1,517
Crawley 109 312 749 437 592 1,029
Source: Derived from demographic projections and Housing LIN/HOPSR/EAC
Older Persons’ Housing and Planning Use Classes
It is worth briefly discussing the Use Classes that Older Persons housing would fall into as there is
some lack of clarity (particularly when it comes to Extra-care housing). The Use Classes Order sets
out different categories of residential use and makes a distinction between residential institutions
(Class C2) and dwelling-houses (Class C3). Care is defined in the Use Class Order as meaning
“personal care for people in need of such care by reason of old age, disablement, past or present
dependence on alcohol or drugs or past or present mental disorder, and in class C2 also includes
the personal care or children and medical care and treatment.”
The C2/C3 distinction is important as it can impact on the ability of a local authority to seek an
affordable housing contribution from a development.
There is case law (at planning appeals and in the courts) on the definitions of both. There is no
government guidance on which use class ‘extra care housing’ falls into. It is for the decision maker
to decide, depending on the individual circumstances of each case.
Government has released new Planning Practice Guidance of Housing for Older and Disabled
People in June 2019. In respect of Use Classes, Para 63-014 therein states that:
“It is for a local planning authority to consider into which use class a particular development may fall.
When determining whether a development for specialist housing for older people falls within C2

131
(Residential Institutions) or C3 (Dwellinghouse) of the Use Classes Order, consideration could, for
example, be given to the level of care and scale of communal facilities provided.”
The relevant factors identified herein are the level of care which is provided, and the scale of
communal facilities. It is notable that no reference is made to whether units of accommodation have
separate front doors. Iceni view this as consistent with the Use Class Order, where it is the ongoing
provision of care which is the distinguishing feature within the C2 definition. In a C2 use, the provision
of care is an essential and ongoing characteristics of the development and would normally be
secured as such through the S106 Agreement.
Iceni has reviewed a range of appeal decisions which have addressed issues relating to how to
define the use class of a development. These are fact specific, and there is a need to consider the
particular nature of the scheme. What arises from this, is that schemes which have been accepted
as a C2 use commonly demonstrate the following characteristics:
a. Occupation restricted to people (at least one within a household) in need of personal care, with
an obligation for such residents to subscribe to a minimum care package. Whilst there has been
debate about the minimum level of care to which residents must sign-up to, Iceni’s view is that
this should not be determinative given that a) residents’ care needs would typically change over
time, and in most cases increase; and b) for those without a care need the relative costs
associated with the care package would be off-putting.
b. Provision of access to a range of communal areas and facilities, typically beyond that of simply
a communal lounge, with the access to these facilities typically reflected in the service charge.
Iceni considers that the Use Class on its own need not be determinative on whether affordable
housing provision could be applied. But nor does it provide any hook to justify seeking provision from
a C2 use in the absence of a development plan policy which seeks to do so.
The 2019 NPPF sets out in Para 34 that Plans should set out the contributions expected from
development, including levels of affordable housing. Such policies should not undermine the
deliverability of the Plan. Para 62 states that where a need for affordable housing is identified,
planning policies should specify the type of affordable housing required, and expect it to be met on-
site unless off-site provision or a financial contribution can be robustly justified; and the agreed
approach contributes to the objective of creating mixed and balanced communities.
Para 63 states that affordable housing should not be sought from residential developments that are
not major developments. Para 64 sets out that specialist accommodation for a group of people with
specific needs (such as purpose-built accommodation for the elderly or students) are exempt from
the requirement for 10% of homes (as part of the affordable housing contribution) to be for affordable
home ownership. But neither of these paragraphs set out that certain types of specialist
accommodation for older persons are exempt from affordable housing contributions.
The implication is that, in Iceni’s view:
• The ability to seek affordable housing contributions from a C2 use at the current time
influenced by how its current development plan policies were constructed and evidenced;

132
• If policies in a new development plan are appropriately crafted, and supported by the
necessary evidence on need and viability, affordable housing contributions could be sought
from a C2 use through policies in a new Local Plan.
It is however important to recognise that the viability of extra care housing will differ from general
mixed tenure development schemes, not least as there are typically significant levels of communal
space and on-site facilities; higher construction and fit-out costs; and slower sales rates as there are
less off-plan sales. There are also practical issues associated with how mixed tenure schemes may
operate. The Councils needs to consider these issues in crafting policies.
It can be difficult in some circumstances for developers of specialist housing for older persons to
compete with other developers for land. To support the delivery of specialist accommodation, it may
be appropriate for the Councils to consider making specific land allocations for specialist housing for
older persons within new Local Plans.
Ultimately for the purposes of seeking affordable housing, we would recommend that the Councils in
developing new planning policies consider the specific viability of extra care housing schemes as
part of preparing viability evidence within the plan-making process.
Wheelchair User Housing
Information about the need for housing for wheelchair users is difficult to obtain (particularly at a local
level) National data within a research report by Habinteg Housing Association and London South
Bank University (Supported by the Homes and Communities Agency) entitled Mind the Step: An
estimation of housing need among wheelchair users in England has therefore been used. This report
provides information at a national and regional level although there are some doubts about the
validity even of the regional figures; hence the focus herein is on national data.
The report identifies that around 84% of homes in England do not allow someone using a wheelchair
to get to and through the front door without difficulty and that once inside, it gets even more restrictive.
Furthermore, it is estimated (based on English House Condition Survey data) that just 0.5% of homes
meet criteria for ‘accessible and adaptable’, while 3.4% are ‘visitable’ by someone with mobility
problems puts the proportion of ‘visitable’ properties at a slightly higher 5.3%.39
Overall, the report estimates that there is an unmet need for wheelchair user dwellings equivalent to
3.5 per 1,000 households.40 Moving forward, the report estimates a wheelchair user need from
around 3% of households. Applying both of these figures to the demographic projections (see table
below) suggests a need for around 800 wheelchair user homes in Horsham and 600 in Crawley in
the period to 2039.
39 Data from the CLG Guide to available disability (taken from the English Housing Survey)
40 This is described in the Habinteg report as the number of wheelchair user households with unmet housing need

133
Table 66: Estimated need for wheelchair user homes (2019-2039)
Current need Projected need (2019-39) Total
Horsham 214 562 776
Crawley 161 438 599
Source: Derived from demographic projections and Habinteg prevalence rates
Information in the CLG Guide to available disability data also provides some historical national data
about wheelchair users by tenure (data from the 2007/8 English Housing Survey). This showed
around 7.1% of social tenants to be wheelchair uses, compared with 2.3% of owner-occupiers (there
was insufficient data for private renting, suggesting that the number is low). This may impact on the
proportion of different tenures that should be developed to be for wheelchair users (although it should
be noted that the PPG (56-009) states that ‘Local Plan policies for wheelchair accessible homes
should be applied only to those dwellings where the local authority is responsible for allocating or
nominating a person to live in that dwelling’). For market housing, policy can however require delivery
of wheelchair-adaptable dwellings, this being a home that can easily be adapted to meet the needs
of a household including wheelchair users.
Comparing the need for wheelchair dwellings shown to the Local Housing Need, the need for
wheelchair user dwellings equates to around 4% of the total housing need in both Crawley and
Horsham.
Need/demand for Bungalows
The sources used for analysis in this report make it difficult to quantify a need/demand for bungalows
in the District as Census data (which is used to look at occupancy profiles) does not separately
identify this type of accommodation. However, it is typical to find that there is a demand for this type
of accommodation, particularly from older households.
Bungalows are often the first choice for older people seeking suitable accommodation in later life
and there is generally a high demand for such accommodation when it becomes available. As a new
build option, it is, however, the case that bungalow accommodation is often not supported by either
house builders or planners (due to potential plot sizes and their generally low densities). There may,
however, be instances where bungalows are the most suitable house type for a particular site; for
example, to overcome objections about dwellings overlooking existing dwellings or preserving sight
lines.
There is also the possibility of a wider need/demand for retirement accommodation. Retirement
apartments can prove very popular if they are well located in terms of access to facilities and services,
and environmentally attractive (e.g. have a good view). However, some potential purchasers may
find high service charges unacceptable or unaffordable and new build units may not retain their value
on re-sale.
Overall, the Councils should consider the potential role of bungalows as part of the future mix of
housing. Such housing may be particularly attractive to older owner-occupiers (many of whom are

134
equity-rich) which may assist in encouraging households to downsize. However, the downside to
providing bungalows is that they are relatively land intensive for the amount of floorspace created.
Housing Needs of Older Persons and those with Disabilities: Summary and Implications
The analysis in this section has shown a notable growth in the population of older persons aged 65+ in both Horsham and Crawley over the period to 2039. Within this, the number of people with a limiting long-term health problem or disability is projected to increase, by 9,700 in Horsham and 7,000 in Crawley. The specific projections undertaken show an expected increase of those with dementia (by 2,200 in Horsham and 760 in Crawley) and with mobility problems (4,700 in Horsham and 1,800 persons in Crawley to 2039). Many older households will continue to live in mainstream housing, but given the substantial growth in the population of older persons and associated increases in those with a disability, it is appropriate for new housing to be delivered to meet Part M4(2) accessible and adaptable home standards, subject to viability testing. Some older households, particularly those aged over 75, will require specialist housing provision. The analysis in this section points to a need for 1,132 units of housing with support in Horsham to 2039, and 955 units of housing with care. In Crawley, a need for 577 housing with support units is identified; and 451 housing with care units. Within extra care schemes in particular, there is a need to carefully consider the viability and practical feasibility of delivering affordable housing on-site. The analysis also identifies a need for 1,517 care home bedspaces in Horsham to 2039 and 1,029 care home bedspaces in Crawley. These will fall within a C2 use class. In addition, a need for 776 dwellings from wheelchair users in Horsham and 559 dwellings in Crawley is identified, equivalent to 4% of the total housing need in the two areas. Enabling some older households to downsize can help to reduce households’ bills, and release equity in existing homes. This has been taken into account in appraising the SHMA recommendations on the mix of different sizes of homes needed. This is considered in Section 11.

135
NEED FOR DIFFERENT SIZES OF HOMES
In this section, we draw together the analysis in the preceding sections to set out an analysis and
conclusions on the need for different types of market and affordable housing.
A model has been developed that starts with the current profile of housing in terms of size (bedrooms)
and tenure. Within the data, information is available about the age of households and the typical
sizes of homes they occupy. By using demographic projections, it is possible to see which age groups
are expected to change in number, and by how much. On the assumption that occupancy patterns
for each age group (within each tenure) remain the same, it is therefore possible to work out what
the profile of housing needed over the assessment period to 2039.
An important starting point is to understand the current balance of housing in each area. Table 67
below profiles the sizes of homes in different tenure groups. It shows:
• The market (owner-occupied) sector in Horsham has a relatively high proportion of 4+-bedroom
homes whereas in Crawley there is a particular focus on 3-bedroom accommodation;
• The social rented sector in Horsham looks to be fairly balanced when compared with other
locations, with Crawley seeing a relatively high proportion of 3-bedroom dwellings (relatively few
1-bedroom homes); and
• The private rented sector in both areas also looks fairly balance when compared with other areas
(i.e. a similar profile) although there is again a slightly higher proportion of 3-bedroom homes in
Crawley.
These observations feed into conclusions about future mix later in this section although consideration
is also given to the role and function of different areas; notably in this instance the demographic
profile of Crawley is more biased towards younger people and families with children.

136
Table 67: Number of bedrooms by Tenure, 2011
Horsham Crawley West
Sussex
South East England
Owner-
occupied
1-bedroom 4% 6% 5% 5% 4%
2-bedrooms 20% 17% 25% 22% 23%
3-bedrooms 41% 56% 43% 44% 48%
4+-bedrooms 35% 22% 26% 30% 25%
TOTAL 100% 100% 100% 100% 100%
Social
rented
1-bedroom 36% 24% 32% 32% 31%
2-bedrooms 32% 32% 33% 33% 34%
3-bedrooms 29% 40% 31% 31% 31%
4+-bedrooms 3% 4% 3% 4% 4%
TOTAL 100% 100% 100% 100% 100%
Private
rented
1-bedroom 24% 25% 28% 24% 23%
2-bedrooms 38% 33% 37% 37% 39%
3-bedrooms 27% 32% 26% 27% 28%
4+-bedrooms 11% 10% 9% 12% 10%
TOTAL 100% 100% 100% 100% 100%
Source: Census (2011)
Overview of the Methodology
The method to consider future housing mix looks at the ages of the Household Reference Persons
(HRP – often more normally called the head of household) and how these are projected to change
over time. The sub-sections to follow describe some of the key analysis.
Understanding how Households Occupy Homes
Whilst the demographic projections provide a good indication of how the population and household
structure will develop, it is not a simple task to convert the net increase in the number of households
into a suggested profile for additional housing to be provided. The main reason for this is that in the
market sector, households are able to buy or rent any size of property (subject to what they can
afford) and therefore knowledge of the profile of households in an area does not directly transfer into
the sizes of property to be provided.
The size of housing which households occupy relates more to their wealth and age than the number
of people they contain. For example, there is no reason why a single person cannot buy (or choose
to live in) a 4-bedroom home as long as they can afford it, and hence projecting an increase in single
person households does not automatically translate into a need for smaller units. That said, issues
of supply can also impact occupancy patterns, for example it may be that a supply of additional
smaller bungalows (say 2-bedrooms) would encourage older people to downsize but in the absence
of such accommodation these households remain living in their larger accommodation. The issue of
choice is less relevant in the affordable sector (particularly since the introduction of the social sector
size criteria) although there will still be some level of under-occupation moving forward with regard

137
to older person and working households who may be able to under-occupy housing (e.g. those who
can afford to pay the ‘bedroom tax’).
The approach used is to interrogate information derived in the projections about the number of
household reference persons (HRPs) in each age group and apply this to the profile of housing within
these groups. The data for this analysis has been formed from a commissioned table by ONS (Table
CT0621 which provides relevant data for all local authorities in England and Wales from the 2011
Census).
The figures below show an estimate of how the average number of bedrooms varies by different
ages of HRP and broad tenure group for each local authority. In the owner-occupied sector the
average size of accommodation rises over time to typically reach a peak around the age of 50; a
similar pattern (but with smaller dwelling sizes) is seen in both the social and private rented sector.
After peaking, the average dwelling size decreases – as typically some households downsize as they
get older.
In Crawley, in the market sector, it is noteworthy that the decline in average dwelling sizes as
households get older is less pronounced than in Horsham (also less pronounced that is seen
nationally). This potentially suggest that there are insufficient smaller (mainly 2-bedroom) units for
households to downsize into – this is taken into account in drawing conclusions.
Figure 39: Average Bedrooms by Age and Tenure – Horsham
Source: Derived from ONS Commissioned Table CT0621
0
0,5
1
1,5
2
2,5
3
3,5
4
16-2
4
25-2
9
30-3
4
35-3
9
40-4
4
45-4
9
50-5
4
55-5
9
60-6
4
65-6
9
70-7
4
75-7
9
80-8
4
85+
Ave
rage
num
ber
of b
edro
oms
Age of household reference person
Owner-occupied
Private rented
Social rented

138
Figure 40: Average Bedrooms by Age and Tenure – Crawley
Source: Derived from ONS Commissioned Table CT0621
Replicating the existing occupancy patterns at a local level would however result in the conclusions
being skewed by the existing housing profile. This is particularly the case in Crawley. On this basis
(for both areas) we have also applied regional occupancy assumptions for the South East region.
Assumptions are applied to the projected changes in Household Reference Person by age, as set
out in Figure 39 and 40.
In terms of the analysis to follow, the outputs have been segmented into three broad categories.
These are market housing, which is taken to follow the occupancy profiles in the owner-occupied
sector; affordable home ownership, which is taken to follow the occupancy profile in the private rented
sector (this is seen as reasonable as the Government’s desired growth in home ownership looks to
be largely driven by a wish to see households move out of private renting) and affordable (rented)
housing, which is taken to follow the occupancy profile in the social rented sector. The affordable
sector in the analysis to follow would include affordable rented housing.
Tenure Assumptions
The housing market model has been used to estimate the future need for different sizes of property
over the 20-year period from 2019 to 2039. The model works by looking at the types and sizes of
accommodation occupied by different ages of residents and attaching projected changes in the
population to this to project need and demand for different sizes of homes. However, the way
households of different ages occupy homes differs between the market and affordable sectors (as
shown earlier).
It is therefore necessary on this basis to make some judgement for modelling purposes on what
proportion of net completions might be of market and affordable housing. For modelling purposes,
the analysis assumes that 70% of net completions are of market housing (designed to be sold for
0
0,5
1
1,5
2
2,5
3
3,5
16-2
4
25-2
9
30-3
4
35-3
9
40-4
4
45-4
9
50-5
4
55-5
9
60-6
4
65-6
9
70-7
4
75-7
9
80-8
4
85+
Ave
rage
num
ber
of b
edro
oms
Age of household reference person
Owner-occupied
Private rented
Social rented

139
owner-occupation) and 30% affordable. There is no assumption about private rented housing,
although it is possible that some of the market (owner-occupied) housing will end up in this sector.
Within the 30% affordable housing, we have assumed 10% affordable home ownership provision
and 20% rented affordable provision.
It should be stressed that these figures are not policy targets and have been applied simply for the
purposes of providing outputs from the modelling process. Policy targets for affordable housing on
new development schemes may be different to this and will need to be informed by viability evidence;
but not all sites deliver policy-compliant affordable housing provision, whilst some delivery is on sites
below affordable housing policy thresholds. Equally some housing development is brought forward
by Registered Providers and local authorities and may deliver higher proportions of affordable
housing than in current policy.
Modelled Outputs
By following the methodology set out above and drawing on the sources shown, a series of outputs
have been derived to consider the likely size requirement of housing in each area and with the three
broad tenures.
Tables 61 and 62 below show the profile of need applying the local occupancy patterns as shown in
Figures 39 and 40 above.
Table 66: Modelled Mix of Housing by Size and Tenure – Horsham (Local Occupancy)
1-bedroom 2-bedrooms 3-bedrooms 4+-bedrooms
Market 6% 27% 41% 26%
Affordable home ownership 26% 42% 25% 7%
Affordable housing (rented) 46% 30% 22% 2%
Source: Housing Market Model
Table 69: Modelled Mix of Housing by Size and Tenure – Crawley (Local Occupancy)
1-bedroom 2-bedrooms 3-bedrooms 4+-bedrooms
Market 5% 15% 58% 22%
Affordable home ownership 27% 32% 31% 10%
Affordable housing (rented) 29% 31% 36% 4%
Source: Housing Market Model
If instead the regional occupancy patterns are applied, the results are as follows:
Table 70: Modelled Mix of Housing by Size and Tenure – Horsham (Regional Occupancy)
1-bedroom 2-bedrooms 3-bedrooms 4+-bedrooms
Market 6% 29% 44% 22%
Affordable home ownership 26% 39% 26% 9%
Affordable housing (rented) 44% 30% 24% 2%
Source: Housing Market Model

140
Table 71: Modelled Mix of Housing by Size and Tenure – Crawley (Regional Occupancy)
1-bedroom 2-bedrooms 3-bedrooms 4+-bedrooms
Market 5% 24% 44% 27%
Affordable home ownership 26% 38% 25% 11%
Affordable housing (rented) 37% 32% 28% 3%
Source: Housing Market Model
The analysis clearly shows the different profiles in the three broad tenures with affordable housing
being more heavily skewed towards smaller dwellings, and affordable home ownership sitting
somewhere in between the market and affordable housing.
The analysis applying local occupancy patterns shows a relatively high need for 3-bedroom homes
in Crawley, which as noted previously will in part be due to the influence on the modelling of the
profile of current stock of housing.
For comparison, Table 72 shows the need for different sizes of households shown on the two
authorities housing registers. This represents a need for affordable housing.
Table 72: Profile of needed by Households on Authorities’ Housing Registers
Horsham Crawley
1-bedroom 37% 38%
2-bedrooms 34% 34%
3-bedrooms 21% 22%
4+-bedrooms 8% 5%
Total 100% 100%
Source: Local Authority Housing Statistics
Indicative Targets for Different Sizes of Properties by Tenure
Social/Affordable Rented Housing
Whilst the output of the modelling provides estimates of the proportion of homes of different sizes
that are needed, there are a range of factors which should be taken into account in setting policies
for provision.
In Crawley there is a relative imbalance in the existing affordable housing stock, with limited provision
of one-bed properties; and significant levels of 3-bed homes. In Horsham, there has been limited
delivery of larger affordable homes. Larger affordable housing units also have a relatively low
turnover. As a result, whilst the number of households coming forward for 4+-bedroom homes is
typically quite small, the ability for these needs to be met is even more limited.
For these reasons, it is suggested in converting the long-term modelled outputs into a profile of
housing to be provided (in the affordable sector) that the proportion of 1-bedroom homes is slightly
reduced from the local-based outputs, along with the 3-bedroom homes being reduced slightly (in
Crawley; with a commensurate increase in 4+-bedroom homes in both areas. At a District-wide level,
the analysis would support policies for the mix of rented affordable housing of:

141
Horsham
• 1-bed properties: 35%
• 2-bed properties: 30%
• 3-bed properties: 25%
• 4+-bed properties: 10%
Crawley
• 1-bed properties: 30%
• 2-bed properties: 30%
• 3-bed properties: 30%
• 4+-bed properties: 10%
By rented affordable housing in this context, we mean social rented; affordable rented; and affordable
private rented homes.
The strategic conclusions recognise the role which delivery of larger family homes can play in
releasing a supply of smaller properties for other households; together with the limited flexibility which
1-bed properties offer to changing household circumstances which feed through into higher turnover
and management issues.
The need for affordable housing of different sizes may vary by area (at a more localised level) and
over time. In considering the mix of homes to be provided within specific development schemes, this
information should be brought together with details of households currently on the Housing Register
in the local area and the stock and turnover of existing properties.
Affordable Home Ownership
In the affordable home ownership and market sectors a profile of housing that more closely matches
the outputs of the modelling is suggested. On the basis of these factors it is considered that the
provision of affordable home ownership should be more explicitly focused on delivering smaller family
housing for younger households. On this basis the following mix of affordable home ownership is
suggested:
Horsham
• 1-bed properties: 25%
• 2-bed properties: 40%
• 3-bed properties: 25%
• 4+-bed properties: 10%
Crawley
• 1-bed properties: 25%
• 2-bed properties: 35%
• 3-bed properties: 30%
• 4+-bed properties: 10%
Whilst the need for affordable home ownership properties is focused towards younger households,
the conclusions recognise the particular affordability challenges for family households (as considered
in Section 9).
Market Housing
Finally, in the market sector, a balance of dwellings is suggested that takes account of both the
demand for homes and the changing demographic profile. This sees a slightly larger recommended
profile compared with other tenure groups. The mix suggested below to some extent reflects the
relatively high proportion of 3-bedroom homes currently within the owner-occupied sector in Crawley.
The following mix of market housing is suggested:

142
Horsham
• 1-bed properties: 5%
• 2-bed properties: 30%
• 3-bed properties: 40%
• 4+-bed properties: 25%
Crawley
• 1-bed properties: 10%
• 2-bed properties: 25%
• 3-bed properties: 40%
• 4+-bed properties: 25%
In considering the appropriate mix of market housing on individual development sites, consideration
should be given to the existing housing mix at a neighbourhood or settlement level and any evident
gaps within this, up-to-date market evidence, the development pipeline on other sites in the area and
extent to which this will support a range of sizes of homes, and the location and nature of the
development site.
The recommendations can also be used as a set of guidelines to consider the appropriate mix on
larger development sites in particular, and Iceni consider that it would be reasonable to expect
justification for a housing mix on such sites which significantly differs from that modelled herein.
Housing Mix within Crawley Town Centre Developments
The Market Housing Mix Study prepared by Chilmark Consulting for the Councils, dated November
2016, included consideration of the appropriate mix of housing to be delivered within development
schemes in Crawley Town Centre.
The Study identified that a significant proportion of development schemes coming forward within
Crawley Town Centre were arising through conversions of office to residential accommodation
brought forward through Permitted Development Rights. It set out that this had been resulted
principally in the delivery of 1- and 2-bed flats; and set out that there was a gap in respect of the
provision of family-orientated and sized market housing in and close to the Town Centre. Schemes
brought forwards through Permitted Development also do not contribute affordable housing, which
has influenced the Council’s ability to deliver affordable housing to meet its identified need.
Crawley Borough Council’s latest monitoring data indicates that there is a pipeline of 1,043 homes
expected to be brought forward on schemes with Crawley Town Centre which have planning consent
or prior approval. These schemes are expected to deliver a modest 249 affordable homes (24% of
total dwellings).
The figure below indicates that the majority of supply in the development pipeline in Crawley Town
Centre comprises 1- and 2-bed units, with just 2% of the pipeline of market housing units being 3-
bed properties and no market properties with 4 or more bedrooms.

143
Figure 41: Pipeline of Development in Crawley Town Centre by Property Size
Source: CBC Monitoring Data
Iceni considers that it is important that there are a range of sizes of homes brought forward within
the Town Centre Neighbourhood within Crawley, but that it is reasonable to expect the profile of
homes on such developments to differ from the wider mix needed across the Borough in particular
given the expectation of higher density development and the relative attractiveness of the Town
Centre for younger and potentially older households. Investment in improving quality of place and
delivery of social infrastructure will help support its attractiveness as a residential location. It is likely
to remain a focus for private rented housing and can be expected to see further build-to-rent
development.
On the basis of the evidence, Iceni considers that an appropriate mix of market housing to be brought
forward on town centre sites is set out below:
• 1-bed properties: 25-30%
• 2-bed properties: 40-45%
• 3-bed properties: 25%
• 4+-bed properties: 5%
There is a clear need to ensure balance and flexibility in the town centre housing market, particularly
securing some larger accommodation that broadens choice. In the absence of this, there is a risk
that the Town Centre housing offer will be dominated by a narrow range of small, flatted
accommodation with little market choice and adverse implications for socially sustainable
development.
0
100
200
300
400
500
600
1-bed 2-bed 3-bed 4+ bed
Dw
elli
ngs
Market Affordable

144
Need for Different Sizes of Homes: Summary and Implications
Understanding the existing housing mix in a place is important in considering what future mix of housing is appropriate to deliver a mixed and balanced community. This is important at both a strategic, and at a local, level.
The SHMA analysis shows a particular focus of housing stock in Crawley towards 3-bed properties, with Horsham having a strong representation of 4+ bed homes in the market sector. Crawley has limited provision of 1-bed affordable housing.
Taking account of the current stock and expected demographic trends (including the expectation that some older households will downsize if the right properties are available), the SHMA points to a need for different types of homes in the market and affordable sectors are Paras 11.25, 11.29, 11.31 and 11.39 above. These strategic conclusions should be brought together with local evidence, such as information on current stock and needs profile at a more local level, in considering the appropriate mix of housing on individual development sites.
145
EMERGING HOUSING MARKET SEGEMENTS
In this section we move on to provide analysis which considers emerging segments of the housing
market, including different models for delivery of housing.
Build-to-Rent Development
Build to Rent (BTR) represents a distinct asset within the purpose built and managed Private Rented
Sector (PRS) and is defined in Annex 2 Glossary of the NPPF (February 2019) as:
“Purpose built housing that is typically 100% rented out. It can form part of a wider multi-tenure
development comprising either flats or houses but should be on the same site and/or contiguous
with the main development. Schemes will usually offer longer tenancy agreements of three
years or more and will typically be professionally managed stock in single ownership and
management control.”
Over recent years there has been a rapid growth in the Build to Rent sector backed by domestic and
overseas institutional investment. BTR accounted for 8.7% of new housing starts in 2016/17 whilst
latest research from Savills (2018) for the 12 month period to Q4 2018 indicates a 29% increase in
BTR unit completions (over 29,400), over 43,300 units under construction (a 39% increase) and
66,700 in a substantial planning pipeline (10% increase). Taken together, this total of 139,500 units
accounts for a 22% increase since Q4 2017.
In terms of age profile, research by JLL41 focused on BTR case studies identified tenants typically in
the 25-35 age bracket with an average tenant age of 31 and occupiers who were above average
earners, seeking apartments or flats in urban conurbations, together with ‘satellite’ towns near to or
commutable to the centres of employment, and potentially university locations.
The growth in BTR activity has also began to shift outside London which historically has been the
focus for viable development with a number of large regional centres, considered strong employment
locations, now delivering significant levels of BTR completions and schemes under construction.
Alongside the geographical spread of BTR development, Savills research (2018) indicates the size
of BTR schemes is increasing, with the average size of a completed scheme at 133 units and the
average for schemes under construction at 240 units. The average is higher for schemes in planning.
The analysis in Section 8 has shown clear evidence of growth in private renting amongst younger
households, and a potential market for build-to-rent development in Northern West Sussex.
Within the HMA, examples of existing and emerging BTR schemes are focused in Crawley and
include a number of office-residential conversions:
41 JLL Research (2018) Build to Rent

146
• Platform Crawley (11 The Boulevard) which provides 185 units in a mix of studio (from £850
pcm), 1 bed (£960 pcm) and 2 bed (from £1175 pcm) apartments together with lifestyle facilities
such as gym, yoga and terrace;
• Inspired Homes (15-29 Broadway) – under construction for 78 (1 and 2 bed) apartments and
understood to be a build to rent scheme although including some units for market sale;
• Stoner House, Crawley - under construction by Interland Group for 129 studio flats (prior
approval under LPA ref: CR/2017/0522/PA3);
• Overline House/Crawley Railway Station – outline planning consent (LPA ref:
CR/2016/0294/OUT) for 308 units (indicative mix of 7 studios, 193 x 1 bed, 107 x 2 bed and 1x
3bed); currently understood to be a BTR scheme;
• Town Hall, the Boulevard, Crawley - outline planning consent (LPA ref: CR/2017/0997/OUT) for
182 units including 18 affordable, with an indicative mix of 67 x 1 bed, 105 x 2 bed and 5 x 3
beds; currently understood to be a BTR scheme.
Whilst only one scheme is operational to date, the aforementioned schemes represent relatively large
schemes in delivery terms which offer a housing mix of studio, 1 and 2 bed units. They are focused
particularly in and around Crawley Town Centre.
With evidence of a declining buy to let market and continued affordability constraints, future demand
for the PRS is anticipated to continue rising with the role and contribution of BTR expected to help
provide rental stock, subject to viability and the key considerations of local employment, demographic
credentials and rental affordability.
The conditions for growth appear well established. The latest market intelligence from the
Association of Residential Letting Agents (ARLA) in March 2019 confirms that the private rented
sector is subject to increased demand from prospective renters; whilst the number of private
landlords exiting the market and rent rises have both remained high.
In respect of local private rental values, the VOA Private Rental Market Statistics (to Q3 September
2018) confirm Crawley, followed by Horsham has the highest average monthly rental values in West
Sussex on a room only, studio, 1 and 2 bed basis. We have replicated this analysis in Table 73
below. In contrast, Horsham has the highest average rental value in the County for larger rental
properties (3 and 4 bed) in part reflecting the town’s existing stock mix.
Table 73: Summary of Average Monthly Rental Values by Property Type (as at 30 September
2018)
District Room
Only
Studio 1 bed 2 bed 3 bed 4+ bed
Crawley £531 £661 £819 £999 £1,204 £1,501
Horsham £512 £611 £759 £969 £1,256 £1,899
West Sussex £448 £554 £698 £909 £1,144 £1,690
Source: VOA (2018)

147
These headline messages indicate that the continued decline of the buy to let dominated PRS when
combined with evidence of high rental values locally in Table 66 (and rising rental demand nationally)
represent conditions that are expected to encourage continued future growth in the BTR sector.
At the local level, within the HMA, the emergence of BTR schemes in Crawley Town Centre can also
be attributed to the strength of the local employment market given its proximity to Gatwick Airport
and easy rail and road connectivity to Greater London. It also recognises the contribution of the
significant availability of stock arising from the conversion of surplus offices to residential uses in
central Crawley under the Permitted Development Rights prior approval process.
In contrast, despite evidence of relatively healthy private rental levels in Horsham, the BTR market
is not established in the District with no known existing or proposed BTR schemes at the time of
writing. This is not to say there is no potential for BTR in Horsham although many of the core drivers
for BTR schemes are not sufficiently in place in the District when compared to Crawley and other
larger urban locations with its strong employment base, transport hub and existing private rented
sector/values oriented towards smaller units.
The adopted Development Plans for Crawley and Horsham do not contain policies related specifically
to the Build to Rent sector, although this in part reflects the recent emergence of the sector and
changes to national planning policies concerning the status and importance of BTR as part of the
rental market.
The NPPG does however recognise that where a need is identified, that local planning authorities
should include a specific plan policy relating to the promotion and accommodation of build to rent,
including the circumstances and locations where build to rent schemes would be encouraged. It
identifies town centre regeneration areas and parts of large sites as examples.
In the case of Crawley, existing and emerging BTR schemes are located in the Town Centre in close
proximity to public transport and employment hubs and are increasingly associated with town centre
regeneration initiatives to help promote footfall in central areas.
It is important that local policy takes account of the NPPF and NPPG which state that affordable
housing should be provided on build to rent schemes through affordable private rent which is specific
to build to rent. The guidance further states that:
• affordable private rent and private market rent in a development be managed collectively by a
single build to rent landlord;
• 20% is identified as the suitable benchmark level for affordable private rent provision (in
perpetuity) for build to rent schemes, although the guidance accepts a different proportion can
be set by LPAs subject to local evidence;
• national affordable housing policy requires a minimum rent discount that is at least 20% less than
the private rent homes relative to local market rents (rent on discounted homes should increase
148
on the same basis as rent increases for the market tenancies within the build to rent
development).
These are relevant considerations for the councils in seeking to set out policies for build-to-rent
development within local plans. The Councils in consider how affordable housing might be applied
to this form of development need to balance a number of considerations: the scale of affordable
housing need and nature of housing land supply within the area; viability evidence which considers
the dynamics of the build-to-rent sector and its ability to support affordable housing; and the
Government support for the Build-to-Rent sector and acknowledgement of the role which this play in
increasing overall housing delivery. These considerations may result in differences in the policy
approach to Build-to-Rent development within Town Centre as against greenfield/ urban extension
sites.
Co-Living and Community-led Housing
Co-Living
The concept of co-living in its modern form of housing is relatively new, and whilst it is not specifically
defined in the NPPF, it is often used as part of a wider definition relating to a type of intentional
community where residents share living space and a set of interests, values and /or intentions.
Traditionally co-living has ranged from the coming together of space, time and resources for activities
(for example meals and discussion in the common living areas) through to shared workspace and
collective endeavours such as living more sustainably (such as eco-centred villages).
Over recent years, media interest in co-living has in part been driven by the pressures faced by the
millennial generation and the potential to provide communal living driven by affordability and a
transient, social oriented young professional resident in high cost locations. Traditionally the idea of
co-living through sharing of rented housing is not a new idea and has long operated across the
country. In this context, co-living can encompass many structural forms.
In its current form, modern co-living in the UK tends to be urban focused and integrated into a single
building, house, or apartment, a sharing of amenities, and a demographic trend towards 20 to 30
something professionals.
In London, companies such as The Collective, Roam, Fizzy Living and Lyvly are actively adopting a
‘WeWork’ model42 to housing based on a new renting approach for the Capital that offers private
bedrooms, shared common spaces and community events, and an all-inclusive rent.
Examples include The Collective co-living scheme at Old Oak which provides for over 500 ‘members’
who rent their own private studio apartment (all with private bathrooms, and studios with private
42 WeWork (and other operators such as Regus and Clarendon for example) provide flexible manged workspaces on easy
access licence terms in the commercial office sector

149
kitchenette), with access to shared spaces for working, socialising and relaxing, events, and on-site
amenities such as a gym, launderette and supermarket. The operator is due to open a new scheme
at Canary Wharf shortly.
It remains to be seen whether this housing concept has any realistic potential beyond the larger,
higher cost urban centres such as London, with a recognition that the modern concept of co-living is
often viewed as an extension of managed student accommodation for younger professionals without
dependents.
Many of the existing co-living examples tend to be large city schemes with studies indicating that
whilst the sharing of space is deemed more acceptable, especially by city dwellers, the model of co-
living needs to carefully consider the scale of provision balanced alongside personal space needs
and privacy.
In the Northern West Sussex HMA context, there is the potential for co-living schemes to emerge
although these are anticipated to be limited to individual developments rather than a widespread
adoption of this housing product.
The current co-living business model and characteristics draw on a large base of transient younger,
high skilled professional households and individuals (particularly those without dependents) which is
not currently a predominant characteristic of household growth in the Northern West Sussex HMA.
The implications for future local planning policy are considered limited other than a recognition of the
potential offered by the concept, and in many ways, the relevant planning considerations are deemed
similar to those for comparable type development, such as student housing schemes.
Co-Buying
The increased costs of housing and associated affordability challenges have led to a growth in co-
buying over recent years whereby a pooling of resources allows for individuals, typically friend(s) or
family member(s), to collectively purchase a property which ordinarily would likely not have been
possible.
A number of national financial lenders have launched relevant group mortgage products to support
buyers get a foot on the property ladder. It is increasingly an option for millennials and those already
in a house sharing rental environment. It remains however relatively uncommon with certain lenders
limiting the number of people, typically two, to a group mortgage whilst the model is not without its
risks, including where a co-buyer seeks to move on.
The concept is likely to remain an attractive option for some although overall there are considered
limited implications if any from a planning policy perspective.
Community Led Housing
Community Led Housing (CLH) comprises the following:
• a local community group or organisation owns, manages or stewards the homes as they chose;

150
• benefits to the local area and/or a specified community which are clearly defined and protected
in perpetuity via a legal asset lock;
• community engagement and consent throughout the process, which may involve the community
initiating/managing the development process or building the homes.
The term Community Led Housing is therefore a broad one and can be delivered in a number of
ways, some of which can overlap with each other to include:
• Community Land Trusts (CLTs) - provide affordable homes for local people in need, for rent or
shared ownership, through the acquisition of land which is held as a community asset in
perpetuity;
• Cooperative housing - groups of people who provide/collectively manage, via a democratic
membership basis, affordable homes for their use as tenants or shared owners;
• Cohousing - groups of like-minded individuals who come together and provide self-contained
private homes for their use but share management and activities, often in a communal space;
• Self-help housing – based on small, community-based organisations bringing empty properties
back into beneficial use (often with a strong focus on construction skills/training/support);
• Community self-build - groups of local people building their homes with external support and
managing the process collectively (individual self-build is not typically regarded as community-
led housing).
• Tenant management organisations – collective responsibility for social housing tenants to
manage and maintain the homes (via agreement with their council or housing association
landlord).
CLH is typically characterised by relatively small scale schemes, often of less than 20-25 units in
rural areas, although many schemes in urban areas are significantly larger, with schemes set up and
run as not for profit community based organisation driven by local volunteers and often supported by
external organisations, for example housing associations, local authorities or regional and national
support organisations.
Schemes provide affordable homes for rent, shared ownership or sale, typically on sites which are
less attractive to the development industry, and ensure the long-term protection for local people in
housing need through legal and/or financial controls
Over recent years, an increasing focus for community-led housing has been driven by Community
Land Trusts with over 320 registered in England and Wales and encouraged by government funding.
To date, CLTs have delivered over 870 homes with circa 5,500 identified in the pipeline. At the
Northern West Sussex level, Action in Rural Sussex (AirS) provide support for local communities to
promote community led housing through the Sussex Community Housing Hub.

151
The Sussex Community Housing Hub has a number of ongoing CLT interests in the Northern West
Sussex HMA including potential for a CLT as part of the North Horsham strategic development and
a pipeline for some 300 homes from CLTs across West Sussex County.
It is important that local planning policy seeks to encourage and enhance the contribution and role
of community led housing particularly given the lack of familiarity with the sector despite the level of
government funding and external support available to promote opportunities for CLH.
Case Study: Marmalade Lane, Cambridge
This scheme’s delivery involved a notable mix of stakeholders including Mole Architects, TOWN
developers Cambridge City Council and the community group driving the scheme, K1 Housing.
The community group formed in 2005; with an outline planning permission submitted in 2014
demonstrating the potential for delays.
Completed in 2018, the scheme comprises 42 new homes, pre-fabricated off-site. The scheme is
deliberately multi-generational to support a greater mix of housing including five-bedroom terraced
housing to one-bedroom apartments which sit within allow rise block of 10. The developer
effectively delivered the scheme, with residents paying market rate for the properties; however, all
residents were fully involved in the design of the scheme.
Self- and Custom-Build Housing
Historically, self-build and custom-build housing has not been a common or wide-spread form of
housing development in the UK. The Government has however outlined a commitment to support
the self and custom build sector through changes in legislation, national policy and guidance to
promote such developments.
The definition of self-build and custom-build housing set out in the NPPF (Annex 2: Glossary) does
not differentiate between the two, and outlines it as follows:
Housing built by an individual, a group of individuals, or persons working with or for them, to
be occupied by that individual. Such housing can be either market or affordable housing. A
legal definition, for the purpose of applying the Self-build and Custom Housebuilding Act 2015
(as amended), is contained in section 1(A1) and (A2) of that Act.
The NPPF is therefore supportive of people wishing to build their own homes. The Self Build and
Custom Housebuilding Act 2015 and supporting Regulations requires councils to have a Register of
Interest for those seeking a serviced plot for a self-build or custom-build dwelling. It imposes a duty
for councils to grant planning permission for enough serviced plots to meet the demand evidenced
from the Registers (within three years of a given base period), alongside a duty to have regard to the
Register to help inform development plan policies.

152
At the national level, there is no conclusive figure for the number of self/custom build completions
per annum although AMA’s Research Self Build Housing Market Report UK (2016 – 2020) estimated
that self-build completions are circa 12,000 per year. The same research predicts the self-build
market will grow by around 7 – 10% per annum whilst the National Custom and Self Build Association
(NaCSBA) identified that over 40,000 people had signed Registers of Interest in England as at
December 2018. The Association recognises that English planning authorities will need to
demonstrate for the first time to have complied with the legislation, and to have delivered 18,000
plots by 30th October 2019.
Evidence from Crawley and Horsham’s individual Self Build Registers of Interest provides an
indication of the potential demand for self and custom build housing in the HMA.
In Horsham District, this is summarised below:
• the most recent figures indicate 38 entries as of 9th April 2019, of which 30 are existing Horsham
District residents;
• the level of interest has recently declined, from 122 entries on 3 December 2018 (80 were district
residents), to 28 entries on 2 January 2019 (22 were Horsham District residents). This marked
reduction is likely largely attributed to the introduction of an annual fee for inclusion on the
Register;
• analysis of the current available Register indicates the dominance of individual self-build
preferences, with limited interest from group self-build and custom build. Evidence indicates a
variety of plot sizes and a majority identifying a maximum budget of over £300,000.
Information contained in the Crawley Borough Council Register of Interest confirms the following:
• a total of 71 entries as of 26th March 2019 (although details of the Borough of origin status are
unknown).
• the majority of registered interest is focused on self-build units with limited indicated demand for
custom build; and
• evidence indicates that detached houses represent the most recorded interest although
bungalows appear in demand whilst plots sized are typically varied maximum budgets, where
recorded, dominated in the range £150,000 - £300,000.
In Development Plan policy terms, specific self-build/custom build policy wording is limited to Policy
SD4 of the adopted Horsham District Planning Framework (2015) which relates to the strategic site
at land north of Horsham and outlines a need to take into account the local demand for custom build.
As part of the approval of planning permission for the site, provision is made for 30 serviced plots for
self/custom build.

153
Despite government support and active promotion of self/custom build by NaCSBA (including
through its Self-Build Portal and Right to Build Toolkit), growth of the sector has remained low despite
the appeal for many people of building or commissioning their own home which better meet individual
needs. Barriers to growth are identified as land supply and the availability of self-build plots; access
to finance; the planning process and differing LPA approaches; and general regulation.
An increasing number of local planning authorities have adopted specific self-build and custom build
policies to encourage delivery, promote and boost housing supply. These typically require that a
minimum proportion of plots within development schemes (often over a certain size) are offered to
self-builders or as custom-build plots and/or allocation of sites solely for the use. However, Iceni
consider that there is potential for both this – with policy setting out that sites of over a certain size
should include a proportion of plots for self/custom-build development; and also potential for
individual small sites to come forward to deliver self- and custom-build development whereby an
outline application is presented together with a design code, with individual plots then coming forward
through reserved matters consents.
For the Northern West Sussex HMA authorities, the adopted planning policies in Crawley and
Horsham currently provide flexibility that allows for a mix of housing to address market demand and
local housing needs. However, a specific planning policy could be prepared to help better promote
and encourage delivery of self/custom build schemes although the level of registered interest
remains relatively low at the time of writing which may indicate that existing policy and its supporting
justification maintains its flexibility that allows for such provision, including the provision of self-build
plots as part of the strategic allocation north of Horsham.
Emerging Housing Market Segments: Summary and Implications
There is potential for community-led housing schemes, including co-living/buying schemes to come forward, and to contribute positively to housing delivery in Northern West Sussex. The Councils should continue to work with groups such as Action for Rural Sussex and Community Land Trusts in seeking to support the promotion and delivery of such schemes. A key issue is however likely to be access to land.
Build-to-Rent development is currently a relatively embryonic market outside of London. There is however a pipeline of schemes now progressing in Crawley; and potential that in time Build-to-Rent development additionally comes forward in Horsham. It is therefore appropriate that the two councils consider the sector and craft planning policies which help to support it and provide clarity on how policies will be applied to it. We address this further within the conclusions section.
Self- and custom-build development is also a growing sector of the housing market, and one which has potential to contribute to housing delivery – probably particularly in Horsham District. There are however different potential delivery models for how this could be developed which need to be considered in crafting planning policies.

154
CONCLUSIONS AND RECOMMENDATIONS
In this final section, the consultancy team has sought to draw together a set of conclusions and
recommendations arising from the research undertaken to inform the preparation of the new local
plans in Crawley and Horsham.
Housing Market Geography
Iceni consider that the evidence continues to support the definition of a Northern West Sussex
Housing Market Area which is comprised, as a best fit to local authority boundaries, of Crawley,
Horsham and Mid Sussex. This has been tested and endorsed at the three authorities’ local plan
examinations.
There is however evidence of an overlap with surrounding housing market areas. In the southern
parts of Horsham and Mid Sussex, the evidence from existing studies points to Steyning,
Hurstpierpoint and Hassocks (and potentially Burgess Hill) as falling within this area of overlap. In
the northern part of the area, the evidence shows a functional relationship with parts of Surrey – and
in particular areas in Surrey to the south of the M25; with the strongest relationship (in house price
and commuting terms) being with Horley.
The growth of the economic hub around Crawley/Gatwick could over time influence the housing
market geography, and it will be important that the authorities therefore continue to monitor trends
and recognise that the HMA geography could change over time, particular if/ when Gatwick Airport
expands.
R1: Whilst the core focus of joint working on housing issues should remain within the three-
authority HMA geography, it will be important that the Councils actively engage with
authorities in the Sussex Coast HMA and authorities within Surrey to the north through the
Duty to Cooperate on any cross-boundary issues arising in respect of housing provision. It
would be reasonable to see Statements of Common Ground prepared to address cross-
boundary issues related to housing provision with these.
There are also functional housing market relationships between Northern West Sussex and London,
as there are for many areas across the South East and East of England regions. But there is
continuing uncertainty as to London’s ability to meets its own housing needs within the Greater
London, which constitutes a separate housing market area.
R2: In the instance that an unmet housing need arises from London, and it is accepted that
this cannot be met within London’s boundaries, taking account for instance of a review of
Metropolitan Urban Land/ Green Belt within London, it will be important that the two
authorities engage through the wider South East Councils Group to consider whether it is

155
possible to contribute to addressing the unmet need. This is of greater relevance to Horsham
given land supply constraints in Crawley.
However, whilst this is a potential strategic issue across the wider region, it is important to recognise
that there is potential unmet need more specifically within the HMA and immediately adjoining areas
with which there is an arguably closer spatial relationship.
Local Housing Need
The Government has implemented a standard method for assessing housing need which takes 2014-
based Household Projections and applies an upward adjustment based on the median house price
to earnings ratio. A cap is applicable to the adjustment in Crawley.
The standard method results in a minimum local housing need for 2,819 dpa across the Northern
West Sussex Housing Market Area, within which there is a need for 752 dpa in Crawley and 965 dpa
in Horsham (2019-29). Our assessment indicates that the demographic projections feeding into this
are reasonable based on the evidence.
This scale of local housing need would support population growth of 27,150 over the 2019-39 period
in Crawley (24.0%) and 34,700 growth in population in Horsham (24.4%).
Our analysis shows that, assuming commuting patterns remain consistent, this would support
potential employment growth of 24,200 in Crawley and 13,500 in Horsham over the period to 2039.
The SHMA has explored whether higher levels of housing need might be justified, considering in
particular the rail service enhancements through the Thameslink Programme and potential
implications of the growth of Gatwick Airport. The Airport’s expansion to 70 million passengers per
annum could create over 9,000 additional jobs and on the basis of current commuting patterns might
draw around 3,000 of these from Crawley; with a more modest 700 (4.4%) from Horsham. For
Horsham the impact is modest and would not be expected to have an upward impact on housing
need; whilst for Crawley it could be more substantial but the evidence does not suggest that this
would necessarily generate additional housing need – depending on jobs growth more broadly within
the Borough. Rail service enhancements will improve capacity but are not considered to increase
the need for homes locally to a level above the standard method.
The implications of Gatwick’s growth will need to be kept under review as new information emerges;
and it may also be necessary to updating the local housing need figures prior to the submission of
the local plans to take account of either new evidence; or any changes to the methodology
introduced by Government.
R3: The SHMA has set out the local housing need arising through the standard method at the
time of preparation of this report. It may be necessary in due course to review this prior to
the submission of local plans to take into account further evidence, including in respect of

156
any new evidence on the implications of Gatwick Airport’s growth, and any changes to the
methodology for calculating housing need introduced by Government.
Crawley Borough’s boundaries are drawn relatively tightly around the Borough’s existing urban area
and will limit what scale of development can be met within the Borough. The Council and
neighbouring authorities will therefore need to explore the potential for wider development “at
Crawley” but extending across the Borough boundary. Such development would contribute to
meeting Crawley’s housing needs, and would thus be expected to have regard to the nature of
Crawley’s housing need identified within this Study.
Affordable Housing
The SHMA includes an updated assessment of affordable housing need which responds to the
widened definition of affordable housing set out in the 2019 NPPF. This includes households who
might be able to rent a home in the private sector without financial support but aspire to own a home
and require support to do so.
The assessment shows an annual need for 344 rented affordable homes and in Horsham District
and 563 rented affordable homes in Crawley. This is consistent with the definition of affordable
housing considered in previous SHMA studies.
The SHMA has also assessed the potential scale of need for affordable home ownership housing,
identifying a need from up to 159 households a year in Horsham and 176 households in Crawley.
This need could be met through both various low-cost home ownership products, as identified in the
NPPF Glossary, as well as the Government’s Help-to-Buy Scheme.
These components of analysis are brought together to provide estimates of the total affordable
housing need in Table 67 below.
Table 67: Conclusions on Affordable Housing Need
Annual need for affordable housing Horsham Crawley
Rented affordable housing 344 563
Low cost home ownership properties 159 176
Total need for affordable housing 503 739
Policies regarding the level of affordable housing sought on new development schemes – including
the level and tenure profile of affordable housing - need to take account of the affordable housing
need’s evidence, together with evidence regarding the viability of residential development schemes
and contributions to other forms of infrastructure.
R4: A clear need for affordable housing is shown, and Iceni consider that the Councils are
full justified in seeking affordable housing through new development schemes. New local

157
plans should include policies advising on the proportion of affordable housing sought
through new development and the recommended tenure and size profile of this.
In negotiating affordable housing on individual schemes, the Councils should have regard to
this as well as the profile of need at the local level at the time of considering a planning
application and where applicable the viability of the development scheme.
The NPPF states that at least 10% of housing on new development schemes of 10 or more dwellings
should support affordable home ownership and the evidence of need would justify; but this needs to
be balanced against the acute need for rented affordable housing from households on lower
incomes.
R5: In setting policies on affordable housing, the Council are advised to bring together
evidence of need within this report with consideration of how they wish to prioritise the
delivery of different types of affordable housing and evidence/ testing of residential
development viability.
The evidence in this report would support a policy requiring 10% delivery of affordable home
ownership products, but as a significant need is also shown for rented affordable housing. Iceni
consider that a higher proportion of low-cost home ownership housing (i.e. above 10%) through
policy would not be justified. The evidence would support a split of affordable housing of 75% rented
and 25% affordable home ownership homes in Crawley, and either a 75/25 or 70/30 split in Horsham,
subject to viability.
To ensure that rented housing is affordable, planning policies or guidance should set out how the
Councils expect affordable housing to be priced; and include provision to ensure that it is relet/ resold
at an affordable cost.
R6: Iceni recommend that the Councils require through policy that rented affordable housing
is priced and maintained at levels which are below either 80% of market housing costs, or
Local Housing Allowance levels, whichever is the lower.
R7: Iceni recommend that affordable home ownership homes are priced to be affordable to
households who cannot afford lower quartile house prices. Table 64 provides guidance of
how homes of different sizes should be priced based on current evidence.

158
Older Persons Housing Needs
The SHMA analysis points to notable growth in the population of older persons aged 65+ in both
Horsham and Crawley over the period to 2039. Within this, the number of people with a limiting long-
term health problem or disability is projected to increase, by 9,700 in Horsham and 7,000 in Crawley.
The specific projections undertaken show an expected increase of those with dementia (by 2,200 in
Horsham and 760 in Crawley) and with mobility problems (4,700 in Horsham and 1,800 persons in
Crawley to 2039).
Many older households will continue to live in mainstream housing, but given the substantial growth
in the population of older persons and associated increases in those with a disability, it is appropriate
for new housing to be delivered to meet Part M4(2) accessible and adaptable home standards,
subject to viability testing.
R8: Planning policies should require new homes to be delivered to the Part M4(2) standards
as set out in Building Regulations where this is feasible and appropriate onsite.
Whilst many households will seek to remain in their own homes, a proportion of older households,
particularly of those aged over 75, may need specialist housing. The SHMA has assessed the needs
of households and these are set out below.
Table 68: Need for Specialist Housing for Older Persons – Horsham
2019-39 Rented Leasehold Total
Housing with Support 131 1001 1132
Housing with Care 360 595 955
Table 69: Need for Specialist Housing for Older Persons – Crawley
2019-39 Rented Leasehold Total
Housing with Support -138 715 577
Housing with Care 175 276 451
In addition, a need is identified for 1,518 care home bedspaces is identified in Horsham and 1,029
bedspaces in Crawley to 2039. These will fall within a C2 use class.
It is important that the councils’ planning polices support the delivery of specialist housing and care
home bedspaces. Doing so will help to release existing mainstream housing, including family
housing, for other groups within the population. Particular barriers to delivery include access to land,
and the viability of provision which can differ from mainstream housing.
R9: The Councils should consider making specific allocations of land for older persons
housing and care home bedspaces, given that developers of specialist housing can in some
instances struggle to secure sites against mainstream market housing developers.

159
R10: The Councils should carefully consider the economics of delivery of different types of
older persons housing through the preparation of viability evidence and consider whether a
differential affordable housing policy should be applied to different types of specialist
housing schemes. In particular, for schemes with higher levels of care provision,
consideration should also be given to the viability of schemes and to whether it is practical
to manage market and affordable provision within a single development. This may be
influenced by the nature of the site and scheme.
In addition, the SHMA identifies a need for around 776 dwellings from wheelchair-users in Horsham
and 599 dwellings in Crawley. Comparing the need for wheelchair dwellings shown to the Local
Housing Need, the need for wheelchair user dwellings equates to 4% of the total housing need. We
consider that it would be appropriate to seek provision as part of major new-build schemes, subject
to support from viability evidence studies.
R11: Planning policies should require 5% of dwellings on major development schemes to be
delivered to wheelchair adaptable standards.
Need for Different Sizes of Homes
Understanding the existing housing mix in a place is important in considering what future mix of
housing is appropriate to deliver a mixed and balanced community. This is important at both a
strategic, and at a local, level.
The SHMA analysis shows a particular focus of housing stock in Crawley towards 3-bed properties,
with Horsham having a strong representation of 4+ bed homes in the market sector. Crawley has
limited provision of 1-bed affordable housing.
Taking account of the current stock and expected demographic trends (including the expectation that
some older households will downsize if the right properties are available), the SHMA points to a need
for different sizes of homes in the market and affordable sectors.
R12: The SHMA’s strategic conclusions regarding the mix of homes needed in different
tenures are set out in the tables below. Iceni consider that these should inform development
plan policy on housing mix and negotiations regarding the mix of housing to be delivered on
individual development sites alongside consideration of the existing housing mix in the
settlement, and where appropriate evidence of the profile of households on the Housing
Register in an area on needs shown through local survey evidence.

160
Table 70: Strategic Conclusions on the Need for Different Sizes of Homes – Crawley
Affordable Rented Low Cost Home
Ownership Market Housing
1-bed 30% 25% 10%
2-bed 30% 35% 25%
3-bed 30% 30% 40%
4+ bed 10% 10% 25%
Table 71: Strategic Conclusions on the Need for Different Sizes of Homes – Horsham
Affordable Rented Low Cost Home
Ownership Market Housing
1-bed 35% 25% 5%
2-bed 30% 40% 30%
3-bed 25% 25% 40%
4+ bed 10% 10% 25%
In considering the appropriate mix of housing on individual development sites, the SHMA
recommends that its findings should be considered alongside up-to-date local evidence including on
the existing mix of housing at a neighbourhood or settlement level, the development pipeline in the
area and extent to which this will support a range of sizes of homes, and the location and nature of
the development site.
The SHMA shows that within Crawley Town Centre the development pipeline is particularly skewed
toward 1- and 2-bed properties.
R13: To ensure balance within the market and provide a choice of accommodation in Crawley
Town Centre, 30% of market homes within development schemes should have 3- or more
bedrooms where it is feasible to do so.
Given land supply constraints in Crawley, it is likely that a proportion of the Borough’s housing needs
will need to be met within neighbouring areas. It is reasonable that where sites are meeting or
contributing to meeting the housing needs of Crawley, that they take account of the nature of
Crawley’s housing need. It would be reasonable for such housing to be priced to be affordable to
households in Crawley; and that Duty to Cooperate discussion take place in respect of the extent to
which different authorities have ‘nominations rights’ over affordable housing provision on sites or at
locations identified as contributing to meeting a Crawley unmet need.
R14: Duty to Cooperate discussions should take place to inform clear policies regarding the
mix of housing brought forward on sites ‘at Crawley’ informed by the SHMA and ideally
consistent assessment of the viability position. This should take into account the profile of
Crawley’s housing needs and consider how affordable housing will be allocated.
Build-to-Rent Development
Build-to-Rent development is currently a relatively embryonic market outside of London. There is
however a pipeline of schemes now progressing in Crawley; and potential that in time Build-to-Rent

161
development additionally comes forward in Horsham. It is therefore appropriate that the two councils
consider the sector and craft planning policies which help to support it and provide clarity on how
policies will be applied to it.
The evidence points towards growth in the Private Rented Sector in both Horsham and Crawley in
recent years, and reasonable rental growth over the period since 2011. In the short-term there is
greater potential for Build-to-Rent development in Crawley, influenced by its demographic
composition (with higher numbers of younger people) and a larger existing Private Rented Sector.
To date one scheme has been built, and there are a further 4 in the pipeline.
Iceni consider that planning policy should support the growth of the sector, and that emerging local
plans should include specific policies on build-to-rent development. In considering how affordable
housing might be applied to this form of development need to balance a number of considerations:
the scale of affordable housing need and nature of housing land supply within the area; viability
evidence which considers the dynamics of the build-to-rent sector and its ability to support affordable
housing; and the Government support for the Build-to-Rent sector and acknowledgement of the role
which this play in increasing overall housing delivery. These considerations may result in differences
in the policy approach to Build-to-Rent development within Town Centre as against greenfield/ urban
extension sites.
R15: Both Councils should include a policy supporting Build-to-Rent development in their
emerging local plans. This should specify the types of locations which are considered
suitable for such development, which we would consider would include Crawley and
Horsham Town Centre and the Three Bridges Corridor.
R16: The Councils should, subject to viability testing, include a clear policy on the level of
affordable housing provision to be sought within Build-to-Rent schemes. This may differ by
location taking account of the nature of the market and viability evidence.
Communal Living
Communal living as a housing product is ultimately very embryonic with no specific evidence to
support the demand for such a housing product. However, there are clear benefits around communal
living in housing delivery terms amongst other areas. There is potential for community-led housing
schemes, including co-living/buying schemes to come forward, and to contribute positively to housing
delivery in Northern West Sussex.
R17: Should a community group come forward with a particular aspiration to deliver a
communal living scheme, the Councils should look to work with that group and any
associated developer to identify and bring forward a site which meets that localised need.

162
Self- and Custom-Build Development
Self- and custom-build development is also a growing sector of the housing market, and one which
has potential to contribute to housing delivery – probably particularly in Horsham District. There are
however different potential development models. One would see a component of larger strategic
sites earmarked for self- and custom-build development, in particular to support the accelerated
delivery of these sites through supporting product differentiation.
R18: The Councils should consider setting policies requiring a proportion of plots on larger
sites, say of over 100 homes, to include a proportion of plots for self and custom-build homes
where it is feasible to do so.
Iceni however consider that the Councils should also support development of self- and custom-build
housing on smaller development schemes, including in/adjoining rural settlements within Horsham
District, and local plans should include policies to guide such developments.

163

164
APPENDIX 1: MIGRATION FLOWS TO HORSHAM AND CRAWLEY
Migration Inflows to Crawley and Horsham, 2016-17
Destinat
ion
Origin
1st 2d 3rd 3th 5th 6th 7th 8th 9th 10th
Crawley Reigat
e and
Banste
ad
(590)
Mid
Susse
x (350)
Horsha
m
(280)
Croydo
n (280)
Tandrid
ge
(150)
Sutton
(140)
Brighton
and
Hove
(130)
Mole
Valley
(70)
Merton
(70)
Chiche
ster
(60)
Horsha
m
Crawle
y (700)
Bright
on and
Hove
(540)
Mid
Sussex
(500)
Mole
Valley
(390)
Chiche
ster
(330)
Reigate
and
Banstea
d (310)
Worthing
(270)
Arun
(260)
Waverle
y (260)
Adur
(210)
Mid
Sussex
Bright
on and
Hove
(990)
Crawle
y (700)
Tandri
dge
(490)
Lewes
(410)
Horsha
m (360)
Wealde
n (350)
Croydon
(330)
Reigate
and
Banstea
d (260)
Wandsw
orth
(130)
Sutton
(120)
Tandrid
ge
Croyd
on
(1,530
)
Reigat
e &
Banste
ad
(580)
Sutton
(280)
Bromle
y (270)
Mid
Sussex
(260)
Seveno
aks
(180)
Wandsw
orth
(140)
Lambeth
(140)
Crawley
(120)
Merton
(120)
Reigate
&
Banstea
d
Sutton
(1,070
)
Croyd
on
(790)
Epsom
and
Ewell
(560)
Tandri
dge
(530)
Merton
(440)
Mole
Valley
(400)
Crawley
(300)
Wandsw
orth
(290)
Kingston
upon
Thames
(240)
Lambet
h (160)
Mole
Valley
Reigat
e and
Banste
ad
(550)
Epsom
and
Ewell
(450)
Elmbri
dge
(340)
Guildfo
rd
(300)
Sutton
(260)
Kingsto
n upon
Thames
(260)
Wandsw
orth
(140)
Merton
(130)
Richmon
d upon
Thames
(130)
Croydo
n (110)
Source: ONS Migration Matrices

165
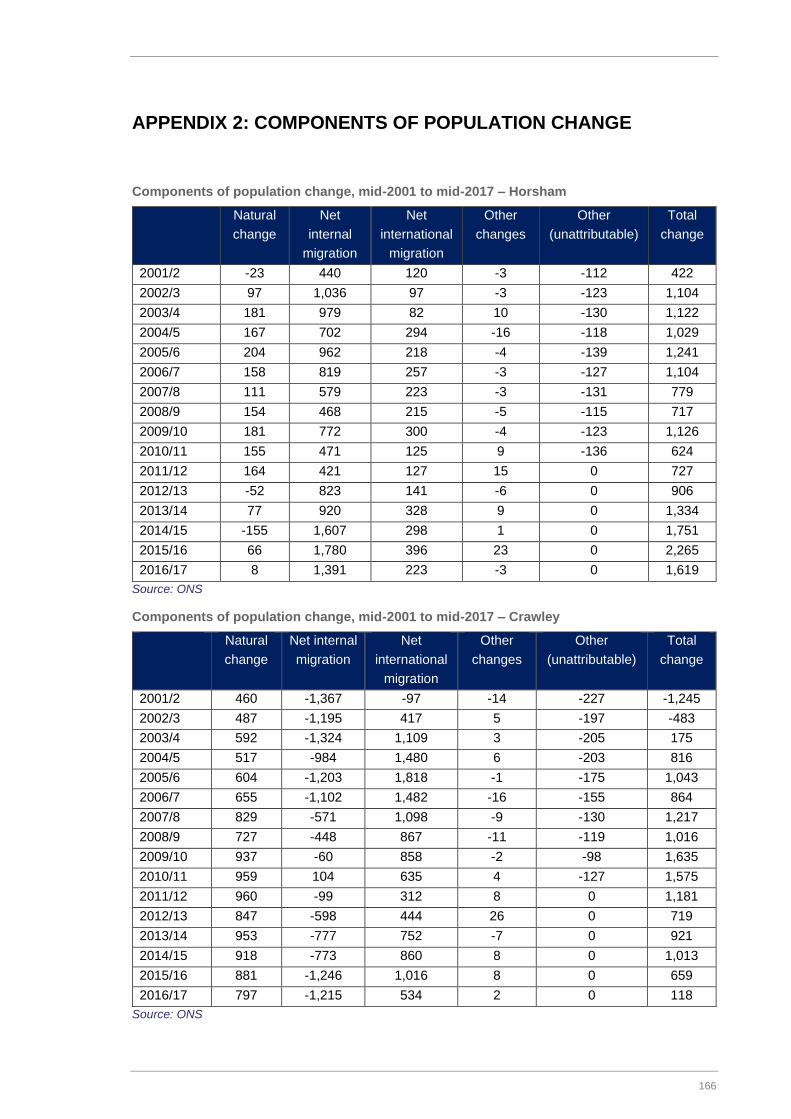
166
APPENDIX 2: COMPONENTS OF POPULATION CHANGE
Components of population change, mid-2001 to mid-2017 – Horsham
Natural
change
Net
internal
migration
Net
international
migration
Other
changes
Other
(unattributable)
Total
change
2001/2 -23 440 120 -3 -112 422
2002/3 97 1,036 97 -3 -123 1,104
2003/4 181 979 82 10 -130 1,122
2004/5 167 702 294 -16 -118 1,029
2005/6 204 962 218 -4 -139 1,241
2006/7 158 819 257 -3 -127 1,104
2007/8 111 579 223 -3 -131 779
2008/9 154 468 215 -5 -115 717
2009/10 181 772 300 -4 -123 1,126
2010/11 155 471 125 9 -136 624
2011/12 164 421 127 15 0 727
2012/13 -52 823 141 -6 0 906
2013/14 77 920 328 9 0 1,334
2014/15 -155 1,607 298 1 0 1,751
2015/16 66 1,780 396 23 0 2,265
2016/17 8 1,391 223 -3 0 1,619
Source: ONS
Components of population change, mid-2001 to mid-2017 – Crawley
Natural
change
Net internal
migration
Net
international
migration
Other
changes
Other
(unattributable)
Total
change
2001/2 460 -1,367 -97 -14 -227 -1,245
2002/3 487 -1,195 417 5 -197 -483
2003/4 592 -1,324 1,109 3 -205 175
2004/5 517 -984 1,480 6 -203 816
2005/6 604 -1,203 1,818 -1 -175 1,043
2006/7 655 -1,102 1,482 -16 -155 864
2007/8 829 -571 1,098 -9 -130 1,217
2008/9 727 -448 867 -11 -119 1,016
2009/10 937 -60 858 -2 -98 1,635
2010/11 959 104 635 4 -127 1,575
2011/12 960 -99 312 8 0 1,181
2012/13 847 -598 444 26 0 719
2013/14 953 -777 752 -7 0 921
2014/15 918 -773 860 8 0 1,013
2015/16 881 -1,246 1,016 8 0 659
2016/17 797 -1,215 534 2 0 118
Source: ONS

167

168
APPENDIX 3: ANALYSIS OF HOUSEHOLD REPRESENTATIVE
RATES
Projected Household Representative Rates by age of head of household – Horsham
15-24 25-34
35-44 45-54
55-64 65-74
75-84 85 and over
0
0,05
0,1
0,15
0,2
2001
2003
2005
2007
2009
2011
2013
2015
2017
2019
2021
2023
2025
2027
2029
2031
2033
2035
2037
2039
2016-based
2014-based
2008-based
0,35
0,4
0,45
0,5
0,55
2001
2003
2005
2007
2009
2011
2013
2015
2017
2019
2021
2023
2025
2027
2029
2031
2033
2035
2037
2039
2016-based
2014-based
2008-based
0,45
0,5
0,55
0,6
0,65
2001
2003
2005
2007
2009
2011
2013
2015
2017
2019
2021
2023
2025
2027
2029
2031
2033
2035
2037
2039
2016-based
2014-based
2008-based
0,5
0,55
0,6
0,65
0,7
2001
2003
2005
2007
2009
2011
2013
2015
2017
2019
2021
2023
2025
2027
2029
2031
2033
2035
2037
2039
2016-based
2014-based
2008-based
0,5
0,55
0,6
0,65
0,7
2001
2003
2005
2007
2009
2011
2013
2015
2017
2019
2021
2023
2025
2027
2029
2031
2033
2035
2037
2039
2016-based
2014-based
2008-based
0,5
0,55
0,6
0,65
0,7
2001
2003
2005
2007
2009
2011
2013
2015
2017
2019
2021
2023
2025
2027
2029
2031
2033
2035
2037
2039
2016-based
2014-based
2008-based

169
Source: Derived from ONS and CLG data
Projected Household Representative Rates by age of head of household – Crawley
15-24 25-34
35-44 45-54
55-64 65-74
0,6
0,65
0,7
0,75
0,8
2001
2003
2005
2007
2009
2011
2013
2015
2017
2019
2021
2023
2025
2027
2029
2031
2033
2035
2037
2039
2016-based
2014-based
2008-based
0,75
0,8
0,85
0,9
0,95
2001
2003
2005
2007
2009
2011
2013
2015
2017
2019
2021
2023
2025
2027
2029
2031
2033
2035
2037
2039
2016-based
2014-based
2008-based
0
0,05
0,1
0,15
0,2
2001
2003
2005
2007
2009
2011
2013
2015
2017
2019
2021
2023
2025
2027
2029
2031
2033
2035
2037
2039
2016-based
2014-based
2008-based
0,35
0,4
0,45
0,5
2001
2003
2005
2007
2009
2011
2013
2015
2017
2019
2021
2023
2025
2027
2029
2031
2033
2035
2037
2039
2016-based
2014-based
2008-based
0,45
0,5
0,55
0,6
0,65
2001
2003
2005
2007
2009
2011
2013
2015
2017
2019
2021
2023
2025
2027
2029
2031
2033
2035
2037
2039
2016-based
2014-based
2008-based
0,5
0,55
0,6
0,65
0,7
2001
2003
2005
2007
2009
2011
2013
2015
2017
2019
2021
2023
2025
2027
2029
2031
2033
2035
2037
2039
2016-based
2014-based
2008-based

170
75-84 85 and over
Source: Derived from ONS and CLG data
0,5
0,55
0,6
0,65
0,7
2001
2003
2005
2007
2009
2011
2013
2015
2017
2019
2021
2023
2025
2027
2029
2031
2033
2035
2037
2039
2016-based
2014-based
2008-based
0,5
0,55
0,6
0,65
0,7
2001
2003
2005
2007
2009
2011
2013
2015
2017
2019
2021
2023
2025
2027
2029
2031
2033
2035
2037
2039
2016-based
2014-based
2008-based
0,6
0,65
0,7
0,75
0,8
2001
2003
2005
2007
2009
2011
2013
2015
2017
2019
2021
2023
2025
2027
2029
2031
2033
2035
2037
2039
2016-based
2014-based
2008-based
0,75
0,8
0,85
0,9
0,95
2001
2003
2005
2007
2009
2011
2013
2015
2017
2019
2021
2023
2025
2027
2029
2031
2033
2035
2037
2039
2016-based
2014-based
2008-based

171
APPENDIX 4: ECONOMIC ACTIVITY RATE ASSUMPTIONS
Projected changes to economic activity rates (2019 and 2039) – Horsham
Males Females
2019 2039 Change 2019 2039 Change
16-19 48.6% 47.5% -1.2% 53.4% 52.5% -0.9%
20-24 91.4% 93.4% 2.0% 85.5% 87.0% 1.6%
25-29 94.4% 94.4% 0.0% 88.6% 88.6% 0.0%
30-34 95.3% 95.2% -0.2% 85.0% 86.0% 1.0%
35-39 96.9% 96.0% -0.9% 83.6% 86.1% 2.5%
40-44 96.4% 95.2% -1.2% 85.7% 89.5% 3.8%
45-49 95.9% 95.0% -0.9% 85.5% 89.9% 4.3%
50-54 94.9% 93.5% -1.4% 83.6% 86.2% 2.6%
55-59 90.0% 90.0% 0.0% 81.0% 83.4% 2.4%
60-64 72.7% 80.3% 7.6% 63.5% 73.5% 10.0%
65-69 37.3% 49.7% 12.4% 23.9% 41.1% 17.2%
70-74 20.9% 23.2% 2.3% 12.9% 19.2% 6.3%
75-89 5.1% 6.5% 1.3% 2.1% 5.4% 3.3%
Source: OBR and Census 2011
Projected changes to economic activity rates (2019 and 2039) – Crawley
Males Females
2019 2039 Change 2019 2039 Change
16-19 53.6% 52.4% -1.2% 56.2% 55.2% -0.9%
20-24 90.3% 92.3% 2.0% 82.3% 83.9% 1.6%
25-29 95.2% 95.2% 0.0% 83.7% 83.8% 0.0%
30-34 93.7% 93.5% -0.2% 81.1% 82.1% 1.0%
35-39 94.9% 94.0% -0.9% 83.1% 85.5% 2.5%
40-44 93.9% 92.7% -1.2% 83.7% 87.5% 3.8%
45-49 93.3% 92.4% -0.9% 85.8% 90.1% 4.3%
50-54 92.2% 90.8% -1.4% 82.3% 84.9% 2.6%
55-59 89.1% 89.1% 0.0% 81.4% 83.8% 2.4%
60-64 71.6% 79.2% 7.6% 61.2% 71.2% 10.0%
65-69 31.1% 43.5% 12.4% 23.3% 40.5% 17.2%
70-74 16.5% 18.8% 2.3% 10.4% 16.8% 6.3%
75-89 5.1% 6.5% 1.3% 2.1% 5.4% 3.3%
Source: OBR and Census 2011
Recommended