TKK Reports in Forest Products Technology, Series A8
Espoo 2009
NOVEL METHODS TO CHARACTERIZE INK - COATING INTERACTIONS, COATING STRUCTURE AND SURFACE ENERGY Doctoral thesis
Deqiang Ma
TEKNILLINEN KORKEAKOULU TEKNISKA HÖGSKOLAN HELSINKI UNIVERSITY OF TECHNOLOGY TECHNISCHE UNIVERSITÄT HELSINKI UNIVERSITE DE TECHNOLOGIE D’HELSINKI

1
TKK Reports in Forest Products Technology, Series A8
Espoo 2009
NOVEL METHODS TO CHARACTERIZE INK / COATING
INTERACTIONS, COATING STRUCTURE AND SURFACE
ENERGY
Doctoral thesis
Deqiang Ma
Dissertation for the degree of Doctor of Science in Technology to be presented with due
permission of the Faculty of Chemistry and Materials Sciences for public examination
and debate in Auditorium Puu II at Helsinki University of Technology (Espoo, Finland)
on the 29th of May, 2009, at 12 noon.


ABSTRACT OF DOCTORAL DISSERTATION HELSINKI UNIVERSITY OF TECHNOLOGY
P.O. BOX 1000, FI-02015 TKK http://www.tkk.fi
Author Deqiang Ma
Name of the dissertation
Novel Methods to Characterize Ink/Coating Interactions, Coating Structure and Surface Energy
Manuscript submitted February 22, 2009 Manuscript revised April 23, 2009
Date of the defence May 29, 2009
Monograph x Article dissertation (summary + original articles)
Faculty Chemistry and Materials Sciences
Department Forest Products Technology
Field of research Forest Products Chemistry
Opponent(s) Prof. Lars Järnström
Supervisor Prof. Janne Laine
Instructor Prof. em. Per Stenius
Abstract
The main focus of this thesis is to analyze capillary adsorption of heterogeneous porous paper coatings. The approach is to develop a novel Gibbs energy model, analyze the structure and surface energy parameters of pilot coated paper and board samples, and compare results to ink tack kinetics.
Recent studies have modeled and verified that when inertial force and kinetic energy are included, a smaller diameter capillary starts to fill faster. In addition, other retarding forces, such as local transient sticking of the ink vehicle at surface asperities or chemical inhomogeneities, capillary surface topography and connections between capillaries or physical inhomogeneities in coating, affect the total rate of imbibition. While these resistant factors are very important none of them changes the fact that the basic force driving spontaneous imbibition is the total liquid sorption energy in all various capillaries.
This thesis suggests that the change in Gibbs free energy of a liquid associated with its imbibition into capillaries of coating can be used to describe such driving energy. It first derives an expression for this quantity then shows how specific Gibbs energy correlates with the time to reach maximum ink tack, tmax for carbonate-kaolin and latex based coatings. The application of the Gibbs energy model shows that for a relatively constant liquid-solid-vapor interface a larger capillary pore surface area strongly increases the rate of ink setting, as measured by the reduced tmax. In contrast, there is no correlation between ink tack development and pigment surface area or peak pore size of the coating which are currently in use. This new model analyzing Gibbs energy has advantages of combining porous structure variables (volume and diameter, Σ(Vi/Di)) and surface energy parameters (γcosθ) at the interface which often vary concurrently when coating components change, and being independent of many details of time-dependent variables.
Surface topography affects liquid-solid-vapor/air interfaces. The second part of the thesis describes simultaneous
characterization of surface topographies, using Near-field scanning optical microscopy. Finally, the thesis relates light
scattering and absorption to the influence of fine kaolin and carbonates on coating structure and water soluble chemical such as fluorescence whitening agent distribution and efficiency in paper coating.
Keywords Coating structure, Gibbs energy, surface energy, capillary adsorption, topography, scattering
ISBN (printed) 978-951-22-9881-5 ISSN (printed)
ISBN (pdf) 978-951-22-9882-2 ISSN (pdf) 1797-5093
Language English Number of pages 75 p. + app. 67 p.
Publisher Helsinki University of Technology, Department of Forest Products Technology
Print distribution Helsinki University of Technology, Department of Forest Products Technology
x The dissertation can be read at http://lib.tkk.fi/Diss/


PREFACE
This study was not possible without the generous encouragement and excellent guidance from Prof. Janne Laine. For years, Professor (emeritus) Per Stenius has given me his insight and broad knowledge on surface chemistry that built the foundation to the Gibbs free energy model development for capillary imbibition phenomenon. This study, which features a fundamental approach with direct industrial applications, could not bear fruits without the strong support from my boss, Dr. Douglas Carter at KaMin LLC. I am deeply indebt to each of them.
In addition to the Gibbs energy of thermal dynamic fundamentals at liquid-solid-vapor interface, this thesis also ventured efforts on light-solid-air interface in optic coating. It was Prof. Aristide Dogariu who guided me on optics that opened a colorful laser world in front of me, and helped me to introduce NSOM into smooth paper coatings. Because blade coating runs at 80-100 km/h, fluid dynamics has enormous influence over liquid-particle-blade interactions, influencing 3D coating structure formation. Prof. Douglas Bousfield coached me on computer simulations of coating color flow in a shear field. Prof. Martti Toivakka is thanked for his great teaching on my minor study. I feel extremely fortunate and grateful for having their great guidance.
I also want to thank:
* Dr. Susanna Holappa at the Department of Forest Products Technology of Helsinki University of Technology for arranging lab measurements.
* PhD candidate David Haefner at the College of Optics and Photonics of Central Florida University for his diligent measurements of NSOM, and as the co-author of two papers.
* PhD candidate Jong Sonn at the Department of Chemical and Biological Engineering of University of Maine for teaching me running micro-tack device and continuing the measurements.
* My co-workers Brent Nobles, Aubrey Smith, John Taylor, and Tracy White for helping me on pigment and coating characterizations.
* Mrs. Ritva Vuorinen for working on the abstract format. * PhD candidate Jani Salmi for helping with the thesis format and for ensuring
that our “printing jobs” are correct and on time. * My friends in Finland and America for their ongoing support and friendship
It has been my honor and pleasure to know and work with all of them! Lastly, my wife, Jingwei and son, Jun (Jimmy) have been firmly beside me
throughout this process. Jingwei has sacrificed her personal time and devoted her energy in supporting me 24x7. Jimmy didn’t ask much of my time and graduated from Emory University among top 100 out of 1600 undergraduates. We are very proud parents! It is their unconditional love that keeps me going! Warner Robins, Georgia, USA, April 30th, 2009 Deqiang (Dan) Ma
i
LIST OF PUBLICATIONS
This thesis is based on the results presented in seven publications which are referred
to by Roman numbers in the text. Papers I-III focus on developing a novel model of
using Gibbs free energy to describe capillary adsorption. Paper IV uses Near-field
scanning optical microscopy (NSOM) to simultaneously characterize coated paper
surface topography and optical contrast. Paper V investigates the whole coating
structure influence on water soluble fluorescence whitening agent distribution and
efficiency in coatings. Paper VI and VII give practical and computer simulation
results of coating structures.
Paper I
Ma, D., Carter, R. D., Laine, J. and Stenius, P. (2007): Gibbs energy analysis of ink
oil imbibition during ink setting, Nordic Pulp and Paper Research Journal, 22(4),
523-527.
Paper II
Ma, D., Carter, R. D., Laine, J. and Stenius, P. (2008a): Gibbs energy of imbibition of
non-polar and polar solutions into calcium carbonate and kaolin coatings, Nordic Pulp
and Paper Research Journal, 23(3), 333-337.
Paper III
Ma, D., Carter, R. D., Laine, J. and Stenius, P. (2009): The influence of coating
structure and surface energy on Gibbs energy of ink oil imbibition during ink setting,
Nordic Pulp and Paper Research Journal, 24(2), to be published in June, 2009.
Paper IV
Ma, D., Carter, R.D, Haefner, D. and Dogariu, A. (2008b): Simultaneous
characterization of coated paper topography and optical contrast by Near-field
scanning optical microscopy (NSOM), Nordic Pulp and Paper Research Journal,
23(4), 438-443
ii

Paper V
Ma, D., Carter, R.D, Haefner, D. and Dogariu, A. (2008c): The influence of fine
kaolin and ground calcium carbonates on the efficiency and distribution of
fluorescence whitening agents (FWA) in paper coating, Nordic Pulp and Paper
Research Journal,23(3), 327-332.
Papers presented at Conferences
Paper VI
Ma, D., Carter, R.D, Chen, C. and Hardy, R.H. (2005): Print mottle reduction through
clay engineering and pore structuring in paper coating, TAPPI Proc. Coating Conf.
Toronto, April 17-20, 2005, TAPPI Press, CD-Rom, Session 27.
Paper VII
Ma, D., Carter, R.D, and Bousfield, D. W. (2008): Prediction of coating structure
change during calendering, 10th TAPPI Coating Fundamental Symposium, Montreal,
June 11-13, 2008, TAPPI Press, Atlanta, pp121-132.
Author’s contribution to the appended joint publications: In Papers I-III, Deqiang Ma developed a novel model of charaterizing ink and coating
interactions using Gibbs free energy concept with inclusions of heterogeneous porous
medium structure and liquid-solid-vapor interface in capillary adsorption. He also
designed and performed coating experiments, measured contact angles, coating pore
size and volume distributions, calculated Gibbs energy and wrote the manuscipts. In
Paper IV and V, Deqiang Ma proposed the basic approaches following surface
chemistry and optics fundamentals, designed and performed the coating experiments,
analyzed the results, and wrote the manuscripts while College of Optics and Photonics
of Central Florida University, USA and Finnish Pulp and Paper Research Institute
deligently performed measurements of NSOM and optical microscopy under UV
light, respectively. In Paper VI and VII, Deqiang Ma designed coating and
calendering, and simulated the particle rotation in a shear field with the software
developed by Univeristy of Maine, USA. The co-authors of publications contributed
to theoretical discusssions.
iii

LIST OF SYMBOLS
AFM Atomic force microscopy (sec. 7.3)
C(N, ∆θ) Optical contrast (sec. 7.2)
C(r) Autocorrelation function (sec. 7.1)
Di Diameter filled with liquid (sec. 3.3)
DIM Diodomethane (sec. 4.3)
DOE Design of experiment (sec. 10.1)
EDS Energy dispersive spectrometry (sec. 5.5)
EO 2-ethoxyethanol (sec. 4.3)
Fmax The maximum ink tack force (sec. 5.6)
FMD Formamide (sec. 4.3)
FWA Fluorescence whitening agents (sec. 10)
ΔGL Gibbs energy of an incompressible liquid (sec. 3.3)
ΔGs Specific Gibbs energy (sec. 3.3)
H(r) Height-height correlation function (sec. 7.1)
hi The length of the cylinder filled with liquid (sec. 3.3)
Ii Irradiance (sec. 10.1)
N The number of “equivalent scattering centers” (sec. 7.2)
iv
NSOM Near field scanning optical microscopy (sec. 7.3)
ΔP The pressure drop across a curved interface (sec. 3.3)
R Reflection coefficient (sec. 10)
rms Root mean square (sec. 7.1)
SEM Scanning electron microscopy (sec. 8.1)
tmax Time needed to reach the maximum ink tack force (sec. 5.6)
Tslab Transmittance through the slab (sec. 10)
Vi Liquid volume in the ith capillary (sec. 3.3)
∑(Vi/Di) Coating structure variables (sec. 5.7)
w Interface width (sec. 7.1)
αabs Light absorption coefficient (sec. 10)
αEXT Light extinction coefficient (sec. 10)
αscatt Light scattering coefficient (sec. 10)
γ Liquid surface tension (sec. 3.4)
γAB Short-range Lewis acid-base interactions (sec. 3.5)
γcosθ Surface energy parameters (sec. 5.7)
γd The contribution of dispersion (London) interactions (sec. 3.4)
v

γLW Lifshitz-van der Waals interactions, includes London (dispersion),
Keesom (dipole-dipole) and Debye (dipole-induced dipole) interactions
(sec. 3.5)
γp Includes all other interactions, collectively called “polar” interactions
(sec. 3.4)
γ+ Acid component (sec. 3.5)
γ-- Basic component (sec. 3.5)
λ Wave length (sec. 10)
μ Fluid viscosity (sec. 3.3)
∆θ The phase distribution of scattering centers (sec. 7.2)
ρv Volume density of pores (sec. 10)
σs Scattering cross-section (sec. 10)
vi

TABLE OF CONTENTS PREFACE......................................................................................................................i LIST OF PUBLICATIONS ........................................................................................ii LIST OF SYMBOLS ..................................................................................................iv
1. INTRODUCTION AND OUTLINE OF THE STUDY........................................1 2. PART A, BACKGROUND AND MODEL DEVELOPEMENT.........................3
2.1 The need to analyze capillary adsorption using Gibbs energy .....................3 2.2 Imbibition of ink vehicle into porous coatings.............................................3 2.3 Gibbs free energy of liquids in a porous medium ........................................4 2.4 Surface energy theories ................................................................................8 2.4.1 Polar and non-polar components ...............................................................8 2.4.2 Lifshitz-van der Waals and Lewis acid-base components.........................9
3. PART A, EXPERIMENTAL ................................................................................10 3.1 Materials…. ................................................................................................10 3.1.1 Pigments and paper coatings ...................................................................10 3.1.2 Latex and board coatings.........................................................................11 3.2 Coating capillary diameter, volume and surface area measurements.........12 3.3 Contact angles with different polarity liquids ............................................13 3.3.1 Binary solutions and diiodomethane for coated paper surface................13 3.3.2 Diiodomethane, formamide and water for coated board surface.............15 3.4 Ink tack measurement.................................................................................15
4. PART A, RESULTS AND DISCUSSIONS .........................................................16 4.1 Pore structure characterized by mercury porosimetry................................16 4.1.1 Pore size distribution of coated paper......................................................16 4.1.2 Pore size distribution of coated board .....................................................17 4.2 Contact angles on coated paper and board .................................................18 4.2.1 Contact angles on coated paper surface...................................................18 4.2.2 Contact angles on coated board surface ..................................................20 4.3 Calculations of Gibbs energy .....................................................................21 4.4 Liquid surface energy and polarity influence on Gibbs energy..................24 4.5 Latex and kaolin chemistry influence on coating surface energy ..............25 4.6 Gibbs energy and ink tack kinetics.............................................................27 4.6.1 Ink tack on coated paper..........................................................................27 4.6.2 Ink tack on coated board..........................................................................28 4.7 Coating structure and surface energy influence on coated paper ...............31 4.8 Coating structure and chemistry influence on coated board.......................33
5. PART A, CONCLUSIONS ...................................................................................35 6. PART B, BACKGROUND AND THEORIES ....................................................37
6.1 Techniques for surface topography characterizations ................................37 6.2 Surface topography and optical contrast ....................................................38 6.3 Brief description of Near-field scattering optical microscopy ...................39
7. PART B, PILOT COATER RUN AND NSOM MEASUMENTES..................41 8. PART B, RESULTS AND DISCUSSION............................................................42
8.1 Surface topography and optical contrast ....................................................42
8.2 Coating surface roughness, correlation length and autocorrelation ...........45 8.3 Coating surface optical contrast and scattering ..........................................49
9. PART B, CONCLUSION......................................................................................51 10. PART C, BACKGROUND AND THEORIES..................................................52 11. PART C, EXPERIMENTAL ..............................................................................52
11.1 Pigment properties of coatings .................................................................57 11.2 Preparation and properties of coatings .....................................................57 11.3 Optical measurements of coated samples.................................................58
12 PART C, RESULTS AND DISCUSSION ..........................................................59 12.1 Coating structure with fine kaolin and calcium carbonate .......................59 12.2 Pimgnet influence on TAPPI brightness and CIE whiteness ...................59 12.3 GCC and kaolin packing influence on CIE whiteness .............................61 12.4 FWA distribution in coatings with different kaolin levels .......................62
13. PART C, CONCLUSION....................................................................................65 14. CONCLUSIONS .................................................................................................66 REFRENCES .............................................................................................................68

1. INTRODUCTION AND OUTLINE OF THE STUDY
The work was started and mainly conducted at Huber Engineered Materials, Macon, Georgia
(now KaMin LLC), USA and the Department of Forest Products Technology of Helsinki
University of Technology, Espoo, Finland. A part of the research work focusing on coated
paper surface topography and optical contrast characterizations was completed in cooperation
with the College of Optics and Photonics of Central Florida University, Orlando, Florida,
USA. Computer simulation work of particle flows was done by using software developed by
University of Maine, USA.
The overall aim of this study is to analyze capillary adsorption in heterogeneous
porous coating by applying thermodynamic fundamentals on a macro scale. The main focus is
to take a novel fundamental approach using Gibbs energy concept to investigate capillary
adsorption in coatings. The objective of the second part is to simultaneously characterize the
surface topography that affects wetting phenomena and optical contrast, applying Near-field
scanning optical microscopy to paper coating research. The optical near field features light
wave length distance, and therefore has great potential in thin layer coating with nano
particles on a micro scale. The objective of the third part is to study the influence of fine
kaolin and calcium carbonates on coating structure and, in turn, its impact on water soluble
chemical such as fluorescence whitening agent distribution and efficiency.
PART A (Papers I-III) presents a Gibbs energy analysis of ink oil imbibition during ink
setting. The specific change in Gibbs energy, ΔGs, when a probe liquid is imbibed in a porous
medium, is calculated from the capillary diameter and volume of the pores, and the surface
tension and contact angle of the liquid. Capillary pore volumes and equivalent pore diameters
of a series of double coated and super calendered paper samples are determined by mercury
porosimetry. ΔGs of imbibition of diiodomethane (DIM), water, and binary solutions of
formamide (FMD), water and 2-ethoxyethanol (EO) with surface tensions 40, 50, 60 and 70
mJ m-2 into six coatings are calculated. Dispersive and polar components of surface energies
of coatings are evaluated from contact angles of water and DIM, using the Owens and Wendt
approach. The time to reach the maximum tack force, tmax of an oil-based offset ink is
measured for all coatings. The relative chemical concentrations are investigated by energy
dispersive spectroscopy (EDS).
1
In paper coating experiments, the studies describe pigment types i.e. calcium
carbonate and kaolin (aluminosilicate) influence on ΔGs when different polarity liquids are
used (Papers I-II). The studies show that ΔGs associated with imbibition of probe liquid into
porous coating can basically be treated as a product of coating structure variables (volume and
diameter, ∑(Vi/Di)) and surface energy parameters (γcosθ, in which γ is the liquid surface
tension and θ is the contact angle at the interface), i.e. ΔGs highlights interactive properties of
the porous coating surface and probe liquid. In board coatings where higher level of kaolin
and latex are used, it presents their chemistry influence on ΔGs (Paper III). The investigation
shows that ΔGs with coating structure variables (volume and diameter, ∑(Vi/Di)) and surface
energy parameters (γcosθ) are affected by changes in kaolin and latex chemistries. It
demonstrates that compared to styrene/n-butyl acrylate latex, n-butyl acrylate-acrylonitrile-
styrene latex lowered γLW on coated board surface, and significantly increased tmax, and
reduced the maximum tack force, Fmax, and the final tack.
PART B (Paper IV) introduces a simultaneous characterization of coating topography and
optical contrast by Near-field scanning optical microscope (NSOM), with verifications by
scanning electron microscope (SEM) and atomic force microscope (AFM). This study
demonstrates that the NSOM provides a unique capability of measuring simultaneously the
information about both local topography and optical contrast at resolutions better than
conventional far-field techniques. This study shows that the addition of fine kaolin increases
the topography correlation length resulting in a smoother varying surface contour.
Furthermore, the topography correlation length increases with different amounts in orthogonal
directions indicating the creation of a certain degree of surface anisotropy.
PART C (Paper V) characterizes fluorescence whitening agents (FWA) efficiency by
TAPPI brightness and ISO CIE whiteness. Classic optical theory applications in light
transmittance are further verified by another pilot scale coating with mixture design of
experiment (DOE). FWA distribution is studied by optical microscopy of coated paper cross
section under UV light. This study demonstrates that increasing fine kaolin level at the
expense of narrow GCC makes FWA concentrate more towards the surface. Based on optical
calculations and experiment results, it proposes desired coating structure and FWA
distribution for high UV light efficiency in coatings.
2
2. PART A, BACKGROUND AND MODEL DEVELOPEMENT
2.1 The need to analyze capillary adsorption using Gibbs energy
In general, pigment coating is considered as surface treatment for improving paper and board
surface and structure properties. The coated surface often provides a smooth texture with
good optical and topography for printing. Depending on coating ingredients used, a thin
coating layer featuring a few to tens micrometers can have very different physical and
chemical surface and structure properties. Such a layer physically and chemically interacts
with oil and aqueous liquids contained in printing and packaging, hence it is important to
study the coating physical structure and chemical property together.
The critical parameters of coating structure having an influence on liquid imbibition
on ink setting, film split and leveling are the nature of the liquid-solid-vapor interface as well
as the capillary diameter and pore volume distributions. Capillaries of a given volume with
small diameters tend to have a relatively stronger influence on the ink tack build rate than
capillaries with a larger diameter but a marginally larger pore volume (Paper VI). It was
therefore felt that some way of characterizing the pore structure and surface energy that
correlates better with ink tack than pore diameter or volume distribution alone was needed.
This part suggests that the change in specific Gibbs energy of a liquid associated with its
imbibition into the capillary of a porous medium may provide such characteristics. It first
derives an expression for such a quantity then proceeds to show how specific Gibbs energy
correlates with the time to reach the maximum ink tack for some carbonate-kaolin and latex
based paper coatings featuring a heterogeneous porous medium.
2.2 Imbibition of ink vehicle into porous coatings
A simple model of the kinetic imbibition into a capillary is the well-known Lucas-Washburn
(LW) equation (Washburn, 1921). This equation was derived from the assumptions that the
driving forces (capillary pressure and external pressure) are balanced by frictional forces in
the liquid, that the movement of the liquid-solid-vapor contact line is unimpeded (i.e. the
capillary wall is smooth and homogeneous), that the reservoir of liquid is infinite and that the
flow is described by the Poiseuille equation for laminar flow.
3
For the flow in a single straight capillary, the LW equation has been successfully used
in interpretations of results from basic studies of systems with simple shape (e.g. Levine et al.
1976; Fisher, Lark 1979), and extended to water and cyclohexane in glass capillaries ranging
from 0.3 to 400 μm in radii (Rye et al. 1996). The LW is valid for large times where all
influences other than capillary and friction forces are negligible (Jeje 1979; Joos et al. 1990).
Recent studies have modeled and verified that when inertial force and kinetic energy are
included, a smaller diameter capillary starts to fill faster than a larger one; the rate is
proportional to t2 (time) in initial stage, proportional to t during short transition period, then
very soon dependent linearly on t(1/2) and capillary diameter as predicted by the LW (Stange et
al. 2003). However, several industrial experimental studies have shown that a direct
application of the LW equation for a flow in a single capillary to describe the vehicle removal
from ink film into a heterogeneous porous coating is, at best, very limited (Donigian et al.
1996; Preston et al. 2002; Schoelkopf et al. 2003a; Xiang et al. 2004). Contrary to the
prediction by the LW equation, the initial imbibition preferentially takes place into capillaries
with very small diameters, due to the inertia force of the liquid (Bosanquet 1923).
Furthermore, imbibition is slower than predicted, partly due to the thickening of the ink that is
the source of the liquid (Schoelkopf et al. 2003a, 2003b), and the liquid wets and flows over a
rough and heterogeneous solid surface. In addition, many liquid-solid-vapor interface
phenomena are involved, such as surface forces, wetting thermodynamics and statistical
physics of pinning of the contact line and wetting transitions (de Gennes 1988). For spreading
liquids or liquids with very low contact angle on capillary wall, the actual meniscus may be
preceded by a thin liquid film (Derjaguin et al. 1976, Beaglehole 1989), with a thickness
varying from less than a nanometer to several nanometers. Liquid profiles in the vicinity of
the contact line are consistent with either slip or thin film boundary conditions (Dussan 1991;
Rame, Garoff 1996). Hence, the flow at the front edge of the liquid is very difficult to
characterize (Marmur 1992). In addition, local wetting properties and pore geometry
determine the curvature of the meniscus, resulting in variations in the local capillary pressure.
Taken together, all these factors make direct application of the LW equation to ink vehicle
removal due to capillary sorption difficult.
2.3 Gibbs free energy of liquids in a porous medium
A detailed understanding of the mechanism by which capillaries in a heterogeneous porous
medium are spontaneously filled by liquid is of general interest, for example, in the material
4
development of coatings and catalysts, textile, oil recovery, and space technology. Models
describing this process generally involve several parameters that are not easily accessible
experimentally (Lavi et al. 2008). On the other hand for a routine characterization and
comparison of ink imbibition and development of ink tack on different coatings one needs
some basic characteristics that can be determined rapidly and with reasonable accuracy. For
this purpose, the BET surface has been used as a measure of pigment specific surface area and
mercury porosimetry has been utilized to calculate the distribution of capillary diameters and
volumes. Interpretation of porosimetry is usually based on the simplifying assumption that all
capillaries are more or less cylindrical. However, the correlation of such data with ink tack,
which is an important phenomenological characteristic of ink setting on porous coating, often
leaves much to be desired. This thesis will show that the change in specific Gibbs energy
(ΔGs) of the imbibed ink vehicle when it is subjected to the capillary pressure correlates in a
better way with development of ink tack. ΔGs is a general characteristic which is directly
related to capillary size and volume distribution, and interface surface energy. This approach
analyzing the sorption energy has an advantage of being independent of many details of time-
dependent processes mentioned above and can be calculated in the following way.
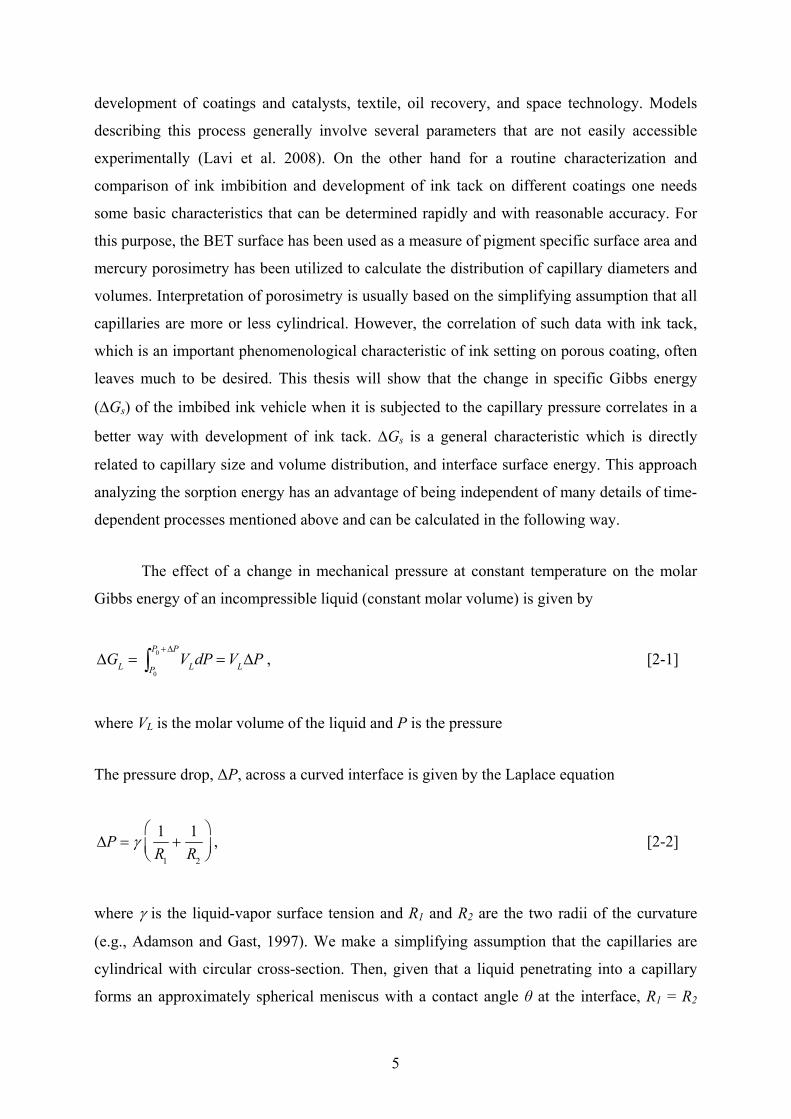
The effect of a change in mechanical pressure at constant temperature on the molar
Gibbs energy of an incompressible liquid (constant molar volume) is given by
ΔGL = VLdP
P0
P0 + ΔP
∫ = VLΔP , [2-1]
where VL is the molar volume of the liquid and P is the pressure
The pressure drop, ΔP, across a curved interface is given by the Laplace equation
ΔP = γ
1R1
+1R2
⎛
⎝⎜⎞
⎠⎟, [2-2]
where γ is the liquid-vapor surface tension and R1 and R2 are the two radii of the curvature
(e.g., Adamson and Gast, 1997). We make a simplifying assumption that the capillaries are
cylindrical with circular cross-section. Then, given that a liquid penetrating into a capillary
forms an approximately spherical meniscus with a contact angle θ at the interface, R1 = R2
5
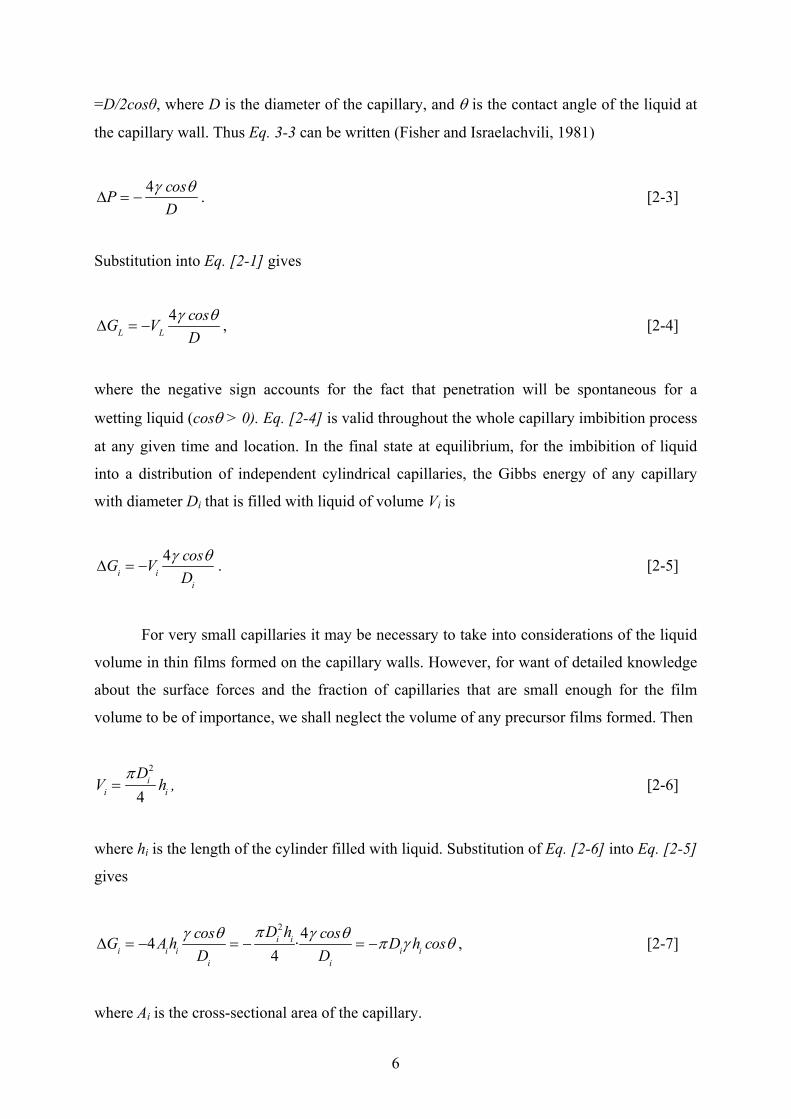
=D/2cosθ, where D is the diameter of the capillary, and θ is the contact angle of the liquid at
the capillary wall. Thus Eq. 3-3 can be written (Fisher and Israelachvili, 1981)
ΔP = −
4γ cosθD
. [2-3]
Substitution into Eq. [2-1] gives
ΔGL = −VL
4γ cosθD
, [2-4]
where the negative sign accounts for the fact that penetration will be spontaneous for a
wetting liquid (cosθ > 0). Eq. [2-4] is valid throughout the whole capillary imbibition process
at any given time and location. In the final state at equilibrium, for the imbibition of liquid
into a distribution of independent cylindrical capillaries, the Gibbs energy of any capillary
with diameter Di that is filled with liquid of volume Vi is
ΔGi = −Vi
4γ cosθDi
. [2-5]
For very small capillaries it may be necessary to take into considerations of the liquid
volume in thin films formed on the capillary walls. However, for want of detailed knowledge
about the surface forces and the fraction of capillaries that are small enough for the film
volume to be of importance, we shall neglect the volume of any precursor films formed. Then
Vi =
π Di2
4hi , [2-6]
where hi is the length of the cylinder filled with liquid. Substitution of Eq. [2-6] into Eq. [2-5]
gives
ΔGi = −4Aihi
γ cosθDi
= −π Di
2hi
4·4γ cosθ
Di
= −π Diγ hi cosθ , [2-7]
where Ai is the cross-sectional area of the capillary.
6

Several things may be noted about Eq. [2-7]. It is the work done by the surface tension
that moves the liquid along the wall of a capillary to a length of hi. At a given contact angle
and surface tension the product of diameter and length determines the change in Gibbs energy
when the liquid is imbibed. For the vertical rise of liquid in a capillary against gravity, hi
increases until the capillary force (πDiγcosθ) equals to the total weight of the column of liquid
(Adamson and Gast, 1997). Eq. [2-7] describes imbibition from an unlimited source of liquid.
It may be extended to describe capillary desorption that usually balances the advancing
capillary sorption when there is a locally insufficient supply of liquid such as in coating,
painting and printing. However, caution has to be used in this case, since there is usually a
sorption/desorption (or contact angle) hysteresis. Furthermore, πDiγcosθ in Eq. [2-7] is the
exact form of capillary force in the expanded Bosanquet equation that describes the dynamic
balance of forces in a capillary when gravity is neglected but the inertia of the penetrating
liquid is taken into account (Ichikawa, Satoda 1994):
⎪⎭
⎪⎬⎫
⎪⎩
⎪⎨⎧
⎟⎠⎞
⎜⎝⎛++=⋅−⋅
2
2
22
2)(
48cos
dtdhn
dthdxhD
dtdhhD ρππμπθγ , [2-8]
where μ is the liquid viscosity, and ρ is liquid density; x and n are the correction factors for
the inertial force and energy dissipation, respectively.
For a distribution of independent capillaries in a porous material, the total change in
Gibbs energy ΔGt can be calculated by summarizing over all capillaries:
ΔGt = ΔGi = −4Aihi
γ cosθDi
=i
∑ −4Viγ cosθ
Dii∑
i∑ . [2-9]
Thus if the surface tension of the liquid and its contact angle at pore walls are known
and the volume and size distributions of capillaries can be determined, the effect of the
change in pressure on the Gibbs energy of the liquid when imbibed into a porous structure at
constant temperature may be calculated. A “specific” Gibbs energy, ΔGs can be calculated as
the change in Gibbs energy per mass of dry porous material, m:
ΔGs =
ΔGi
m= ΔGs ,i
i∑
i∑ . [2-10]
7
2.4 Surface energy theories
2.4.1 Polar and non-polar components
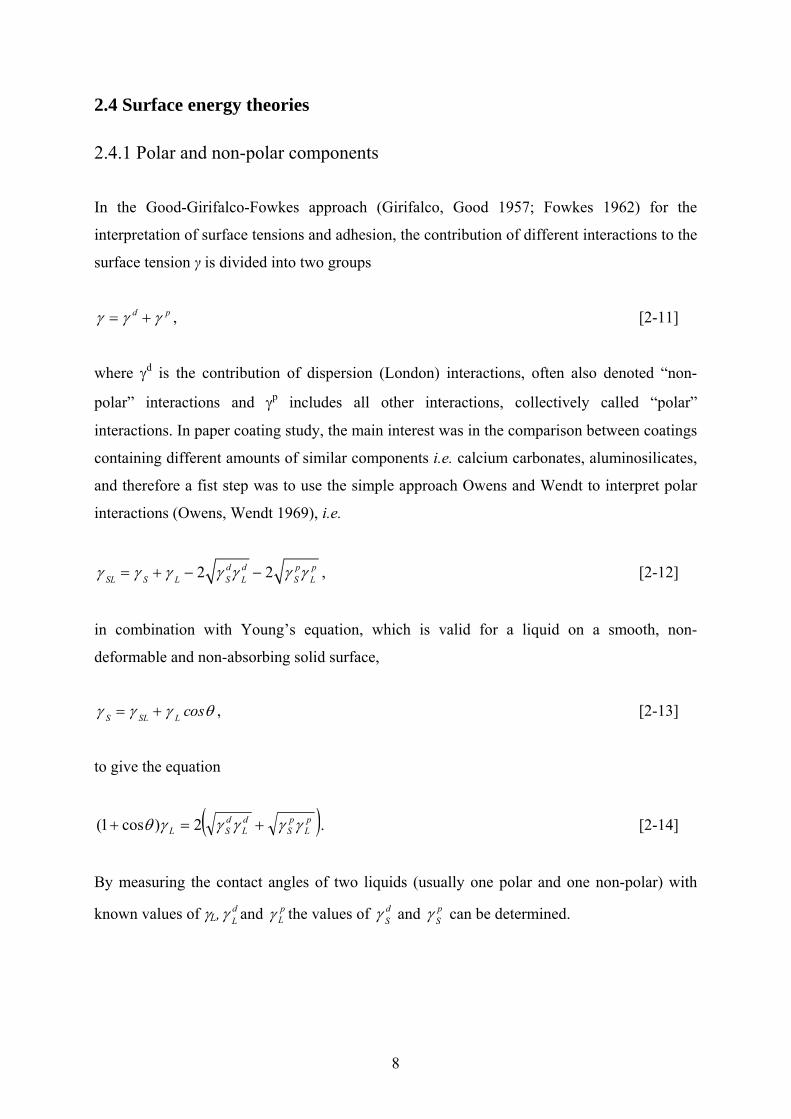
In the Good-Girifalco-Fowkes approach (Girifalco, Good 1957; Fowkes 1962) for the
interpretation of surface tensions and adhesion, the contribution of different interactions to the
surface tension γ is divided into two groups
γ = γ d + γ p , [2-11]
where γd is the contribution of dispersion (London) interactions, often also denoted “non-
polar” interactions and γp includes all other interactions, collectively called “polar”
interactions. In paper coating study, the main interest was in the comparison between coatings
containing different amounts of similar components i.e. calcium carbonates, aluminosilicates,
and therefore a fist step was to use the simple approach Owens and Wendt to interpret polar
interactions (Owens, Wendt 1969), i.e.
γ SL = γ S + γ L − 2 γ Sdγ L
d − 2 γ Spγ L
p , [2-12]
in combination with Young’s equation, which is valid for a liquid on a smooth, non-
deformable and non-absorbing solid surface,
γ S = γ SL + γ L cosθ , [2-13]
to give the equation
( )pL
pS
dL
dSL γγγγγθ +=+ 2)cos1( . [2-14]
By measuring the contact angles of two liquids (usually one polar and one non-polar) with
known values of γL, and the values of and can be determined. γ d pγ γ d γ pL L S S
8

2.4.2 Lifshitz-van der Waals and Lewis acid-base components
The Owens and Wendt approach is limited to non-polar and polar components. van Oss et al.
(1988) suggested that surface energy γ be divided into two groups:
γ = γ LW + γ AB , [2-15]
where the first term, Lifshitz-van der Waals interactions, includes London (dispersion),
Keesom (dipole-dipole) and Debye (dipole-induced dipole) interactions, and the second term
denotes more short-range Lewis acid-base interactions. To take into account that material
surfaces may contain both acidic and basic groups, the γAB term in Eq. [2-15] has been further
divided into acid and base parameters (van Oss 2006)
−+= γγγ 2AB , [2-16]
where γ+and γ-- denote acid and base parameters, respectively. In this approach (the van Oss-
Chaudhury-Good, vOCG, approach), surface energy components can be determined by
measuring contact angles for three liquids with known LW, γ+and γ -, and solving for the
components, using the equation
( )+−−+ ++=+ LSLSLWL
LWSL γγγγγγγθ 2)cos1( . [2-17]
The vOCG approach was used in the coated board study to evaluate the LW and AB
components for kaolin and latex chemistry influence on surface energy.
9
3. PART A, EXPERIMENTAL
3.1 Materials
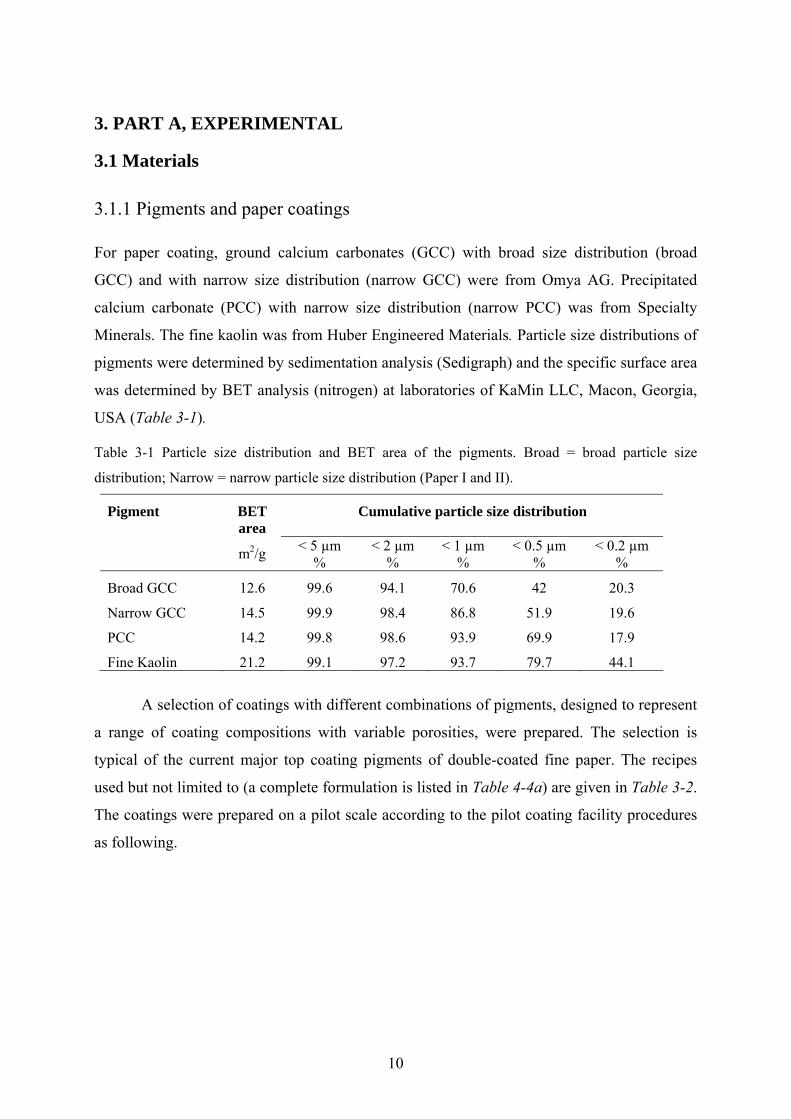
3.1.1 Pigments and paper coatings
For paper coating, ground calcium carbonates (GCC) with broad size distribution (broad
GCC) and with narrow size distribution (narrow GCC) were from Omya AG. Precipitated
calcium carbonate (PCC) with narrow size distribution (narrow PCC) was from Specialty
Minerals. The fine kaolin was from Huber Engineered Materials. Particle size distributions of
pigments were determined by sedimentation analysis (Sedigraph) and the specific surface area
was determined by BET analysis (nitrogen) at laboratories of KaMin LLC, Macon, Georgia,
USA (Table 3-1).
Table 3-1 Particle size distribution and BET area of the pigments. Broad = broad particle size
distribution; Narrow = narrow particle size distribution (Paper I and II).
Pigment BET area
Cumulative particle size distribution
m2/g < 5 µm %
< 2 µm %
< 1 µm %
< 0.5 µm %
< 0.2 µm %
Broad GCC 12.6 99.6 94.1 70.6 42 20.3
Narrow GCC 14.5 99.9 98.4 86.8 51.9 19.6
PCC 14.2 99.8 98.6 93.9 69.9 17.9
Fine Kaolin 21.2 99.1 97.2 93.7 79.7 44.1
A selection of coatings with different combinations of pigments, designed to represent
a range of coating compositions with variable porosities, were prepared. The selection is
typical of the current major top coating pigments of double-coated fine paper. The recipes
used but not limited to (a complete formulation is listed in Table 4-4a) are given in Table 3-2.
The coatings were prepared on a pilot scale according to the pilot coating facility procedures
as following.
10

Table 3-2 Pigment compositions of coatings, in parts by weight. In addition, all coatings contained
0.15 parts PAA (Ciba Chemicals), 12 parts latex (Dow Chemicals) 0.5 parts CMC (CpKelco), 0.7
parts OBA (Bayer), 0.7 parts lubricant (Devden) and 0.3 parts cross linker (Bercen) in Paper I.
Topcoat A B C D E F
Fine kaolin 20 40 20 40 20 40
Broad GCC 80 60
Narrow GCC 80 60
PCC 80 60
The coatings were applied on woodfree base paper using a pilot coater at the Centre
International de Couchage, Trois-Rivières, PQ, Canada. The pilot coater was run at 1400
m/min. The Opti-Concept™ Jet applicator + blade coating stations from Metso Paper were
used. Moisture and coat weigh profiles were on-line measured with infrared and X-ray
analysis but open-loop controlled, i.e. with operators’ intervention. The base paper was
precoated with 100% coarse ground calcium carbonate with 12 parts of latex, and chemical
additives. The coat weight was 12 g/m2 and run at 66% solids. Precoat formulations and
process were kept constant for all the six coating trial points. Top coating solids targets were
65% with no on-line dilution. Drying automation was used to control the zone of first
immobilization point and machine-direction temperature profile. An accurate control of top
coat weight of ~ 5000 m long paper coating is essential for a random sample selection of
reproducible capillary volume calculations from mercury porosimetry. The low surface
roughness reduces the hysteresis of contact angle measurements. Coating pilot parameters are
given in Table 3-3. Details are listed elsewhere (Papers I-II).
Table 3-3 Coating pilot parameters
Speed Drying Precoat
weight, g m-2
Topcoat
weight, g m-2
Topcoat
Stdev, g m-2
PPS-10*
μm
1400 m/min IR + Hot air 12 12 0.2-0.4 0.6-0.7
*) PPS-10 surface roughness, determined according to TAPPI Standard T555.
3.1.2 Latex and board coatings
For board coating, GCC was from Omya AG, and two types of fine kaolin of different
processes were from KaMin LLC (Table 3-4). The ratio of kaolin to GCC was fixed to 50/50
for all four conditions. Styrene-acrylate based latexes (x and y) were from BASF AG. Latex x
11
was styrene/n-butyl acrylate copolymer with glass transition point of 23 °C at pH 6.5-7.5.
Latex y was n-butyl acrylate-acrylonitrile-styrene copolymer with glass transition point of 4
°C at pH 7-8, according to the manufacturer. Coatings were applied, using the same pilot
coater as for paper coating, on solid bleached sulfate board pre-coated at 400 m/min and 12
g/m2 of 100 parts coarse GCC with 15 parts of latex, as well as optical brightener, thickener,
dispersant, lubricant and cross-linker, the same chemicals as in top coat.
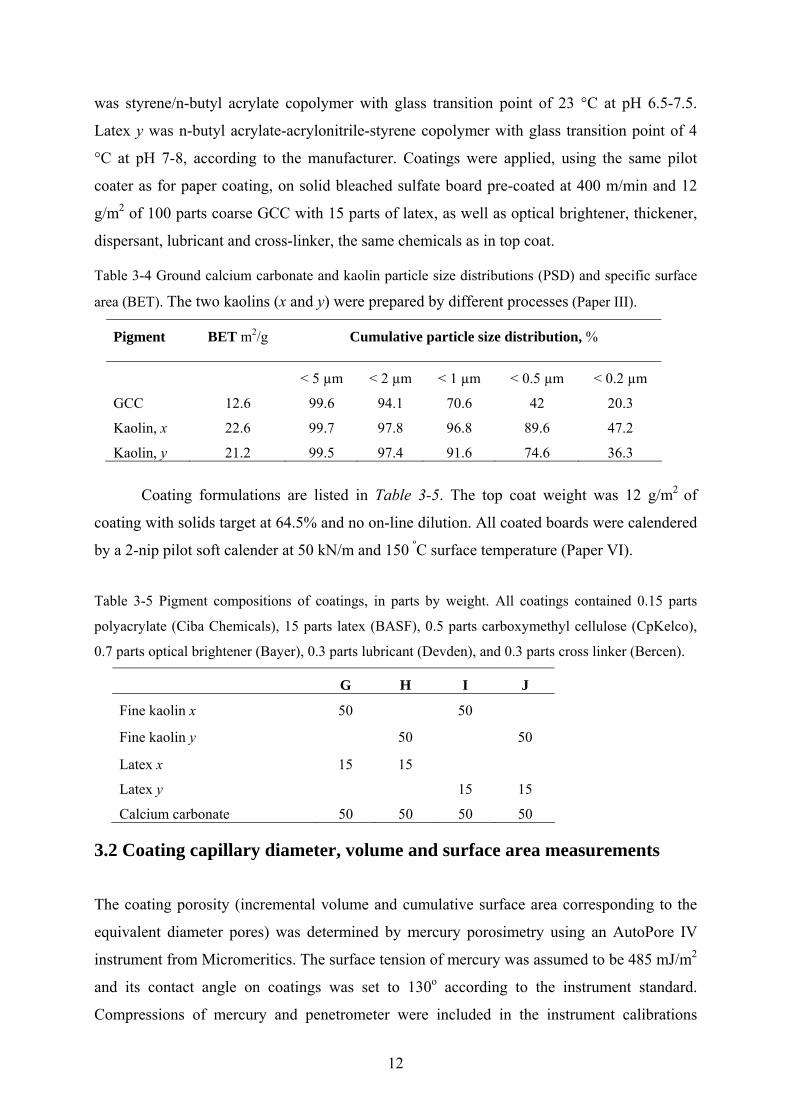
Table 3-4 Ground calcium carbonate and kaolin particle size distributions (PSD) and specific surface
area (BET). The two kaolins (x and y) were prepared by different processes (Paper III).
Pigment BET m2/g Cumulative particle size distribution, %
< 5 µm < 2 µm < 1 µm < 0.5 µm < 0.2 µm
GCC 12.6 99.6 94.1 70.6 42 20.3
Kaolin, x 22.6 99.7 97.8 96.8 89.6 47.2
Kaolin, y 21.2 99.5 97.4 91.6 74.6 36.3
Coating formulations are listed in Table 3-5. The top coat weight was 12 g/m2 of
coating with solids target at 64.5% and no on-line dilution. All coated boards were calendered
by a 2-nip pilot soft calender at 50 kN/m and 150 ºC surface temperature (Paper VI).
Table 3-5 Pigment compositions of coatings, in parts by weight. All coatings contained 0.15 parts
polyacrylate (Ciba Chemicals), 15 parts latex (BASF), 0.5 parts carboxymethyl cellulose (CpKelco),
0.7 parts optical brightener (Bayer), 0.3 parts lubricant (Devden), and 0.3 parts cross linker (Bercen).
G H I J
Fine kaolin x 50 50
Fine kaolin y 50 50
Latex x 15 15
Latex y 15 15
Calcium carbonate 50 50 50 50
3.2 Coating capillary diameter, volume and surface area measurements
The coating porosity (incremental volume and cumulative surface area corresponding to the
equivalent diameter pores) was determined by mercury porosimetry using an AutoPore IV
instrument from Micromeritics. The surface tension of mercury was assumed to be 485 mJ/m2
and its contact angle on coatings was set to 130o according to the instrument standard.
Compressions of mercury and penetrometer were included in the instrument calibrations
12

(Webb and Orr, 1997). It should be realized that although mercury porosimetry is widely
used to characterize the pore size distributions of coatings, mercury lacks some of the basic
fluid properties of coating color, paint and ink; it does not wet the coating surface and there
will be no changes in coating properties due to solubility of solids, polymer/liquid interactions
and variations in the capillary diameter caused by absorption. Thus capillary diameter and
volume measured for the coating are more or less in their initial state when coating
compression is treated as constant for the fixed ratio of pigment and latex binder in this study.
Energy dispersive spectrometry (EDS) was used to measure the relative concentrations of
elementals in coatings. Both mercury porosimetry and EDS measurements were conducted at
analytical lab of KaMin LLC.
3.3 Contact angles with different polarity liquids
3.3.1 Binary solutions and diiodomethane for coated paper surface
There are differences between contact angles measured under static and dynamic conditions,
between those measured on a flat plane and those obtained in a confined capillary (Jiang,
1979; e.g. Kistler et al. 1993), and between surfaces with pre-adsorbed film and pure dry
surfaces. However, it was not possible to directly measure dynamic contact angles in the
small capillaries of inhomogeneous industrial coatings used in this study. Distributions of
peak pore diameters in the range 56 to 88 nm were relatively similar for all samples.
Therefore, when comparing samples, the impact of capillary diameter on vapor pressure,
precursor, contact angle and liquid surface tension were neglected, and the static contact angle
was considered as representative of the main features also of dynamic contact angles. Coated
paper samples were conditioned according to TAPPI Standard T402, and sealed in a black
plastic bag before contact angle measurements. The capillary dimensions investigated were in
the range 30 to 125 nm as determined by mercury intrusion. Static contact angles on coated
surfaces were measured by extrapolating determination of the time-dependent contact angles
to t = 0 s. Static contact angles at interfaces of liquid and coatings were determined by two
different approaches.
In the first approach four ACCUDyneTest™ (Diversified Enterprises, Claremont, NH,
USA) binary solutions (Table 4-6) were used in measurements with a Krüss G10 goniometer
(Krüss GMBH, Hamburg, Germany). The coated paper sample was mounted with a double-
sided tape on a metal base that was tilted by 1-2 degrees so that only the advancing angle was
13

measured. The syringe needles used had diameters of 3, 2.4, 2.4 and 1.8 mm for the 70, 60, 50
and 40 mJ m–2 solutions, respectively. Using such a standard surface energy series
recommended by instrument manufacturer was convenient to start, also with an attempt to
build a base for further studies on fountain solutions that can be a mixture of water and
isopropyl alcohol etc. Drops were controlled manually by observing the drop size and
curvature and then brought close to the coated paper surface. Once the attraction force pulled
the drop to the paper, the needle was quickly retracted to avoid its impact on drop curvature.
Table 3-6 Composition of solutions used for dispersion and polar component calculations. Surface
tensions of diodomethane (CH2l2, γ=γd = 50.8 mJ m–2), formamide (HCONH2, γd = 39 and γp = 19 mJ
m–2), water (γd = 21.8 and γp = 51 mJ m–2) were based on van Oss et al. (1992), and 2-ethoxyethanol
(C2H5OC2H4OH, γd = 23.6 and γp = 5.0 mJ m–2) from ACCUDyneTest™.
Solutions Solution compositions
Surface tensions, mJ m-2 40 50 50.8 60 70 72.8
Diiodomethane 100%
2-ethoxyethanol 36.5% 9.3%
Formamide 63.5% 90.7% 65% 3.6%
Water 35% 96.4% 100%
In the second approach the coating surface energy calculation was based on Eqs. [2-
11, -14], using contact angles of a polar (water) and a non-polar (DIM) solvent determined
with a CAM 200 Optical Contact Angle Meter (KSV Instruments LTD, Helsinki, Finland) at
the Department of Forest Products Technology, Helsinki University of Technology, Finland.
The DIM was from Sigma-Aldrich, 99%. The water was de-ionized, distilled and degassed.
Samples were mounted on a horizontal flat metal base with double-sided tape. Contact angles
on both sides of the drop profile were measured. It was found that for all samples tested there
were no statistical significances between contact angles on the two sides. Separate syringes
that had fixed needle diameter were used for DIM and water. The target drop volumes were
set to 7 µl for water and 1.5 µl for DIM based on the surface tension difference. After the set
volume had been automatically forced out of the needles, the drop was manually brought in
contact with paper as described above. The time-dependent contact angles of solution drops
on each coated paper surface were measured for 10 seconds, extrapolated to t = 0 s and
averaged from five measurements on both sides of papers.
14

3.3.2 Diiodomethane, formamide and water for coated board surface
Coated board surface energy calculations were based on Eqs. [2-15,-17], using contact angles
of a non-polar (DIM) solvent, two polar liquids (water, FMD), see Table 4-7, determined with
the same CAM 200 Optical Contact Angle Meter at the Department of Forest Products
Technology. The DIM and FMD were from Sigma-Aldrich, 99%. The water was de-ionized,
distilled and degassed.
Table 3-7 Solvents used for contact angle measurements and calculations of LW and AB components
of surface energy. Surface tensions of diodomethane (CH2l2), formamide (HCONH2), hexadecane
(C16H34) were based on van Oss et al. (1988). Water was based on Della Volpe and Siboni (2000).
γLW γ+ γ− γ
Diiodomethane 50.8 50.8
Water 26.2 48.5 11.2 72.8
Formamide 39 2.28 39.6 58
Hexadecane 27.5 27.5
3.4 Ink tack measurement
It can be assumed that when a thin ink film is applied to a coating the initial concentration of
the finite vehicle reservoir is the same everywhere on the surface. As the vehicle is removed
by capillary imbibition, a concentration gradient is built up in the z direction. The vehicle
concentration in the ink droplet then decreases. Ink tack builds up to the maximum, after
which the ink begins to dry and tack decreases. The kinetics of ink tack force build-up may be
taken as an indirect indication of the capillary imbibition process. This rate of tack build and
decline was determined using a SeGan Ink/Surface Interaction Tester, in the way described by
Gane and Seyler (1994). The same sheet-fed offset cyan ink (Naturallith II PC, Sun Chemical)
was used in all measurements. Details are listed elsewhere (Paper VI).
15

4. PART A, RESULTS AND DISCUSSIONS
4.1 Pore structure characterized by mercury porosimetry
4.1.1 Pore size distribution of coated paper
Results from determinations of pore size distributions for pre-coated base paper, calendered
pre-coated base paper and the six coated paper samples investigated are given in Fig. 4-1. The
pre-coat curve from an uncalendered sample in Fig. 4-1a shows that the contribution to pore
volume of the precoat decreases rapidly in the range above 0.125 µm. The curve for a
calandered coating overlays with the pore distribution curves of all the coatings at pore sizes
from ~ 0.125 down to 0.03 µm which was the cut off in order to avoid extremely high
pressure. Such a high pressure can certainly cause sample structure change or even disrupt,
affecting the specific Gibbs energy calculation. In this study, such a structure disruption was
detected from a sharp slope change on incremental and cumulative intrusion curves, which,
hence, were cut off at 0.03 µm (~ 40 MPa). These results and also the 0.65 compression ratio
of calendered to uncalendered pre-coat (Fig. 4-1a) show that the influence of any precoat
weight variation or, indeed, the base paper on the results for the total top coating must have
been very limited.
0
0.02
0.04
0.060.08
0.1
0.12
0.14
0.16
0.010.11Equiv.. pore dia.
Log
diffe
rent
ial i
ntru
sion
ml/g 2.92 m2/g
2.31 m2/g
2.71 m2/g
µm
Uncalenderedprecoat
Calenderedprecoat
0
0.02
0.04
0.06
0.08
0.1
0.12
0.14
0.010.11Equiv. pore dia.
Log
diffe
rent
ial i
ntru
sion
ml/g
2.55 m2/g
2.86 m2/g
2.89 m2/g
µm
Calenderedtopcoats
a b
Figure 4-1a Pore size and volume reduce from uncalendered precoated paper to calendered precoated
paper. At 20 parts of kaolin, for coating surface area broad GCC (A) has 2.31 m²/g; narrow GCC (C)
has 2.71 m²/g; and PCC (E), 2.92 m²/g (Fig. 4-1a). At 40 parts of kaolin, correspondingly, (B), 2.55
m²/g; (D), 2.86 m²/g; and (F), 2.89 m²/g (Fig. 4-1b). For details see Paper I.
Fig. 4-2 shows results of mercury porosimetry determinations for sample C (20 parts
kaolin, 80 parts narrow GCC). Fig. 4-2a is a conventional plot of the logarithm of differential
intrusion volume vs. equivalent pore diameter. The large pore sizes (α) are typically due to
16
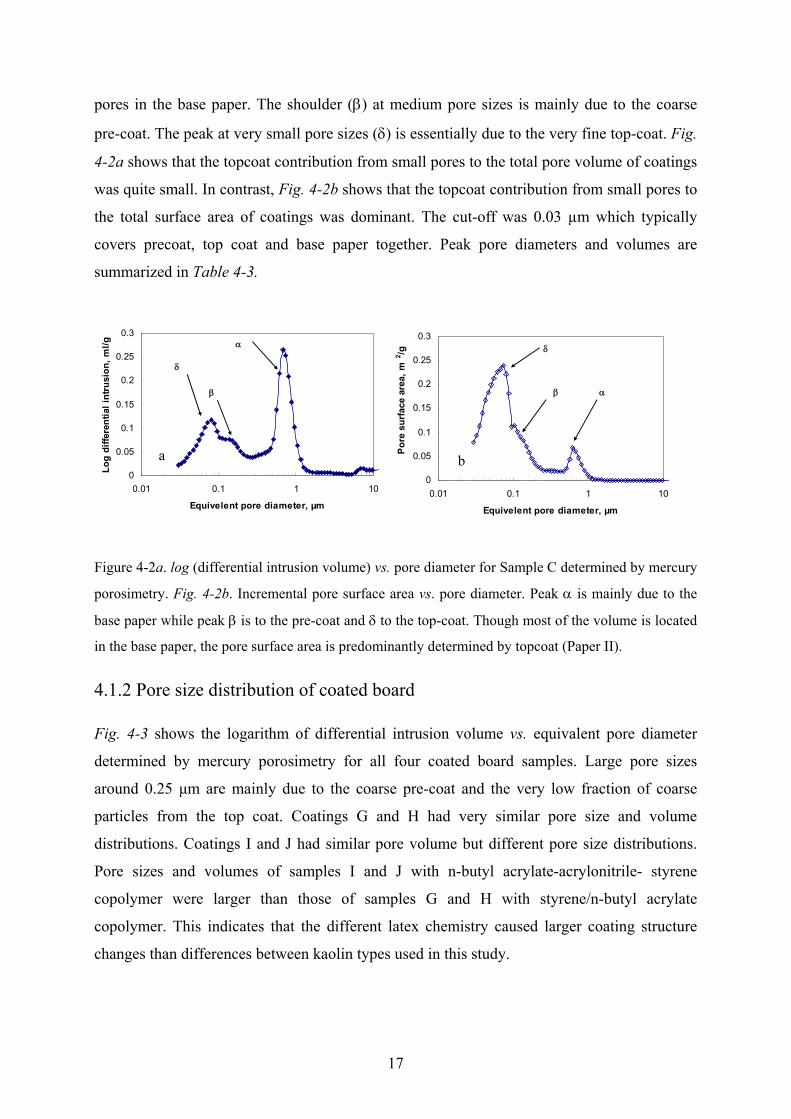
pores in the base paper. The shoulder (β) at medium pore sizes is mainly due to the coarse
pre-coat. The peak at very small pore sizes (δ) is essentially due to the very fine top-coat. Fig.
4-2a shows that the topcoat contribution from small pores to the total pore volume of coatings
was quite small. In contrast, Fig. 4-2b shows that the topcoat contribution from small pores to
the total surface area of coatings was dominant. The cut-off was 0.03 µm which typically
covers precoat, top coat and base paper together. Peak pore diameters and volumes are
summarized in Table 4-3.
0
0.05
0.1
0.15
0.2
0.25
0.3
0.01 0.1 1 10
Equivelent pore diameter, µm
Log
diffe
rent
ial i
ntru
sion
, ml/g α
β
δ
0
0.05
0.1
0.15
0.2
0.25
0.3
0.01 0.1 1 10
Equivelent pore diameter, µm
Pore
sur
face
are
a, m
2 /gαβ
δ
a b
Figure 4-2a. log (differential intrusion volume) vs. pore diameter for Sample C determined by mercury
porosimetry. Fig. 4-2b. Incremental pore surface area vs. pore diameter. Peak α is mainly due to the
base paper while peak β is to the pre-coat and δ to the top-coat. Though most of the volume is located
in the base paper, the pore surface area is predominantly determined by topcoat (Paper II).
4.1.2 Pore size distribution of coated board
Fig. 4-3 shows the logarithm of differential intrusion volume vs. equivalent pore diameter
determined by mercury porosimetry for all four coated board samples. Large pore sizes
around 0.25 μm are mainly due to the coarse pre-coat and the very low fraction of coarse
particles from the top coat. Coatings G and H had very similar pore size and volume
distributions. Coatings I and J had similar pore volume but different pore size distributions.
Pore sizes and volumes of samples I and J with n-butyl acrylate-acrylonitrile- styrene
copolymer were larger than those of samples G and H with styrene/n-butyl acrylate
copolymer. This indicates that the different latex chemistry caused larger coating structure
changes than differences between kaolin types used in this study.
17

0
0.01
0.02
0.030.04
0.05
0.06
0.070.08
0.090.1
0.010.11
Equivelent pore dia. μm
Log
diffe
rent
ial i
ntru
sion
, ml/g
Figure 4-3 log differential intrusion volume vs. pore diameter for Coating G(◊), H(□), I(∆) and J(x)
determined by mercury porosimetry (Paper III).
4.2 Contact angles on coated paper and board
4.2.1 Contact angles on coated paper surface
An offset ink is normally a mixture of oils and pigments with dissolved or dispersed binder
and additives (e.g. Leach et al. 1993). An oil based vehicle such as weak polar linseed
vegetable (35 mJ m 2) or non-polar aliphatic mineral oils used in offset ink (Gane et al. 1999,
Rousu et al. 2005) could also have been used. Their use would require careful standardization
to achieve relevant contact angle and surface energy determinations.
In summary, the contact angles of non-polar DIM were fairly constant over a 10 s
period while water contact angles required some seconds to stabilize at levels considerably
lower than the initial ones. DIM contact angle differences between different kaolin levels and
types of carbonates were rather small, except for sample A (20 parts kaolin) while the water
differences were slightly larger at t = 0 s and much larger at t = 10 s (Paper II). The binary
solution contact angles did vary significantly with the type of carbonate and kaolin/carbonate
ratio (Table 4-1) though the contact angles for 40 mJ m-2 solution and DIM were more or less
within experimental error the same for all coatings.
18

Table 4-1 Initial contact angle θ at t = 0 s of the coated paper samples with standard error σ of five
measurements determined with the CAM 200 (DIM and water) and Krüss G10. Compositions of
samples A-F are given in Table 3-2. (Paper II).
Contact angle and standard error
Degrees
A B C D E F
Solution
θ σ θ σ θ σ θ σ θ σ θ σ
DIM (50.8 mJ m-2) 52.0 0.9 47.4 1.7 49.8 1.9 48.6 2.3 48.3 2.1 50.6 2.0
Water (72.8 mJ m-2) 95.0 1.4 91.1 1.9 93.3 1.4 85.6 2.1 90.7 2.7 86.6 0.9
40 mJ m-2 solution 27.5 0.6 28.2 1.9 27.1 1.0 25.8 1.2 25.6 1.0 26.9 0.4
50 mJ m-2 solution 65.9 0.5 55.1 1.3 50.8 1.7 48.5 0.7 53.5 1.8 47.5 1.5
60 mJ m-2 solution 65.8 1.2 58.8 0.1 59.9 1.3 57.5 0.2 61.6 1.7 58.4 0.6
70 mJ m-2 solution 69.0 0.6 62.0 2.1 59.2 1.0 54.9 1.3 58.4 0.4 55.3 0.3
When the kaolin increased from 20 to 40 parts by weight the initial contact angle of
water decreased regardless of the type of calcium carbonate used. This indicates that as kaolin
level increased, the coating was more hydrophilic. It is also true for the solutions with surface
energy 50, 60 and 70 mJ m-2; for the 40 mJ m-2 solution the contact angle was more or less
constant within experimental errors. Kaolin, with the general formula Al4Si4O10(OH)8, is
aluminosilicate with 7 Å repeat units of 1:1 tetrahedral silicate and octahedral alumina sheets
with hydroxyl groups located between tetrahedral silicate layers that are very stable with
dipole moments balanced between silicon and oxygen pairs. Thus, a kaolin particle has both
siloxanol and aluminol surfaces. The hydroxyl-covered surfaces are hydrophilic. Hence,
additions of more kaolin at the expense of carbonates are expected to render the coatings
more hydrophilic. The magnitude of the van der Waals component, γLW in oxide materials,
including clay minerals, typically varies between 35 and 45 mJ m-2 (van Oss et al. 1992).
Using Eq. [2-11,-14] to calculate polar and non-polar contributions, coating surface
energies ranged between 30-40 mJ m-2 at t = 0 s. Carbonates, kaolin, and latexes such as
styrene butadiene and acrylate latexes can change the mean polar surface energy component
of the coatings. The surface energies of major latexes used in paper coatings are 40–65 mJ m-2
(Kan et al. 2004). The fact that coating energies calculated from t = 0 s were lower than those
of kaolin but were in the range corresponding to latex indicates that latex surface energy is
important. Hence, modification of latexes can affect coating surface energy and, in turn, the
19
Gibbs energy and ink tack development. Indeed, this is the case when latex chemistry was
changed as discussed in the following (Paper III).
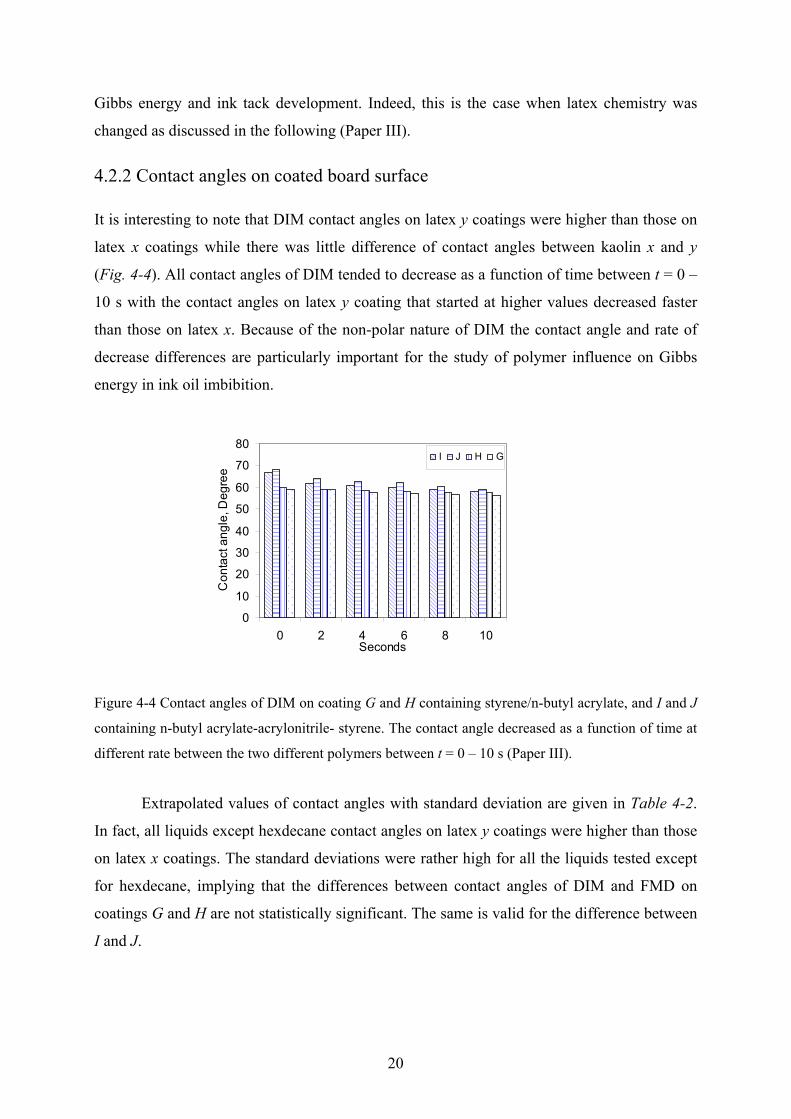
4.2.2 Contact angles on coated board surface
It is interesting to note that DIM contact angles on latex y coatings were higher than those on
latex x coatings while there was little difference of contact angles between kaolin x and y
(Fig. 4-4). All contact angles of DIM tended to decrease as a function of time between t = 0 –
10 s with the contact angles on latex y coating that started at higher values decreased faster
than those on latex x. Because of the non-polar nature of DIM the contact angle and rate of
decrease differences are particularly important for the study of polymer influence on Gibbs
energy in ink oil imbibition.
0
10
20
30
40
50
60
70
80
0 2 4 6 8 10Seconds
Con
tact
ang
le, D
egre
e
I J H G
Figure 4-4 Contact angles of DIM on coating G and H containing styrene/n-butyl acrylate, and I and J
containing n-butyl acrylate-acrylonitrile- styrene. The contact angle decreased as a function of time at
different rate between the two different polymers between t = 0 – 10 s (Paper III).
Extrapolated values of contact angles with standard deviation are given in Table 4-2.
In fact, all liquids except hexdecane contact angles on latex y coatings were higher than those
on latex x coatings. The standard deviations were rather high for all the liquids tested except
for hexdecane, implying that the differences between contact angles of DIM and FMD on
coatings G and H are not statistically significant. The same is valid for the difference between
I and J.
20

Table 4-2 Initial contact angle θ at t = 0 s of the coated board determined with the CAM 200 (DIM,
water, FMD and Hexadecane). σ = standard deviation.
G H I J
θ σ θ σ θ σ θ σ
DIM 59.3 2.9 59.8 3.5 66.6 4.1 67.9 5.5
Water 86.4 2 92.8 2.4 90.3 6.3 95.5 5.9
FMD 74.4 3.7 72.8 4.4 84.1 5.9 85 3.9
Hexadecane 20.1 1.0 20.4 2.5 19.6 2.1 20.5 1.0
The acid (electron acceptor) parameter γ+ is generally small or negligible although this
at least partially depends on the choice of standard values of γ+and γ– of water (Della Volpe,
Siboni 2000). Major variations exhibited by oxides lie in the base (electron donor)
contribution, γ–, with values ranging from 3 – 80 mJ m-2 (van Oss, Good 1995). Thus, the
value to a large extent decides the balance between hydrophilic and hydrophobic properties of
clays such as kaolin, talc, muscovite mica, smectite etc. Kaolin has γ– values between 30-35
mJ m-2 and total surface energies in the range of 65-80 mJ m-2, as determined by thin-layer
wicking method (Wu 2001).
4.3 Calculations of Gibbs energy
As an example of paper coating, the individual pore diameters with the corresponding
incremental specific pore volumes from mercury intrusion were used to calculate the change
in Gibbs energy for each incremental volume, using the solution surface tension (40 mJ m-2)
and the contact angles given in Table 4-1. These incremental energies were then summarized
to give the total change in ΔGs (Eqs. [2-9, -10]). The results are summarized in Table 4-3.
21

Table 4-3 Pore surface area, Specific Gibbs energy (ΔGs), specific pigment surface area, peak pore
diameter and volume and time to reach maximum ink tack (tmax) for investigated paper coatings. ΔGs
was calculated for pore size range 0.03-0.125 µm. The pigment surface area was calculated based on
the areas of the individual pigments in Table 3-1 and the pigment ratio (Paper I).
Sample ID A B C D E F
Pigment composition
20 kaolin+ 80 B GCC
40 kaolin+ 60 B GCC
20 kaolin+ 80 N GCC
40 kaolin+ 60 N GCC
20 kaolin +80 PCC
40 kaolin +60 PCC
Surface area (m2/g) 2.31 2.55 2.71 2.86 2.92 2.89
ΔGs (mJ/g) -411 -452 -485 -526 -527 -523
BET area (m2/g) 14.3 16.0 15.2 16.7 13.9 15.7
Peak pore diam.
(μm)
0.073 0.056 0.080 0.061 0.088 0.080
Peak pore vol.
(ml/g)
0.086 0.085 0.118 0.104 0.147 0.123
tmax, (s) 55.3 44.6 36,4 31.4 22.3 23.6
Details with step-by-step calculation are given in Table 4-4. The specific incremental
pore volume was taken from the intrusion volume of mercury into a known mass of intact
coated paper sample (0.6848 g sample weight for Sample A) multiplied by a coat weight
factor corresponding to a lab-determined basis weight of the sample (110.8 g/m2 for Sample
A) divided by the (12 + 12) g/m2 constant top coat weights. Data in Table 4-3 are mainly
based on mercury intrusion and BET analytical results. The quality is ensured by strictly
following KaMin analytical procedures. For this study, two samples are analyzed and
averaged. If they are not close to each other based on the author and analytical chemists’
experience. A third sample is tested. The NSOM and AFM of Paper IV follow the same way.
Standard deviation is not suitable for such a small sample population.
22

Table 4-4 Details of Specific Gibbs energy calculation for the pore at 0.03- 0.125 µm of Sample A.
Step One Calculation of constant C for one coatingThe C=4γcos(θ)BW/CW mN/m calculationSurface tension,γ 40 mN/mcos(θ) 0.8870cos(θ) γ 35.5 mN/mTotal basis weight 110.8 g/m2
Top coat weight C2S 24 g/m2
C 655 mJ/m2
Step Two Select Pore dia. as Dia. and Incremental pore volume as ΔVThe ΔGs =C*ΔV/D mJ/g calculation
No. ith equivelent pores Pore Diameter (µm) Incremental Pore Volume (mL/g) ΔGsi
1 0.125 0.0029 -15.32 0.114 0.0027 -15.63 0.105 0.0026 -16.14 0.096 0.0026 -17.65 0.088 0.0028 -20.66 0.080 0.0032 -26.07 0.073 0.0034 -30.48 0.067 0.0033 -32.59 0.061 0.0030 -32.410 0.056 0.0027 -31.811 0.051 0.0023 -29.912 0.047 0.0020 -28.013 0.043 0.0018 -27.314 0.039 0.0013 -22.415 0.036 0.0014 -26.116 0.033 0.0010 -20.717 0.030 0.0009 -18.7
Step Three Sum up Gibbs for all pores with corresponding volumeThe ∆Gs(0.03-0.125)=ΣΔGsi -411.4 mJ/g
Example of Sample A
Pore Diameter (µm)Incremental Pore Volume* (ml/g)
Surface tension (mJ m-2)
Contact angle (°)
ΔG s0.125
(mJ/g)ΔG s0.03-0.125
(mJ/g)0.1250 0.00292 40.0 27.5 -15.3 -411
Table 4-4a A complete set of trial results with the inclusion of 100% broad GCC and narrow
GCCs, and 100% PCC that are rarely used in practice as a sole pigment but of fundamental
interest. B GCC = Broad GCC, N GCC = Narrow GCC, and R is correlation coefficient.
100 B GCC
20 kaolin+ 80 B GCC
40 kaolin+ 60 B GCC
100 N GCC
20 kaolin+ 80 N GCC
40 kaolin+ 60 N GCC
100 PCC
20 kaolin +80 PCC
40 kaolin +60 PCC
R with t max
Gibbs energy, mJ/g -335 -411 -452 -408 -485 -526 -482 -527 -523 -0.92Peak pore dia. ⎠ m 0.105 0.073 0.056 0.105 0.08 0.061 0.104 0.088 0.08 -0.26Peak pore V, ml/g 0.104 0.086 0.085 0.1334 0.118 0.104 0.171 0.147 0.123 -0.50BET, m2/g 12.6 14.3 16.0 13.7 15.2 16.7 12.1 13.9 15.7 -0.35t max , s 100 55 45 46 36 31 23 22 24
23

4.4 Liquid surface energy and polarity influence on Gibbs energy
For all liquids (Table 4-1) tested on coated paper except DIM and the solution with surface
tension 40 mJ m-2, the differences between γcosθ of different coatings were statistically
significant. The 50 mJ m-2 solutions combine 90.7% of FMD with 9.3% of EO. The dipole
moment of FMD is very large, about 3.7 Debye (Israelachvili, 1991). The EO is surface
active, i.e. the surface tension is lowered when it is dissolved in FMD, due to the strong
cohesive forces in FMD. The 60 and 70 mJ m-2 solutions have 65% and 3.6% FMD combined
with 35% and 96.4% of water, respectively. FMD has a strong tendency to form hydrogen
bonds with kaolin surface and to intercalate (Wada 1961) kaolin stacks. FMD intercalation
into kaolin always starts from the edge and the rate can increase significantly with addition of
some water (Olejnik et al.1970; Franco, Ruiz Cruz 2004).
All these intermolecular forces and reactions occurring in binary solutions and at
liquid-solid interfaces make the interpretation and comparison of contact angles for different
solutions and coatings quite complex, as evident from the results given in Table 4-1. This
observation confirms that combining rules for surface energies and adhesion may not be valid
for interfaces in systems with more than two components at an interface (Good 1992). Still,
the good match of ΔGs from surface tension 40 mJ m-2 to tmax shows that a selection of binary
solutions that do not contain substantial fractions of strongly polar solvents may still be used
for Gibbs energy calculation. ΔGs calculated from strongly polar solutions will be applicable
for studies of interactions between polar substrates and polar solutions, such as kaolin-
containing coatings and aqueous fountain solution used in lithographic printing, and solutions
used in flexographic printing. Emulsified ink study has been completed and will be reported
in due course.
The 50 mJ m-2 solution and DIM had similar surface tensions but interacted differently
on penetrating into coatings (Table 4-1). Non-polar DIM interacts with all components in
coatings but predominately through dispersion interactions. The solution surface tension
reflects intermolecular interactions between liquid molecules while the penetration into
coating is determined by the liquid-solid-vapor interface. It is concluded that in the
interactions of polar solution with a polar coating surface, the solution polarity plays an
important role in determining Gibbs energy. Differences in capillary sorption of solvents with
24

similar surface tension but different polarity such as ethylenglycol and glycerol were observed
by Gane et al. (1999).
4.5 Latex and kaolin chemistry influence on coating surface energy
The values of acidic component are very low (Table 4-5), and as a whole AB
component of surface energy is so low that the influence of acid-base interactions can be
more or less neglected when compared to LW forces in coatings. Although the general trend
that LW components accounts for the major part of total surface energy on coated board is in
accordance with our previous study on coated paper, there is a key difference between the
results presented here and the earlier ones. In contrast to the coated paper study with fixed
latex, the value of LW component of these coated board surfaces changed when latex type was
changed and so did the base parameters and ΔGs, to be discussed below.
Table 4-5 Coated board surface energies calculated from Eqs. [2-15, -17]. Ink tack developments were
measured on ISIT and calculated from a linear differential equation model (Paper III).
G H I J
γ, mJ m-2 29.3 29.4 25.9 24.5
γLW, mJ m-2 29.0 28.7 24.8 24.1
γ+ 0.01 0.15 0.08 0.03
γ-, mJ m-2 3.0 0.9 3.4 1.8
γAB, mJ m-2 0.3 0.7 1.0 0.4
Time to reach max. tack, tmax, s 11 15 17 23
Max. tack force, Fmax, N 7.3 7.2 6.1 5.8
Final tack force, t = 300 s, N 0.79 0.80 0.41 0.48
The LW components of kaolins G and H are similar. This can be traced back to where
they were mined, i.e. from the same geological site. However, the base parameter of kaolin y
was lower than that of kaolin x. Given the fact that there was a very small difference in
surface area determined by BET (Table 3-4), the origin of such a large base parameter
difference may be the bulk mineral composition but it seems more reasonable to assume that
it is due to surface chemistry modification in the processing of the kaolin. Effective utilization
and conversion of the octahedral surface hydroxyls to change surface chemistry by chemical
adsorption from simple cations to complex polymers has been a major subject in kaolin
surface chemistry modifications for coating, ink, rubber, plastic applications, to name only a
few. The background of working on octahedral instead of tetrahedral can be basically
25
illustrated by a theoretical study in which quantum chemical calculations within the
framework of a very basic octahedral-tetrahedral 1:1 kaolin crystal structure demonstrates that
carboxylate group of acetate bound to the octahedral surface hydroxyls via hydrogen bridge
mechanism, and its interaction energy amounts to -292.9 kJ/mol. On the other hand, the acetic
acid molecule interacts with tetrahedral surface through weaker hydrogen bonds, and the
adsorption energies are only about -16.7 kJ/mol (Tunega et al. 2002).
Switching latex changed both LW and base parameter levels. While the use of latex y
certainly reduced LW interactions, compared to latex x, it increased the coating base
parameter slightly. For acrylate-containing latex, the type involved in this study, the size of
alkyl group can affect both dispersive (LW component in oil imbibition) and polar surface
energies. Changing from iso-octyl acrylate to ethyl acrylate results in a dispersive component
decrease from 43.7 to 22.1 mJ/m2 and an increase of the polar component from 0.1 to 16.7
mJ/m2 (Chan, Van Gilder 2004). Functional group introduction into a polymer chain and/or to
a chain end can significantly change polymer surface energy (Tsibouklis et al. 1999).
The surface concentration of polymer will affect the coating surface energy. The major
difference between latex x and y according to their material safety data sheets (MSDS) is that
latex y contains acrylonitrile (C-C-C≡N) group. However, energy dispersive spectrometry
(EDS) measurements (Fig. 4-5) shows that no nitrogen is detected near surface at low energy
level of 7.5 kV while the latex carbon (lighter element than nitrogen) level is strong (a small
part from CaCO3). It is reasonable to conclude that acrylonitrile group concentration on
surface is much lower than that of the hydrocarbon in the backbone, and thus, the surface
energy change can be attributed to a combination of other polymer chemistry, structure
changes, and acrylonitrile groups etc. We note that although the very low acrylonitrile
concentration on surface makes it less important to LW interactions, the polar moieties
orientation under the influence of polar liquid cannot be ignored when AB interactions are
involved (Adamson, Gast 1997).
26

Figure 4-5 The key element analysis on coated sample I containing acrylonitrile (C-C-C≡N)
group by energy dispersive spectrometry (EDS) at 7.5 keV (Paper III).
4.6 Gibbs energy and ink tack kinetics
4.6.1 Ink tack on coated paper
The ink tack force development as a function of time is shown in Fig. 4-6. Interestingly, tmax
are very different for different carbonates and different levels of kaolin in paper coatings
though the maximum tack forces, Fmax are very similar.
0.0
2.0
4.0
6.0
8.0
10.0
0 50 100 150 200
Time (seconds)
Tack
For
ce (N
)
0.0
2.0
4.0
6.0
8.0
10.0
0 50 100 150 200Time (seconds)
Tack
For
ce (N
)
b a
Figure 4-6a. Results from ink tack measurements for coatings A (∆), C(o), and E (□) of 20 parts
kaolin, and 5-6b B(x), D (-), F(+) of 40 parts kaolin with broad GCC, narrow GCC and PCC,
respectively (Paper I).
27

4.6.2 Ink tack on coated board
Fig. 4-7 compares ink tack development on the four board coatings. Notably, coating I (with
n-butyl acrylate-acrylonitrile-styrene latex) produced a lower maximum tack force Fmax,
needed longer time (tmax,) to reach Fmax, and yielded a lower final tack force after t = 150 s
than coating G (with styrene/n-butyl acrylate latex). The same held true for coating J relative
to coating H. Compared to coating G with kaolin x, the H with kaolin y had the same Fmax and
final tack force, but different tmax, i.e. the tmax of coating H with kaolin y was longer than that
of coating G with kaolin x. Similar differences were observed between coatings I and J.
0
1
2
3
4
5
6
7
8
1 10 100 1000log (time), seconds
Tack
For
ce (N
)
Figure 4-7 Tack force vs. time for coating G (ο), H ( ), I (Δ) and J (x) on log-linear scale. The
curves feature time to reach the maximum tack, tmax, the maximum tack force (peak force
value), Fmax, initial slope, and final tack force (the last point of testing) in Paper III.
For the type of paper coating formulations shown in Fig. 4-1, the coating structure is bimodal,
with one of the peaks occurring at pore size less than 0.1 µm. Comparison of the tmax for these
coating to the pigment BET surface area of the different pigment blends (Table 3-1) and peak
pore diameter shows very little correlation (R2= 0.12 and R2= 0.07, respectively) between
these quantities. There is a very weak correlation, R2= 0.75 (R= -0.87), between peak pore
volume and time to maximum tack force (Paper I). Table 4-4a summarizes correlation
coefficients of ink tack to pigment areas, diameters, peak pore and volume, and ΔGs. As
shown in Fig. 4-8, there is a strong correlation, R2=0.94 (R=-0.97), between the ΔGs
calculated from the pore size range of 0.03 – 0.125 µm and tmax. It is recorded that the shape
of pores - sharp dislocations in particular caused by pigment packing, can have a bigger effect
on liquid imbibition than pore size in certain cases (Senden et al. 2000). The lower correlation
28
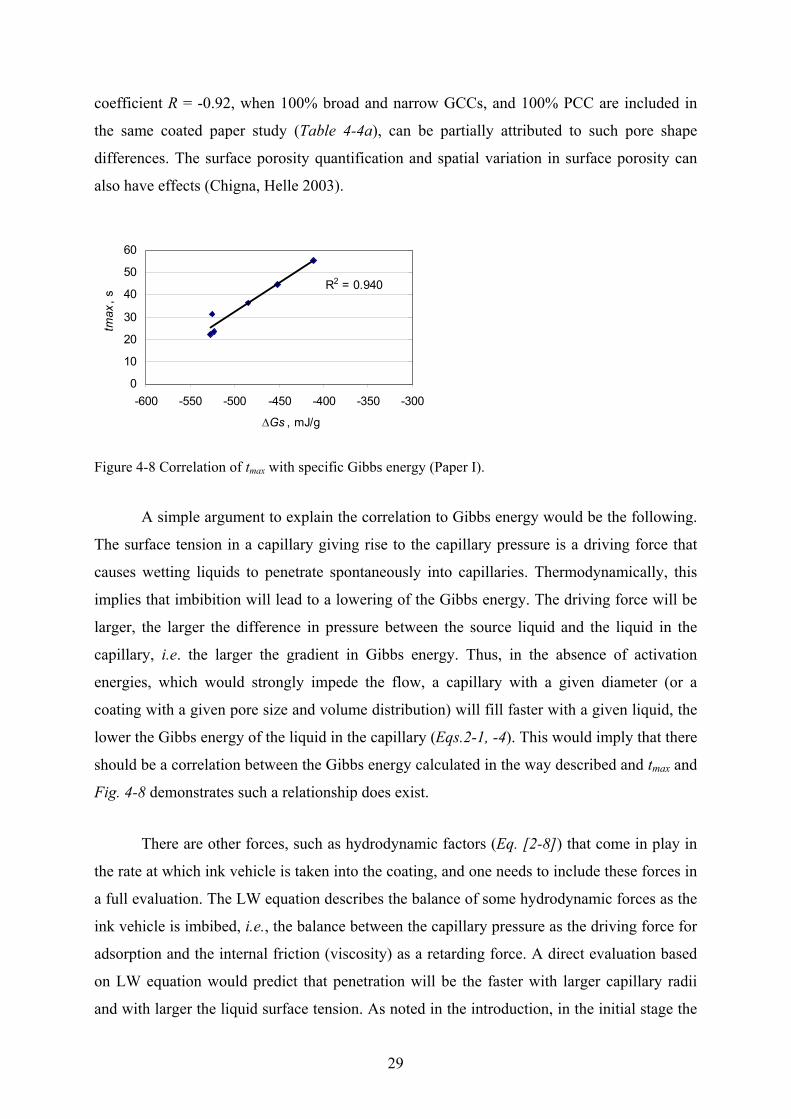
coefficient R = -0.92, when 100% broad and narrow GCCs, and 100% PCC are included in
the same coated paper study (Table 4-4a), can be partially attributed to such pore shape
differences. The surface porosity quantification and spatial variation in surface porosity can
also have effects (Chigna, Helle 2003).
R2 = 0.940
0
10
20
30
40
50
60
-600 -550 -500 -450 -400 -350 -300
tmax
, s
∆Gs , mJ/g
Figure 4-8 Correlation of tmax with specific Gibbs energy (Paper I).
A simple argument to explain the correlation to Gibbs energy would be the following.
The surface tension in a capillary giving rise to the capillary pressure is a driving force that
causes wetting liquids to penetrate spontaneously into capillaries. Thermodynamically, this
implies that imbibition will lead to a lowering of the Gibbs energy. The driving force will be
larger, the larger the difference in pressure between the source liquid and the liquid in the
capillary, i.e. the larger the gradient in Gibbs energy. Thus, in the absence of activation
energies, which would strongly impede the flow, a capillary with a given diameter (or a
coating with a given pore size and volume distribution) will fill faster with a given liquid, the
lower the Gibbs energy of the liquid in the capillary (Eqs.2-1, -4). This would imply that there
should be a correlation between the Gibbs energy calculated in the way described and tmax and
Fig. 4-8 demonstrates such a relationship does exist.
There are other forces, such as hydrodynamic factors (Eq. [2-8]) that come in play in
the rate at which ink vehicle is taken into the coating, and one needs to include these forces in
a full evaluation. The LW equation describes the balance of some hydrodynamic forces as the
ink vehicle is imbibed, i.e., the balance between the capillary pressure as the driving force for
adsorption and the internal friction (viscosity) as a retarding force. A direct evaluation based
on LW equation would predict that penetration will be the faster with larger capillary radii
and with larger the liquid surface tension. As noted in the introduction, in the initial stage the
29

inertia force and kinetic energy will actually qualitatively turn this prediction around, i.e.
initially a capillary will fill faster, the smaller the cross-sectional area of the capillary.
Previous studies (Zhmud et al. 2000; Stange et al. 2003) have successfully modeled and
experimentally verified three phases. They are the initial stage in which the rate is
proportional to t2, a short transition period where the rate is proportional to t, and third phase
where the rate of filling of the capillaries does actually depend linearly on t(1/2), as
qualitatively predicted by the LW equation. Furthermore, other retarding forces, such as local
transient sticking of the ink vehicle at the surface asperities or chemical inhomogeneities and
capillary topography and connections/throats between capillaries in a heterogeneous porous
medium affect the total rate of imbibition. In addition, the rate of filling is often much lower
than that predicted, due to thickening of the ink as liquid drains from it (Schoelkopf et al,
2003a, 2003b). However, none of these resistant factors will change the fact that the basic
force that drives spontaneous imbibition is the capillary force/gradient in Gibbs energy. And
so, irrespective of the retarding forces it seems reasonable that the total flow rate should
increase when this overall force increases. Eq. [2-9] gives a measure of the driving force (the
gradient of the Gibbs energy) over the whole assembly of capillaries in heterogeneous porous
coatings when all capillaries that are filled at the maximum pressure used in mercury
porosimetry.
This thesis therefore proposes that ΔGs, which can be calculated directly from
porosimetry data, liquid surface tension and contact angle may offer a basic and convenient
way to characterize a porous coating structure and interaction of surface energies, and can be
used to predict how offset inks will be imbibed into the coating. Of the other quantities listed
in Table 4-3 (Paper I for details) none is directly connected to the driving force of imbibition
in the same way, which explains that they are not correlated to tmax. The initial rate of tack rise
is another property often used to characterize ink setting in coating. As already noted, there
will be a strong influence of inertia force and kinetic energy on the initial penetration into
capillaries, and conditions will therefore be quite different from those in liquids mainly driven
by the equilibrium capillary pressure. Hence, though the driving force is the same there
should be a weaker correlation of the initial rate of penetration to the ΔGs as calculated here,
and our investigations have indicated that such is, indeed, the case (R2 = 0.72).
30
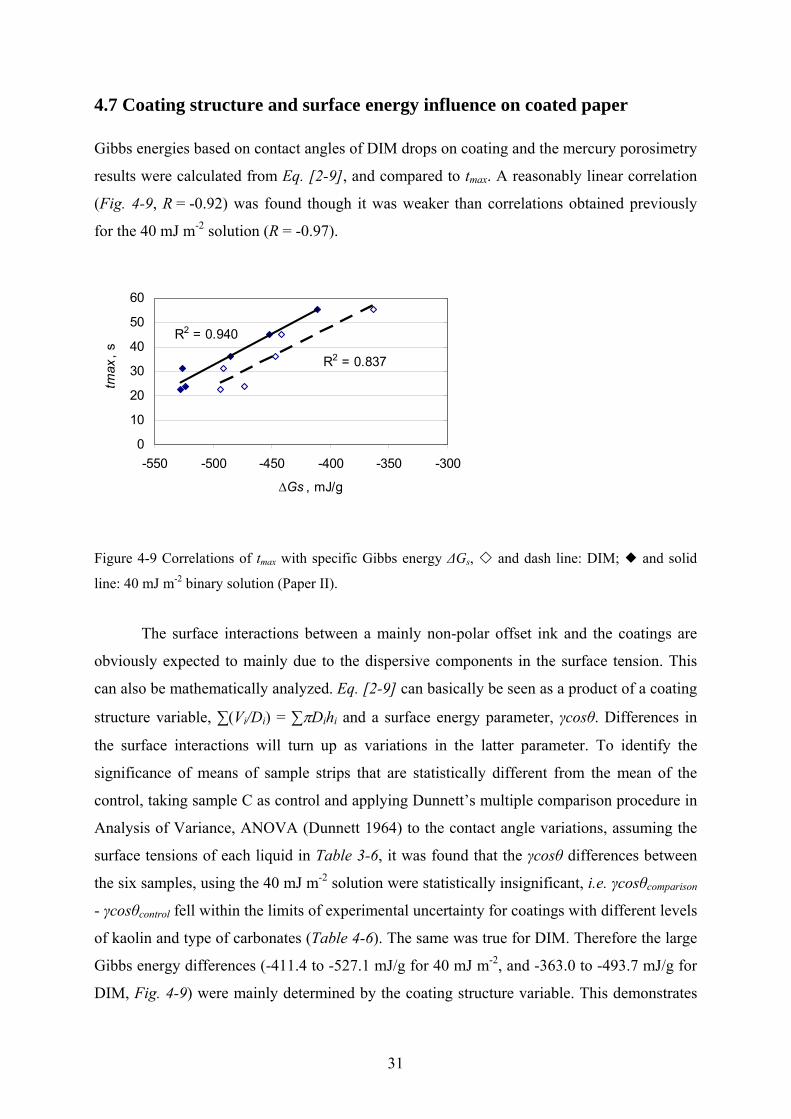
4.7 Coating structure and surface energy influence on coated paper
Gibbs energies based on contact angles of DIM drops on coating and the mercury porosimetry
results were calculated from Eq. [2-9], and compared to tmax. A reasonably linear correlation
(Fig. 4-9, R = -0.92) was found though it was weaker than correlations obtained previously
for the 40 mJ m-2 solution (R = -0.97).
R2 = 0.940
R2 = 0.837
0
10
20
30
40
50
60
-550 -500 -450 -400 -350 -300
tmax
, s
∆Gs , mJ/g
Figure 4-9 Correlations of tmax with specific Gibbs energy ΔGs, and dash line: DIM; and solid
line: 40 mJ m-2 binary solution (Paper II).
The surface interactions between a mainly non-polar offset ink and the coatings are
obviously expected to mainly due to the dispersive components in the surface tension. This
can also be mathematically analyzed. Eq. [2-9] can basically be seen as a product of a coating
structure variable, ∑(Vi/Di) = ∑πDihi and a surface energy parameter, γcosθ. Differences in
the surface interactions will turn up as variations in the latter parameter. To identify the
significance of means of sample strips that are statistically different from the mean of the
control, taking sample C as control and applying Dunnett’s multiple comparison procedure in
Analysis of Variance, ANOVA (Dunnett 1964) to the contact angle variations, assuming the
surface tensions of each liquid in Table 3-6, it was found that the γcosθ differences between
the six samples, using the 40 mJ m-2 solution were statistically insignificant, i.e. γcosθcomparison
- γcosθcontrol fell within the limits of experimental uncertainty for coatings with different levels
of kaolin and type of carbonates (Table 4-6). The same was true for DIM. Therefore the large
Gibbs energy differences (-411.4 to -527.1 mJ/g for 40 mJ m-2, and -363.0 to -493.7 mJ/g for
DIM, Fig. 4-9) were mainly determined by the coating structure variable. This demonstrates
31

the strength of the Gibbs energy approach in being a parameter that is able to distinguish
between the influence of surface interactions and the influence of structural properties on
capillary adsorption.
Table 4-6 Differences of surface energy parameter, γcosθ calculated from Dunnett’s multiple-
comparison with a control (sample C). The 95% confidence limit was calculated from the numbers of
coatings and contact angle observations, and the estimate of variance σ2. Statistically insignificant
differences are given in bold Italics (Paper II).
γcosθ differences based on Dunnett’s procedure
mJ m-2
C A B D E F Limits
40 mJ m-2 solution * 0.1 0.4 0.4 0.5 0.1 ±0.71
50 mJ m-2 solution * -11.2 -3.0 1.5 -1.9 2.2 ±1.97
50.8 mJ m-2 DIM * -1.5 1.6 0.8 1.0 -0.5 ±2.05
60 mJ m-2 solution * -5.5 1.0 2.1 -1.6 1.3 ±1.73
70 mJ m-2 solution * -10.8 -3.0 4.4 0.8 4.0 ±2.29
72.8 mJ m-2 water * -2.2 2.8 9.8 3.3 8.5 ±3.75
The specific Gibbs energy, ΔGs associated with imbibition of a solution into a porous
coating (Eq. [2-9]) can be basically treated as a product of coating structure variable,
∑(Vi/Di), and surface energy parameter (γcosθ), i.e. ΔGs highlights the interactive properties
of the coating pore surface and the probe liquid. In mixed kaolin/carbonate coatings,
increasing the fraction of kaolin renders coatings more hydrophilic. Thus, one expects
relatively strong interactions of coatings containing kaolin with aqueous test liquids, and with
aqueous fountain solutions, flexo and ink-jet printings, and UV varnishing. However, coating
hydrophilicity affects the imbibition of non-polar solvents much less than the coating
structure variable, ∑Vi/Di. For non-polar solvents this variable is of predominant importance
for ΔGs, and thus, in turn, governs tmax of inks based on non-polar solvents. When dispersive
energy is relatively constant (which is the case for the coating pigments used in paper coating
study) and dominant at the liquid-solid-vapor interface, the coating structure decides the
differences in ΔGs and tmax. This agrees with chromatographic results, which demonstrates
that the removal of slightly polar linseed oil is retarded by non-polar mineral oil (Rousu et al.
2000, 2005), and with the post treatment of coating with silane in super-critical CO2 which
32
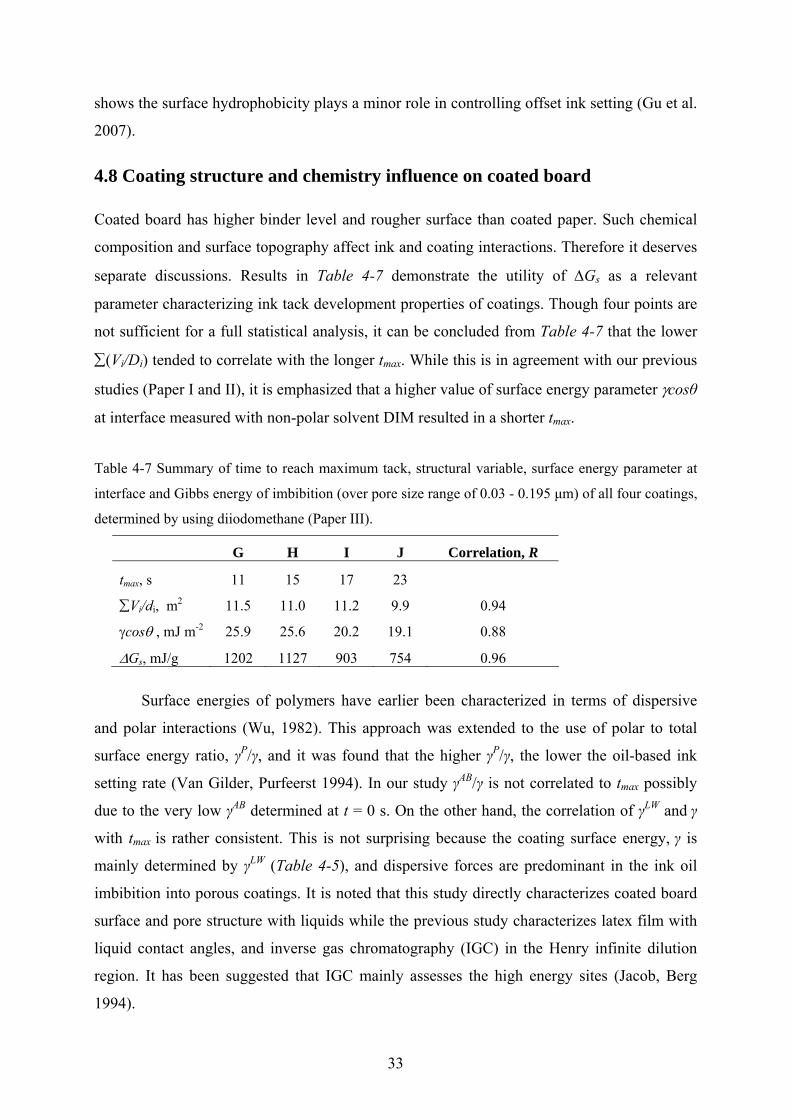
shows the surface hydrophobicity plays a minor role in controlling offset ink setting (Gu et al.
2007).
4.8 Coating structure and chemistry influence on coated board
Coated board has higher binder level and rougher surface than coated paper. Such chemical
composition and surface topography affect ink and coating interactions. Therefore it deserves
separate discussions. Results in Table 4-7 demonstrate the utility of ΔGs as a relevant
parameter characterizing ink tack development properties of coatings. Though four points are
not sufficient for a full statistical analysis, it can be concluded from Table 4-7 that the lower
∑(Vi/Di) tended to correlate with the longer tmax. While this is in agreement with our previous
studies (Paper I and II), it is emphasized that a higher value of surface energy parameter γcosθ
at interface measured with non-polar solvent DIM resulted in a shorter tmax.
Table 4-7 Summary of time to reach maximum tack, structural variable, surface energy parameter at
interface and Gibbs energy of imbibition (over pore size range of 0.03 - 0.195 μm) of all four coatings,
determined by using diiodomethane (Paper III).
G H I J Correlation, R
tmax, s 11 15 17 23
∑Vi/di, m2 11.5 11.0 11.2 9.9 0.94
γcosθ , mJ m-2 25.9 25.6 20.2 19.1 0.88
ΔGs, mJ/g 1202 1127 903 754 0.96
Surface energies of polymers have earlier been characterized in terms of dispersive
and polar interactions (Wu, 1982). This approach was extended to the use of polar to total
surface energy ratio, γP/γ, and it was found that the higher γP/γ, the lower the oil-based ink
setting rate (Van Gilder, Purfeerst 1994). In our study γAB/γ is not correlated to tmax possibly
due to the very low γAB determined at t = 0 s. On the other hand, the correlation of γLW and γ
with tmax is rather consistent. This is not surprising because the coating surface energy, γ is
mainly determined by γLW (Table 4-5), and dispersive forces are predominant in the ink oil
imbibition into porous coatings. It is noted that this study directly characterizes coated board
surface and pore structure with liquids while the previous study characterizes latex film with
liquid contact angles, and inverse gas chromatography (IGC) in the Henry infinite dilution
region. It has been suggested that IGC mainly assesses the high energy sites (Jacob, Berg
1994).
33

It is recognized that there is the complexity of contact angle hysteresis that has been a
major subject in surface wetting in air and liquid environments (e.g. Marmur 1996, 2004),
and spreading of wetting line advances through kinetic and dynamic balances (Shanahan,
2001). Because of the small capillaries of inhomogeneous industrial coatings and variety
ingredients of inks, in practice the Gibbs energy was calculated from measurements of drops
of pure liquids of known surface energy on coated paper and board surfaces, assuming
smooth, non-deformable and non-absorptive surfaces. As is well known, the penetration of
liquid over irregular surfaces or into complex structures may be intermittently arrested by
sticking of the liquid at sharp edges or notches. The present study does not take this
possibility in to account. Paper surface roughness effects on water drop spreading have been
discussed in the literature (e.g., Modaressi, Garnier 2002; Werner et al. 2005). Indeed when
fine oblate spheroids are used in coating, due to particle alignments under a shear field, the
surface should be characterized as centerline average, rms, correlation length and
autocorrelation as described in Part B (Paper IV). Furthermore, such fine oblate spheroids
introduction can cause chemical distribution change in dewatering and evaporation processes,
in addition to the coating structure change in thickness direction as illustrated in Part C
(Paper V). That the absorption of drops could be neglected in contact angle measurements is
ensured by extrapolation of time-dependent contact angles to t = 0 s. This method is related to
the front line of the advancing contact angle in capillary adsorption. If coating components,
latex lattices in particular, swell during ink setting, as proposed in previous studies (Van
Gilder, Purfeerst, 1994; Xiang et al. 2004), the proposed method may oversimplify latex and
solvent interactions that are due to physisorption and/or chemisorption as a function of time.
So far, no difficulties have been encountered by using contact angle at t = 0. This implies that
due to the limit imposed by rheology coating ingredients are designed to be compatible, less
strong polar interaction for example (Van Gilder 2004), and as such, this treatment is justified
by those coating properties studied, and by the dispersive force predominance (loosely
defined as phyciosorption) in coating and oil-base ink interactions.
34
5. PART A, CONCLUSIONS
The coating structure characterized by mercury intrusion and contact angle extrapolated to t =
0 s may be used to calculate the total Gibbs energy of capillary imbibition into a
heterogeneous porous medium of a given liquid at the final state. The good match between the
time needed to reach the maximum tack force (tmax) and the specific Gibbs energy (ΔGs) leads
to the conclusion that though many factors affect the capillary imbibition in the initial state
and rate of access to the final state, the calculation of ΔGs from the coating structure
determined by mercury porosimetry and surface energy at the liquid-solid-vapor interface
appears to reflect the effect of coating structure and surface energy on imbibition of ink until
maximum tack is reached better than other characteristics often used. The application of Eqs.
[2-9,-10] to current popular top coating systems shows that a larger capillary pore surface
area strongly increases the rate of ink setting, as measured by the reduced tmax, while there is
no correlation between ink tack development and pigment surface area or peak pore size of
the coating. A larger pore volume in a coating structure tends to reduce tmax, but the
correlation is weak, at least for the coatings used in this study.
The results further demonstrate that the Gibbs energy concept combining coating
structure variables (volume and diameter, ∑(Vi/Di)) and surface energy parameters (γcosθ) at
the interface is a better method for characteristics of capillary adsorption than each parameter
alone. Indeed, the change in latex chemistry contributes to both coating structure and surface
energy changes. In both kaolin and latex cases the base parameters γ- (in the vOCG approach)
were low compared to Lifshitz-van der Waals interactions, γLW while the acid γ+ component
was negligible. Furthermore, the designed kaolin with constant γLW and different γ- changed
the ΔGs, and coated paper capillary adsorption in offset ink setting, as seen in the different tmax
but there was no effect on the maximum tack force, Fmax and the final tack. Compared to
styrene/n-butyl acrylate latex, n-butyl acrylate-acrylonitrile-styrene latex that lowered γLW on
coated board surface and ΔGs significantly increased tmax, and reduced Fmax and the final tack.
So far, the successful applications of Gibbs energy concept has been demonstrated in
the analysis of interactions of oil-based offset ink with porous coatings that have different
contents of calcium carbonates, kaolin and latex. It is expected that such an approach may
find applications in analyzing interactions of different porous coatings with polar and non-
35
polar liquids. Further investigations are desired to verify to what extent ΔGs will be useful to
characterize interactions of various coatings with variety polar solutions.
It is well known that surface topography such as pits vs. grooves affects differently on
liquid-solid-vapor and light-solid-air interfaces. Oblate spheroids rotation and alignment
under a shear field influences not only the topography but also the distribution of pigments
and chemicals. This led to the characterization work in Part B with topography and Part C
with coating structure influence on water soluble chemical distributions.
36
PART B Simultaneous Characterization of Coated Paper Topography
and Optical Contrast of the Thin Layer by Near-Field Scanning Optical
Microscopy (NSOM)
6. PART B, BACKGROUND AND THEORIES
6.1 Techniques for surface topography characterizations
Optical coatings are composite materials for which defining the optical properties is not a
straightforward task. Coating structures are characterized by binder distribution and pigment
packing such as pore and volume distributions, and particle orientations. Many techniques
have been applied to studying coated paper properties. Scanning electron microscopy (SEM)
has been used (McCoy 1998), which gives qualitative structural and morphological
information on micro-scale. X-ray diffraction (XRD) has been used to study certain clay
mineral orientations in blade coatings (Gane et al. 1995). When an entire coating layer is
exposed to X-ray, due to the penetration of X-ray (Moore, Reynolds 1997), the measured
orientation index is a collection of bulk coating rather than the surface property alone. Gloss
goniophotometry was used to investigate pigment influence on topography and specular
reflections, and results were found consistent with other studies (Gate, Leaity 1991; Hirons et
al. 1998). Polarized light reflectometry was applied to studying paper coating structure, gloss
and porosity (Elton, Preston 2006a,b).
The structural characterization of optical coatings is complicated by the fact that, in
many cases, the spatial scale of inhomogeneities is not much smaller than the wavelength and
therefore the materials scatter light significantly. In addition, these materials have appreciable
roughness at the scale of the wavelength of light, which affects the scattering properties even
more. As a result, macroscopical optical properties depend not only on the coating’s
composition but also on both the size of the particulates and the topography. Thus, it is
desirable to employ characterization approaches capable of determining simultaneously the
mechanical and optical properties at the surface. One such technique, near-field scanning
optical microscopy (NSOM), has already been used to characterize composite materials such
as 3D crystallites in Langmuir-Bludgett films of diimide and stearic acid (Dutta et al. 1999),
micropatterned glass surface in liquids (Schmalenberg et al. 2002), and monolayer of silver
nanoparticles (Ianoul, Bergeron 2006). In this study we report for the first time an NSOM
37
study of the paper coating surface morphology and its optical properties. The experimental
results were obtained on high speed pilot coating trials of six formulations with mixtures of
narrow and broad particle size distribution calcium carbonates and fine platy kaolin.
6.2 Surface topography and optical contrast
The surface topography of inhomogeneous media can be characterized by its roughness
exponent representing the surface fractality (irregular curves or shapes), the lateral correlation
length, and the interface width or root mean square (rms). As such, a surface can be described
by the height-height correlation function, H(r) (Zhao et al. 1996; Hudspeth et al. 2002) that is
directly related to interface width w and the autocorrelation function C(r)
by . The autocorrelation is calculated by analyzing the similarities
between a series and a lagged version of itself. The correlation coefficient at lag r of a series
x0, x1, x2,....xN-1 is normally written as
[ )(12)( 2 rCwrH −= ]
∑
∑−
=
−
=+
−
−−= 1
0
2
1
0
)(
))(()( N
ii
N
ikii
mxx
mxxmxxrC , [6-1]
where mx is the mean of the series. For the 2D autocorrelation lengths reported in this study,
the values corresponding to the 1/e full width of the horizontal and vertical shifts were
calculated.
Light becomes diffusive when it interacts with inhomogeneous media such as optical
coatings; this happens because the material composition and, hence dielectric properties vary
strongly with position. In this situation imaging individual portions of the composite
materials fails to provide robust quantitative information about its structure. Due to the
random nature of both the material composition and the interaction of light with it, useful
information can only be obtained through a statistical approach. The result of such analysis is
expressed by measures like mean scattered intensity, intensity variance, optical contrast, etc.
For instance, a simple model can be developed by considering that due to
inhomogeneities in the optical properties, the light is first coupled inside the medium over a
volume which depends on the incident intensity. Within this volume, N independent
elementary scattering centers are being excited, which then determine the radiation emitted
from the medium. When light interacts with a limited number of individual scattering centers,
38

the optical contrast depends on both the number of “equivalent scattering centers” N, and the
phase distribution of scattering centers, ∆θ (Apostol et al. 2006).
22
222
))exp(1()2/(sinh))cosh(1)(1((8),(
θθθθ
Δ+−ΔΔ+−−
=ΔNN
NNNC . [6-2]
Thus, we use rms roughness, its directional correlation lengths, and the optical contrast of an
NSOM image to characterize the surface morphology and local variation of optical
properties.
6.3 Brief description of Near-field scattering optical microscopy
To study the effects of particle distributions on a local scale, it is necessary to probe volumes
of the order, or smaller than the smallest particle inclusions. A near-field scanning optical
microscope having about 50 nm spatial resolution was used which allows for the
simultaneous acquisition of both local topographical and optical measurements (Paesler et al.
1996; Dunn 1999). In reflection based NSOM (Fig. 6-1), light emitted from a sub-wavelength
aperture fiber probe interacts with the sample, and is then recollected in the far-field (Lewis et
al. 1984). The fiber couples both propagating and evanescent waves onto samples, and
during the scattering process, some of the evanescent components are converted into
homogeneous waves, which are then detected in the far-field by an avalanche photodiode.
This conversion of evanescent to homogenous waves allows for the detection of optical
effects well below the diffraction limit (Synge 1928). In order to couple evanescent fields
onto the sample, the probe must be placed very near to the sample (1/50 wavelength), which
can be accomplished by making use of conventional atomic force microscopy (AFM)
techniques. During a near field scan, the tip is maintained at a constant separation from the
sample by using a shear force feedback mechanism. Keeping this constant separation allows
for the AFM topographical mapping of the sample (Lieberman et al. 1996). Thus, for each
location of the probe, the local topographical variation and optical signal are recorded. The
magnitude of the recorded optical signal depends not only on the local values of the dielectric
constant but also on the state of the physical interface. Some work has been done in
attempting to decouple the mechanical and optical influences of this signal (Dogariu, Carter
2006). The aim of this report is to statistically compare samples of similar composition.
39

Figure 6-1 Schematic of reflection based near field scanning optical microscopy (NSOM). Light
coupled to an optical fiber is emitted from a tapered fiber tip with sub-wavelength dimensions in the
near field of the sample. The tip is placed and kept in the proximity (10-20 nm) of the sample using
shear force feedback as common in atomic force microscopy (AFM). The probe is raster-scanned
across the surface at a constant height while recording in each point an optical signal resulting from
the near field scattering event as well as the topography from the AFM scan.
40
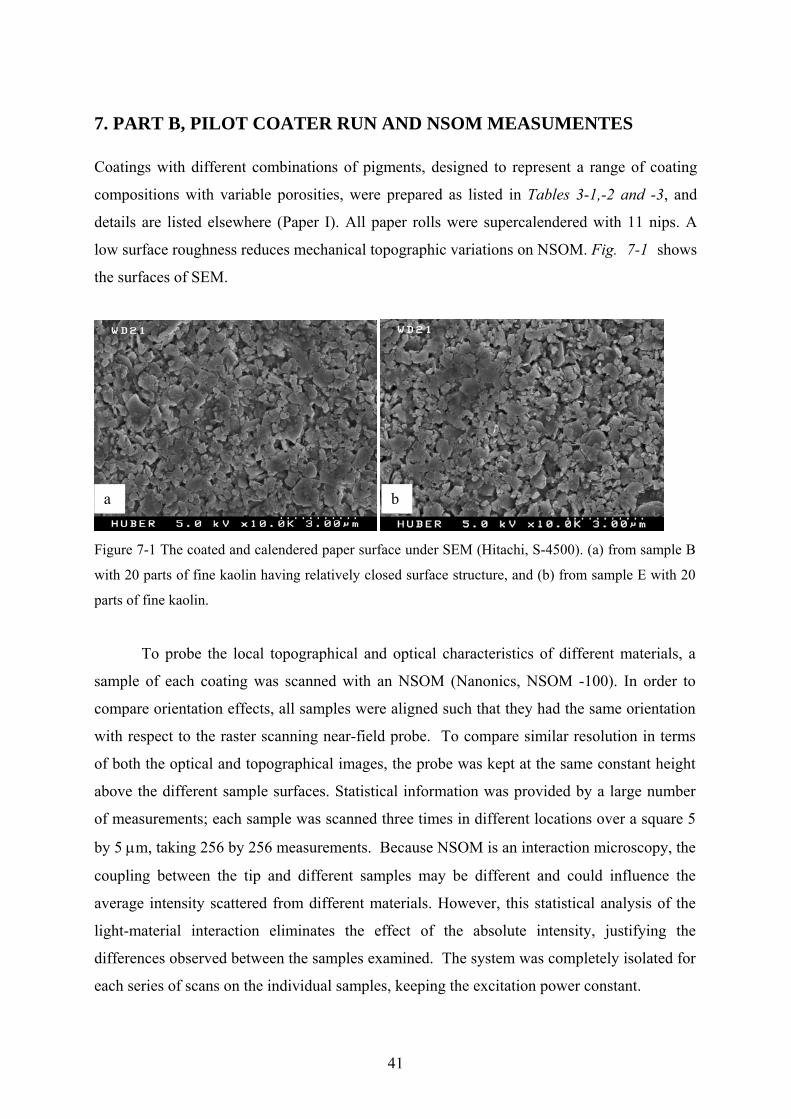
7. PART B, PILOT COATER RUN AND NSOM MEASUMENTES
Coatings with different combinations of pigments, designed to represent a range of coating
compositions with variable porosities, were prepared as listed in Tables 3-1,-2 and -3, and
details are listed elsewhere (Paper I). All paper rolls were supercalendered with 11 nips. A
low surface roughness reduces mechanical topographic variations on NSOM. Fig. 7-1 shows
the surfaces of SEM.
a b
Figure 7-1 The coated and calendered paper surface under SEM (Hitachi, S-4500). (a) from sample B
with 20 parts of fine kaolin having relatively closed surface structure, and (b) from sample E with 20
parts of fine kaolin.
To probe the local topographical and optical characteristics of different materials, a
sample of each coating was scanned with an NSOM (Nanonics, NSOM -100). In order to
compare orientation effects, all samples were aligned such that they had the same orientation
with respect to the raster scanning near-field probe. To compare similar resolution in terms
of both the optical and topographical images, the probe was kept at the same constant height
above the different sample surfaces. Statistical information was provided by a large number
of measurements; each sample was scanned three times in different locations over a square 5
by 5 μm, taking 256 by 256 measurements. Because NSOM is an interaction microscopy, the
coupling between the tip and different samples may be different and could influence the
average intensity scattered from different materials. However, this statistical analysis of the
light-material interaction eliminates the effect of the absolute intensity, justifying the
differences observed between the samples examined. The system was completely isolated for
each series of scans on the individual samples, keeping the excitation power constant.
41

8. PART B, RESULTS AND DISCUSSION
8.1 Surface topography and optical contrast
The NSOM scan provides two images simultaneously: a topographical map and an image of
local optical reflectivity. This is illustrated in Fig. 8-1 where both images were recorded over
an area of 25 square microns. There is no evident correlation between the topography and the
local reflectivity. This is expected from the highly inhomogeneous nature of these materials;
the local reflectivity dependence on both roughness and fluctuation of dielectric function. It is
emphasized here that it is these fluctuations of the optical intensity in the near- field (Fig. 8-
1b) that determines the far-field properties of scattered radiation.
b a
Figure 8-1(a) topography of Sample C; (b) intensity distribution from the same area of Sample C.
Both image sizes are 5 by 5 μm. Note that there is no correlation between the location of high
intensity points and topography features.
To provide a better assessment of the combined information, the overlaid images of
light intensity (color coded with blue being the lowest intensity) on 3D topography maps are
shown in Fig. 8-2. This representation of the NSOM results clearly revealed the differences in
the optical properties as influenced by both topography and refractive index variations.
Quantitative evaluations of both optical and mechanical properties will be presented in the
following.
42
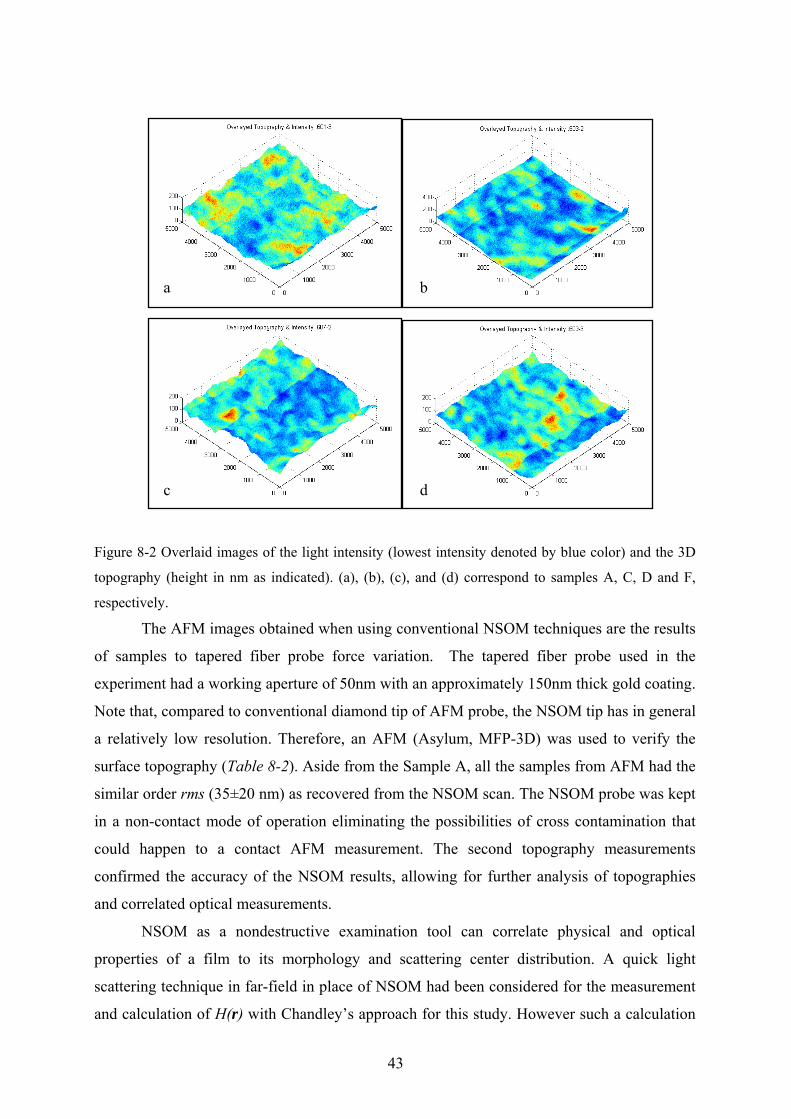
b a
d c
Figure 8-2 Overlaid images of the light intensity (lowest intensity denoted by blue color) and the 3D
topography (height in nm as indicated). (a), (b), (c), and (d) correspond to samples A, C, D and F,
respectively.
The AFM images obtained when using conventional NSOM techniques are the results
of samples to tapered fiber probe force variation. The tapered fiber probe used in the
experiment had a working aperture of 50nm with an approximately 150nm thick gold coating.
Note that, compared to conventional diamond tip of AFM probe, the NSOM tip has in general
a relatively low resolution. Therefore, an AFM (Asylum, MFP-3D) was used to verify the
surface topography (Table 8-2). Aside from the Sample A, all the samples from AFM had the
similar order rms (35±20 nm) as recovered from the NSOM scan. The NSOM probe was kept
in a non-contact mode of operation eliminating the possibilities of cross contamination that
could happen to a contact AFM measurement. The second topography measurements
confirmed the accuracy of the NSOM results, allowing for further analysis of topographies
and correlated optical measurements.
NSOM as a nondestructive examination tool can correlate physical and optical
properties of a film to its morphology and scattering center distribution. A quick light
scattering technique in far-field in place of NSOM had been considered for the measurement
and calculation of H(r) with Chandley’s approach for this study. However such a calculation
43

has its limits because the Kirchoff approximation on which the calculation is based requires
that the correlation length is much larger than the wavelength, and the local curvature of the
surface is small (Nieto-Verperinas 1991). The correlation lengths (Table 8-2) of samples
studied were in the same order as the visual wavelength, and cannot satisfy the criterion of
the Kirchoff approximation. Therefore, NSOM with an AFM feature suited better for the
topography characterization of smooth surface. The incapability of a far-field technique can
also be practically seen from insignificant TAPPI gloss differences between the machine
(MD) and cross machine (CD) directions (Table 8-2).
Table 8-2 Six coated samples measured with NSOM including correlation length and ratio of x/y,
roughness and contrast. Results other than from NSOM are noted with AFM, PPs-10 (TAPPI
Standard T555) and TAPPI 75° gloss (T480) in Paper IV. A B C D E F
Fine kaolin 0 20 40 0 20 40
Broad GCC 100 80 60
Narrow GCC 100 80 60
Corr. Length (x), μm 0.84 1.11 2.63 0.89 0.87 1.19
Corr. Length (y), μm 0.57 0.65 0.91 0.84 0.55 0.53
Corr. Ratio, x/y 1.38 1.70 2.48 1.06 1.53 1.96
Roughness rms, nm 38.4 40.6 34.1 27.7 17.1 20.8
Roughness rms, nm, AFM 97.4 54.7 39.8 53.3 27.4 45.2
Smoothness, nm, PPs-10 760 640 620 590 600 600
Optical contrast 0.199 0.204 0.199 0.183 0.177 0.188
TAPPI 75° gloss (MD) 66.5 72.8 79.4 73.7 78 80.4
TAPPI 75° gloss (CD) 66.3 73.4 80.0 74.4 77.2 80.6
In addition, the far-field TAPPI paper gloss is a specular reflection, featuring a
collection of mechanical and optical surface properties. PPs is based on air leakage. The
surface roughness is deducted from air leakage though it covers much larger area. In this
study, the PPs weakness (with kind of rms) in predicting gloss except for Samples A and B
can be seen from Table 8-2. As mentioned in the Introduction, NSOM gives both mechanical
and optical descriptions simultaneously (AFM gives mechanical ones).
44

8.2 Coating surface roughness, correlation length and autocorrelation The root mean square, rms surface roughness was calculated from the AFM topography
image. A higher rms value corresponds to a rougher surface. Roughness fluctuations of
surface height ranged from λ/10 to λ/20. As can be seen in Fig. 8-3, when comparing the two
groups of samples one can see that the broad GCC group (A. B. and C) had an overall
rougher surface than the narrow GCC group (D, E and F). This resulted in lower specular
gloss level in the far-field, i.e. the higher rms the lower the TAPPI gloss as expected. Within
the broad GCC and narrow GCC groups, the rms variations were relatively small, and no
clear trend could be discerned while the correlation lengths were quite different (to be
discussed in Fig. 8-5). This result demonstrates that roughness alone at different levels of fine
kaolin within a carbonate system could not correlate to the differences seen in the specular
gloss (Table 8- 2).
05
1015202530354045
A B C D E F
Rou
ghne
ss, n
m
Figure 8-3 Topography roughness, root mean square rms in nm measured by NSOM. Broad GCC
blends produced higher roughness than narrow GCC mix (Paper IV).
To quantify possible anisotropic effects, the surface correlation lengths were analyzed
along different directions. The typical topography autocorrelations in x and y directions are
illustrated in Fig. 8-4. A high autocorrelation is likely to indicate a periodicity in the signal of
the corresponding time duration. For a typical anisotropic surface, the autocorrelation should
be low. The results show that the sample A with no fine platy kaolin exhibits the lowest
degree of periodicity. Sample B (20 parts of kaolin) on the other hand is clearly periodical in
terms of its topographical features and the sample C with 40 parts kaolin is even more
periodical. Similar trends are for samples D, E and F of narrow GCC. Spatial autocorrelations
indicate that more fine platy kaolin tended to induce periodicities in the surface topography.
45

The NSOM is a raster scan. A standard with certain anisotropy is needed to calibrate the
NSOM and link x to the direction of manufacturing. An approach to prepare such a standard
has been developed. Future report is in due course.
Figure 8-4 Spatial autocorrelation of topography for the six samples examined. Circular
feature in the center denotes isotropy while the elongation in x direction indicates a
periodicity in the x direction. The degree of periodicity accentuates when the amount of fine
kaolin level increases from 0, 20, and to 40 parts in broad GCC (A), (B) and (C) and in
narrow GCC (D), (E) and (F), respectively. All image sizes are 5 by 5 μm.
A B
x-direction
D E F
C
The quantitative correlation length ratio results are plotted in Fig. 8-5 and, as can be
seen, an interesting trend emerges as a function of kaolin concentration. Within broad GCC
group, when fine kaolin level was increased, the x/y ratio of correlation length also increased.
The same trend held true for fine kaolin added to narrow GCC. Another interesting
observation is that the addition of fine kaolin to broad GCC generated higher x/y ratio of
correlation length than to narrow GCC. While this topography in principle is expected to
affect surface wetting, further study is needed to find out to what extend it would be.
46

0.0
0.5
1.0
1.5
2.0
2.5
3.0
A B C D E F
Cor
rela
tion
leng
th ra
tio
Figure 8-5 Topography correlation length ratio as measured by NSOM. Broad GCC (A, B and C) mix
with fine kaolin produced higher ratio than narrow GCC (D, E and F) mix. Adding more fine kaolin
increased the correlation length ratio in both calcium carbonates (Paper IV).
The fact that the addition of fine kaolin increased the correlation length x/y ratio can
be understood as such that varying surface extends longer in x than in y direction. The higher
value of correlation length in the x direction when the fine kaolin level was increased means
that kaolin addition leads to a smoother varying surface contour in that direction. Fine kaolin
particle size and shape distribution, particle rotation and alignment under shear field within a
blade boundary in blade coating (Romagnoli, Bousfield 1999), compression and horizontal
movement in calendering may well affect the correlation length and autocorrelations. A
reduced platy particle alignment corresponding to a lower gloss gain was noted in a clay
orientation study with SEM, X-ray, laser profilometry and gloss measurement (Rissa et al.
2000). It was demonstrated that facet orientation correlates better with gloss than rms (Chinga
et al. 2003). Because of the tip convolution of non-contact feature, NSOM topography image
(Fig. 8-1) was more diffuse than SEM (Fig. 7-1) and AFM (not shown). Visual evaluations
with NSOM, SEM or AFM could not distinguish coated surface anisotropy. This was
previously noted in using AFM to identify anisotropy within obliquely deposited gold films
where quantitative analysis of the contour length was needed (Skaife et al. 2001). Further
efforts are needed to study rms roughness, correlation length, and autocorrelation in any
desired direction.
The results that broad GCC had a higher rms roughness than narrow GCC can be
explained by several factors. Broad GCC had a higher number of coarse particles (Table 8-1).
The large particles on the surface can increase the surface rms and decrease TAPPI gloss
(Fig. 8-1).
47

-4
-2
0
2
4
6
8
10
12
0 2 4 6 8 10 12 14 16 18 20 22
Figure 8-1 Coating layer formed after absorption flow (Paper VII).
Though the large particles can be pushed into the coating by small particles under a
shear field in coating and a compression mode in calendering (Fig. 8-2 and 3), its disruption
effect on surface network still exists to increase rms and reduce gloss as evident from a
computer simulation and pilot trial (Paper VII).
-10
0
10
20
30
40
50
60
70
80
210 220 230 240 250 260 270 280 290 300 310 320
Figure 8-2 Example of blade flow simulation using five particle sizes is reported here, but no limit
exists in principle on the number of particle sizes Smaller particles concentrate more towards the
surface (Paper VII ).
48
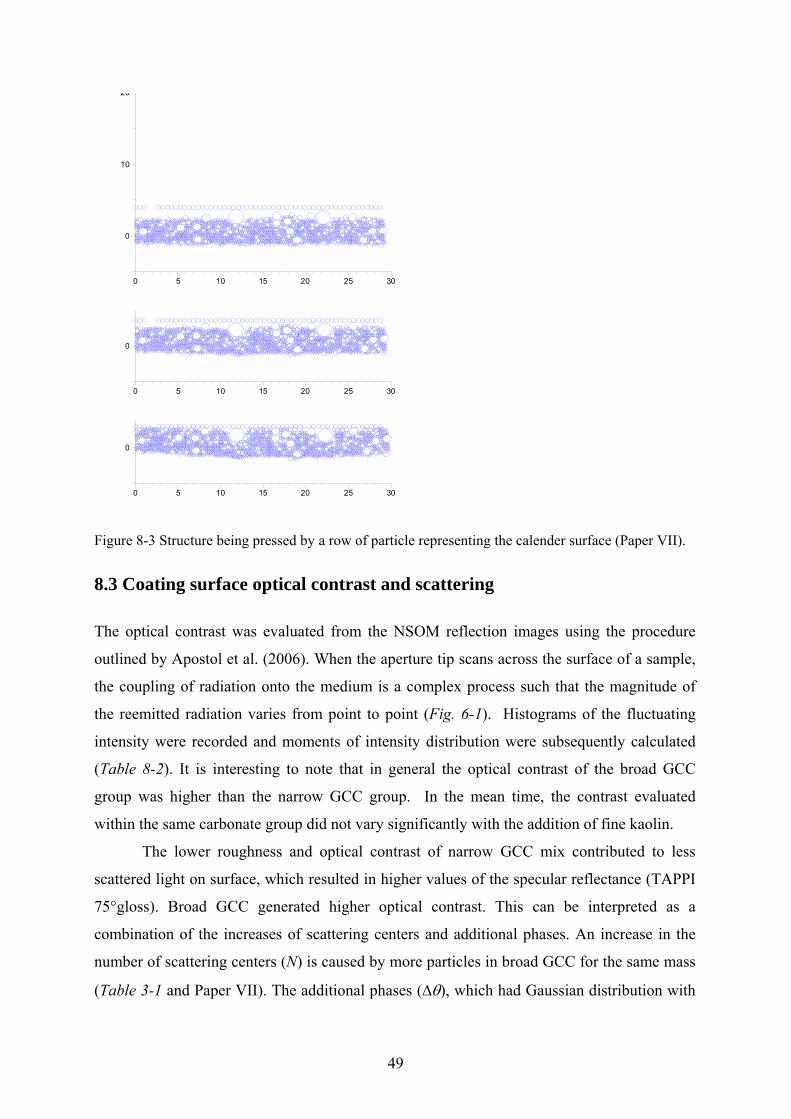
0
10
20
0 5 10 15 20 25 30
0
10
20
0 5 10 15 20 25 30
0
10
20
0 5 10 15 20 25 30
Figure 8-3 Structure being pressed by a row of particle representing the calender surface (Paper VII).
8.3 Coating surface optical contrast and scattering
The optical contrast was evaluated from the NSOM reflection images using the procedure
outlined by Apostol et al. (2006). When the aperture tip scans across the surface of a sample,
the coupling of radiation onto the medium is a complex process such that the magnitude of
the reemitted radiation varies from point to point (Fig. 6-1). Histograms of the fluctuating
intensity were recorded and moments of intensity distribution were subsequently calculated
(Table 8-2). It is interesting to note that in general the optical contrast of the broad GCC
group was higher than the narrow GCC group. In the mean time, the contrast evaluated
within the same carbonate group did not vary significantly with the addition of fine kaolin.
The lower roughness and optical contrast of narrow GCC mix contributed to less
scattered light on surface, which resulted in higher values of the specular reflectance (TAPPI
75°gloss). Broad GCC generated higher optical contrast. This can be interpreted as a
combination of the increases of scattering centers and additional phases. An increase in the
number of scattering centers (N) is caused by more particles in broad GCC for the same mass
(Table 3-1 and Paper VII). The additional phases (∆θ), which had Gaussian distribution with
49
a width determined by the distribution of the surface heights, rms (i.e. the higher rms the
larger ∆θ, see NSOM smoothness pair-comparisons of A vs. D, B vs. E and C vs. F, Table 9-
2) led eventually to a broader distribution of phase and consequently to a higher contrast
value (Apostol et al. 2006).
The rough surface of broad GCC coated paper generated low specular reflectance.
However, this surface phenomenon alone does not determine the whole coating layer optical
attenuation due to scattering, which is affected by an average coefficient Vsscatt ρσα =
proportional to both scattering cross-section σs and the volume density of pores ρv. Indeed,
corresponding to the same pore size distribution the broad GCC coated samples had lower
pore volume density than the narrow GCC regardless of the kaolin level, as measured by
mercury porosimetry (Paper IV). While this study focuses on using NSOM to characterize
topographical and optical surfaces containing GCCs and fine kaolin, the surface characterized
can be used in future coating studies. Zhang and Sundararajan (2007) noted that centerline
average and rms have an effect on optical loss in the waveguide, adhesion, and friction, and
autocorrelation has been used to model the adhesion of thin films etc.
50
9. PART B, CONCLUSION
This study demonstrates that Near-field scanning microscopy (NSOM) can be used to
simultaneously characterize topographic roughness, correlation length, autocorrelation, and
optical contrast from the same area of coated paper surfaces. The optical contrast of light field
in the proximity of the coating layer is an indication of sample diffusivity. While the process
of light scattering is complicated by the influence of both topography and variation of
refractive index, the experiments clearly indicate that coatings characterized by higher gloss
manifest lower values of the near field optical contrast. Moreover, they suggest that both
surface roughness and correlation length affect the physical and optical properties.
It also observed that the addition of fine kaolin increased the topography correlation
length resulting in a smoother varying surface contour. Furthermore, the topography
correlation length increased with different amounts in orthogonal directions indicating the
creation of a certain degree of surface anisotropy. This feature was calculated for both sets of
samples examined, broad and narrow distribution GCCs even though the narrow GCC
combination with fine kaolin produced, in general, a lower topography roughness and optical
contrast which can be translated into higher specular reflectance (TAPPI 75° gloss).
51

PART C The influence of fine kaolin and ground calcium carbonates on
the efficiency and distribution of fluorescence whitening agents (FWA) in
paper coating
10. PART C, BACKGROUND AND THEORIES Fluorescence whitening agents (FWA) are widely used in paper to increase whiteness. It is
well known that a base paper containing wood fiber absorbs UV light and reduces the
efficiency of FWA (Johnson 1991; Johansson 2000; e.g. Forsskåhl 2000). In paper coating,
other factors are more critical as evidenced from a distyrylbiphenyl (DSBP) FWA lab study in
the correlation of absorption and fluorescence, the yield between absorbed and emitted light,
and the position of saturation point (Rohringer, Fletcher 1996). In a lab study of pre-
moisturized pre-coat to prevent top-coat FWA from migrating into pre-coat, it was proposed
to use FWA in top-coat and TiO2 in pre-coat (Heikkilä et al. 1998). In a recent study of
coating over glass, the reflectance was found to range between 60-80%, and for kaolin it was
somewhat higher in the visible region but lower in the UV-region (Fjellström et al. 2007a).
The previous studies featuring lab-scale used kaolin and calcium carbonate separately without
investigating the coating structure of fine kaolin and carbonates blend impacts on optical
properties.
The FWAs used in paper industry are mainly sodium-salts, thus water soluble. The π-
electrons in the conjugated chain absorb ultraviolet radiant energy in 300-360 nm wavelength
and re-emit the energy mainly in 400-450 nm, blue light range. FWA distribution is affected
by paper and coating chemistry, coating and drying process. A pilot scale coating is a proper
way to simulate the complicated coating process. We conducted a pair-comparison pilot
coating, then a pilot-scale design of experiment (DOE) to investigate kaolin and calcium
carbonate, and coating structure effects on FWA efficiency.
In an effort to describe the optical properties of highly scattering materials while
reducing the computational difficulties, simplifying flux models have been designed for the
radiative energy transport. A volume scattering medium consisting of a collection of
scattering centers is described as homogeneous material characterized by effective scattering
and absorption properties that are determined by its internal structure. In this approach, the
fundamental equation of radiative transfer is based on the balance between the net flux
52

change, the flux input, and flux continuing out in an infinitesimal volume. Assuming two
diffusing components, a one-dimensional model based on plane symmetry for unit cross
section was initially proposed (Schuster 1905). The model relates the phenomenological,
effective scattering SK-M and absorption KK-M coefficients to measurable optical properties
such as diffuse reflectance or transmittance. The most successful extension of this model is
the so-called Kubelka-Munk (KM) theory (Kubelka, Munk 1931).
A considerable body of work was dedicated to relate the KM parameters to
microstructure and to incorporate both the single- and multiple-scattering effects.
Refinements and higher order flux models were developed. A more accurate model that
accounted for the usual condition of collimated incident radiation was elaborated (Reichman
1973). A four-flux model was developed that includes certain anisotropy of the scattered
radiation (Maheu 1984). A six-flux model was implemented to incorporate the effect of
particle shape and inter-particle correlation (Emslie 1973). In spite of the fact that it is based
on empirical determination of coefficients and that its range of applicability is rather unclear,
the simple-to-implement KM theory gives a reasonably good description of experiments and
has found applications in areas such as coatings, paper, paints, pigments, medical physics, and
atmospheric physics.
Initially the internal reflection of photons at the medium’s boundaries was ignored.
Later, the reflectance was included to show that by theory and experiment, the reflectance and
absorption of a non-homogeneous specimen depend on the direction of illumination, whereas
transmittance does not (Kubelka 1948, 1954). In addition to the assumptions mentioned
already, the difficulties in using KM equation in this multi-layer coating study are that it does
not have a wavelength parameter, the scattering coefficients of different layers cannot be
experimentally determined from a coated whole sheet, and the scattering coefficients vary as
thickness changes.
Assuming the normal incidence of a beam with irradiance Ii (Fig. 10-1), the total flux
transmitted through a slab is given by (Bohren, Huffman 1998)
...)1()1( 44222 +++−= −−− hhhit eReReRII ααα , [10-1]
53
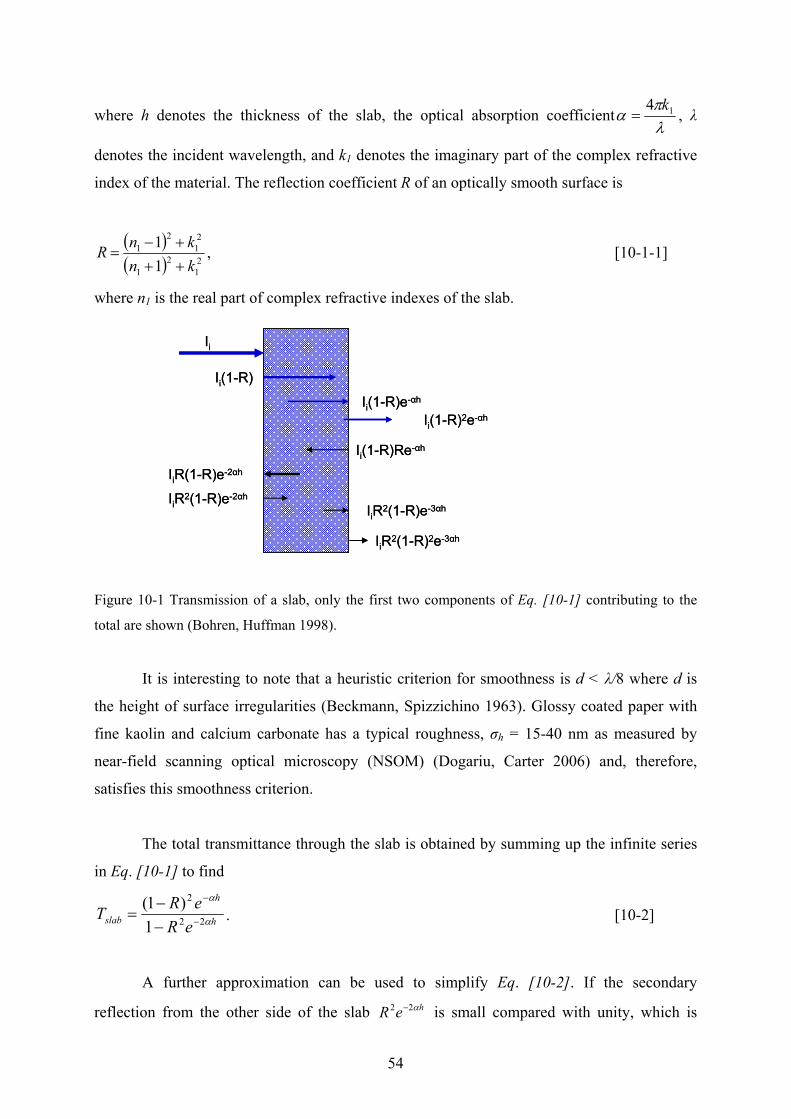
where h denotes the thickness of the slab, the optical absorption coefficientλπ
α 14 k= , λ
denotes the incident wavelength, and k1 denotes the imaginary part of the complex refractive
index of the material. The reflection coefficient R of an optically smooth surface is
( )( ) 2
12
1
21
21
11
knknR
+++−
= , [10-1-1]
where n1 is the real part of complex refractive indexes of the slab.
Ii
Ii(1-R)
IiR(1-R)e-2αh
IiR2(1-R)e-2αh
Ii(1-R)e-αh
Ii(1-R)Re-αh
IiR2(1-R)e-3αh
Ii(1-R)2e-αh
IiR2(1-R)2e-3αh
Ii
Ii(1-R)
IiR(1-R)e-2αh
IiR2(1-R)e-2αh
Ii(1-R)e-αh
Ii(1-R)Re-αh
IiR2(1-R)e-3αh
Ii(1-R)2e-αh
IiR2(1-R)2e-3αh
Figure 10-1 Transmission of a slab, only the first two components of Eq. [10-1] contributing to the
total are shown (Bohren, Huffman 1998).
It is interesting to note that a heuristic criterion for smoothness is d < λ/8 where d is
the height of surface irregularities (Beckmann, Spizzichino 1963). Glossy coated paper with
fine kaolin and calcium carbonate has a typical roughness, σh = 15-40 nm as measured by
near-field scanning optical microscopy (NSOM) (Dogariu, Carter 2006) and, therefore,
satisfies this smoothness criterion.
The total transmittance through the slab is obtained by summing up the infinite series
in Eq. [10-1] to find
h
h
slab eReRT α
α
22
2
1)1(
−
−
−−
= . [10-2]
A further approximation can be used to simplify Eq. [10-2]. If the secondary
reflection from the other side of the slab is small compared with unity, which is heR α22 −
54
basically true for light transmittance in a very opaque pigment coating, then Eq. [10-2]
reduces to
h
slab eRT α−−= 2)1( [10-3]
Though it includes the wavelength parameter, there are a number of practical aspects
which are not accounted for in this representation. First, the coating layer has many small air
voids of refractive index around unity (LePoutre 1989), which significantly increases the
importance of scattering in comparison with absorption. Another complication arises in paper
coatings that have random multi-particle orientation and packing, i.e. variety of optical
dipoles with distributions from multi-ingredients, irregular air void size and shape
distributions on both the surface and the inner layer of a coating. Moreover, optical interfaces
are not homogeneous as assumed in this approximation. Due to variations in surface
topography and dielectric properties along the interface, a confinement of evanescent waves
occurs in the near-field of media random coating layer that may affect statistical properties of
optical fields in the vicinity of interfaces (Apostol et al. 2006). More advanced optical
scattering theories, such as T-matrix and coupled (discrete) dipoles approximation (CDA) etc.
may be utilized to describe the scattering from inhomogeneous coating layers (Tsang et al.
2001).
For the purpose of this discussion about coating pigment and structure influence on
FWA efficiency within a porous paper coating, we treat the coating layer as a unit and use the
extinction coefficient of a coating layer in an approximate equation in the form of
h
coatingEXTeRT α−−= 2)1( [10-4]
where the αEXT denotes extinction coefficient
absVsabsscattEXT αρλσααα +=+= )( [10-5]
Eqs. [10 -4, -5] imply that as far as absorption is concerned high reflectance and
thickness, as well as low wavelength reduces the light transmittance, Tcoating. In porous paper
coating, the attenuation due to absorption, αabs remains relatively the same because it is
primarily determined by the chemical composition and molecule structure of the coating
55

chemicals i.e. both broad and narrow GCCs are calcite calcium carbonates. The attenuation
due to scattering is measured by an averaged coefficient Vsscatt ρσα = that is proportional to
both scattering cross-section σs and the volume density of pores ρv. Hence, the scattering
coefficient is directly affected by the increase in pore volume fraction. As a result, the
attenuation increases significantly due to the increase of σs and ρv. We note that
Vsscatt ρλσα )(= varies depending on wavelength, and is valid for a mono sized pore
distribution, but in real coating one has an entire distribution of sizes. However, this would
only make the result more specific to a particular coating composition, but will not affect the
main conclusion that the increase in pore size of given wavelength and number leads to an
increase in scattering. Also, it will not affect the statement about the wavelength dependence
of attenuation that is not included in the KM approximation. Another important observation
relates to the wavelength dependence of the scattering cross section of an air pore. This is the
origin of the spectral variations in both transmission and reflection from diffusing coatings.
56

11. PART C, EXPERIMENTAL
11.1 Pigment properties of coatings
The first coating trial was run with paired-comparisons (Table 11-1). The second, a 3-factor
DOE (the same pigments with different levels while all the other factors were the same as in
the first trial), totaling eight trial points, was a mixture design and optimized with distance-
based optimality. The DOE design and analysis was done with Minitab 15 statistics software
(Minitab, USA). Ground calcium carbonates, with broad size distribution at 95.3 TAPPI
brightness and 0.42 b-value; with narrow size distribution 94.9 TAPPI brightness and 0.26 b-
value were from Omya AG. The fine kaolin at 90.9 TAPPI brightness and 2.19 b-value was
from KaMin LLC. The TAPPI brightness and b-value by TAPPI T452 (Technidyne) were
measured at KaMin LLC, Macon, Georgia, USA (Table 3-1). Wood free base paper was from
Fraser Papers, Canada: basis weight 62 g m-2; TAPPI brightness 85.4 and b-value 4.1.
11.2 Preparation and properties of coatings
Coatings with different combinations of pigments, designed to represent a range of coating
compositions with variable porosities (Table 11-1) were prepared on pilot scale according to
the pilot coating facility procedures in Part A (Paper I and II). The coatings were applied on a
wood free base paper using a pilot coater in Trois-Rivières, PQ, Canada, and details are listed
elsewhere (Paper I).
Table 11-1 Pigment compositions of first pilot coating, in parts by weight. In addition, all other
coating chemicals were the same as in Paper I.
Topcoat A B C D E F
Fine kaolin 40 20 40 20
Broad GCC 60 80 100
Narrow GCC 60 80 100
Solids of coating, % 65.2 65.7 65.0 65.0 65.0 65.2
WRV, g/m2 119 134 153 164 183 211
57

11.3 Optical measurements of coated samples
The coated paper samples were prepared and conditioned according to TAPPI standard T402.
TAPPI brightness was determined with 457 nm wavelength light (light source A standard,
Fig. 11-2) by TAPPI T452. ISO CIE whiteness was measured with diffused light source
(light source D65/10° standard with more UV than TAPPI brightness standard) according to
ISO 11475:2000. Whiteness is defined as the reflectance of light across the visible spectrum
including color components in the measurement. Brightness is defined as the reflectance of
light at the wavelength of 457 nm without color in the measurement. Due to this difference,
whiteness becomes important in paper industry (e.g. Lekelä 2000).
Figure 11-2 Spectral energy distributions of standard illuminates A, C, and D65 (e.g. Crawford et al.
1996).
For the analysis of FWA distribution in thickness direction, paper samples were
embedded in epoxy resin. A cross section of 5 μm thickness was sliced with a dry diamond
knife. A cooled digital camera was used to capture the image under Zeiss Axioplan UV-light
microscope in reflective mode with a fluorescence filter. To keep constant light intensity, 20
ms exposure time was used for each sample, respectively (KCL Oy, Espoo, Finland).
58

12 PART C, RESULTS AND DISCUSSION
12.1 Coating structure with fine kaolin and calcium carbonate
The coating pore structures of coated paper samples were characterized with mercury
intrusion (Paper I). When blended with 20 and 40 parts of fine kaolin, narrow GCC generated
higher pore volume than broad GCC with the same pore diameter ranges (Fig. 12-1). This
was also true for 100 parts of GCCs (not shown here). Based on Eqs. [10- 4, -5], a larger pore
volume density, ρV increases the light scattering coefficient, αscatt and consequently reduces
the light transmittance Tcoating.
0
0.02
0.04
0.06
0.08
0.1
0.12
0.14
0.010.11Equiv. pore dia., μm
Log
diffe
rent
ial i
ntru
sion
, ml/g
0
0.02
0.04
0.06
0.08
0.1
0.12
0.010.11
Euiv. pore dia., μm
Log
diffe
rent
ial i
ntru
sion
, ml/g
(a) (b)
Figure 12-1 Coating pore structure in the pore diameter range of 0.02 – 0.5 μm. (a) with 20 parts of
fine kaolin narrow GCC (Δ) has higher pore volume than broad GCC (□); (b) with 40 parts of fine
kaolin narrow GCC (-) has higher pore volume than broad GCC (x) in Paper V.
12.2 GCC type and kaolin level influence on TAPPI brightness and CIE whiteness
As the base paper and pre-coat were kept constant, the effect of brightness difference of
coated paper was more determined by the top-coat pigment brightness and packing. The
increase of kaolin level led to lower brightness in blends with either broad GCC or narrow
GCC (Fig. 12-2). The pigment brightness and b-value of broad GCC were 0.4 and 0.16 (less
blue) points higher than those of narrow GCC, respectively. However, compared to broad
GCC, narrow GCC generated higher coated paper brightness. This is expected from
discussions on optics and coating pore structure. The coated paper brightness is increased by
the high scattering power of narrow GCC coatings that can hide the dark base paper better.
59

86.0
87.0
88.0
89.0
90.0
91.0
0 20 40Kaolin level, parts
TAP
PI B
righ
tnes
s, %
BRD GCC/Fine KaolinNRW GCC/Fine Kaolin
Figure 12-2 TAPPI brightness of coated paper with broad (BRD) GCC and narrow (NRW) GCC with
fine kaolin level from 0 to 40 parts (Paper V).
Broad GCC generated CIE whiteness higher than or equal to that of narrow GCC
across the levels studied (Fig. 12-3). The addition of kaolin reduced CIE whiteness regardless
of GCC types. Besides the features of TAPPI reflective vs. ISO diffusive lights, TAPPI light
source has a very low level of UV light while the CIE whiteness light source D65 is similar to
outdoor daylight that contains higher level of UV light (Fig. 11-2). Coating structure has
influence on light scattering. The higher scattering power of narrow distribution pigment
packing affects not only the attenuation of the forward scattering but also the backscattering
when the light is multi-scattered before it exits either side of coated paper. Furthermore,
various particle size and shape distributions have different light scattering and absorption
efficiencies (e.g. Bohren, Huffman 1998).
86889092949698
100102104106
0 20 40Kaolin level, parts
CIE
Whi
tene
ss, %
BRD GCC/Fine KaolinNRW GCC/Fine Kaolin
Figure 12-3 ISO CIE whiteness of light source D65 from broad (BRD) GCC and narrow (NRW) GCC
with fine kaolin level from 0 to 40 parts (Paper V).
60
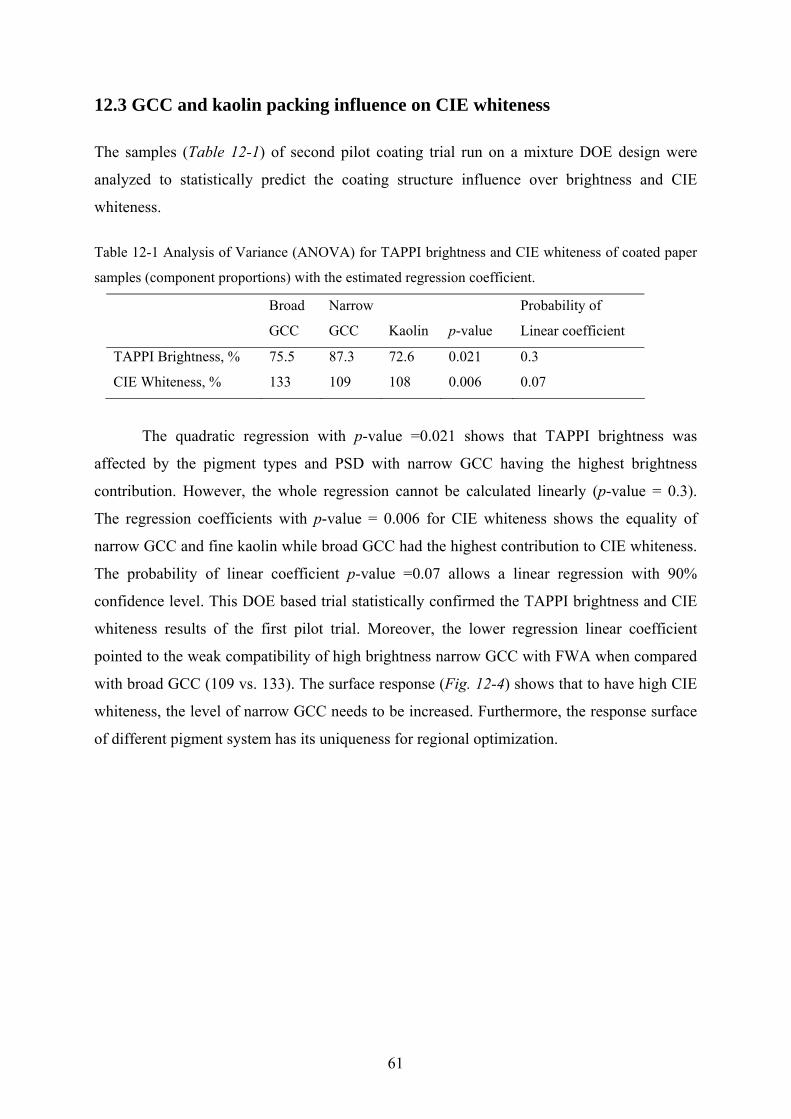
12.3 GCC and kaolin packing influence on CIE whiteness
The samples (Table 12-1) of second pilot coating trial run on a mixture DOE design were
analyzed to statistically predict the coating structure influence over brightness and CIE
whiteness.
Table 12-1 Analysis of Variance (ANOVA) for TAPPI brightness and CIE whiteness of coated paper
samples (component proportions) with the estimated regression coefficient.
Broad
GCC
Narrow
GCC Kaolin p-value
Probability of
Linear coefficient
TAPPI Brightness, % 75.5 87.3 72.6 0.021 0.3
CIE Whiteness, % 133 109 108 0.006 0.07
The quadratic regression with p-value =0.021 shows that TAPPI brightness was
affected by the pigment types and PSD with narrow GCC having the highest brightness
contribution. However, the whole regression cannot be calculated linearly (p-value = 0.3).
The regression coefficients with p-value = 0.006 for CIE whiteness shows the equality of
narrow GCC and fine kaolin while broad GCC had the highest contribution to CIE whiteness.
The probability of linear coefficient p-value =0.07 allows a linear regression with 90%
confidence level. This DOE based trial statistically confirmed the TAPPI brightness and CIE
whiteness results of the first pilot trial. Moreover, the lower regression linear coefficient
pointed to the weak compatibility of high brightness narrow GCC with FWA when compared
with broad GCC (109 vs. 133). The surface response (Fig. 12-4) shows that to have high CIE
whiteness, the level of narrow GCC needs to be increased. Furthermore, the response surface
of different pigment system has its uniqueness for regional optimization.
61

0.8
0.795
100
0.60.00
105
0.15 0.50.300.45
Whiteness
NRW GCC
Fine Kaolin
Surface Plot of Whiteness vs NRW GCC, Fine Kaolin
Figure 12-4 Mixture DOE of high level of narrow (NRW) GCC (0-80 parts) with fine kaolin (0-50
parts) in Paper V.
The DOE statistical prediction of this coating study reveals that for visual wavelength
lights a high αscatt is needed to reduce light transmittance and to cover the dark base paper. It
also, however, shows that for UV light that is attenuated more in the coating (Eq. [10-4, - 5]),
a low αscatt is needed to increase UV light transmittance and to generate more blue light from
FWA. An increase of αscatt to UV light is due to a larger ρV, and to a possible σs(λ) increase as
wavelength decreases (it is also possible to have a case of σs(λ) decrease but its magnitude
must be in the range to give a net increase of αscatt= σs(λ)ρV). In either case, the combination
of ρV and σs(λ) makes αscatt larger in narrow GCC than in broad GCC to attenuate short
wavelength UV light more as reflected in low CIE whiteness, i.e. a reduced UV efficiency.
While the αscatt = σs(λ)ρV contribution to Tcoating in a multi-coating is discussed, a complete
evaluation of Eq. [10-4, -5] requires that the thickness, h impact, i.e. FWA distribution in the
thickness direction be further investigated.
12.4 FWA distribution in coatings with different kaolin levels
For all the microscopy illuminated with UV light (Fig. 12-5), the FWA of 100 parts of coarse
GCC pre-coat mostly concentrates at the interface of pre-coat and base paper (since base
paper does not have any FWA, it appears black in the image). Though the CMC level was
higher in pre-coat (0.7 vs. 0.5 parts of top-coat), the blade pressure and capillary adsorption
combined with porous coating of coarse GCC caused rather severe dewatering that brought
FWA to the interface and anchored there, and left very little FWA to migrate towards surface
62

during drying of post pre-coating. It is interesting to note that the FWA concentration at the
interface of pre-coat and top-coat is much lower than at top surface (Fig. 12-5c). This
indicates that in this high speed coating with jet applicator and bevel blade the dewatering
from top-coat into the pre-coat is much weaker than from pre-coat into base paper. For all the
top coatings (the interface of top and pre-coat can be located at an even split of total coating
thickness as shown in Fig. 12-5b). The 100 parts narrow GCC (Fig. 12-5a) has a rather
uniform intensity of FWA in thickness direction. When 20 parts of fine kaolin (Fig. 12-5b)
was added at the expense of narrow GCC, the FWA concentrates more toward surface, and
this becomes even more evident when 40 parts fine kaolin (Fig. 12-5c) was added. Digital
imaging analysis for the top 1/3 of coating layer thickness of the cross section produced 183,
151, 125 blue levels (it is based on 28 = 256 blue level, the larger number the brighter) for
sample D, E, F, respectively (Adobe, Photoshop®, USA).
rts of narrow GCC in top-coat; (b) 80 parts NWR GCC and 20 parts of fine
parts of narrow GCC and 40 parts of fine kaolin in top-coat. Coated
illuminated with UV light. The dark middle layer is the base paper
trates at the interface of pre-coat and base paper
more at top surface with the addition of fine kaolin at the
oatings. The FWA of pre-coat concentrates at the interface
(b) (c)
Base paper
Interface of top and pre-coat
Top layer
(a)
Interface of paper and pre-coat
Figure 12-5 (a) has 100 pa
kaolin in top-coat; and (c) 60
paper cross section of microscopy
that has no FWA. FWA of pre-coat heavily concen
while the FWA of top-coat concentrates
expense of narrow GCC (Paper V).
Recalling the discussions above, Eqs. [10 -4, -5] and Fig. 12-5, one can make several
observations. For high efficiency, FWA should be concentrated near the top surface because
this is where the short wavelength UV light is least attenuated, and most exposed to the
backscattered UV light from the c
63

(approximately 20 μm of an average thickness) of pre-coat and base paper. The high αscatt and
at theh interface produces the less UV transmittance based on Eq. [10- 4 and 5], making the
FWA of pre-coat the least efficient. This note about FWA distribution can be extended to
single blade and film coatings where the FWA distribution is affected by the same mechanism
as pre-coat, i.e. through the interactions between base paper and coating. Wood free or
ground wood base paper and board often contains FWA for the whiteness and uniformity
from multi-scattering properties. Broad GCC with fine kaolin can further improve CIE
whiteness by allowing more UV light to transmit to the pre-coat and base paper to generate
more blue lights and to be backscattered through it. Kaolin has lower brightness and absorbs
more UV light than carbonates (e.g. McComb, Stickler 1995). This study shows that this can
be partially compensated by the fine kaolin ability of retaining and allowing the migration of
FWA towards the surface to make FWA more efficient. If a wood free base paper has high
yield pulp, kaolin containing coating layer can more effectively screen UV to reduce light-
induced brightness reversion of high yield pulp (Yuan et al. 2006). This study suggests that
for FWA efficiency, uniformity and UV screening it is desirable to design a carbonate and
kaolin pigment system to produce a gradient FWA distribution in thickness direction with the
highest FWA concentration towards the surface.
64

13. PART C, CONCLUSION
This study found that increasing fine kaolin level at the expense of narrow GCC made FWA
concentrate more towards the surface as shown by cross sections of microscopy under UV
light. Pigment coating structure affects the FWA efficiency mainly in the ways of light
scattering and FWA distribution in thickness direction. The combination of pore volume
density, ρV and scattering cross-section, σs(λ) makes αscatt larger in narrow GCC than in BRW
GCC to attenuate short wavelength UV light more, i.e. a reduced UV efficiency. It is
desirable to design a carbonate and kaolin pigment system to produce a gradient FWA
distribution in thickness direction with the highest FWA concentration towards the surface.
While its brightness and whiteness are lower than carbonates fine kaolin has a function to
improve FWA efficiency by making FWA least attenuated in forward scattering and most
exposed to the backscattered UV light near the surface.
65

14. CONCLUSIONS
Characterization of a coating structure by mercury intrusion may be used to calculate the total
Gibbs energy (ΔGs) of capillary imbibition for a given liquid into a heterogeneous porous
coating at the final state. This novel utilization of the Gibbs energy concept combines coating
structure variables (volume and diameter, ∑(Vi/Di)) and surface energy parameters (γcosθ) at
the liquid-coating-vapor interface. Furthermore it shows that the ΔGs is a better characteristics
of capillary imbibition than each parameter alone. The good match between the time needed
to reach the maximum tack force (tmax) and the Gibbs energy on both coated paper and board
applications leads to the conclusion that though many factors affect the capillary imbibition in
the initial state and the rate of access to the final state, the calculation of ΔGs appears to reflect
the effect of coating structure and surface energy on the imbibition of ink until the maximum
tack is reached. A larger capillary pore surface area strongly increases ink setting rate, as
measured by the shortened tmax. Comparisons of different kaolin and latexes show that the
base parameters γ- (in the vOCG approach) are low compared to Lifshitz-van der Waals
interactions, γLW while the acid γ+ component is negligible. Moreover, using kaolin coatings
with constant γLW and different γ- changes the Gibbs energy and coated paper capillary
adsorption in offset ink setting, as seen in the different tmax, but there is no effect on the
maximum tack force, Fmax and the final tack. However, compared to styrene/n-butyl acrylate
latex, n-butyl acrylate-acrylonitrile-styrene latex that lowers γLW on coated board surface
significantly increases tmax, and reduces Fmax and the final tack.
In addition to introducing the Gibbs energy concept, this thesis shows that Near-field
scanning microscopy (NSOM) can be used at the light-solid-air interface to characterize
topography with roughness, correlation length and autocorrelation, and optical contrast from
the same area of coated paper surfaces in one single measurement. The addition of oblate
spheroids increases the coated paper topography correlation length resulting in a smoother
varying surface. Moreover, the topography correlation length increases with different
amounts in orthogonal directions indicating the creation of a certain degree of surface
anisotropy. Finally, it shows by UV microscopy of cross-sections of paper that increasing fine
kaolin level in coatings causes FWA to concentrate more towards the surface. The
combination of pore volume density, ρV and scattering cross-section, σs(λ) makes the
66
scattering coefficient, αscatt larger in narrow GCC than in broad GCC coatings and, hence,
short wavelength UV light is attenuated more, i.e. UV efficiency is reduced
Future basic studies will be to apply the Gibbs energy model with the topography
characterized by NSOM at the liquid-solid-vapour/air interfaces of thin layer porous coatings
with nano particles.
67

REFRENCES
1. Adamson, A. and Gast, A. Physical Chemistry of Surfaces, 6th Ed. John Wiley &
Sons, New York, 1997.
2. Apostol, A., Haefner, D. and Dogariu, D. Phys. Rev. E 74, 066603, 2006, 1.
3. Beaglehole, D. J. Phys. Chem. 1989, 93(2), 893.
4. Beckmann, P. and Spizzichino, A. The light scattering of electromagnetic waves from
rough surfaces, Macmillan, New York, 1963.
5. Bohren, C.F. and Huffman, D.R. Absorption and scattering of light by small particles,
John Wiley & Sons, New York, 1998.
6. Bosanquet, C. H. Philos. Mag. 1923, S6 (45), 525.
7. Chinga, G., Gregersen, Ø. and Dougherty B. J. Microscopy and Analysis, 2003, 84, 5.
8. Chinga, G. and Helle, T. J. Pulp Paper Sci. 2003, 29, 179.
9. Crawford, P. M. and Crawford, T. B. Measurement and Control of the Optical
Properties of Paper, 2nd Edition, Technidyne Corporation, New Albany, 1996.
10. Della Volpe, C. and Siboni, S. J. Adhesion Sci. Tech. 2000, 14(2) 235.
11. Derjaguin, B., Starov, V.M. and Churaev, N.V. Colloid J. 1976, 38(5), 875.
12. Dogariu, A. and Carter, R.D. 9th TAPPI Advanced Coating Fundamental Symposium,
2006, pp323-327.
13. Donigian, D.W., Ishley, J.N. and Wise, K.J. TAPPI Proc. Coating Conf., 1996, TAPPI
Press, pp. 39-48.
14. Dunn, R. C. Chem. Rev., 1999, 99, 2891.
15. Dunnett, C.W. Biometrics, 1964, 20, 482.
16. Dussan, E.B., Rame, E. and Garoff, S. J. Fluid Mech. 1991, 230, 97.
68
17. Dutta, A.K., Vanoppen, P., Jeuris, K., Grim, P.C.M., Pevenage, D., Salesse, C. and De
Schryver, F.C. Langmuir, 1999, 15, 607.
18. Elton N.J., and Preston, J.S. Tappi J. 2006a, 5(7), 8.
19. Elton N.J., and Preston, J.S. Tappi J. 2006b, 5(8), 10.
20. Emslie, A. G. and Aronson, J. R. Appl. Opt. 1973, 12, 2563.
21. Fisher, L.R., and Lark, P.D. J. Colloid Interface Sci. 1979, 69, 486.
22. Fisher, L.R., and Israelachvili, J.N. J. Colloid Interface Sci. 1981, 80(2), 528.
23. Fjellström, H., Höglund, H., Forsberg, S., Paulsson, M., and Rundlöf, M. Nord. Pulp
Paper Res. J. 2007a, 22(3): 343.
24. Fjellström, H., Höglund, H., Forsberg, S., Paulsson, M., and Rundlöf, M. Nord. Pulp
Paper Res. J. 2007b, 22(3): 350.
25. Forsskåhl, I. “Brightness reversion”, In: Forest products chemistry, Ed. Stenius, P.
Fapet Oy, Helsinki, Finland, 2000, 278-332.
26. Franco, F. and Ruiz Cruz, M.D. Clay Miner. 2004, 39, 193.
27. Gane, P.A.C., Hopper, J.J. and Grundwald, A. TAPPI Coating Conf. Proc. 1995,
TAPPI Press, Atlanta, pp383-390.
28. Gane, P.A.C. and Seyler, E.N. TAPPI Coating Conf. Proc., 1994, TAPPI Press, pp.
243-260.
29. Gane, P.A.C., Matthews G.P., Sechoelkopf, J., Ridgway, C.J. and Spielmann, D.C.
TAPPI Coating Fundamental Symposium, 1999, TAPPI Press, pp.213-236.
30. Gate, L.F. and Leaity, K. TAPPI Coating Conf. Proc. 1991, TAPPI Press, Atlanta,
pp473-481.
31. de Gennes, P.G. Rev. Mod. Physi. 1988, 57, 827.
32. Good, R.J. J. Adhesion Sci. Technol. 1992, 6(12), 1269.
69

33. Gu, W., Bousfield, D.W. and Tripp, C.P. Nord. Pulp Paper Res. J. 2007, 22(1), 57.
34. Heikkilä, K., Alatalo, M. and Grankvist, T. TAPPI Coating Conf. Proc., 1998, TAPPI
Press, pp355-372.
35. Hiorns, A.G., Elton, N.J., Coffon, L. and Parsons, D.J. TAPPI Coating Conf. Proc.
1998, TAPPI Press, Atlanta, pp583-600.
36. Hudspeth, Q.M., Nagle, K.P., Zhao, Y,-P., Karabacak, T., Nguyen, C.V., Meyyappan,
M., Wang, G.-C. and Lu, T.-M. Surface Science, 2002, 515 452.
37. Ianoul, A. and Bergeron, A. Langmuir, 2006, 22, 10217.
38. Ishikawa, N. and Satoda, V. J. Colloid Interface Sci. 1994, 162, 350.
39. Israelachvili, J. Intermolecular and surface forces, 2nd Ed., Academic Press, San
Diego, CA, USA, 1992.
40. Jacob, P. and Berg, J.C. Langmuir, 1994, 10, 3086.
41. Jeje, A.A. J. Colloid Interface Sci. 1979, 69, 420.
42. Johansson, M. Licentiate thesis, the Royal Institute of Technology, Stockholm,
Sweden, 2000.
43. Johnson, R.W. Tappi J. 1991, 74(5): 209.
44. Joos, P., van Remoortere, P and Bracke, M. J. Colloid Interface Sci. 1990, 136, 189.
45. Kan, C.S. and Van Gilder, R.L. TAPPI Coating Conf. Proc., 2004, TAPPI Press,
Atlanta, pp. 21-36.
46. Kistler, S.F. Hydrodynamics of wetting. In: Wettability, Berg, J.C. (Ed.), Marcel
Dekker, New York, 1993, pp. 311-429
47. Kubelka, P. and Munk, F. Z. Tech. Phys. 1931, 12, 593.
48. Kubelka, P. J. Opt. Soc. Am. 38(5), 1948, 448.
49. Kubelka, P. J. Opt. Soc. Am. 1954, 44(4), 330.
70

50. Lavi, B., Marmur, A. and Bachmann J. Langmuir, 2008, 24, 1918-1923.
51. Leach, R.H. and Pierce R.J. Printing Ink Manual, 5th Ed. Blueprint, London, 1993.
52. Levine, S, Reed, P, Watson, E.J. and Neale G. “A theory of the rate of rise of a liquid
in a capillary” In Colloid and interface science Interface, Ed. By Kerker, M.
Academic, New York, Vol. III, 1976, 403-419.
53. Lewis, A., Isaacson M., Harootunian, A. and Muray, A. Ultramicroscopy, 1984, 13,
227.
54. LePoutre, P. Prog. Org. Coatings, 1989, 17, 89.
55. Lekelä, M. “Optical properties”, In: Paper physics, Ed. Niskanen, K., Fapet Oy,
Helsinki, Finland, 2000.
56. Lieberman, K., Ben-Ami, N. and Lewis, A. Rev. Sci. Instrum. 1996, 67, 3567.
57. Ma, D., Carter, R.D., Chen, C. and Hardy, R.H. TAPPI Coating Conf. Proc. 2005,
TAPPI Press, CD, Session 27.
58. Ma, D., Carter, R. D., Laine, J. and Stenius, P. Nord. Pulp Paper Res. J. 2007, 22(4),
523-527.
59. Ma, D., Carter, R. D., Laine, J. and Stenius, P. Nord. Pulp Paper Res. J. 2008a, 23(3),
333-337.
60. Ma, D., Carter, R.D, Haefner, D. and Dogariu, A. Nord. Pulp Paper Res. J. 2008b 23(3), 327-331.
61. Ma, D., Carter, R.D, Haefner, D. and Dogariu, A. Nord. Pulp Paper Res. J. 2008c,
23(4), 438-443.
62. Ma, D., Carter, R.D and Bousfield, D. W. 10th TAPPI Coating Fundamental Symp,
2008, TAPPI Press, Atlanta, pp121-132.
63. Ma, D., Carter, R. D., Laine, J. and Stenius, P. Nord. Pulp Paper Res. J. 2009, 24(2),
to be published in June 2009.
64. Maheu, B., Letoulouzan, J. N. and Gouesesbet, G. Appl. Opt. 1984, 26, 3353.
71

65. McComb, T.L. and Sreickler, R.H. “Coloration of aqueous pigmented coatings”, In:
Paper coating additives, TAPPI press, Atlanta, 1995.
66. Marmur, A. J. Modern Approach to Wettability: Theory and Applications, Plenum
Press, New York, 1992, pp. 327-358.
67. Marmur, A. Langmuir, 1996, 12, 5704.
68. Marmur, A. Langmuir, 2004, 20, 1317.
69. McCoy, J.W. TAPPI Coating Conf. Proc. 1998, TAPPI Press, Atlanta, pp121-132.
70. Modaressi, H. and Garnier, G. Langmuir, 2002, 18, 642.
71. Moore, D.M. and Reynolds, R.C. X-Ray Diffraction and identification and analysis of
Clay Minerals, Oxford Univ. Press, New York, 1997.
72. Nieto-Verperinas, M. Scattering and diffraction in physical optics, Wiley, New York,
1991.
73. Olejnik, S., Posner, A.M. and Quirk, J.P. Clay Miner. 1970, 8, 421.
74. Owens, D. K. and Wendt, R. C. J. Appl. Polym. Sci. 1969, 13, 1741.
75. Paesler, M. A. and Moyer P. J. Near-Field Optics: Theory, Instrumentation, and
Applications, Wiley, New York, 1996.
76. Preston, J.S., Elton, N.J., Legrix, A., Nutbreem, C. and Husband, J.C. Tappi J. 2002,
1(3), 3.
77. Rissa, K., Lepisto, T., Vaha-Nissi, M., Lahti, J., and Savolainen A. Nord. Pulp Paper
Res. J., 2000, 15(5), 357.
78. Rame, E. and Garoff, S. J. Colloid Interface Sci. 1996, 177, 234.
79. Reichman, J. Appl. Opt. 1973, 12, 1811.
80. Rohringer, P. and Fletcher, I. TAPPI Coating Conf. Proc., 1996, TAPPI Press, pp239-
251.
72

81. Romagnoli, A. and Bousfield, D. W. Tappi J. 1999, 82(11), 135.
82. Rousu, S., Gane, P. and Eklund, D. Nord. Pulp Paper Res. J. 2000, 15(5), 527.
83. Rousu, S., Gane, P. and Eklund, D. Tappi J. 2005, 4(7), 9.
84. Schuster, A. Astrophys. J. 1905, 21, 1.
85. Tsang, L., Kong, J.A. and Ding, K.H. Scattering of electromagnetic waves: Numerical
simulations, Wiley- Interscience, New York, 2001.
86. Rye, R.R., Mann Jr., J.A. and Yost, F.G. Langmuir, 1996, 12(2), 555.
87. Scaife, J.J., Brake, J.M. and Abbott, N.L. Langmuir, 2001, 17, 5448.
88. Schmalenberg, K.E., Thompson, D.M., Buettner, H.M., Uhrich, K.E. and Garfias, L.F.
Langmuir, 2002, 18, 8593.
89. Schoelkopf, J., Ridgway, C.J., Gane, P.A.C., Matthews, G.P. and Spielmann, D.C. J.
Colloid Interface Sci., 2000, 227, 119.
90. Schoelkopf, J., Gane, P.A.C., Ridgway, C.J., Spielmann, D.C. and Matthews, G.P.
Tappi J. 2003a, 2(6), 9.
91. Schoelkopf, J., Gane, P.A.C., Ridgway, C.J., Spielmann, D.C. and Matthews, G.P.
Tappi J. 2003b, 2(7), 19.
92. Senden, T.J., Knackstedt, M.A. and Lyne M.B. Nord. Pulp Paper Res. J. 2000, 15(5),
554.
93. Shanahan,, M.E. Langmuir, 2001, 17, 8229.
94. Stange, M., Dreyer, M.E. and Rath, H.J. Phys. Fluids, 2003, 15(9), 2587.
95. Synge, E. Philos. Mag. 1928, 6, 356.
96. Tsibouklis, J., Dtone, M., Thorpe, A.A., Graham, P., Nevell, T.G. and Ewen, R.J.
Langmuir, 1999, 15, 7076.
73

97. Tunega, D., Haberhauer, C., Gerzabek M.H., and Lischka, H. Langmuir, 2002, 18,
139.
98. Van Gilder, R.L., Lee, D.I., Purfeerst, R. and Allswede, J. Tappi J. 1983, 66(11), 49.
99. Van Gilder, R.L. and Purfeerst, R.D. Tappi J. 1994, 77(5), 190.
100. Van Gilder, R.L. Tappi J. 2004, 3(1), 7.
101. van Oss, C.J., Chaudhury, M.K. and Good, R.J. Chem. Reviews, 1988, 88, 927.
102. van Oss, C.J., Giese, R.F., Li, Z., Murphy, K., Norris, J., Chaudhury, M.K. and
Good, R.J. J. Adhesion Sci. Technol. 1992, 6(4), 413.
103. van Oss, C.J. and Giese, R.F. Clay Clay Miner. 1995, 43(4), 474.
104. van Oss, C.J. Interfacial forces in aqueous media. 2nd ed. CRC Press, Boca Raton,
FL, USA, 2006.
105. Wada, K. Am. Miner. 1961, 46, 79.
106. Washburn, E.W. Phys. Rev. 1921, Ser. 2. 17(3), 273.
107. Webb, P.A. and Orr, C. Analytical Methods in Fine Particle Technology,
Micromeritics, Norcross, Georgia, USA, 1997.
108. Werner, O., Wågberg, L. and Lindström, T. Langmuir, 2005, (21) 12235.
109. Wu, S. Polymer interface and adhesion, Marcel Dekker, New York, USA, 1982.
110. Wu, W. Clay Clay Miner. 2001, 49(5), 446.
111. Xiang, Y., Bousfield, D.W., Hayes, P.C. and Kettle, J. J. Pulp and Paper Sci. 2004,
30(5), 117.
112. Yuan, Z., Schmidt, J., Heitner, C. and Zou, X. Tappi J. 2006, 5(1): 9.
113. Zhang, Y. and Sundararajan, S. Langmuir, 2007, 23, 8347.
114. Zhao, Y.P., Yang, H.-N., Wang, G.-C. and Lu, T.-M Appl. Phys. Lett. 1996, 68(22),
3063.
74

115. Zhmud, B.V., Tiberg, F. and Hallstensson, K. J. Colloid Interface Sci. 2000, 228,
263.
75
Recommended