1
NS-3 Advanced Tutorial: Visualization and Data Collection
Tom Henderson (University of Washington and
Boeing Research & Technology) L. Felipe Perrone (Bucknell University)
March 2013 NS-3 Consortium Meeting
March 2013
2
Outline
• Tracing and packet traces • Gnuplot and Matplotlib • Flow Monitor • PyViz • NetAnim • Statistics • Data Collection Framework
Getting visualization and raw data from ns-3
NS-3 Consortium Meeting March 2013
3
Tracing requirements
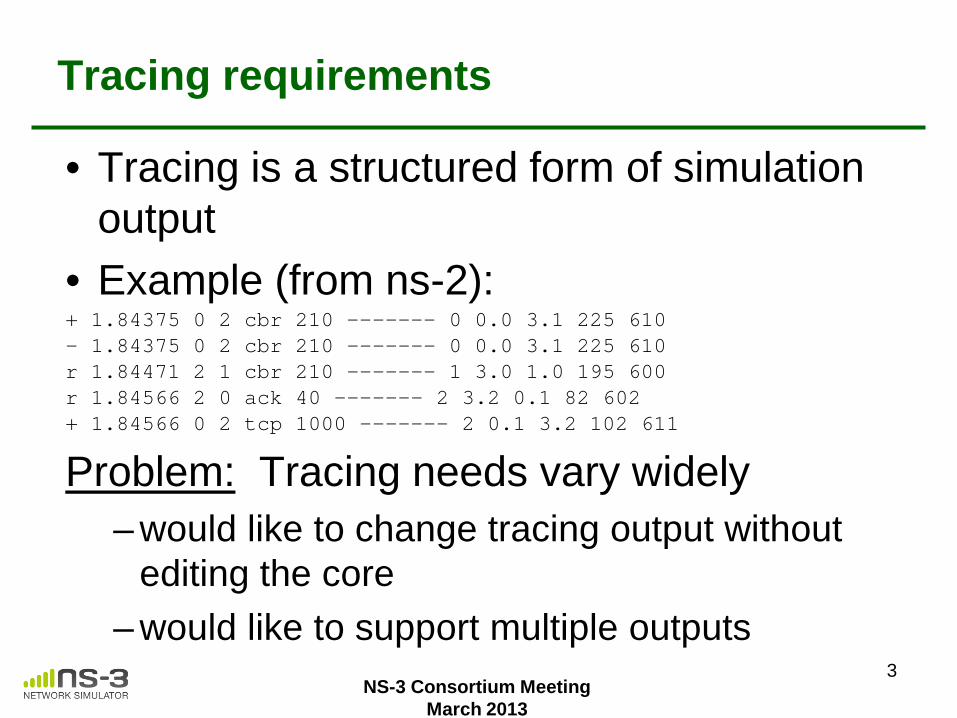
• Tracing is a structured form of simulation output
• Example (from ns-2): + 1.84375 0 2 cbr 210 ------- 0 0.0 3.1 225 610 - 1.84375 0 2 cbr 210 ------- 0 0.0 3.1 225 610 r 1.84471 2 1 cbr 210 ------- 1 3.0 1.0 195 600 r 1.84566 2 0 ack 40 ------- 2 3.2 0.1 82 602 + 1.84566 0 2 tcp 1000 ------- 2 0.1 3.2 102 611
Problem: Tracing needs vary widely – would like to change tracing output without
editing the core – would like to support multiple outputs
NS-3 Consortium Meeting March 2013
Tracing in ns-3
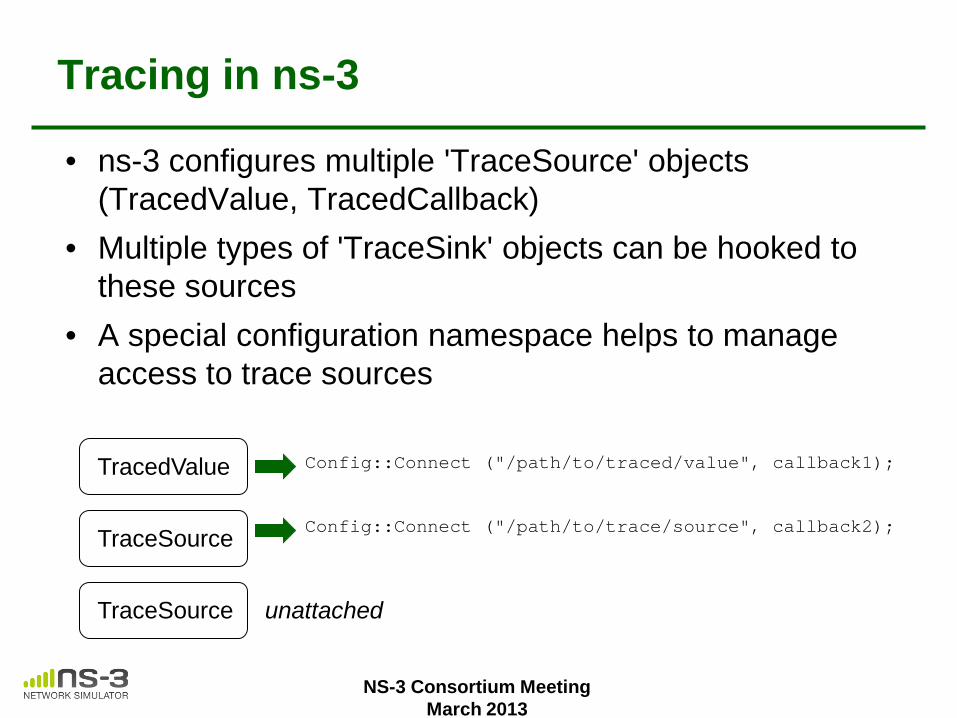
• ns-3 configures multiple 'TraceSource' objects (TracedValue, TracedCallback)
• Multiple types of 'TraceSink' objects can be hooked to these sources
• A special configuration namespace helps to manage access to trace sources
NS-3 Consortium Meeting March 2013
TraceSource
TracedValue
TraceSource
Config::Connect ("/path/to/traced/value", callback1);
Config::Connect ("/path/to/trace/source", callback2);
unattached
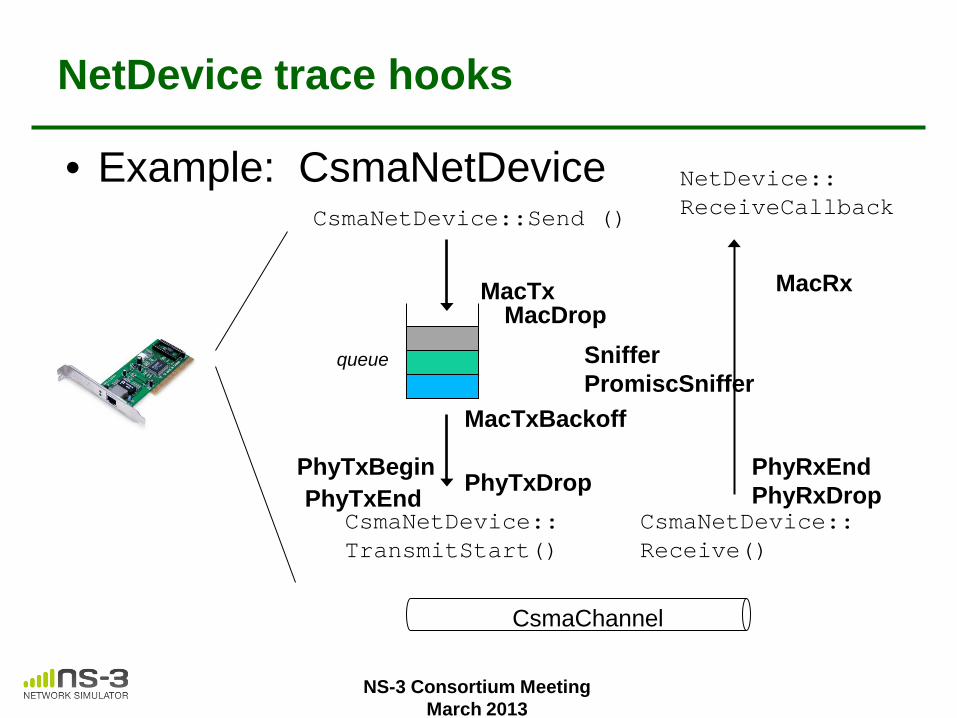
NetDevice trace hooks
• Example: CsmaNetDevice
NS-3 Consortium Meeting March 2013
CsmaNetDevice::Send ()
CsmaNetDevice:: TransmitStart()
CsmaNetDevice:: Receive()
CsmaChannel
NetDevice:: ReceiveCallback
queue
MacRx MacDrop
MacTx
MacTxBackoff
PhyTxBegin PhyTxEnd PhyTxDrop
Sniffer PromiscSniffer
PhyRxEnd PhyRxDrop
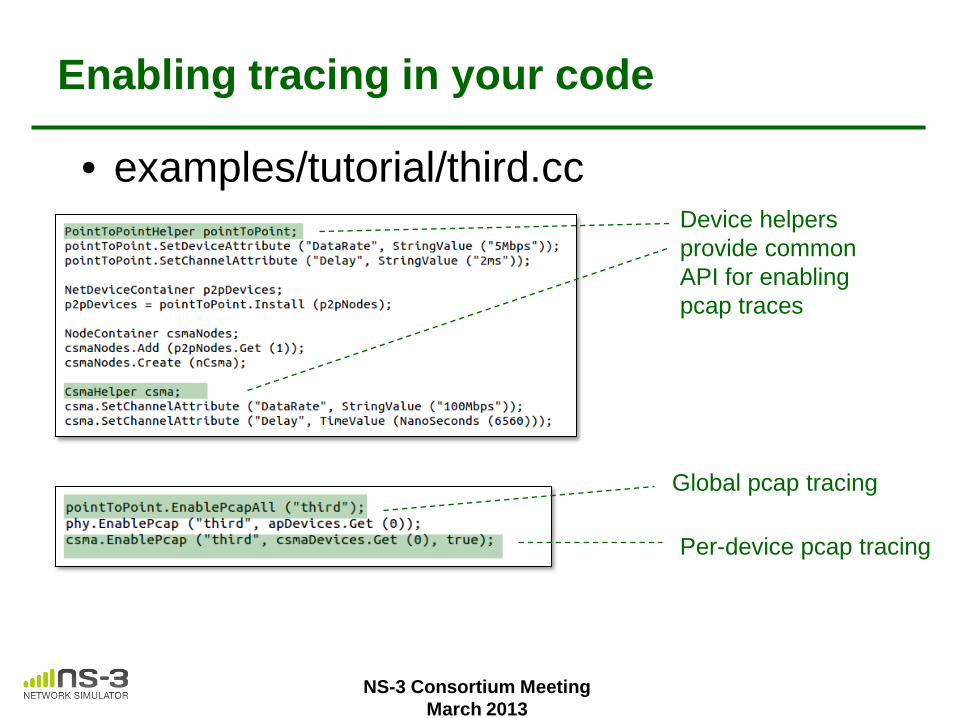
Enabling tracing in your code
• examples/tutorial/third.cc
NS-3 Consortium Meeting March 2013
Device helpers provide common API for enabling pcap traces
Global pcap tracing
Per-device pcap tracing
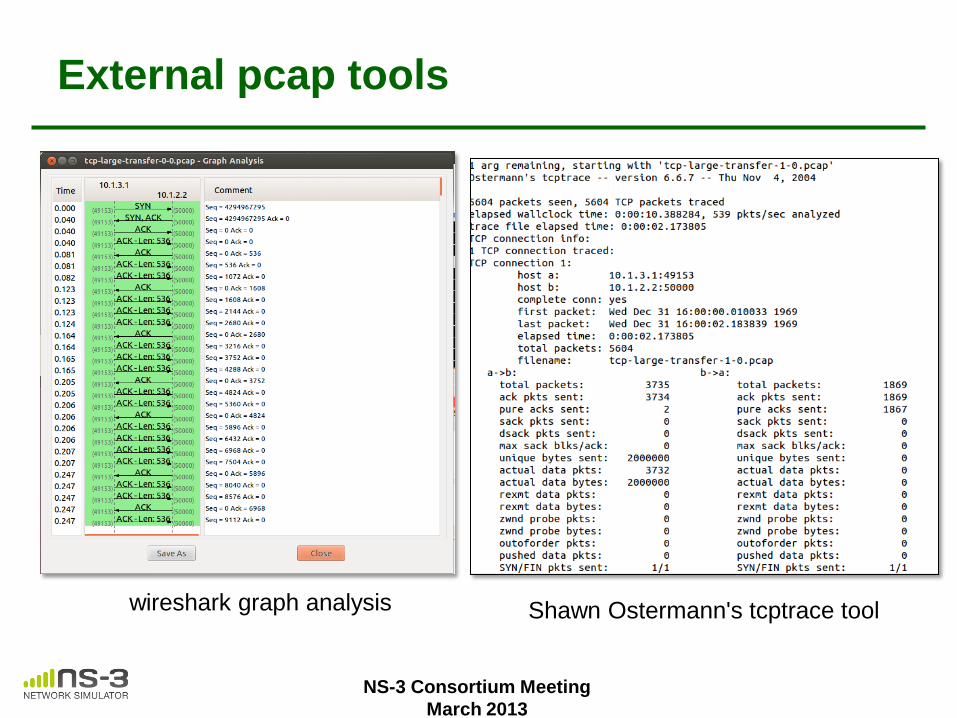
External pcap tools
NS-3 Consortium Meeting March 2013
wireshark graph analysis Shawn Ostermann's tcptrace tool
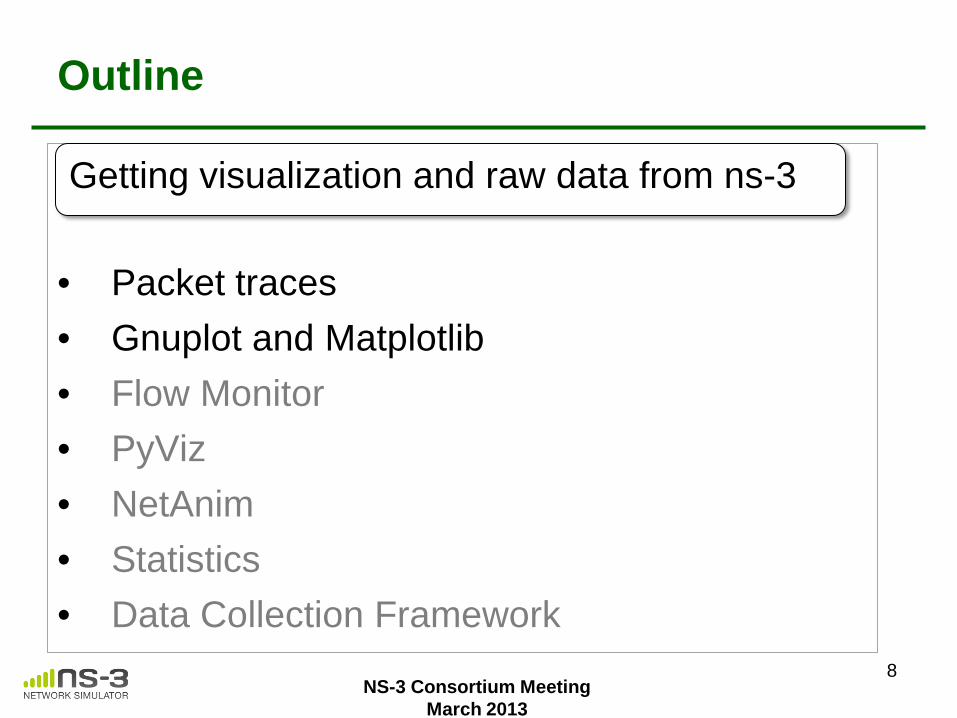
8
Outline
• Packet traces • Gnuplot and Matplotlib • Flow Monitor • PyViz • NetAnim • Statistics • Data Collection Framework
Getting visualization and raw data from ns-3
NS-3 Consortium Meeting March 2013
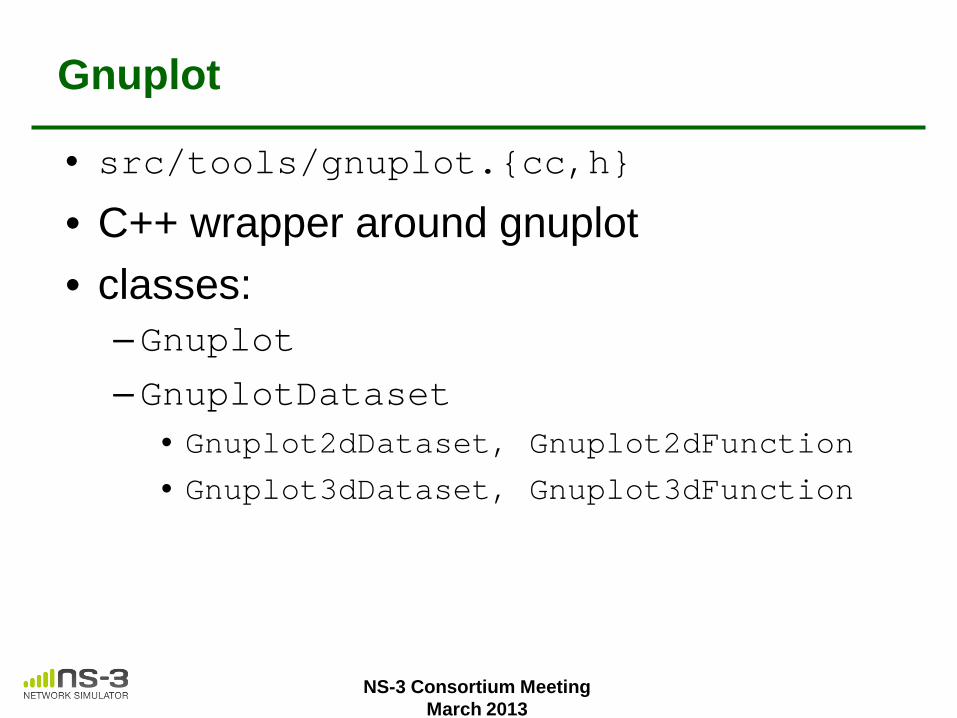
Gnuplot
• src/tools/gnuplot.{cc,h}
• C++ wrapper around gnuplot • classes:
–Gnuplot –GnuplotDataset
• Gnuplot2dDataset, Gnuplot2dFunction • Gnuplot3dDataset, Gnuplot3dFunction
NS-3 Consortium Meeting March 2013
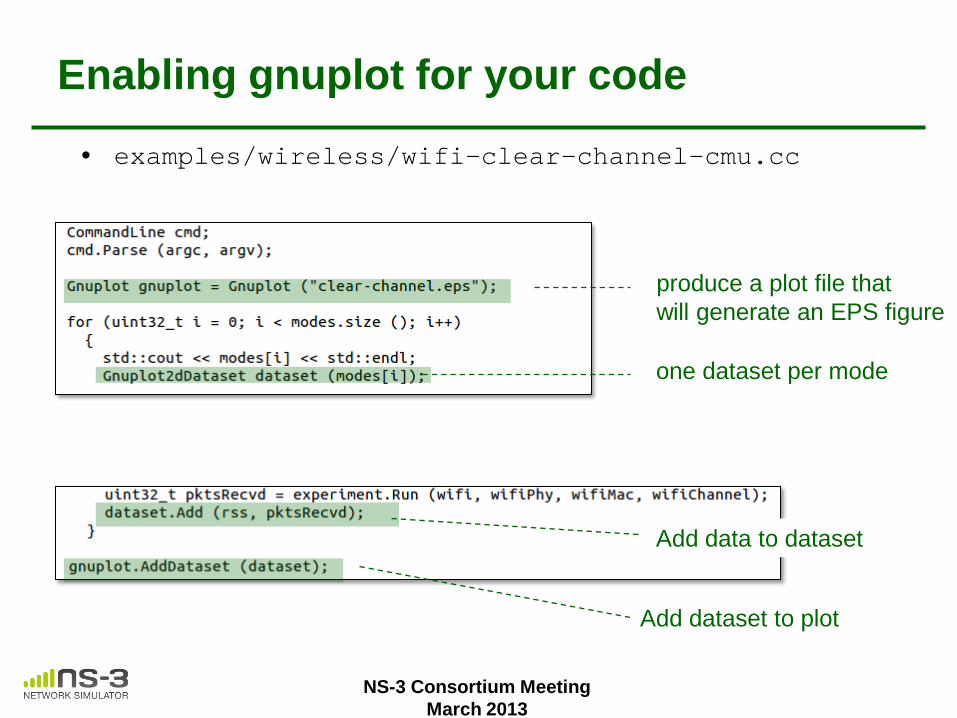
Enabling gnuplot for your code
• examples/wireless/wifi-clear-channel-cmu.cc
NS-3 Consortium Meeting March 2013
one dataset per mode
Add data to dataset
Add dataset to plot
produce a plot file that will generate an EPS figure
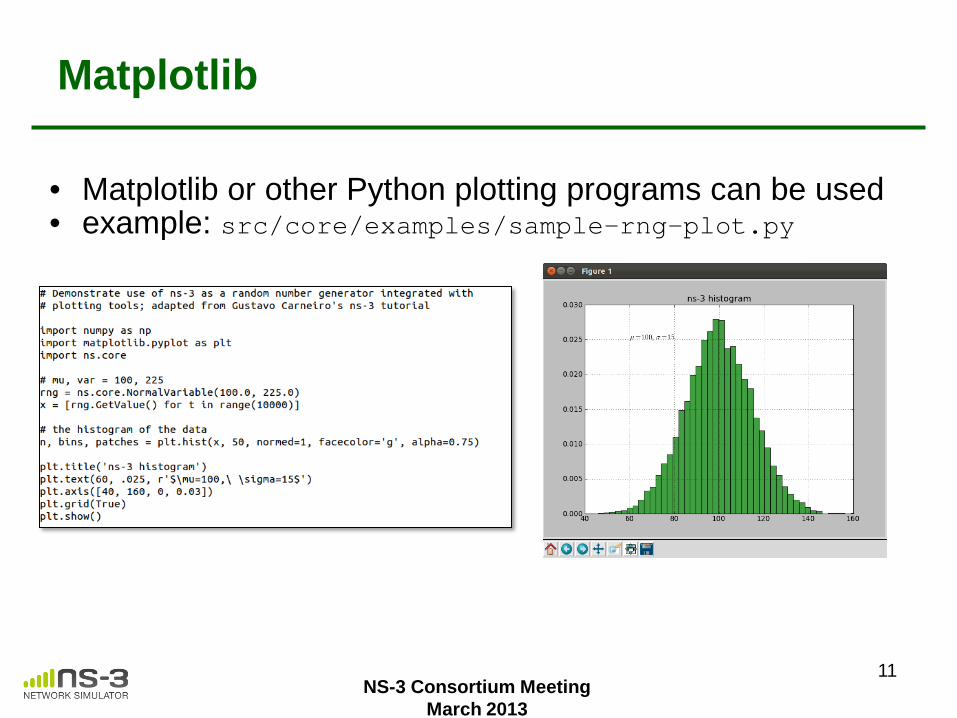
Matplotlib
• Matplotlib or other Python plotting programs can be used • example: src/core/examples/sample-rng-plot.py
NS-3 Consortium Meeting March 2013
11
12
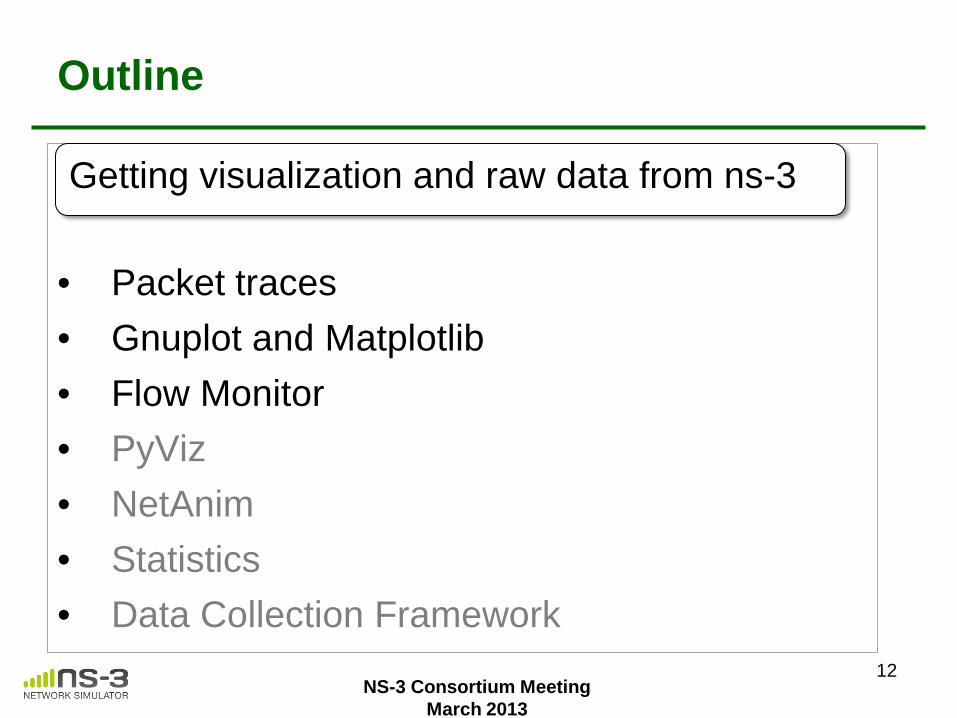
Outline
• Packet traces • Gnuplot and Matplotlib • Flow Monitor • PyViz • NetAnim • Statistics • Data Collection Framework
Getting visualization and raw data from ns-3
NS-3 Consortium Meeting March 2013
FlowMonitor
• Network monitoring framework found in src/flow-monitor/
• Goals: – detect all flows passing through network – stores metrics for analysis such as bitrates,
duration, delays, packet sizes, packet loss ratios
NS-3 Consortium Meeting March 2013
G. Carneiro, P. Fortuna, M. Ricardo, "FlowMonitor-- a network monitoring framework for the Network Simulator ns-3," Proceedings of NSTools 2009.
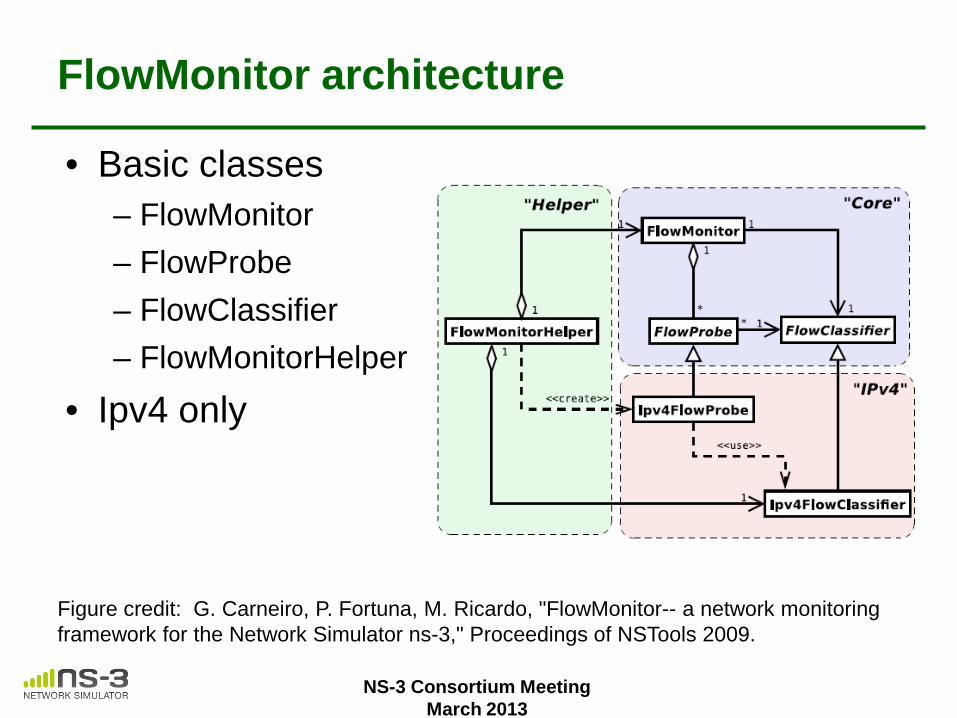
FlowMonitor architecture
• Basic classes – FlowMonitor – FlowProbe – FlowClassifier – FlowMonitorHelper
• Ipv4 only
NS-3 Consortium Meeting March 2013
Figure credit: G. Carneiro, P. Fortuna, M. Ricardo, "FlowMonitor-- a network monitoring framework for the Network Simulator ns-3," Proceedings of NSTools 2009.
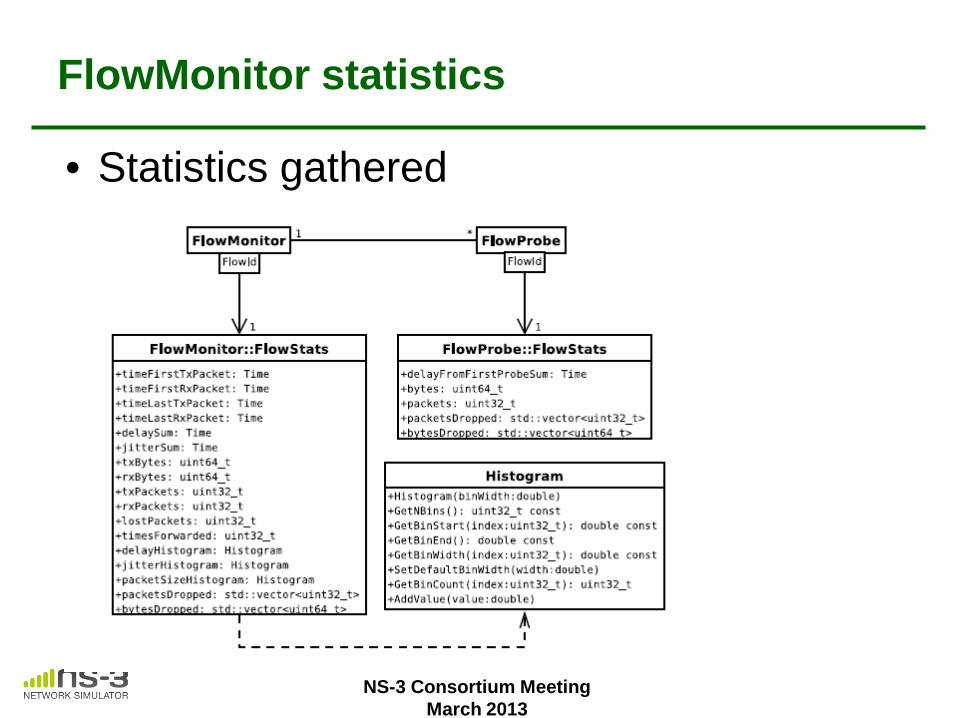
FlowMonitor statistics
• Statistics gathered
NS-3 Consortium Meeting March 2013
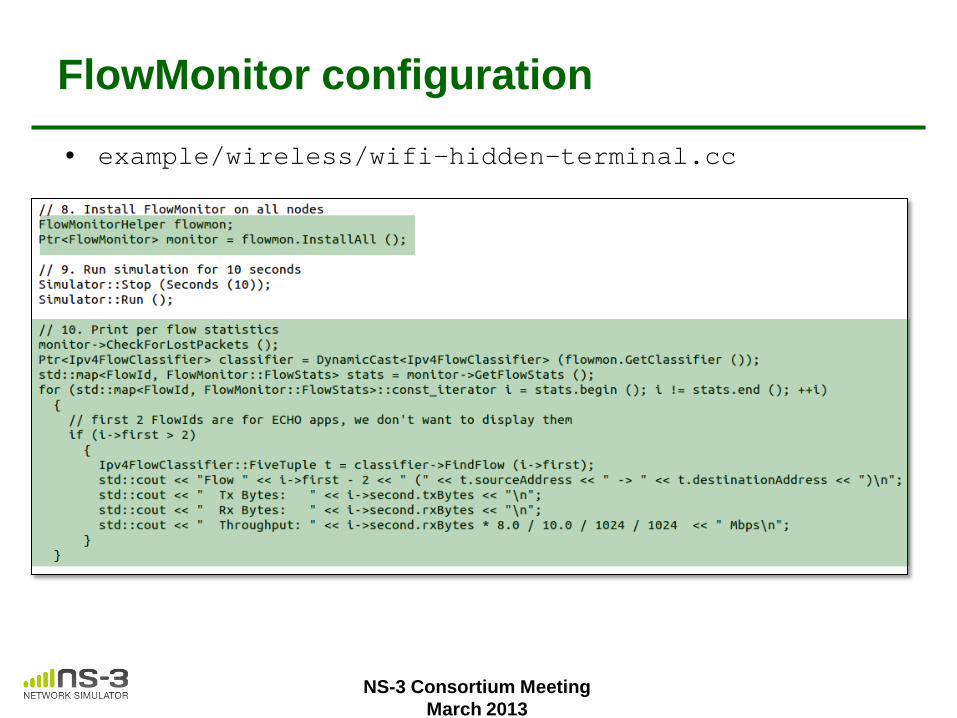
FlowMonitor configuration
NS-3 Consortium Meeting March 2013
• example/wireless/wifi-hidden-terminal.cc
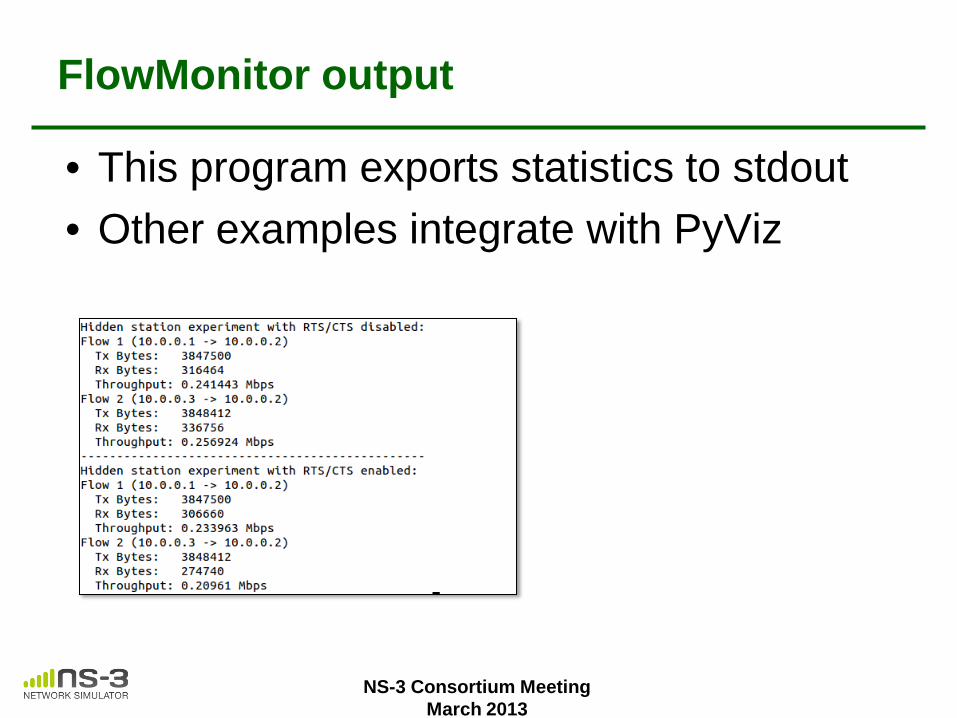
FlowMonitor output
• This program exports statistics to stdout • Other examples integrate with PyViz
NS-3 Consortium Meeting March 2013
18
Outline
• Packet traces • Gnuplot and Matplotlib • Flow Monitor • PyViz • NetAnim • Statistics • Data Collection Framework
Getting visualization and raw data from ns-3
NS-3 Consortium Meeting March 2013
PyViz overview
• Developed by Gustavo Carneiro • Live simulation visualizer (no trace files) • Useful for debugging
– mobility model behavior – where are packets being dropped?
• Built-in interactive Python console to debug the state of running objects
• Works with Python and C++ programs
NS-3 Consortium Meeting March 2013
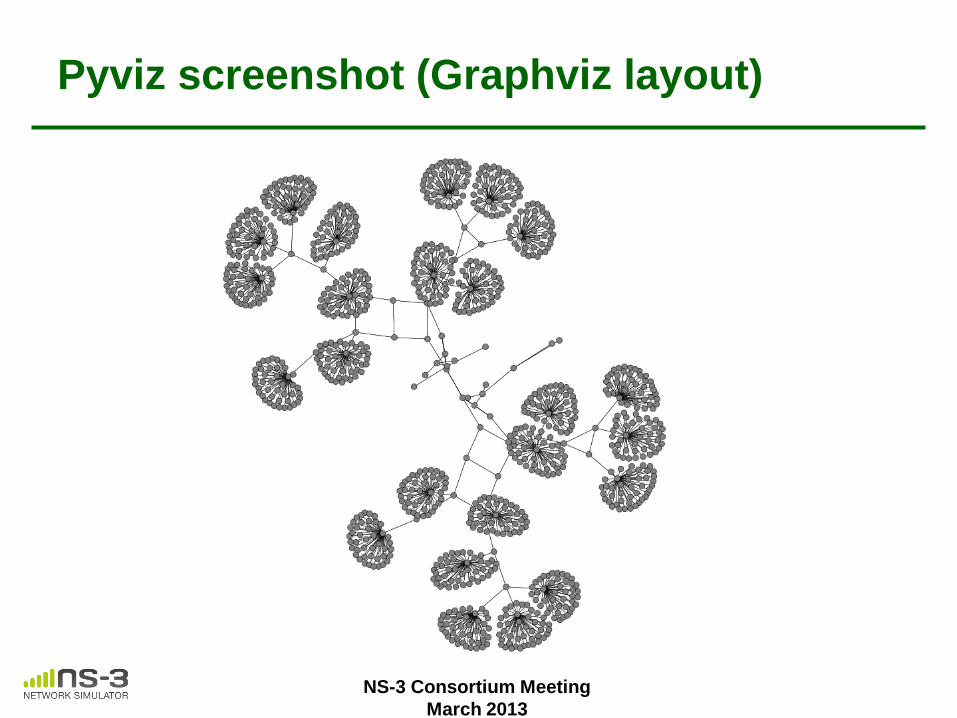
Pyviz screenshot (Graphviz layout)
NS-3 Consortium Meeting March 2013
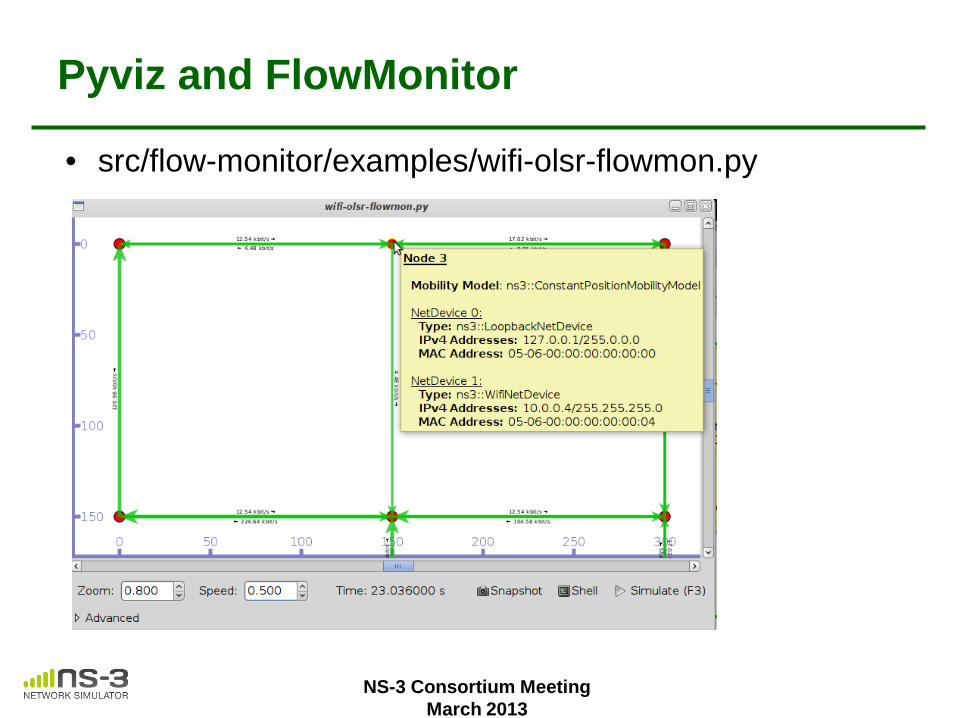
Pyviz and FlowMonitor
• src/flow-monitor/examples/wifi-olsr-flowmon.py
NS-3 Consortium Meeting March 2013

Enabling PyViz in your simulations
• Make sure PyViz is enabled in the build
• If program supports CommandLine parsing, pass the option --SimulatorImplementationType=
ns3::VisualSimulatorImpl
• Alternatively, pass the "--vis" option
NS-3 Consortium Meeting March 2013
23
Outline
• Packet traces • Gnuplot and Matplotlib • Flow Monitor • PyViz • NetAnim • Statistics • Data Collection Framework
Getting visualization and raw data from ns-3
NS-3 Consortium Meeting March 2013
NetAnim
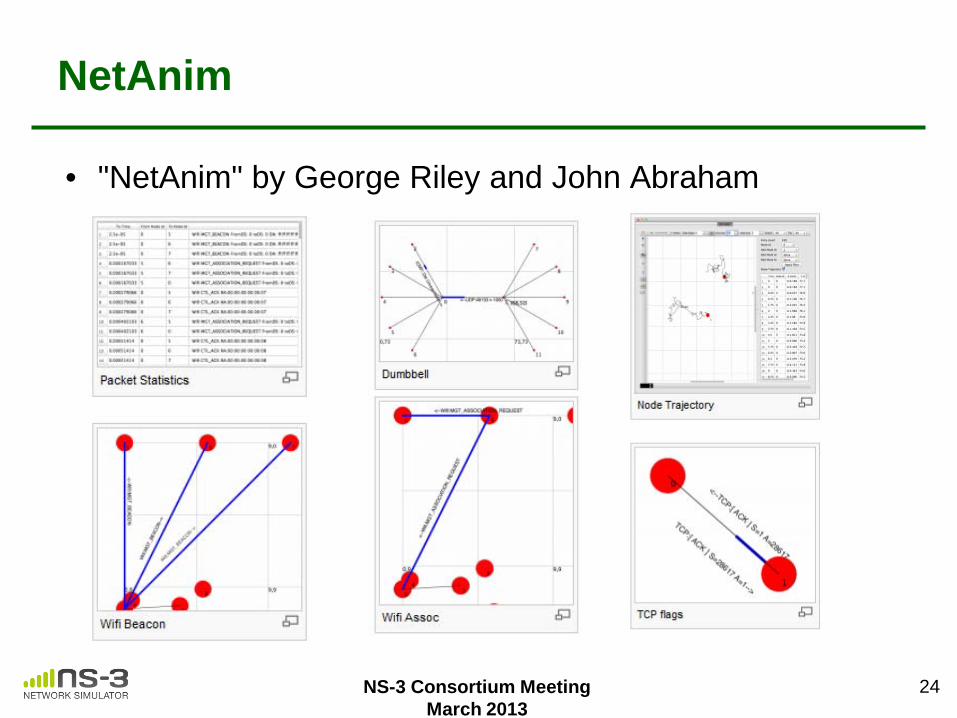
• "NetAnim" by George Riley and John Abraham
pyviz
24 NS-3 Consortium Meeting March 2013
NetAnim key features
• Animate packets over wired-links and wireless-links – limited support for LTE traces
• Packet timeline with regex filter on packet meta-data.
• Node position statistics with node trajectory plotting (path of a mobile node).
• Print brief packet-meta data on packets
NS-3 Consortium Meeting March 2013
NetAnim 3.104 overview
• Forthcoming release – More details in packet animation – Smoother mobility – Plotting the routing path from a source node to a
destination IP address – Print routing tables at various times – Flow monitor output parsing – Packet timelines – IP/MAC display – Change color during animation – Designer
NS-3 Consortium Meeting March 2013
27
Outline
• Packet traces • Gnuplot and Matplotlib • Flow Monitor • PyViz • NetAnim • Statistics • Data Collection Framework
Getting visualization and raw data from ns-3
NS-3 Consortium Meeting March 2013
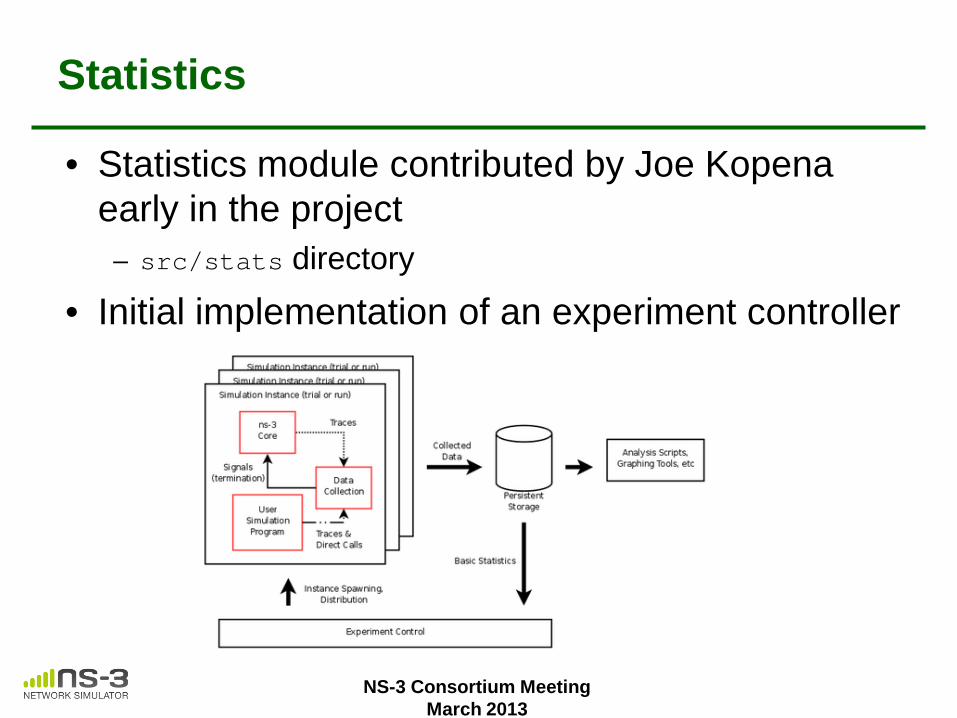
Statistics
• Statistics module contributed by Joe Kopena early in the project
– src/stats directory
• Initial implementation of an experiment controller
NS-3 Consortium Meeting March 2013
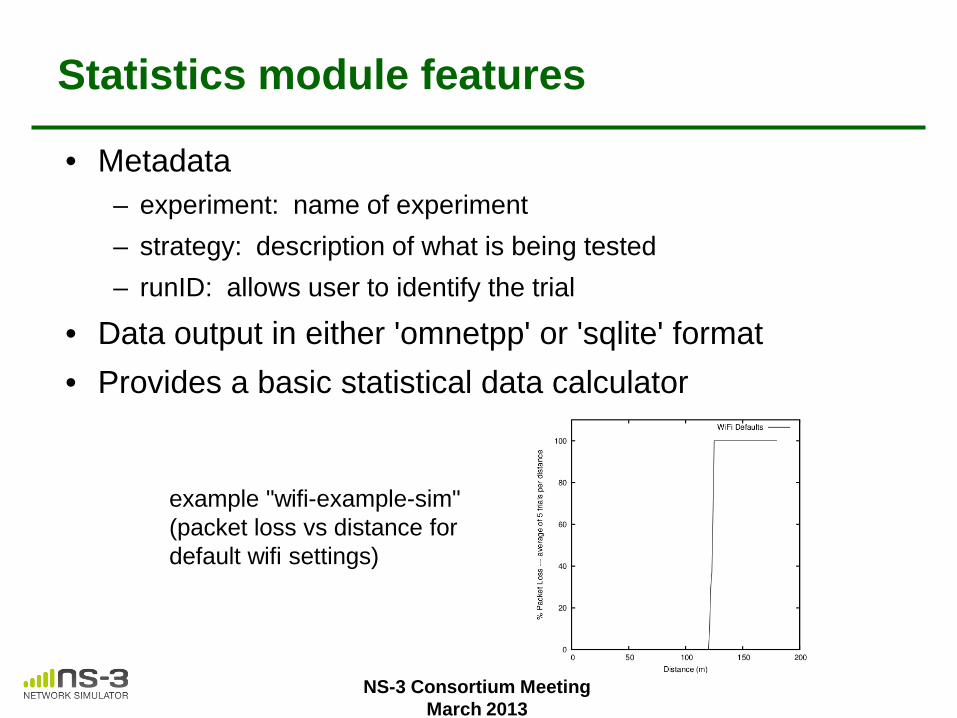
Statistics module features
• Metadata – experiment: name of experiment – strategy: description of what is being tested – runID: allows user to identify the trial
• Data output in either 'omnetpp' or 'sqlite' format • Provides a basic statistical data calculator
NS-3 Consortium Meeting March 2013
example "wifi-example-sim" (packet loss vs distance for default wifi settings)
30
Outline
• Packet traces • Gnuplot and Matplotlib • Flow Monitor • PyViz • NetAnim • Statistics • Data Collection Framework
Getting visualization and raw data from ns-3
NS-3 Consortium Meeting March 2013
Data Collection Framework
• under review for future ns-3 inclusion • part of the SAFE project development led
by Bucknell University – integrates with visualization module – integrates with steady-state detector
NS-3 Consortium Meeting March 2013
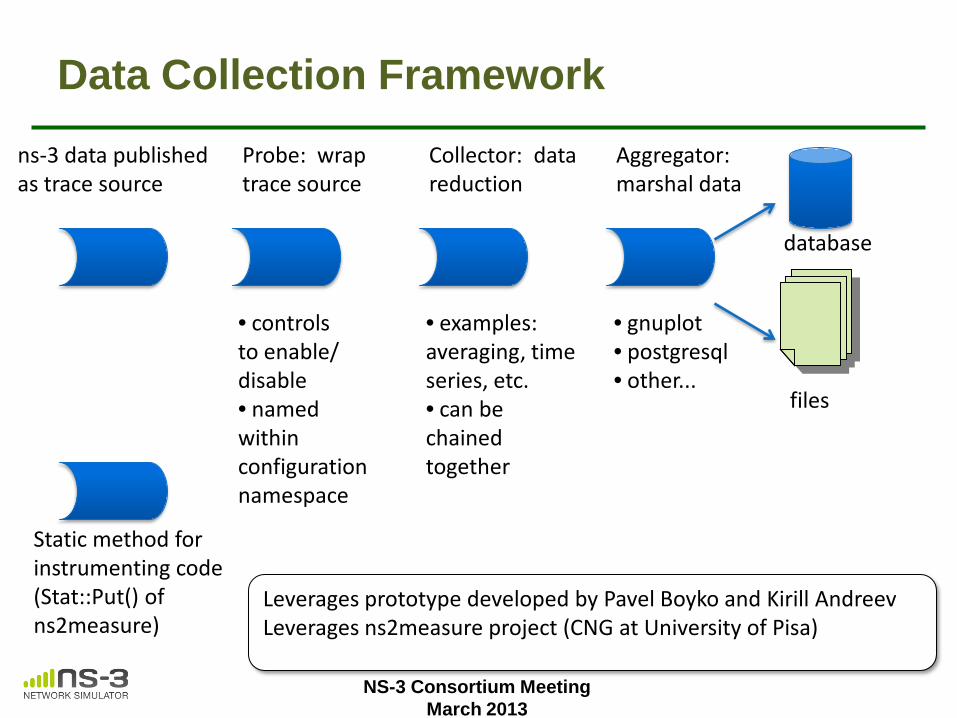
Data Collection Framework ns-3 data published as trace source
Probe: wrap trace source
Collector: data reduction
Aggregator: marshal data
• controls to enable/ disable • named within configuration namespace
database
files
• examples: averaging, time series, etc. • can be chained together
• gnuplot • postgresql • other...
Static method for instrumenting code (Stat::Put() of ns2measure)
Leverages prototype developed by Pavel Boyko and Kirill Andreev Leverages ns2measure project (CNG at University of Pisa)
NS-3 Consortium Meeting March 2013
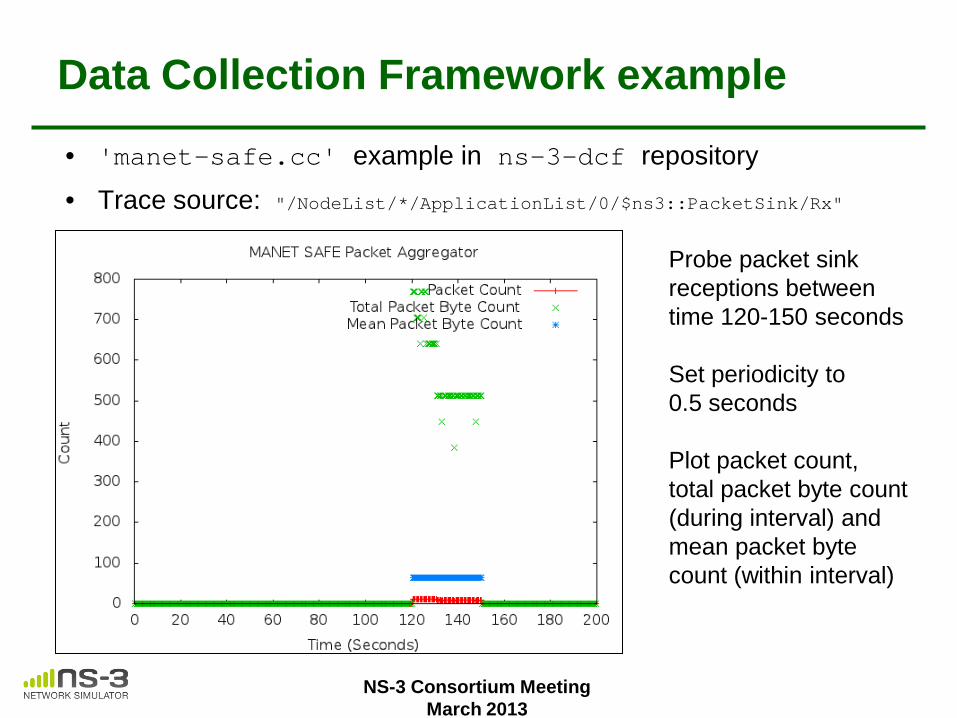
Data Collection Framework example
• 'manet-safe.cc' example in ns-3-dcf repository
• Trace source: "/NodeList/*/ApplicationList/0/$ns3::PacketSink/Rx"
NS-3 Consortium Meeting March 2013
Probe packet sink receptions between time 120-150 seconds Set periodicity to 0.5 seconds Plot packet count, total packet byte count (during interval) and mean packet byte count (within interval)
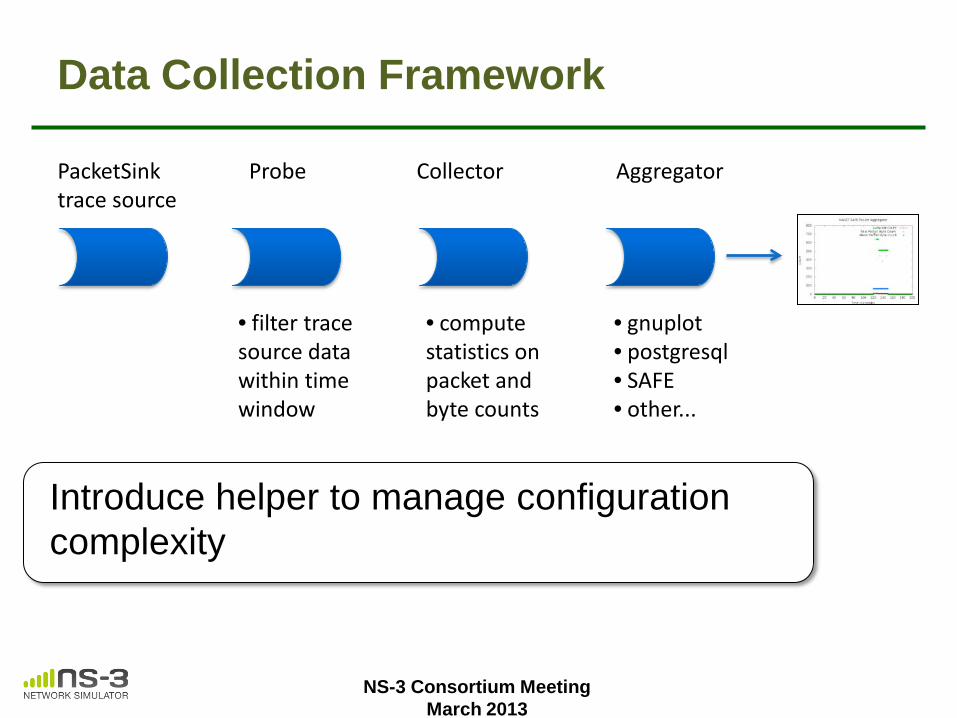
Data Collection Framework
PacketSink trace source
Probe Collector Aggregator
• filter trace source data within time window
• compute statistics on packet and byte counts
• gnuplot • postgresql • SAFE • other...
NS-3 Consortium Meeting March 2013
Introduce helper to manage configuration complexity
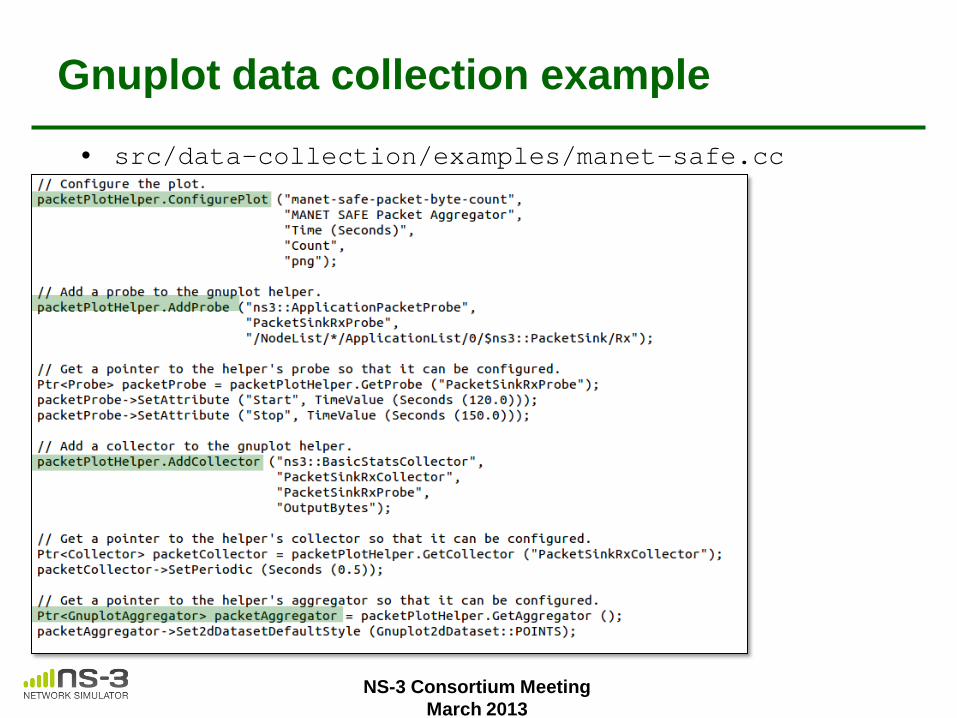
Gnuplot data collection example
• src/data-collection/examples/manet-safe.cc
NS-3 Consortium Meeting March 2013
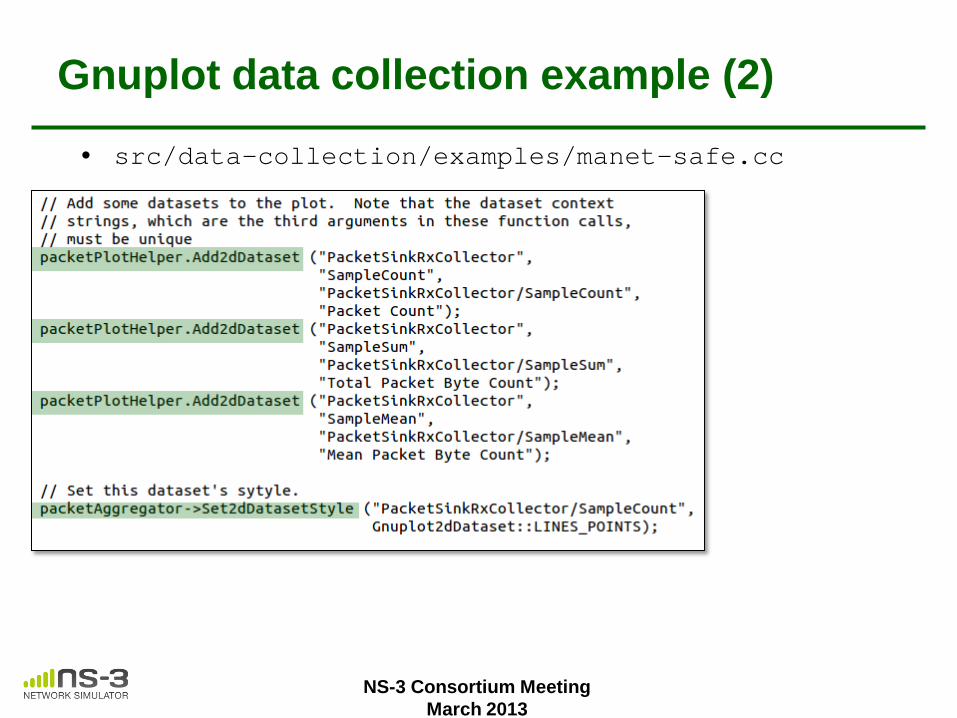
Gnuplot data collection example (2)
• src/data-collection/examples/manet-safe.cc
NS-3 Consortium Meeting March 2013
Under construction: steady-state collector
NS-3 Consortium Meeting March 2013
• Built upon steady-state detector classes • Receives samples • Applies steady-state detection algorithm • One pass-through trace source (all samples) • One filtered trace source (post-transient
sample) • MSER-5 and possibly other methods
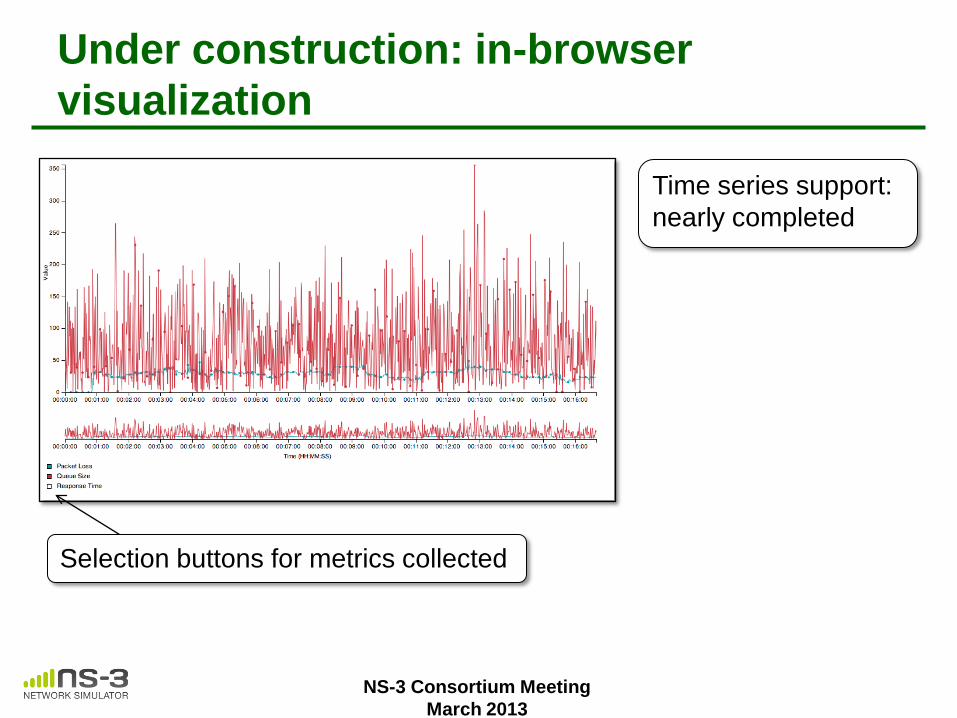
Under construction: in-browser visualization
NS-3 Consortium Meeting March 2013
Selection buttons for metrics collected
Time series support: nearly completed
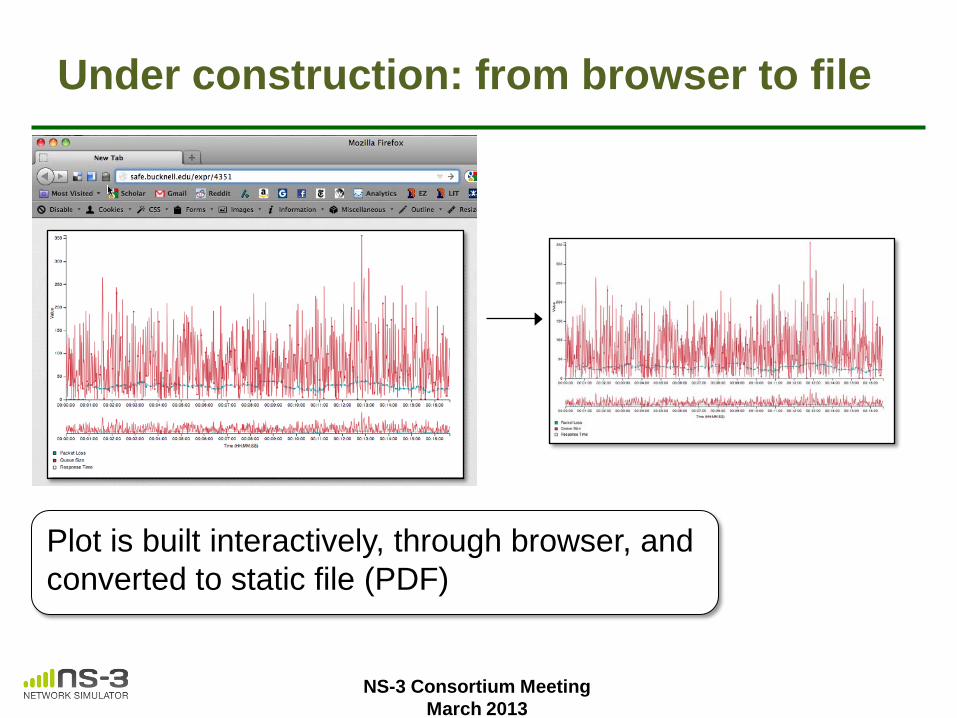
Under construction: from browser to file
NS-3 Consortium Meeting March 2013
Plot is built interactively, through browser, and converted to static file (PDF)
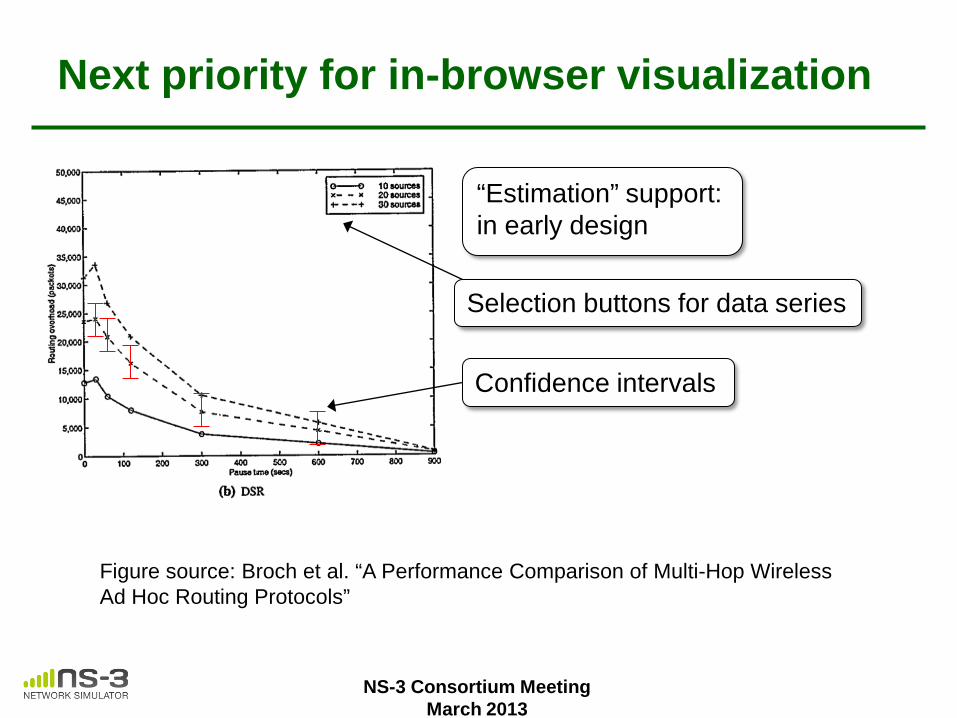
Next priority for in-browser visualization
NS-3 Consortium Meeting March 2013
Selection buttons for data series
“Estimation” support: in early design
Confidence intervals
Figure source: Broch et al. “A Performance Comparison of Multi-Hop Wireless Ad Hoc Routing Protocols”
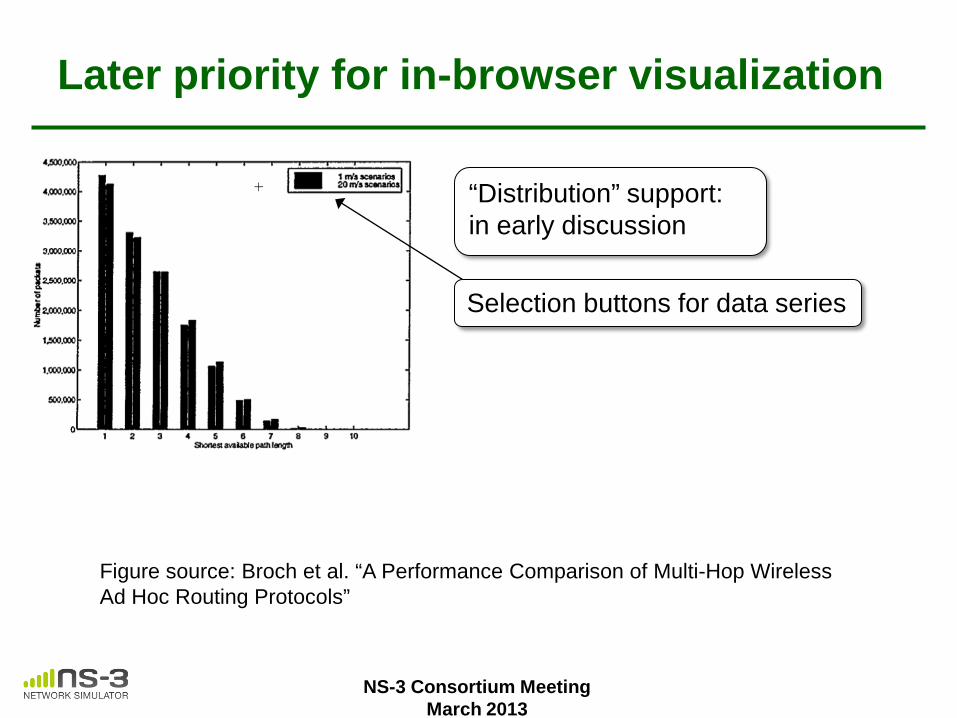
Later priority for in-browser visualization
NS-3 Consortium Meeting March 2013
Selection buttons for data series
“Distribution” support: in early discussion
Figure source: Broch et al. “A Performance Comparison of Multi-Hop Wireless Ad Hoc Routing Protocols”
Recommended