Numerical Simulation of Heat
Transfer by Natural Convection in
Horizontal Finned Channels Gabriel Gonçalves da Silva Ferreira, Luiz Fernando Lopes Rodrigues Silva
Escola de Química, UFRJ
Paulo L. C. Lage (*), Fábio Pereira dos Santos
Laboratório de Termofluidodinâmica,
Programa de Engenharia Química, COPPE/UFRJ
1) Company Overview
LTFD research lines:
- Theoretical modeling and experimental measurements in
multiphase flows
- CFD simulation of multiphase flows and applied CFD
(ANSYS CFX, FLUENT, OpenFOAM)
- Population balance
- Numerical Methods
- Parallel Computing
Infrastructure:
Clusters: 128 core Opteron 2356 based cluster (almost 1
TeraFLOPs) and a beowulf cluster based on Intel Q6600

2) Problem Description
2.1) Mixed Convection
Heat transfer mechanisms: conduction, convection, radiation
Two limiting types in convection:
Forced Convection: flow patterns are determined by external forces.
Free Convection (Natural Convection): flow patterns are determined by
buoyant forces in the heated fluid.
In general:
Mixed convection – both effects must be taken account.

2) Problem Description
2.2) Fins
Maximization of heat transfer hate.
Under Natural/Mixed convection regimes in channel flows:
- hconv is low.
- hconv is easily modified with changes in fin geometry.
Optimum geometry design:
- Experimental investigation.
- CFD simulations (need to validate the models!)
2.3) Objective
Develop and validate a model for natural and mixed convection in a
horizontal finned channel.

3) Methodology
Comparison of experimental results obtained by Dogan & Sivrioglu1 with
CFD results.
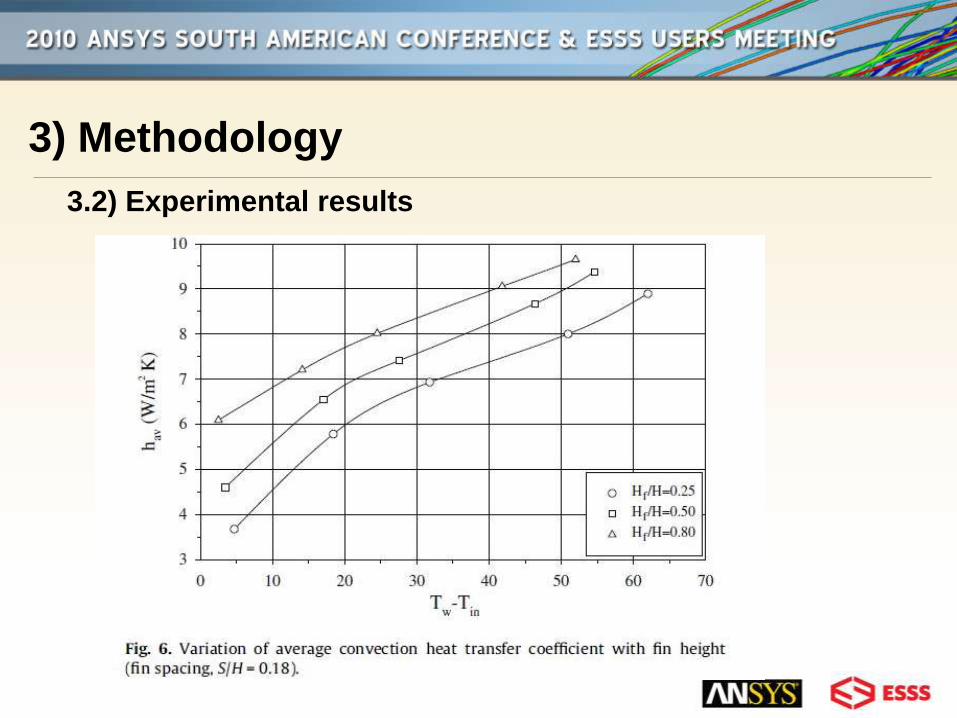
Experiments measured the effect of size and spacing of fins in hconv for
different Tbase values.
Software ANSYS 12.1 for CFD simulations:
Design Modeler for geometry.
ICEM CFD for hexahedral meshes.
1 M. Dogan, M. Sivrioglu,Experimental investigation of mixed convection heat
transfer from longitudinal fins in a horizontal rectangular channel: In natural
convection dominated flow regimes, Energy Conversion and Management 50
(2009) 2513-2521.

3) Methodology
3.1) Experimental setup
3) Methodology
3.2) Experimental results

3) Methodology
3.3) Experimental analysis
Experimental conditions
Longitudinal aluminum fins with rectangular section
Air velocity at the channel inlet: v = 0,02 - 0,025 m/s (Re = 250) at
ambient conditions, but controlled by valve near the outlet

3) Methodology
3.4) Geometrical Modelling of Fin-array set 8
Geometry 2 (entire channel):

3) Methodology
3.4) Geometrical Modelling of Fin-array set 8
Isometric view of geometry 1

3) Methodology
3.5) Numerical Model
Transient 3D analysis
Equations:
Continuity
Momentum
Thermal energy
Turbulence Model (SST)
Equation of State (Ideal Gas)
Empirical Correlations for k, Cp and μ for air at
atmospheric pressure based on experimental data on the
range: 250 K < T < 400 K
3) Methodology
3.5) Numerical Model – boundary conditions
- Fins efficiency > 99% (estimative based on the
experimental results): constant Tbase for fin surfaces
- Boundary conditions:
Heated and fin surfaces: No-slip, T specified (53 C)
Other walls: No-slip, adiabatic.

3) Methodology
3.5) Numerical Model – boundary conditions
Inlet and outlet boundary conditions for cases 1 and 2:
Case Geometry B.C. inlet B.C. outlet
1 1 Opening - entrainment
T = 25 oC
Relative Pressure = 0 Pa
Opening - entrainment
T = mean temperature
of exiting fluid
Relative Pressure = 0
Pa
2 2 Opening – entrainment
T = 25 oC
Relative Pressure = 0 Pa
Mass flow rate
corresponding to
v = 0,025 m/s

4) Meshes for geometric modeling
Three separated meshes to test geometric modeling:
Mesh 1 – rectangular channel
836.224 nodes
775.986 elements (100% hexaedra)
Mesh 2 – nozzle
44.664 nodes
40.500 elements (100% hexaedra)
Mesh 3 – chamber+valve
264.516 nodes
253.028 elements (100% hexaedra)

4) Meshes for geometric modeling
Side view of mesh 1:

4) Meshes for geometric modeling
Isometric view of mesh 2:
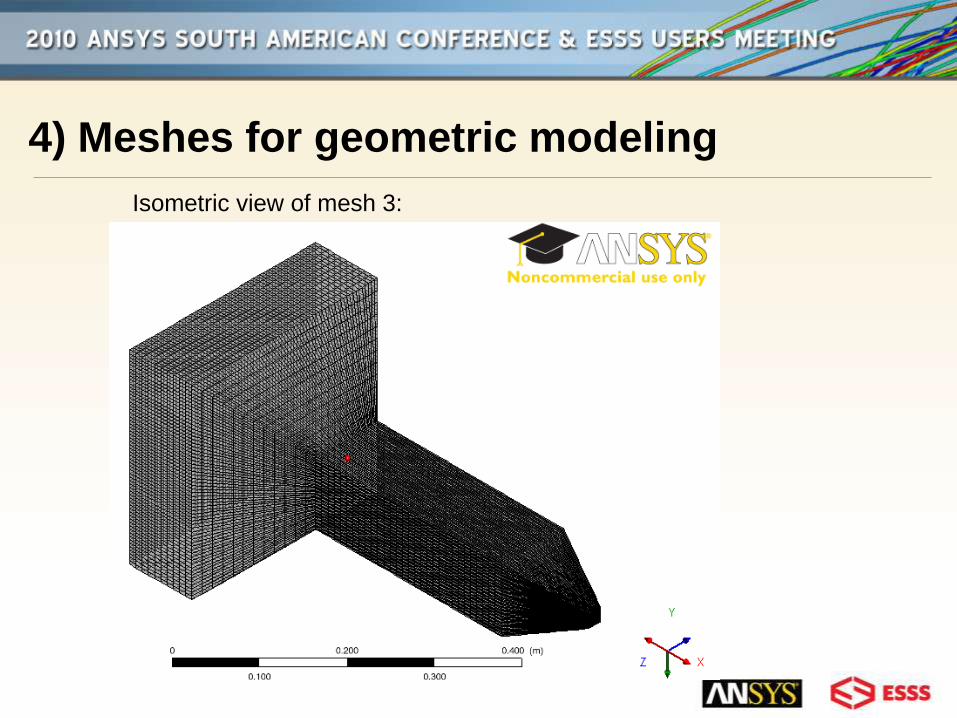
4) Meshes for geometric modeling
Isometric view of mesh 3:

5) Preliminary Results
Heat transfer rate for cases 1 and 2:
Case B.C. inlet B.C. Outlet Q [W]
1 Opening - entrainment
T = 25 oC
Relative Pressure = 0
Pa
Opening - entrainment
T = mean temperature of
exiting fluid
Relative Pressure = 0 Pa
20,6
2 Opening – entrainment
T = 25 oC
Relative Pressure = 0
Pa
Mass flow rate corresponding
to
v = 0,025 m/s
45,4
Experimental 37,3

5) Preliminary ResultsComparison between cases 1 and 2 vector plots at the
channel outlet:

5) Preliminary Results
Case 2 streamlines: Fresh air reaches only first half of the
finned section!

6) Conclusions and next steps
The larger error of case 1 (44,8%) compared to case 2 (21,6%) and the
behavior of the flow at the outlet show that the geometric modeling used
in case 1 is not a good approximation. Some geometries can’t be
simplified for natural convection.
The experimental mass flow rate is given by the article as mean velocity
at the channel inlet but with a large error margin (0,02-0,025 m/s with
and error of 0.015 m/s ). Present simulations were made with the mass
flow rate corresponding to the higher velocity value. Smaller values could
give results closer to the experimental one.
Next steps:
- Use mass flow rate corresponding to the lower velocity case.
- Run case 2 with a more refined mesh.
Recommended