OCCLUSAL BITE FORCE CHANGES DURING FIXED
ORTHODONTIC TREATMENT IN DIFFERENT
VERTICAL FACIAL MORPHOLOGY
Dissertation Submitted to
THE TAMIL NADU DR. M.G.R. MEDICAL UNIVERSITY
In Partial Fulfilment for the Degree of
MASTER OF DENTAL SURGERY
BRANCH – V
ORTHODONTICS AND DENTOFACIAL ORTHOPAEDICS
THE TAMILNADU DR. M.G.R. MEDICAL UNIVERSITY
CHENNAI – 600032
2014-2017
CERTIFICATE
This is to certify that Dr. A. PREMA, Post graduate student (2014-2017) in
the department of Orthodontics and Dentofacial Orthopaedics, Tamil Nadu
Govt. Dental College and Hospital, Chennai- 600 003, has done this
dissertation entitled “OCCLUSAL BITE FORCE CHANGES DURING
FIXED ORTHODONTIC TREATMENT IN DIFFERENT VERTICAL
FACIAL MORPHOLOGY” under my direct guidance and supervision for the
partial fulfilment of M.D.S. Orthodontics and Dentofacial Orthopaedics
(Branch V) degree examination (April, 2017) as per regulation laid down by
Tamil Nadu Dr. M.G.R. Medical University Chennai-600 032 .
Guided By
Dr. G. VIMALA M.D.S.,
Professor and Head of the Department,
Dept. of Orthodontics and Dentofacial Orthopaedics,
Tamil Nadu Govt. Dental College
& Hospital, Chennai-600 003.
Dr. B. SARAVANAN, M.D.S., Ph. D
Principal,
Tamil Nadu Govt. Dental College & Hospital,
Chennai-600 003.
DECLARATION
I, DR. A. PREMA, do hereby declare that the dissertation titled
“OCCLUSAL BITE FORCE CHANGES DURING FIXED ORTHODONTIC
TREATMENT IN DIFFERENT VERTICAL FACIAL MORPHOLOGY”
was done in the Department of Orthodontics and Dentofacial Orthopaedics,
Tamil Nadu Government Dental College & Hospital, Chennai 600 003. I have
utilized the facilities provided in the Government Dental College for the study
in partial fulfilment of the requirements for the degree of Master of Dental
Surgery in the speciality of Orthodontics and Dentofacial Orthopaedics
(Branch V) during the course period 2014-2017 under the conceptualization
and guidance of my dissertation guide, PROFESSOR & H.O.D., DR. G.
VIMALA, M.D.S.
I declare that no part of the dissertation will be utilized for gaining
financial assistance for research or other promotions without obtaining prior
permission from the Tamil Nadu Government Dental College & Hospital.
I also declare that no part of this work will be published either in the
print or electronic media except with those who have been actively involved in
this dissertation work and I firmly affirm that the right to preserve or publish
this work rests solely with the prior permission of the Principal, Tamil Nadu
Government Dental College & Hospital, Chennai 600 003, but with the vested
right that I shall be cited as the author(s).
Signature of the PG student
ACKNOWLEDGMENT
My sincere thanks to Dr. B. SARAVANAN, M.D.S., Ph.D.,
Principal, Tamil Nadu Government Dental College and Hospital, Chennai-
600 003, for his kind support and encouragement.
I express my deep sense of gratitude and great honour to my respected
guide, Professor Dr. G. VIMALA M.D.S., Head of the Department,
Department of Orthodontics and Dentofacial orthopaedics, Tamilnadu Govt.
Dental College and Hospital, Chennai-3, for her astute guidance, support and
encouragement throughout the study and the entire post graduate course.
I owe my thanks and great honour to my respected professor,
Dr. SRIDHAR PREMKUMAR M.D.S, Department of Orthodontics and
Dentofacial Orthopaedics, Tamilnadu Govt. Dental College and Hospital,
Chennai-3, for helping me with his valuable and timely suggestions and
constant encouragement.
I owe my thanks and great honour to my respected professor,
Dr. B. BALASHANMUGAM M.D.S, Department of Orthodontics and
Dentofacial Orthopaedics, Tamilnadu Govt. Dental College and Hospital,
Chennai-3, for his valuable support and encouragement.
I am grateful to Dr. USHA RAO, M.D.S., Associate Professors,
Department of Orthodontics and Dentofacial Orthopaedics, Tamil Nadu
Government Dental College and Hospital, Chennai –3 for her support and
encouragement.
I am grateful to Associate Professors Dr. M.D. SOFITHA, M.D.S.,
Dr. M. VIJAYAKANTH M.D.S., and senior Assistant Professors Dr. M.S.
JAYANTHI M.D.S., Dr. D. NAGARAJAN M.D.S., Dr. MOHAMMED
IQBAL M.D.S., Dr. R. SELVARANI M.D.S., Dr. K. USHA, M.D.S.,
Department of Orthodontics and Dentofacial Orthopaedics, Tamilnadu
Government Dental College and Hospital, Chennai-3 for their support and
encouragement.
I take this opportunity to express my gratitude to my husband
Mr. M. ANBARASU M.Sc., M. Phil. for his valuable help and suggestions
in designing the bite force device and also helping me with the Statistics in the
study.
I offer my heartiest gratitude to my father P. ARASU and my mother
A. SUNDARI for their selfless blessings and prayers.
I seek the blessings of the Almighty God without whose benevolence;
the study would not have been possible.
TRIPARTITE AGREEMENT
This agreement herein after the “agreement”I entered into on this ---day of
December 2016 between the Tamil Nadu Government Dental College and
Hospital represented by its Principal having address at Tamil nadu
Government Dental College and Hospital, Chennai-03, (hereafter referred to
as, “the college”)
And
Dr. G. Vimala aged 48 years working as Head & Professor at the college,
having residence at AP 115, 5th Street, AF Block, 11
th main road, Anna Nagar,
Chennai 600040, Tamil Nadu (Herein after referred to as the „Principal
investigator‟)
And
Dr. A. Prema aged 31 years currently studying as postgraduate student in
Department of Orthodontics in Tamil Nadu Government Dental College and
Hospital (Herein after referred to as the “PG/Research student and co-
investigator”)
Whereas the, PG/Research student as part of his curriculum undertakes to
research “Occlusal bite force changes during fixed orthodontuic treatment in
different vertical facial morphology” for which purpose the PG/Principal
investigator shall act as Principal investigator and the college shall provide the
requisite infrastructure based on availability and also provide facility to the
PG/Research student as to the extent possible as a Co-investigator.
Whereas the parties, by this agreement have mutually agreed to the various
issues including in particular the copyright and confidentiality issues that arise
in this regard.
Now this agreement witnesseth as follows:
1. The parties agree that all the Research material and ownership therein shall
become the vested right of the college, including in particular all the copyright
in the literature including the study, research and all other related papers.
2. To the extent that the college has legal right to do go, shall grant to license or
assign the copyright do vested with it for medical and/or commercial usage of
interested persons/entities subject to a reasonable terms/conditions including
royalty as deemed by the college.
3. The royalty so received by te college shall be shared equally by all the parties.
4. The PG/Research student and th PG/Principal investigator shall under no
circumstances deal with the copyright, Confidential information and know-
how generated during the course of research/study in any manner whatsoever,
while shall sole west with the college.
5. The PG student and Principal Investigator undertake not to divulge (or) cause
to be divulged any of the confidential information or, know-how to anyone in
any manner whatsoever and for any purpose without the express written
consent of the college.
6. All expenses pertaining to the research shall be decided upon by the Principal
Investigator/Co-investigator or borne sole by the PG student.(co-investigator)
7. The college shall provide all infrastructure and access facilities within and in
other institutes to the extent possible. This includes patient interactions,
introductory letters, recommendation letters and such other acts required in
this regard.
8. The Principal Investigator shall suitably guide the Student Research right from
selection of the Research Topic and Area till its completion. However the
selection and conduct of research, topic and area of research by the student
researcher under guidance from the Principal Investigator shall be subject to
the prior approval, recommendations and comments of the Ethical Committee
of the College constituted for this purpose.
9. It is agreed that as regards other aspects not covered under this agreement, but
which pertain to the research undertaken by the PG student, under guidance
from the Principal Investigator, the decision of the college shall be binding
and final.
10. If any dispute arises as to the matters related or connected to this agreement
herein, it shall be referred to arbitration in accordance with the provisions of
the Arbitration and Conciliation Act, 1996.
11. In witness whereof the parties hereinabove mentioned have on this the day
month and year herein above mentioned set their hands to this agreement in
the presence of the following two witnesses.
College represented by its
Principal PG Student
Witnesses
1. Student Guide
2.
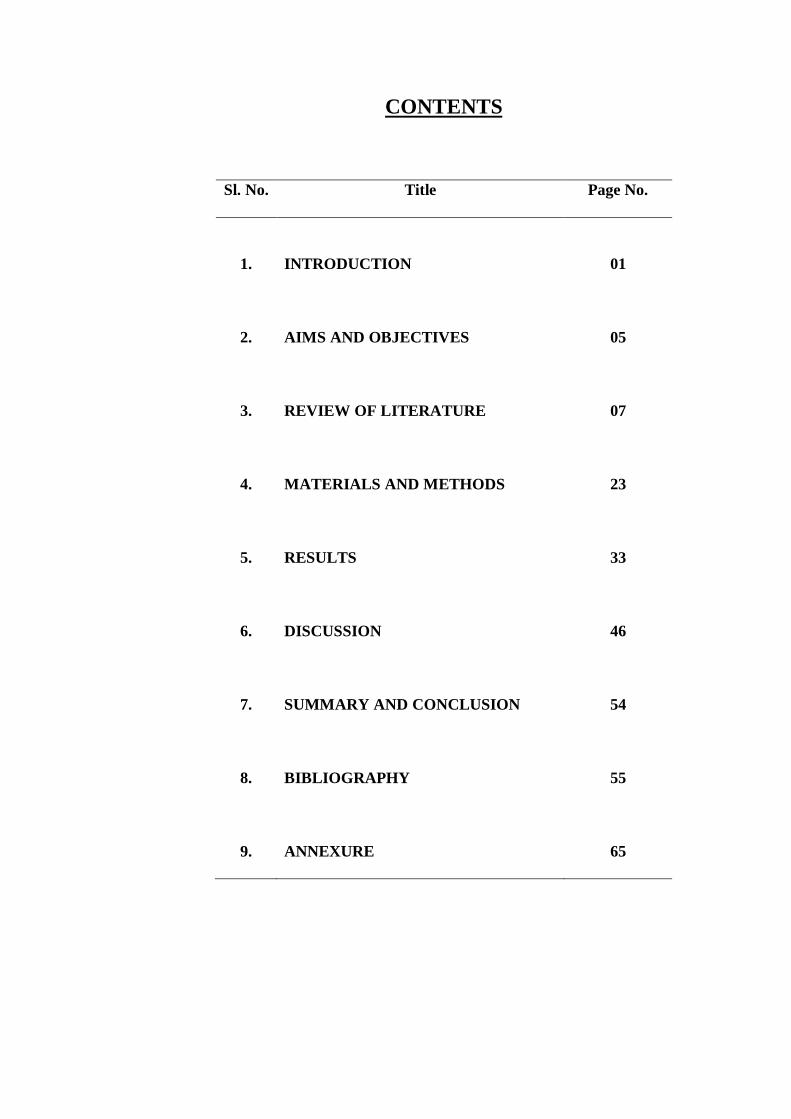
CONTENTS
Sl. No. Title Page No.
1.
INTRODUCTION
01
2. AIMS AND OBJECTIVES 05
3. REVIEW OF LITERATURE 07
4. MATERIALS AND METHODS 23
5. RESULTS 33
6. DISCUSSION 46
7. SUMMARY AND CONCLUSION 54
8. BIBLIOGRAPHY 55
9. ANNEXURE 65
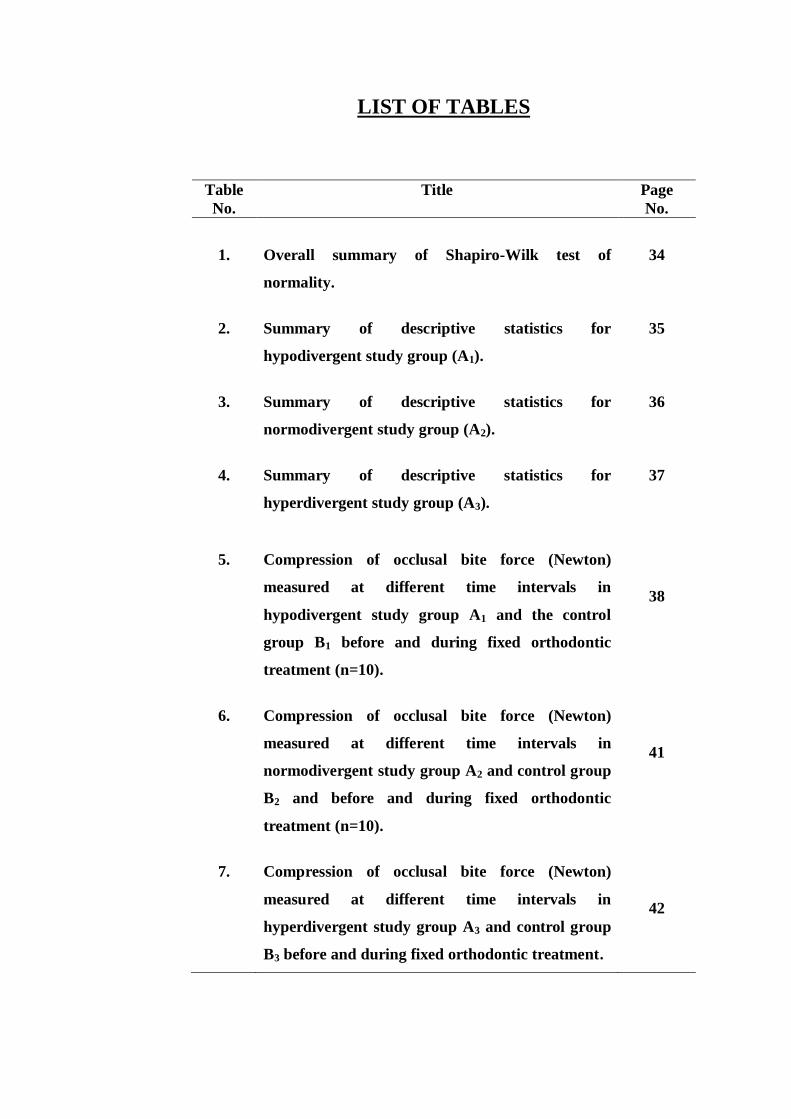
LIST OF TABLES
Table
No.
Title Page
No.
1.
Overall summary of Shapiro-Wilk test of
normality.
34
2. Summary of descriptive statistics for
hypodivergent study group (A1).
35
3. Summary of descriptive statistics for
normodivergent study group (A2).
36
4. Summary of descriptive statistics for
hyperdivergent study group (A3).
37
5. Compression of occlusal bite force (Newton)
measured at different time intervals in
hypodivergent study group A1 and the control
group B1 before and during fixed orthodontic
treatment (n=10).
38
6. Compression of occlusal bite force (Newton)
measured at different time intervals in
normodivergent study group A2 and control group
B2 and before and during fixed orthodontic
treatment (n=10).
41
7. Compression of occlusal bite force (Newton)
measured at different time intervals in
hyperdivergent study group A3 and control group
B3 before and during fixed orthodontic treatment.
42

LIST OF FIGURES
Fig.
No.
Title Page
No.
1.
A. Materials and B. Instruments used during the
fixed orthodontices treatemt.
30
2.
A. OBF measuring device and B. Bite force
recorded in a subject.
31
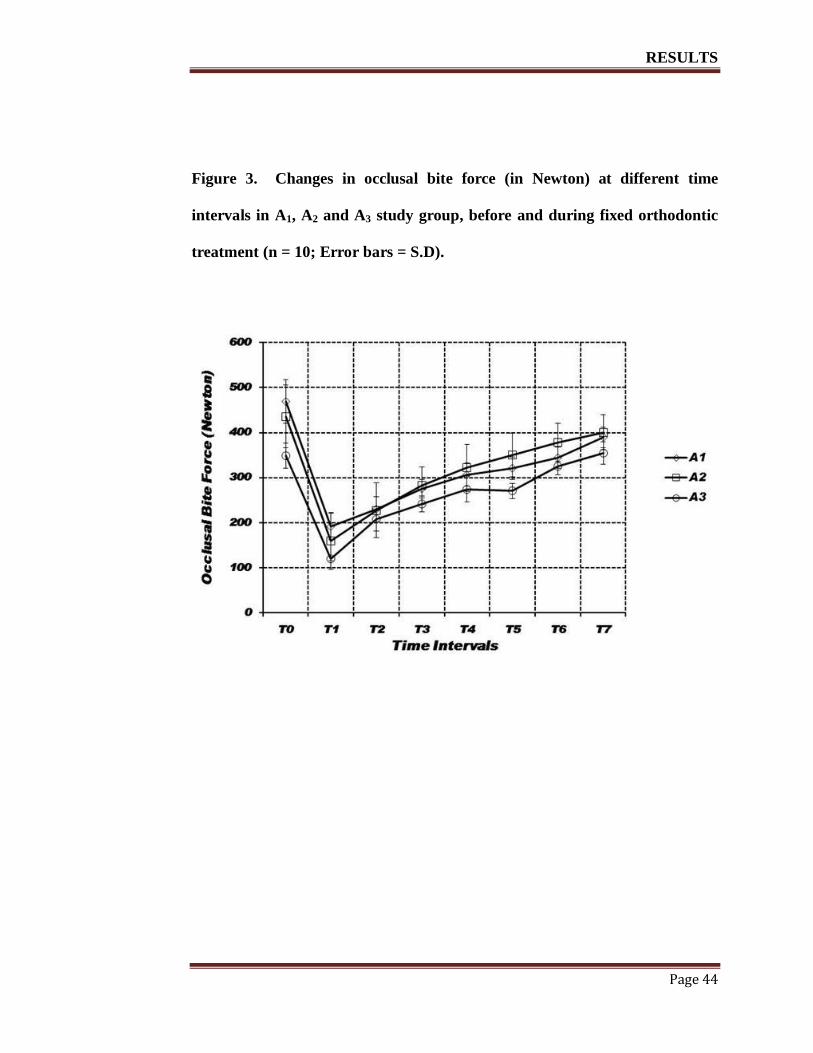
3.
Changes in occlusal bite force (in Newton) at
different time intervals in A1, A2 and A3 study
group, before and during fixed orthodontic
treatment (n=10; Error bars=S.D).
44
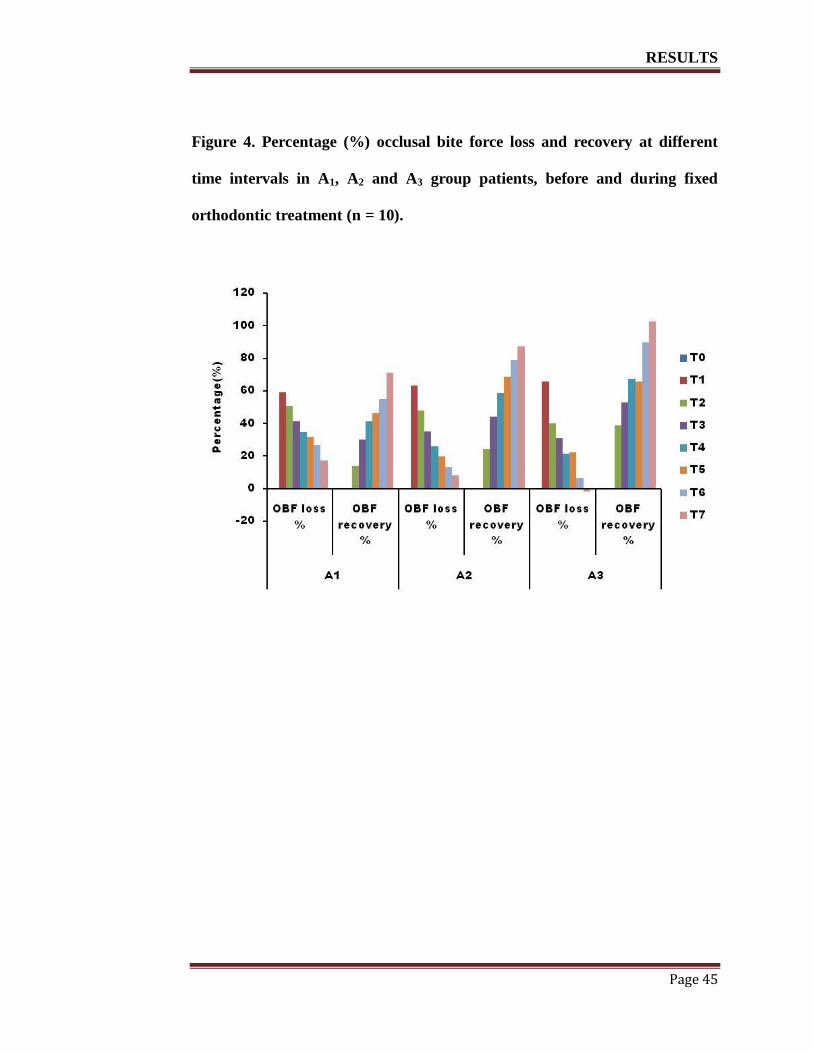
4.
Percentage (%) occlusal bite force loss and
recovery at different time intervals in A1, A2 and
A3 group patients, before and during fixed
orthodontic treatment (n=10).
45
INTRODUCTION
Page 1
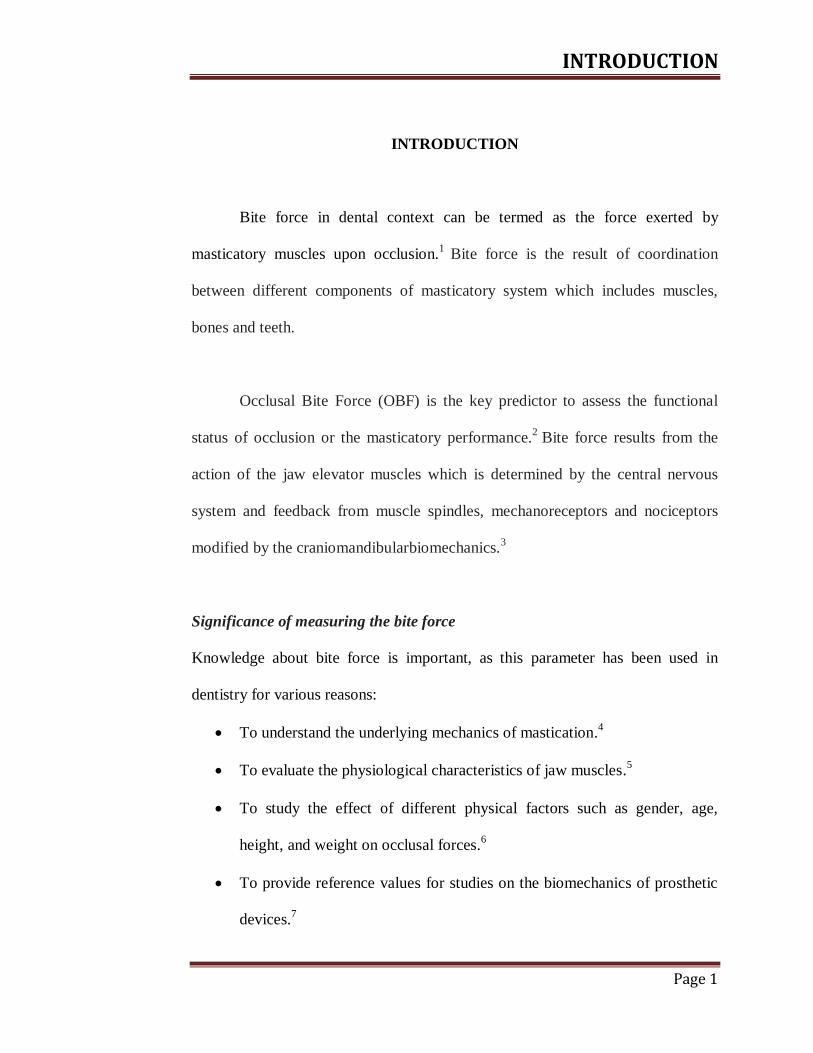
INTRODUCTION
Bite force in dental context can be termed as the force exerted by
masticatory muscles upon occlusion.1
Bite force is the result of coordination
between different components of masticatory system which includes muscles,
bones and teeth.
Occlusal Bite Force (OBF) is the key predictor to assess the functional
status of occlusion or the masticatory performance.2
Bite force results from the
action of the jaw elevator muscles which is determined by the central nervous
system and feedback from muscle spindles, mechanoreceptors and nociceptors
modified by the craniomandibularbiomechanics.3
Significance of measuring the bite force
Knowledge about bite force is important, as this parameter has been used in
dentistry for various reasons:
To understand the underlying mechanics of mastication.4
To evaluate the physiological characteristics of jaw muscles.5
To study the effect of different physical factors such as gender, age,
height, and weight on occlusal forces.6
To provide reference values for studies on the biomechanics of prosthetic
devices.7
INTRODUCTION
Page 2
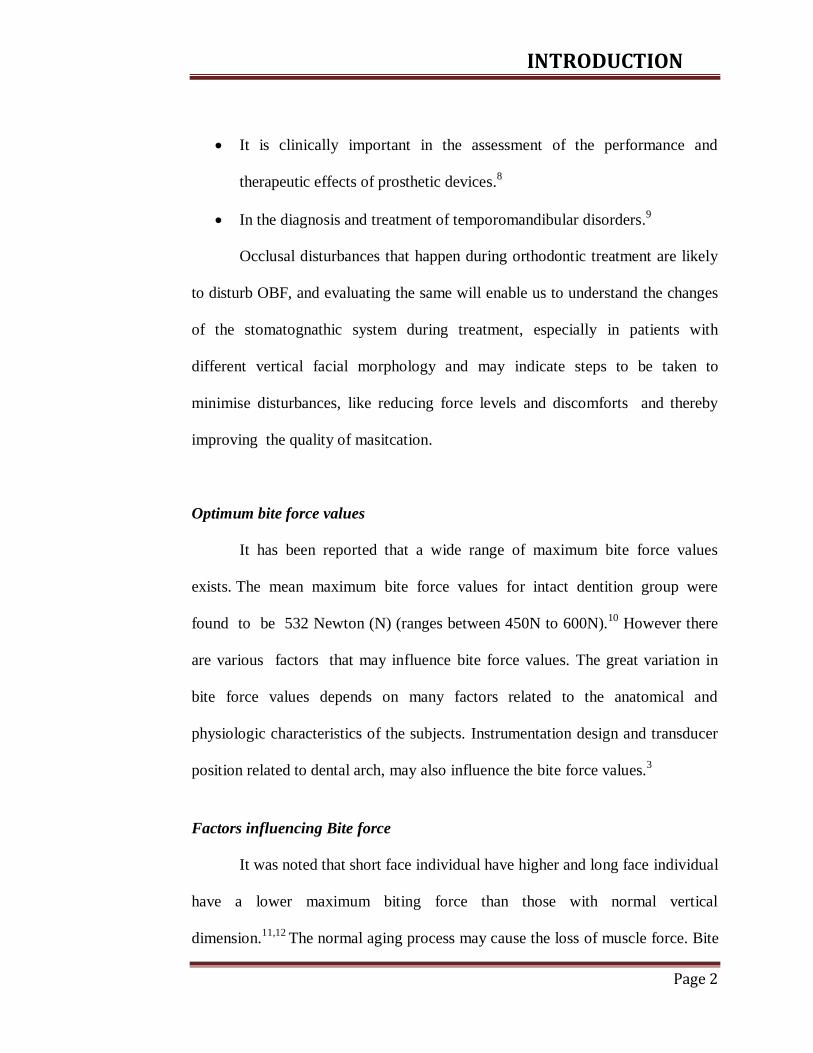
It is clinically important in the assessment of the performance and
therapeutic effects of prosthetic devices.8
In the diagnosis and treatment of temporomandibular disorders.9
Occlusal disturbances that happen during orthodontic treatment are likely
to disturb OBF, and evaluating the same will enable us to understand the changes
of the stomatognathic system during treatment, especially in patients with
different vertical facial morphology and may indicate steps to be taken to
minimise disturbances, like reducing force levels and discomforts and thereby
improving the quality of masitcation.
Optimum bite force values
It has been reported that a wide range of maximum bite force values
exists. The mean maximum bite force values for intact dentition group were
found to be 532 Newton (N) (ranges between 450N to 600N).10
However there
are various factors that may influence bite force values. The great variation in
bite force values depends on many factors related to the anatomical and
physiologic characteristics of the subjects. Instrumentation design and transducer
position related to dental arch, may also influence the bite force values.3
Factors influencing Bite force
It was noted that short face individual have higher and long face individual
have a lower maximum biting force than those with normal vertical
dimension.11,12
The normal aging process may cause the loss of muscle force. Bite
INTRODUCTION
Page 3
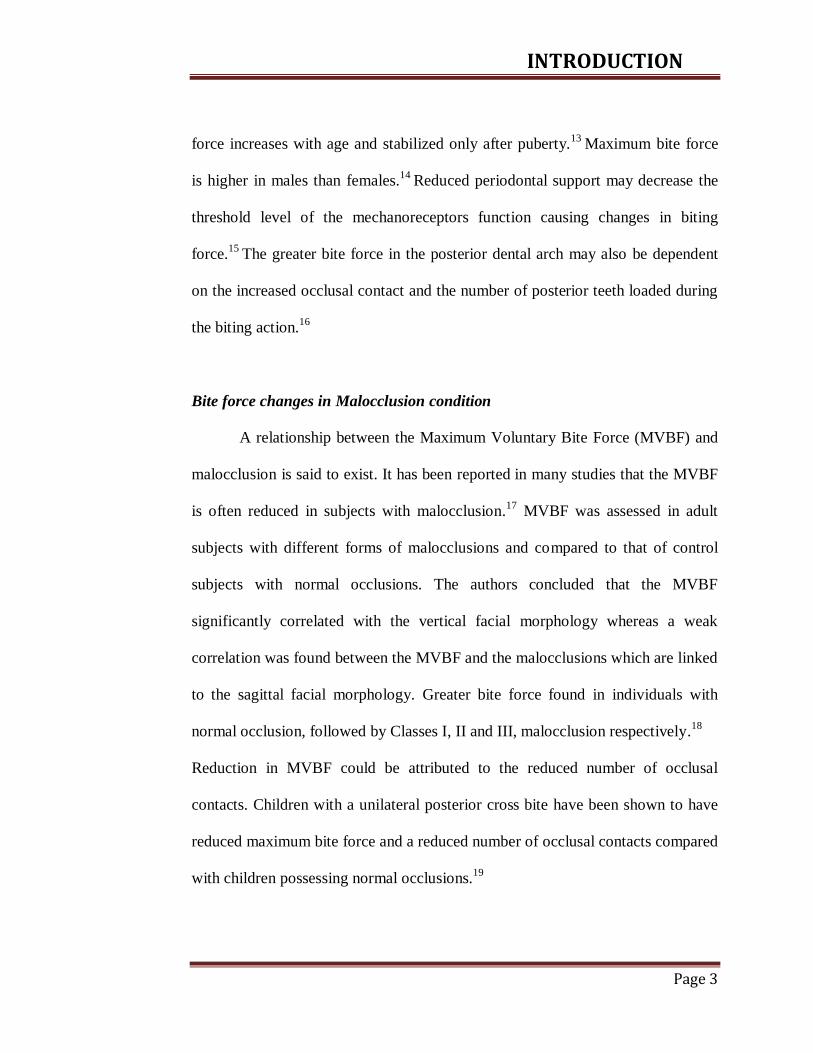
force increases with age and stabilized only after puberty.13
Maximum bite force
is higher in males than females.14
Reduced periodontal support may decrease the
threshold level of the mechanoreceptors function causing changes in biting
force.15
The greater bite force in the posterior dental arch may also be dependent
on the increased occlusal contact and the number of posterior teeth loaded during
the biting action.16
Bite force changes in Malocclusion condition
A relationship between the Maximum Voluntary Bite Force (MVBF) and
malocclusion is said to exist. It has been reported in many studies that the MVBF
is often reduced in subjects with malocclusion.17
MVBF was assessed in adult
subjects with different forms of malocclusions and compared to that of control
subjects with normal occlusions. The authors concluded that the MVBF
significantly correlated with the vertical facial morphology whereas a weak
correlation was found between the MVBF and the malocclusions which are linked
to the sagittal facial morphology. Greater bite force found in individuals with
normal occlusion, followed by Classes I, II and III, malocclusion respectively.18
Reduction in MVBF could be attributed to the reduced number of occlusal
contacts. Children with a unilateral posterior cross bite have been shown to have
reduced maximum bite force and a reduced number of occlusal contacts compared
with children possessing normal occlusions.19
INTRODUCTION
Page 4
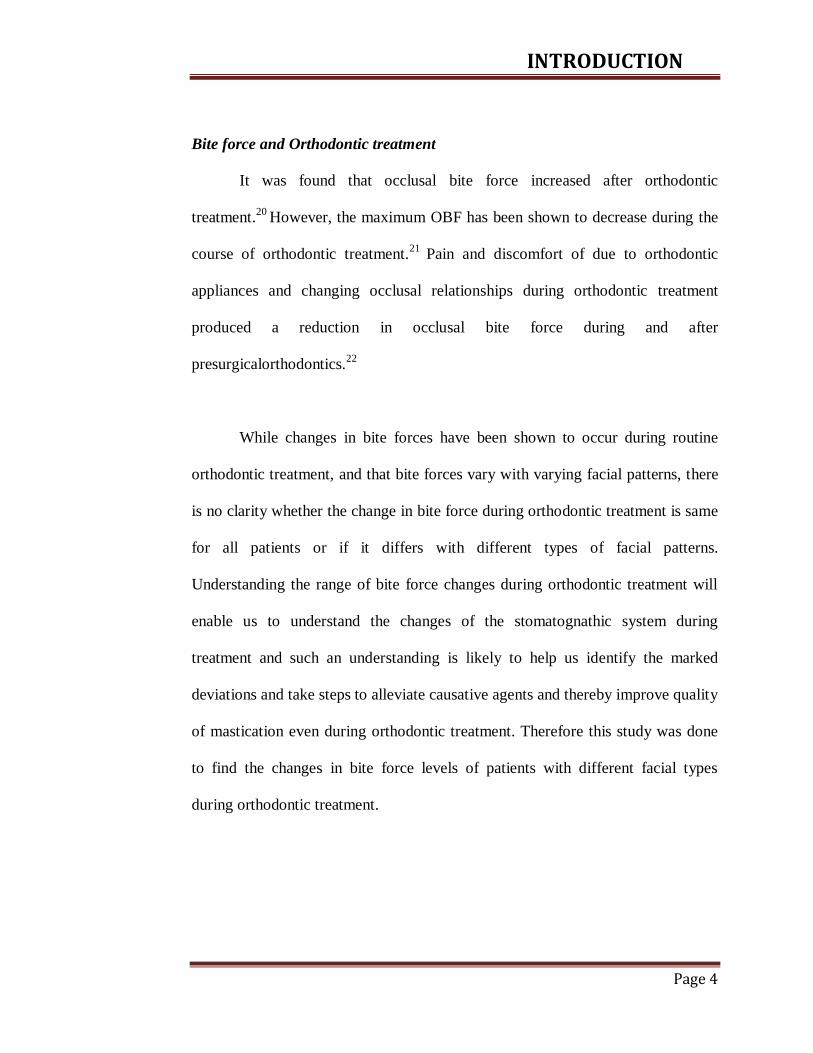
Bite force and Orthodontic treatment
It was found that occlusal bite force increased after orthodontic
treatment.20
However, the maximum OBF has been shown to decrease during the
course of orthodontic treatment.21
Pain and discomfort of due to orthodontic
appliances and changing occlusal relationships during orthodontic treatment
produced a reduction in occlusal bite force during and after
presurgicalorthodontics.22
While changes in bite forces have been shown to occur during routine
orthodontic treatment, and that bite forces vary with varying facial patterns, there
is no clarity whether the change in bite force during orthodontic treatment is same
for all patients or if it differs with different types of facial patterns.
Understanding the range of bite force changes during orthodontic treatment will
enable us to understand the changes of the stomatognathic system during
treatment and such an understanding is likely to help us identify the marked
deviations and take steps to alleviate causative agents and thereby improve quality
of mastication even during orthodontic treatment. Therefore this study was done
to find the changes in bite force levels of patients with different facial types
during orthodontic treatment.
AIM & OBJECTIVES
Page 5
AIM & OBJECTIVES
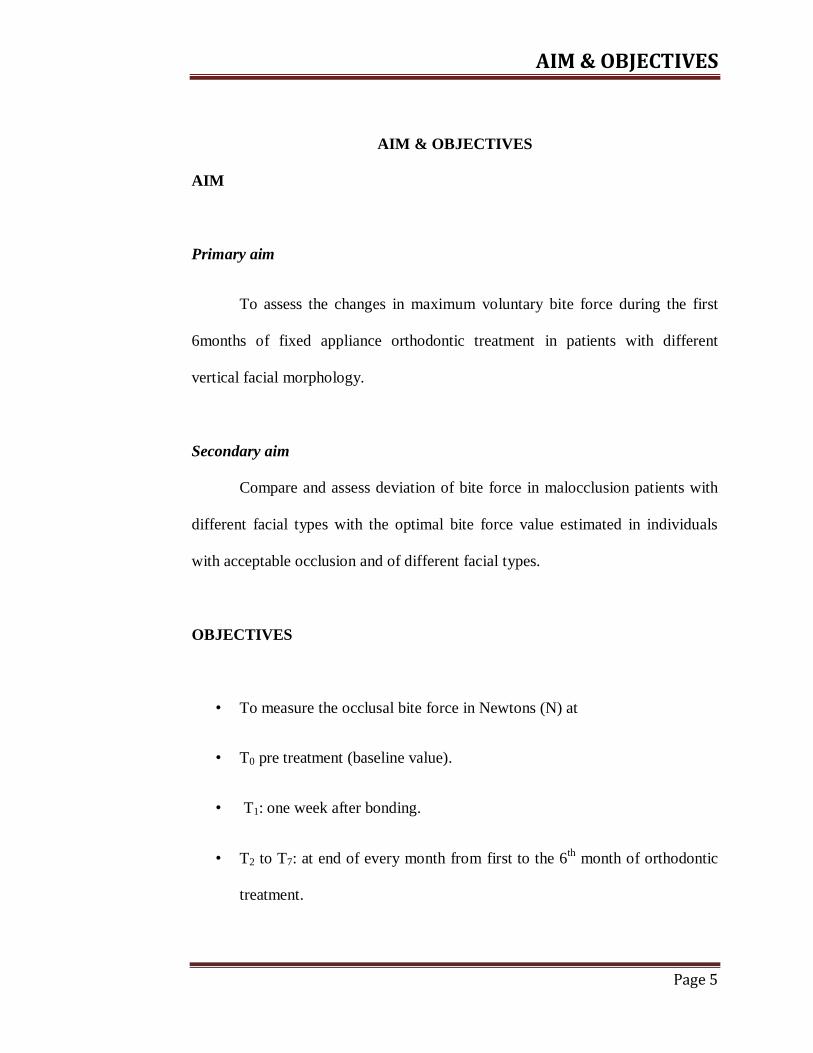
AIM
Primary aim
To assess the changes in maximum voluntary bite force during the first
6months of fixed appliance orthodontic treatment in patients with different
vertical facial morphology.
Secondary aim
Compare and assess deviation of bite force in malocclusion patients with
different facial types with the optimal bite force value estimated in individuals
with acceptable occlusion and of different facial types.
OBJECTIVES
• To measure the occlusal bite force in Newtons (N) at
• T0 pre treatment (baseline value).
• T1: one week after bonding.
• T2 to T7: at end of every month from first to the 6th month of orthodontic
treatment.
AIM & OBJECTIVES
Page 6
• To verify if the base line bite force is achieved in individuals with
different vertical facial morphology after the alignment and leveling stage,
as reported earlier.
• To determine whether correction of overbite discrepancies (deep bite/
open bite) and alignment of teeth improves bite force.
• To compare bite force of individuals of varying facial types with and
without malocclusion.
REVIEW OF LITERATURE
Page 7
REVIEW OF LITERATURE
The available relevant literature has been reviewed utilizing different
search engines in order to reach reasonable knowledge about what is known and
what is still debatable about bite force and influential factor including the
malocclusion and its treatment progression.
Black (1861)24
president of the Chicago dental university in order to determine
the average strength of the jaws devised an instrument of very simple design but
with the name that would put the average jaw to a severe test, the
gnathodynamometer. With this instrument, he tested the bite strength of a
thousand people. The average shows 171 pounds for the molar teeth and much
less for the bicuspids and incisors.
Linderholm & Wennstrom (1970)53
stated that one force potentially responsible
for low bite force in pain owing to the fact that carious teeth can cause high level
of pin, particularly when the diseases is advanced. This then weakens bite
strength.In this regard, this is also noted that a greater value of dmfs/dmft goes
hand in hand with a low level of bite force, which provides a statistically
significant negative link.
REVIEW OF LITERATURE
Page 8
Lindqvist & Ringqvist (1973)26
took bite force measurments so as to investigate
bruxism – related factors in the case of children.
Helkimo et al (1975)52
assessed the link between the state of dentition
and bite force by taking a sample of 125 individuals aged 15-65 years.
For the entire sample the maximal bite force range was 10-73 Kg with the
authors highlighting that the presence of a decline in bite force values
was found to be in line with increasing age particularly in the case of
females with the further statement that a variation in bite force value
could be linked with dental condition difference amongst participants. It
was further concluded that bite force magnitude may be as much as
five times greater in younger people with natural dentition when contrasted
alongside older denture wearers.
Proffit et al (1983)44
showed a link between facial vertical morphology and bite
force low magnitude, in addition to weaker mandibular elevator muscles
particularly, however, it should be recognized that the link was highlighted in
studies with adults.
Williams et al (1987)51
recognised that there will be an effect on the
mechanoreceptors function where periodontal support is found to be lower
owing to disease impacting the periodontium.
REVIEW OF LITERATURE
Page 9
Kampe et al (1987)10
examined bite force magnitude and occlusal
perception with a sample of 29 young adults aged 16-18. Some with and
some without dental fillings. The sample was divided into intact dentition
group and fillings group. It is acknowledged that the fillings were mainly
minor posterior teeth restorations. Accordingly the mean maximum bite
force values for intact dentition group were found to be 532N. while the
recorded mean for participants in the dental fillings group was 516N .
Notably, however such differences were not considered to be statistically
significant. Although it was recognized as valuable that subjects with intact
dentition had a notably greater anterior bite force when contrasted with
mean values in the fillings group.
Ow et al (1989)30
recognized bite force as being one of the essential elements
involved in the chewing function and is regulated by the “dental,muscular,nervous
and skeletal system and exerted by the jaw elevator muscles”.
Bakke et al (1990)38
investigated bite force in a sample of 8-68 years old males
and females, subsequently concluding that bite force increase with age until
females are 25 years old and males are 45 years old, at which point a decline is
experienced.
REVIEW OF LITERATURE
Page 10
Kiliaridis et al (1993a)6 similarly carried out a cross –sectional research with a
sample of 136 subjects divided in to subgroups, with a total age range of 7-24
years.
Kiliaridis et al (1993b)37
studied the link between bite force magnitude and
facial morphology in the case of 136 individuals aged 7-24, with subject’s
facial morphology determined through assessing different variables from
standardized photographs, markedly, only slight positive links were
established between incisor maximum bite force and upper facial
height/lower facial height ratio.
Braun et al (1995)13
stated that there is also an effect demonstrated through
maxilla-facial growth. In this regard, it is believed that variation in
maximum bite force magnitude is witnessed following changes in the
cranio-facial growth, which complements normal growth process in addition
to the growth of masticatory muscles.
Goldreich et al (1994)66
who suggested that orthodontic adjustments tended to
reduce functional muscle activity. This was explained by transient changes in
occlusal support, periodontal mechanoreceptor effects and jaw elevator muscle
reflexes.
REVIEW OF LITERATURE
Page 11
Julien et al (1996)32
measured bite force, contrasting masticatory efficacy in
sample of 47 children and adults. Notably, the numerous variable in the group
were discussed, with the explanation subsequently provided that the contact areas
in posterior teeth in occlusion were strong determinants of masticatory
performance. Furthermore, it was found through regression analysis that the
individual with greater contact areas performed more efficiently than their
counterpart of same gender and body build but with fewer contact areas. They
also emphasized that the total available surface area cannot be considered a strong
indicator of contact area, with this same notion supported earlier by Yukstas et al
(1965).40
Stewart et al (1997)57
that fixed appliances create more pain when compared
with removable appliance. Patients wearing fixed appliances reported higher
values for intensities of pressure, tension, pain, and sensitivity to teeth.
Tortopidis et al (1998a,b)16, 53
said that considering factors affecting bite force
recognized that the position at which the recording device is placed within the
oral cavity differs. Commonly, strong bite forces are normally recognized in the
dental arch’s posterior region, as has been acknowledged through two different
theories .First and foremost the mechanical lever system of the jaw; and secondly,
posterior teeth (premolar and molars) are able to withstand greater force than
anteriors.
REVIEW OF LITERATURE
Page 12
Shinogaya et al (2001a)14
conducted one research study examining
ethnicity in regard to maximum bite force by taking a sample of 46
participants and dividing them according to ethnicity Danish (Caucasians).
Japanese (Asians). With age and gender also taken into account. The authors
subsequently found no significant link. It must be mentioned that amongst
their inclusion criteria was the absence of dental fillings or disease
including malocclusion. Therefore, they were comparing two ethnic groups
with comparable dental status.
Sonneson et al (2001a)25
examined bite force, TMD and facial morphology
across a sample of pre-orthodontic children aged 7-13 years. It was established
through their exploratory research studies that there was the presence of an
association between muscles tenderness, long face and lower maximum bite
forces, although such a link was recognized as being low to moderate.
Rentes et al (2002)33
established bite force in 30 primary dentition children, with
the sample split amongst three subgroups according to occlusion (normal
occlusion, cross bite and open bite),with the authors subsequently highlighting
that there were no prominent influences of malocclusion on bite force.
Sonnesen et al (2001b)39
took note of maximum bite forces, utilizing this
information to examine the link between craniofacial morphology
REVIEW OF LITERATURE
Page 13
temporomandibular dysfunction and head position. Children who were due to
receive orthodontic treatment made up the study sample.
Julien et al (1996)32
established that in addition to functional occlusal contact
area and body build,maximum bite force explained approximately 72% of the
variation in masticatory performance and efficiency among adults and children
212 primary school children,were assesed and concluded the link between
nutrirional status and decay prevalance,obviously,a weight and body mass index
was used as the measure to suggest overal child health ,with each child also
interviewed.
Hatch et al (2001)2 highlited that bite force has a strong link with masticatory
performance, although the effects of such are not recognized as being as strong as
the number of functional teeth.
Rentes et al (2002)33
described chewing as a function that is developed and
matures with time through learning experiances: thus,it is seen to be a
fundamental aspect of the overall food intake process ,with bite force further
recogniced as being a prominant determinant of chewing function and
efficiency,exerted by jaw elevator muscles. skeletal and dental systems
accordingly. such systems status will have a significant impaction on the bite
ability and subsequently on chewing performance.
REVIEW OF LITERATURE
Page 14
Sonnesen and Bakke (2005)36
stated parallel findings group of 7-13 year old
children, remarking that occlusion Angle’s classification does not impact the
levels of bite force, although they do recognize that lower bite force values were
found amongst individuals experiencing class III malocclusion. This was
supported by Lemos et al (2006)45
, who stated that the occlusion variable in their
36 subject sample was not found to impact bite force magnitude.
Kamegai et al (2005)43
in contrast, examined bite force across a large sample of
Japanese subjects with occlusion examined, amongst other variables, and
participants classified in relation to the presence of normal occlusion, protrusion
of the maxilla, crowded arches, crossbite. In both genders, bite force was found to
reduce with the presence of any category of malocclusions. Furthermore,
statistical significance as a result of the negative impact of malocclusion was
found in children over 9 years, with the researchers further stating that bite force
had a positive correlation with normal occlusion.
Sonnesen and Bakke (2005)36
stated consensus that bite force commonly
increase with age until the individual is approximately 20 years old, at which
point there will be stabilized bite force. However, uponreaching 40 years bite
force begins to decrease.
REVIEW OF LITERATURE
Page 15
Sonnesen and Bakke (2005)36
highlights the presence of a link between
bite force and cranio-facial morphology, but only in the case of males
aged 7-13. As such, the most fundamental of considerations in regard to
craniofacial morphology impacting boy’s bite force was the vertical jaw
relationship. Thus, it can be stated that males with a shorter, lower facial
height demonstrated a greater degree of force in bite.
Sonnesen and Bakke (2005)36
state that the recognized increase in bite force,
which has come to be linked with growth following their consideration of a
sample aged 7-13 years, may be due to dental development in regard to increased
dental eruptions; thus, an increased number of erupted teeth, it is expected that
there will be greater bite force.
Toro et al (2006)35
took into account in regard to the ability to break food. It was
suggested that malocclusion was known to reduce masticatory performance,
although such an effect was recognized as being relatively minor.
Toro et al (2006)35
in this regard highlighted negative finding, stating that there
were no statistically significant differences amongst boys and girls aged 6-15 in
regard to their capacity to masticate food: however Julien et al (1996)32
emphasized that young males demonstrated greater efficiency when masticating
artificial food when compared to females.
REVIEW OF LITERATURE
Page 16
Alkan et al (2006)50
drew a comparison between participants with
healthy periodontal tissues with those with chronic periodontitis,
considering bite force. The authors underlined a remarkable relationship
between bite force and periodontium health, with a significantly higher bite
force amongst healthy subjects than those with periodontitis.
Pizolato et al (2007)47
state that there is a negative impact of TMJ
disorders and muscles pain on bite force recorded values . Likewise the
same link was acknowledged by Kogawa et al (2006)49
. Although Pereira
et al (2009)48
reports illustrate no significant impact as a result could be
attributed to variation in recording techniques as well as variation in
severity of TMD cases studied in different studies.
Calderon et al (2006)27
carried out a research study concerned with investigating
adult cases of bruxism, with bite force assesments used through the study
approach.
Castelo et al (2007)42
considered the link between occlusal contacts,
masticatory muscles thickness and bite force values by taking a sample of
46 child subjects. Each of whom was assigned to a group in regard to the
dentition stage and their occlusion. The researches highlighted a strong
REVIEW OF LITERATURE
Page 17
positive link between thickness of the masseter muscle and maximum bite
force amongst children with normal occlusion.
Mountain (2008)23
in a PhD thesis did analyse ethnicity effects with a
statistically negative correlation (r=-0.17.<0.01) for Asian origin and
maximum bite force in young children. In contrast there was a positive
statistically significant link between individuals of black origin and
maximum bite force (r=1.2, p<0.05).
Rismanchian et al (2009)28
said in record to adult dentistry that implant success
is assessed in consideration of various factors namely chewing ablity, biting
ability, and functional recording,which provides one aspect of bite force
determination clinical use.
Koc et al (2011)34
stated that cranio-facial morphology description includes the
ratio between anterior and posterior facial heights, inclination of the mandible,
and gonial angle. The researchers further added that maximum bite force suggests
that –mandible’s lever systems geometry.
Castelo et al (2007)42
examined maximum bite force and its link with facial
morphology by taking a sample of 67 young children aged 3.5-7 years, all of
whom had posterior crossbite.It was stated through the conduction of univariate
REVIEW OF LITERATURE
Page 18
analysis in the mixed dentition stage that the subjects found to have lower bite
forces were markedly more vulnerable to exhibit posterior crossbite, although this
could not be recognized as an indicator for the presence of crossbite as multiple
logistic levels did not be recognized as an indicator for the presence of crossbite
as multiple logistic levels did not illustrate significant levels. It was further
emphasized that bite forces in mixed-dentition children with posterior crossbite
were markedly lower when compared against those with normal mixed dentition
occlusion. They further added that such a difference was due to differences in
masticatory cycle duration, length of lateral excursion, combined with impaired
muscles function. It is recognized that all of these elements may result in
neuromuscular adaptation so as to avoid any tooth interferences.
Koc et al (2010)3 said that the evaluations of bite force have been proven to be
constructive and thus widely utilized in dentistry, with the measurement of such
conducted with the aim of determining muscular activity and jaw movements
during the chewing process as stated by Bakke et al (1992)31
with measurements
also valuable in terms of masticatory evaluation as supported by the work done by
Julien et al (1996)32
.
Mountain et al (2011)41
found that there were lower bite forces in children with
primary dentition malocclusion (194.2N) when compared with those of normal
REVIEW OF LITERATURE
Page 19
primary occlusion (197.10) although this difference was not statistically
significant.
Van der Built (2011)29
stated that there are numerous elements known to impact
masticatory performance, including age, bite force, gender, the loss and type of
restoration of post canine teeth, malocclusion, total area of teeth in contact oral
motor function and salivary glands function.
Mountain et al (2011)55
stated that the maximum bite force exerted by
primary dentition children can be predicted by the number of decayed,
missing and filled teeth surfaces. In this regard , it was noted that a
significant negative relationship between DMFS and maximum bite force
suggested that a child with deteriorated dentition was potentially more
likely to demonstrate weaker bite forces when contrasted with a child
with a healthy normal dentition. The author emphasised that bite force at
the primary stage of dentition development may ultimately depend on
caries prevalence.
Fernanders et al (2003)56
quotes that the majority of modern designs utilize
electrical resistant strain gages overall the majority of recording tools concerned
with the bite force have the potential to record forces between 0 and 800N at a
rate of 80% precision and accuracy amounting to 10 N.
REVIEW OF LITERATURE
Page 20
Rentes et al (2002)33
and Castelo et al (2007)42
used a pressurized rubber tube as
a bite force device that must be connected to sensor element (pressure sensor
MPX 5700 Motorola) There is the need to connect the system to the computer
and software so as to enable pressure reading and thus establishing the values in
psi .However, the disadvantage that the Psi must then be converted to N, taking
into consideration the tube area due to the fact that force equals pressure
multiplied by area which would markedly impact the easiness such as utilization
and thus make it less practical. In addition there is also the need to connect to a
computer, and so it may be recognized that the device is not portable.
Another recording system utilized in the context of bite force is dental
prescalesystem, which comprises a horse-shoe shaped bite foil made from a
pressure –sensitive film, and further includes a computerized scanning system,
which is able to analyze the applied forces. Upon the application of force to the
occlusal surfaces a graded colour will be reaction from chemical reaction.
Koc et al (2010)3 stated that the exposed pressure sensitive foils are analyzed in
the occlusal scanner which reads the area and colour intensity of the red dots to
assess occlusal contact area and pressure, with occlusal load anatomically
analysed.
REVIEW OF LITERATURE
Page 21
Shinogaya et al (2000b)46
assessed bite force with the use of dental prescale
system, stating that it has the benefit of measuring bite forces at intercuspal
position, and accordingly delivering prediction of bite forces under natural
conditions, moreover the force distribution can also be assessed simultaneously,
although there is a technical limitations in terms of the computerized scanning
apparatus, as highlighted previously.
Sonnesen & Bakke (2007a,b)19,59
have measured OBF before and after
orthodontic treatment and reported that there is an increase in the bite force value
after correction of unilateral cross bite.
Abu Alhaija (2010)58
Occlusal bite force has been shown to vary in patients with
different vertical facial morphological characteristics. Occlusal bite force is
greater for hypodivergent individual followed by normodivergent and less for
hyperdivergent individuals.
Koc et al (2011)34
Recognised bite force as one of the factors including
masticatory system’s functional state resulting from jaw elevator muscle action,
modified by cranio- mandibular biomechanics.
REVIEW OF LITERATURE
Page 22
Varga et al (2011)60
found that there was minimal increase in bite force
following the cessation of the pubertal growth spurt. Maximum voluntary bite
increase with age and it stablises after reaching pubertal growth spurt.
Sawsan et al (2012)69
stated OBF reduced during the first month of orthodontic
treatment but, with time, recovered to pretreatment levels. 50% of pretreatment
OBF was lost by the end of the first week. OBF showed a tendency to return to
pretreatment levels after the second month of orthodontic treatment.VAS scores
were high during the first 2 weeks of appliance treatment.
In the present review we have gathered insights in to how bite force has
been shown to be affected by a number of physiological and morphological
variables. Other variables such as state of dentition, instrumentation design and
transducer position related to dental arch, malocclusions, signs and symptoms of
temporomandibular disorders, size composition and mechanical advantage of jaw
closing muscles, may also influence the values found for his force.
MATERIALS AND METHODS
Page 23
MATERIALS AND METHODS
Study armamentarium
Separators (JJ Orthodontics) and separator placing plier
Materials for banding and bonding (Ormco, 3M Unitek)
MBT 022 Orthodontic bracket kit (3M Unitek Gemini)
Arch wire (JJ Orthodontics)
NiTi Preformed Archwires: Upper and Lower 0.014 NiTi,
0.016” NiTi, 0.017x0.025 NiTi, 0.019x0.025 NiTi
Stainless Steel Preformed Archwires: Upper and Lower 0.016 SS,
0.018 SS, 0.017x0.025 SS, 0.019x0.025 SS (Fig. 1)
Strain gauge transducer (Hari Om Electronics, Gujarat)
Disposable latex cot
Study area
Department of Orthodontics and Dentofacial Orthopaedics, Government
Dental College and Hospital, Chennai, Tamilnadu.
MATERIALS AND METHODS
Page 24
Study population
14-24 yrs old outpatients undergoing orthodontic treatment in the
Department of Orthodontics and Dentofacial Orthopaedics, Government Dental
College and Hospital, Chennai, Tamilnadu were included in the study group.
Study period
The study was performed for the period of six months during the
alignment and leveling stage of the fixed orthodontic treatment.
Type of study : Cross Sectional study.
Type of sample : Consecutive sampling.
Sample size : 30 subjects as group study (A) and 30 subjects, who possessed
normal occlusion and with the three different facial types was selected as control
group (B). Each subject group was divided into three sub groups with 10 subjects
in each. Thus group A was divided as follows:
A1 - Hypodivergent individual
A2 - Normodivergent individual
A3 - Hyperdivergent individual
MATERIALS AND METHODS
Page 25
Similarly the control group (B) was divided into three sub groups with 10
subjects in each. Thus group B was divided as follows:
B1 - Hypodivergent individual
B2 - Normodivergent individual
B3 - Hyperdivergent individual
Subjects Selection criteria
Inclusion criteria
Healthy individuals with full complement of teeth.
Age group : 14 to 20 years,
Either sex.
Mild to moderate crowding/ bimaxillary dentoalveolar proclination.
Patients willing for voluntary participation and have signed informed
consent.
Exclusion criteria
No prior orthodontic treatment.
No posterior cross bite.
No signs and symptoms of Temporal Mandibular Joint (TMJ) dysfunction.
No large carious lesions or restoration.
Patients with Periodontal compromised teeth.
MATERIALS AND METHODS
Page 26
Patients with deleterious oral habits like bruxism, tongue thrust etc.
Patients with jaw discrepancy requiring surgical correction.
Patients with oral manifestation of systemic disease.
Patients with no previous H/O trauma to the face and the jaws.
Study design
Ethical approval for the present study was obtained from the Institutional
ethics committee of Tamil Nadu Government Dental College and Hospital,
Chennai.. Patients attending the orthodontic outpatient clinic, Department of
Orthodontics and Dentofacial Orthopaedics, Tamil Nadu Government Dental
College and Hospital, Chennai, Tamilnadu were screened. 30 patients (19
females, 11 males) who fulfilled the above criteria formed the study group (A)
and the control group (B) with normal occlusion were categorized according to
their facial types into three sub groups, as mentioned earlier was selected.
The participant’s information sheet (English and Tamil) was given to all
the patients involved in the study, and the informed consent was obtained from
patients or guardians. All the subjects selected for the study underwent general
examination, intra oral examination and extra oral examination.
MATERIALS AND METHODS
Page 27
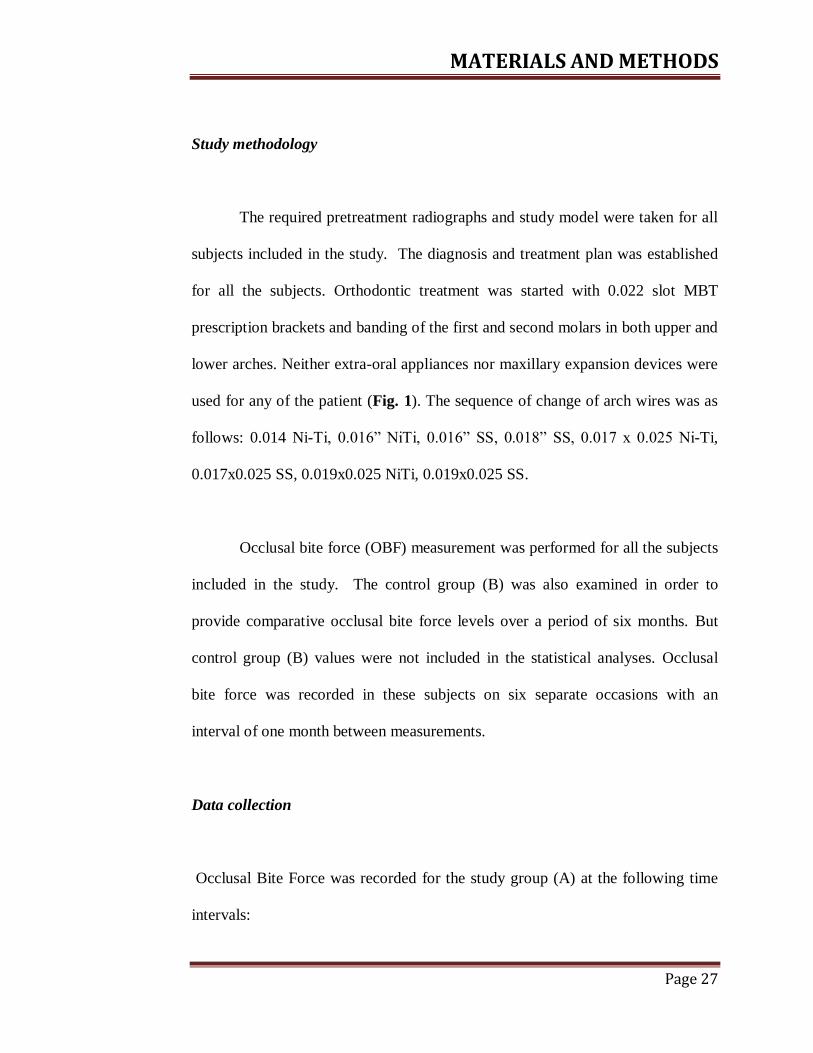
Study methodology
The required pretreatment radiographs and study model were taken for all
subjects included in the study. The diagnosis and treatment plan was established
for all the subjects. Orthodontic treatment was started with 0.022 slot MBT
prescription brackets and banding of the first and second molars in both upper and
lower arches. Neither extra-oral appliances nor maxillary expansion devices were
used for any of the patient (Fig. 1). The sequence of change of arch wires was as
follows: 0.014 Ni-Ti, 0.016” NiTi, 0.016” SS, 0.018” SS, 0.017 x 0.025 Ni-Ti,
0.017x0.025 SS, 0.019x0.025 NiTi, 0.019x0.025 SS.
Occlusal bite force (OBF) measurement was performed for all the subjects
included in the study. The control group (B) was also examined in order to
provide comparative occlusal bite force levels over a period of six months. But
control group (B) values were not included in the statistical analyses. Occlusal
bite force was recorded in these subjects on six separate occasions with an
interval of one month between measurements.
Data collection
Occlusal Bite Force was recorded for the study group (A) at the following time
intervals:

MATERIALS AND METHODS
Page 28
T0: Just prior to orthodontic elastic separator insertion.
T1: One week after the placement of orthodontic appliances.
T2 – T7: the bite force was recorded at the end of every month from the
first month after starting to the sixth month, before the scheduled arch
wire change for that visit if any.
Occlusal Bite Force was recorded for the control group (B) at T2 to T7 on
six separate occasions with an interval of one month between measurements, as
they did not undergo fixed orthodontic treatment.
Bite force measurement procedure
Bite force was measured using a “STRAIN GAUGE TRANSDUCER-
Digital bite force meter”. This gadget uses electronic technology and comprises a
bite plate and body (Fig. 2). The gadget presents a scale in which measures force
in Newtons (N).
The specifications for the device are
o Force range:0-1000N
o Accuracy: +/- 2 N
o Size : Biting element: 6x4 cm
o Display body: 25x20 cm
MATERIALS AND METHODS
Page 29
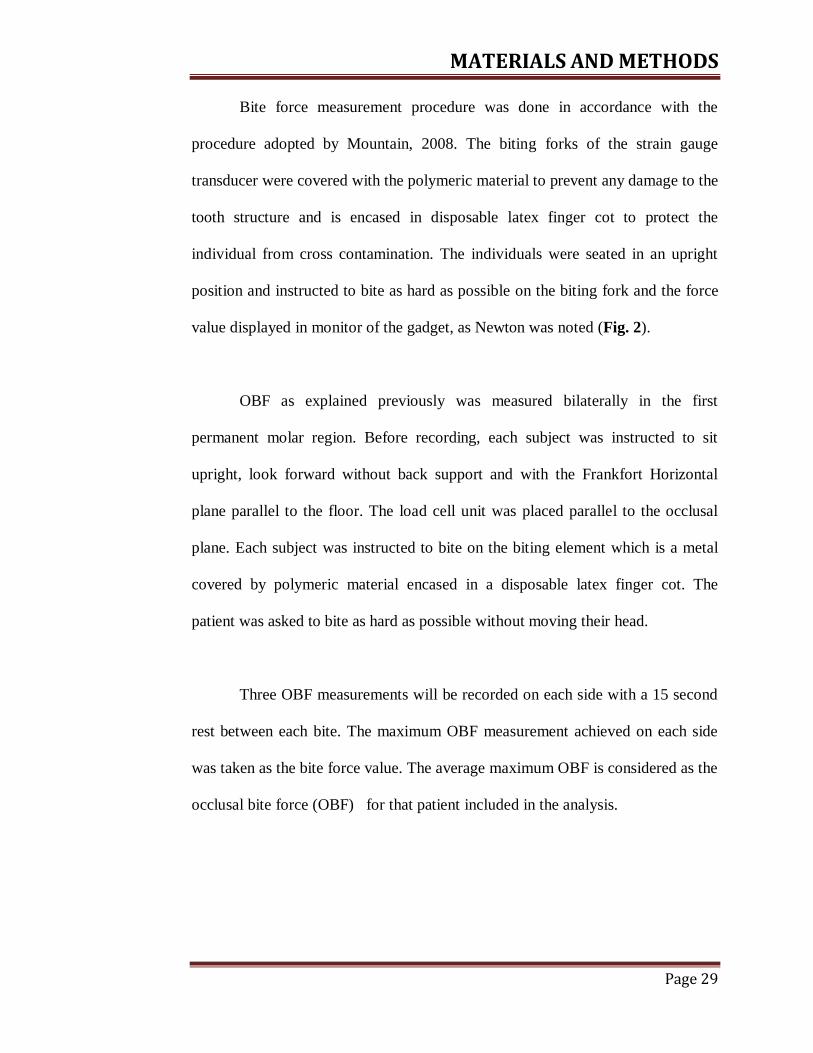
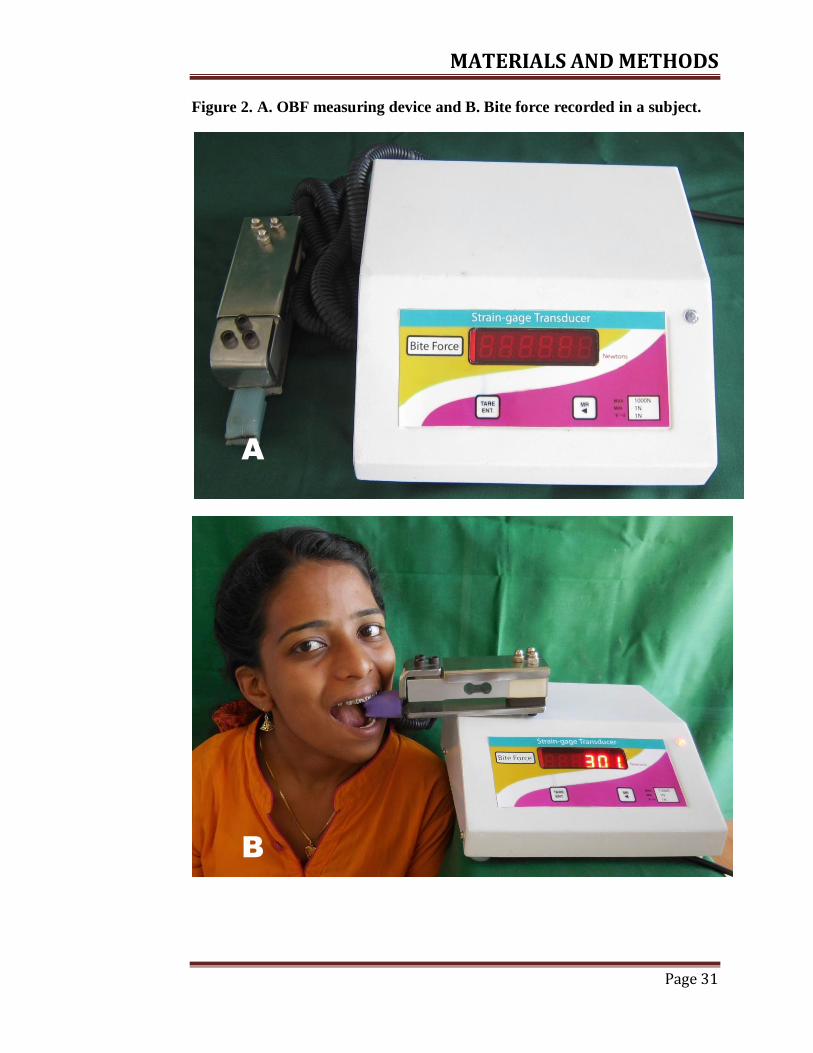
Bite force measurement procedure was done in accordance with the
procedure adopted by Mountain, 2008. The biting forks of the strain gauge
transducer were covered with the polymeric material to prevent any damage to the
tooth structure and is encased in disposable latex finger cot to protect the
individual from cross contamination. The individuals were seated in an upright
position and instructed to bite as hard as possible on the biting fork and the force
value displayed in monitor of the gadget, as Newton was noted (Fig. 2).
OBF as explained previously was measured bilaterally in the first
permanent molar region. Before recording, each subject was instructed to sit
upright, look forward without back support and with the Frankfort Horizontal
plane parallel to the floor. The load cell unit was placed parallel to the occlusal
plane. Each subject was instructed to bite on the biting element which is a metal
covered by polymeric material encased in a disposable latex finger cot. The
patient was asked to bite as hard as possible without moving their head.
Three OBF measurements will be recorded on each side with a 15 second
rest between each bite. The maximum OBF measurement achieved on each side
was taken as the bite force value. The average maximum OBF is considered as the
occlusal bite force (OBF) for that patient included in the analysis.
MATERIALS AND METHODS
Page 30
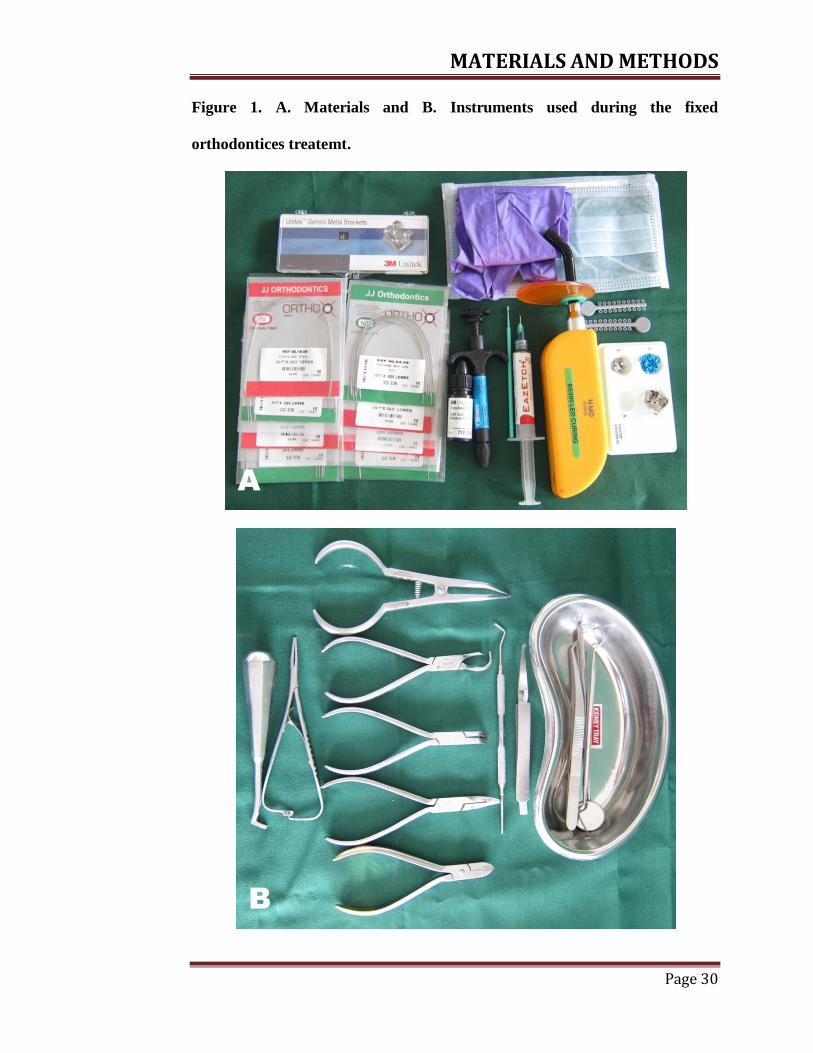
Figure 1. A. Materials and B. Instruments used during the fixed
orthodontices treatemt.
A
B
MATERIALS AND METHODS
Page 31
Figure 2. A. OBF measuring device and B. Bite force recorded in a subject.
A
B
MATERIALS AND METHODS
Page 32
Analysis of the data
Statistical analysis was performed using the Statistical Package for the
Social Sciences computer software (SPSS 21.0, SPSS Inc., IL, USA). Shapiro-
Wilks test was carried out to assess the normality of OBF data collected during
the study.
Descriptive statistics was performed for OBF values recorded in study
group (A) at different time intervals. The repeated measures analysis was used to
test hypotheses about the means of a dependent variable when the same dependent
variable is measured on more than one occasion for same subject.
The repeated measures analysis of variance (within-subjects ANOVA) test
with a Greenhouse-Geisser correction and Bonferroni post-hoc comparison were
conducted to examine and define the differences in means of OBF measured at
the different time intervals before and during orthodontic treatment. All statistical
analyses were carried out at p ≤ 0.05 level of significance.
RESULTS
Page 33
RESULTS
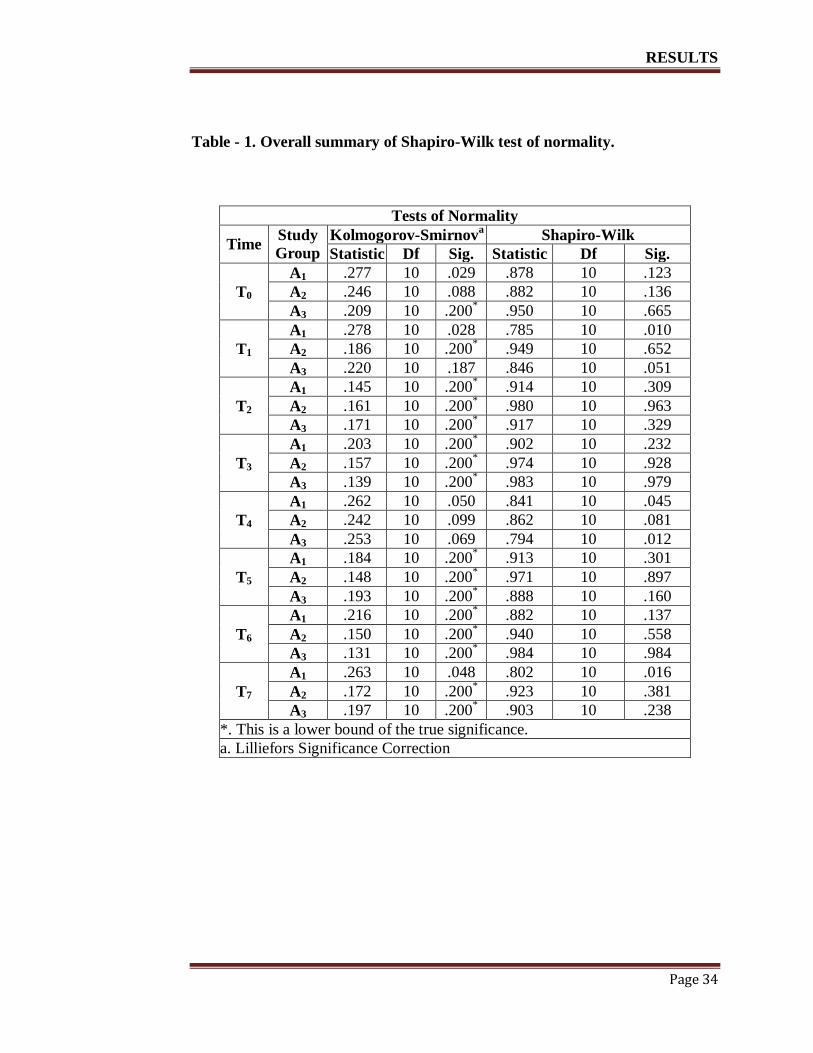
The overall summary results from two well-known tests of normality,
namely the Kolmogorov-Smirnov Test and the Shapiro-Wilk Test is given in
Table-1. The Shapiro-Wilk Test is more appropriate for small sample sizes (< 50
samples), but can also handle sample sizes as large as 2000. Hence, the Shapiro-
Wilk test was taken for the present analyses of numerical means for assessing
normality.
The Significance value of the Shapiro-Wilk Test is greater than 0.05, in
most of the data, so the data is normally distributed. It is below 0.05, at time
interval T1, T4 and T7 in A1 group and in A3 group at time T4, these four data
significantly deviate from a normal distribution.
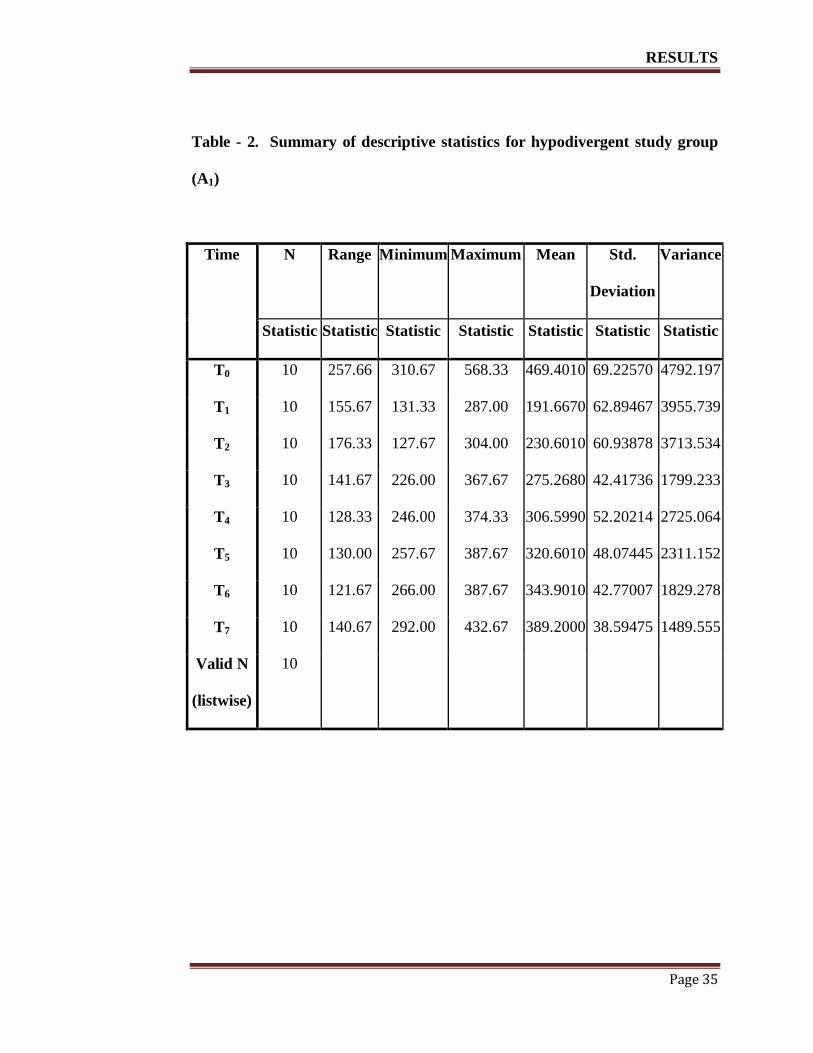
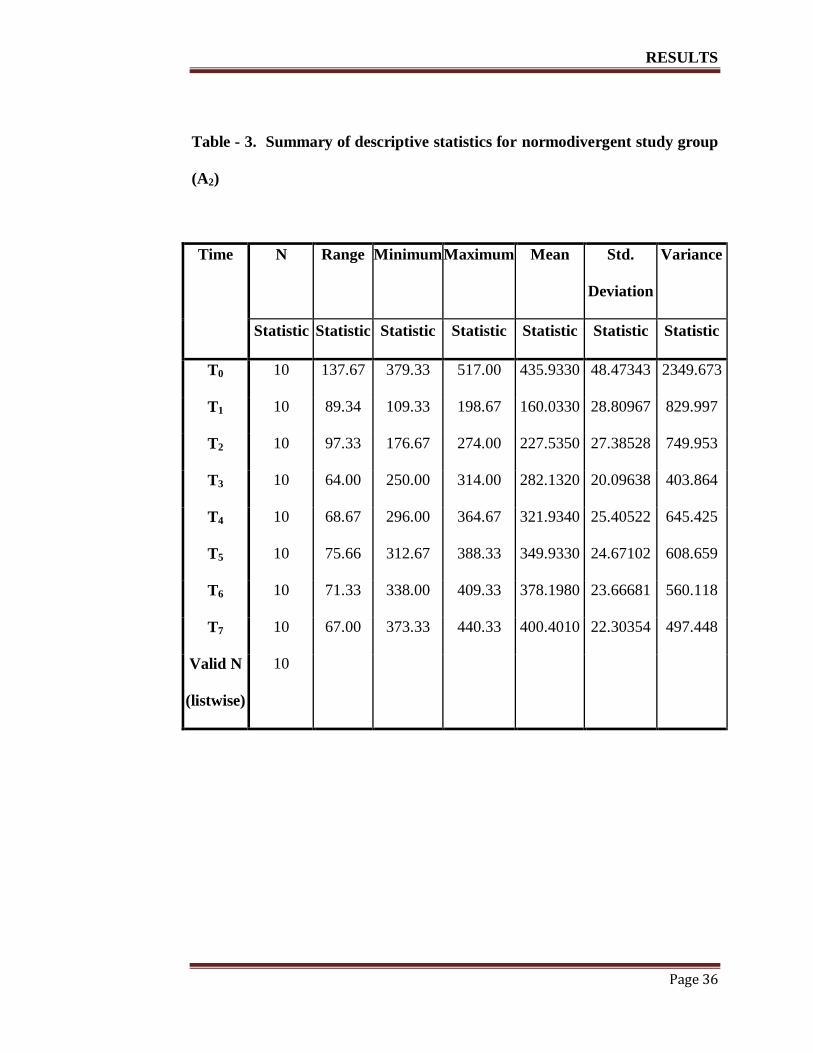
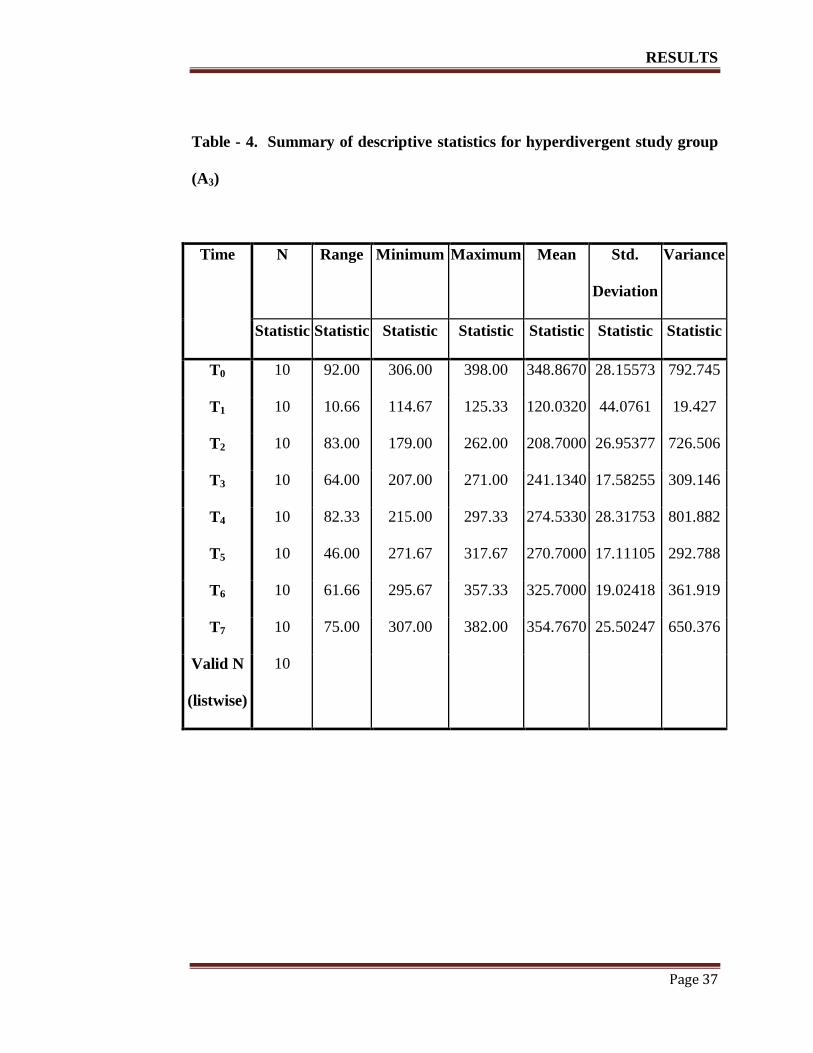
Descriptive statistics for OBF scores at the different time intervals before
and during fixed orthodontic treatment for hypodivergent study group (A1),
normodivergent study group (A2) and hyperdivergent study group (A3) were
program calculated and provided in Table 2-4. The minimum and maximum OBF
recorded at time T1 and T0 in A1 group was 131.33N and 568.33N, in A2 group
was 109.33N and 517.00N and in A3 group was 114.67N and 398.00N
respectively.
RESULTS
Page 34
Table - 1. Overall summary of Shapiro-Wilk test of normality.
Tests of Normality
Time Study
Group
Kolmogorov-Smirnova Shapiro-Wilk
Statistic Df Sig. Statistic Df Sig.
T0
A1 .277 10 .029 .878 10 .123
A2 .246 10 .088 .882 10 .136
A3 .209 10 .200* .950 10 .665
T1
A1 .278 10 .028 .785 10 .010
A2 .186 10 .200* .949 10 .652
A3 .220 10 .187 .846 10 .051
T2
A1 .145 10 .200* .914 10 .309
A2 .161 10 .200* .980 10 .963
A3 .171 10 .200* .917 10 .329
T3
A1 .203 10 .200* .902 10 .232
A2 .157 10 .200* .974 10 .928
A3 .139 10 .200* .983 10 .979
T4
A1 .262 10 .050 .841 10 .045
A2 .242 10 .099 .862 10 .081
A3 .253 10 .069 .794 10 .012
T5
A1 .184 10 .200* .913 10 .301
A2 .148 10 .200* .971 10 .897
A3 .193 10 .200* .888 10 .160
T6
A1 .216 10 .200* .882 10 .137
A2 .150 10 .200* .940 10 .558
A3 .131 10 .200* .984 10 .984
T7
A1 .263 10 .048 .802 10 .016
A2 .172 10 .200* .923 10 .381
A3 .197 10 .200* .903 10 .238
*. This is a lower bound of the true significance.
a. Lilliefors Significance Correction
RESULTS
Page 35
Table - 2. Summary of descriptive statistics for hypodivergent study group
(A1)
Time N Range Minimum Maximum Mean Std.
Deviation
Variance
Statistic Statistic Statistic Statistic Statistic Statistic Statistic
T0 10 257.66 310.67 568.33 469.4010 69.22570 4792.197
T1 10 155.67 131.33 287.00 191.6670 62.89467 3955.739
T2 10 176.33 127.67 304.00 230.6010 60.93878 3713.534
T3 10 141.67 226.00 367.67 275.2680 42.41736 1799.233
T4 10 128.33 246.00 374.33 306.5990 52.20214 2725.064
T5 10 130.00 257.67 387.67 320.6010 48.07445 2311.152
T6 10 121.67 266.00 387.67 343.9010 42.77007 1829.278
T7 10 140.67 292.00 432.67 389.2000 38.59475 1489.555
Valid N
(listwise)
10
RESULTS
Page 36
Table - 3. Summary of descriptive statistics for normodivergent study group
(A2)
Time N Range Minimum Maximum Mean Std.
Deviation
Variance
Statistic Statistic Statistic Statistic Statistic Statistic Statistic
T0 10 137.67 379.33 517.00 435.9330 48.47343 2349.673
T1 10 89.34 109.33 198.67 160.0330 28.80967 829.997
T2 10 97.33 176.67 274.00 227.5350 27.38528 749.953
T3 10 64.00 250.00 314.00 282.1320 20.09638 403.864
T4 10 68.67 296.00 364.67 321.9340 25.40522 645.425
T5 10 75.66 312.67 388.33 349.9330 24.67102 608.659
T6 10 71.33 338.00 409.33 378.1980 23.66681 560.118
T7 10 67.00 373.33 440.33 400.4010 22.30354 497.448
Valid N
(listwise)
10
RESULTS
Page 37
Table - 4. Summary of descriptive statistics for hyperdivergent study group
(A3)
Time N Range Minimum Maximum Mean Std.
Deviation
Variance
Statistic Statistic Statistic Statistic Statistic Statistic Statistic
T0 10 92.00 306.00 398.00 348.8670 28.15573 792.745
T1 10 10.66 114.67 125.33 120.0320 44.0761 19.427
T2 10 83.00 179.00 262.00 208.7000 26.95377 726.506
T3 10 64.00 207.00 271.00 241.1340 17.58255 309.146
T4 10 82.33 215.00 297.33 274.5330 28.31753 801.882
T5 10 46.00 271.67 317.67 270.7000 17.11105 292.788
T6 10 61.66 295.67 357.33 325.7000 19.02418 361.919
T7 10 75.00 307.00 382.00 354.7670 25.50247 650.376
Valid N
(listwise)
10
RESULTS
Page 38
Table - 5. Compression of occlusal bite force (Newton) measured at different
time intervals in hypodivergent study group A1 and the control group B1
before and during fixed orthodontic treatment (n = 10).
Control Group (B1)
OBF (N)
Study Group (A1)
OBF (N)
Time interval (Mean±SD) (Mean±SD)
Loss
(%)
Recovery
(%)
Before (T0) - 469.40±69.23* - -
1st week (T1) - 191.67±62.89
* 59.17 -
1st month (T2) 580.30±162.53 230.60±60.94 50.87 14.02
2nd
month (T3) 575.28±146.33 275.27±42.42 41.36 30.10
3rd
month (T4) 566.20±154.19 306.60±52.20 34.68 41.38
4th
month (T5) 579.60±149.56 320.60±48.07 31.70 46.42
5th
month (T6) 563.10±145.35 343.90±42.77 26.74 54.81
6th
month (T7) 589.40±132.73 389.20±38.59 17.09 71.12
*denotes significance p<0.05 level
RESULTS
Page 39
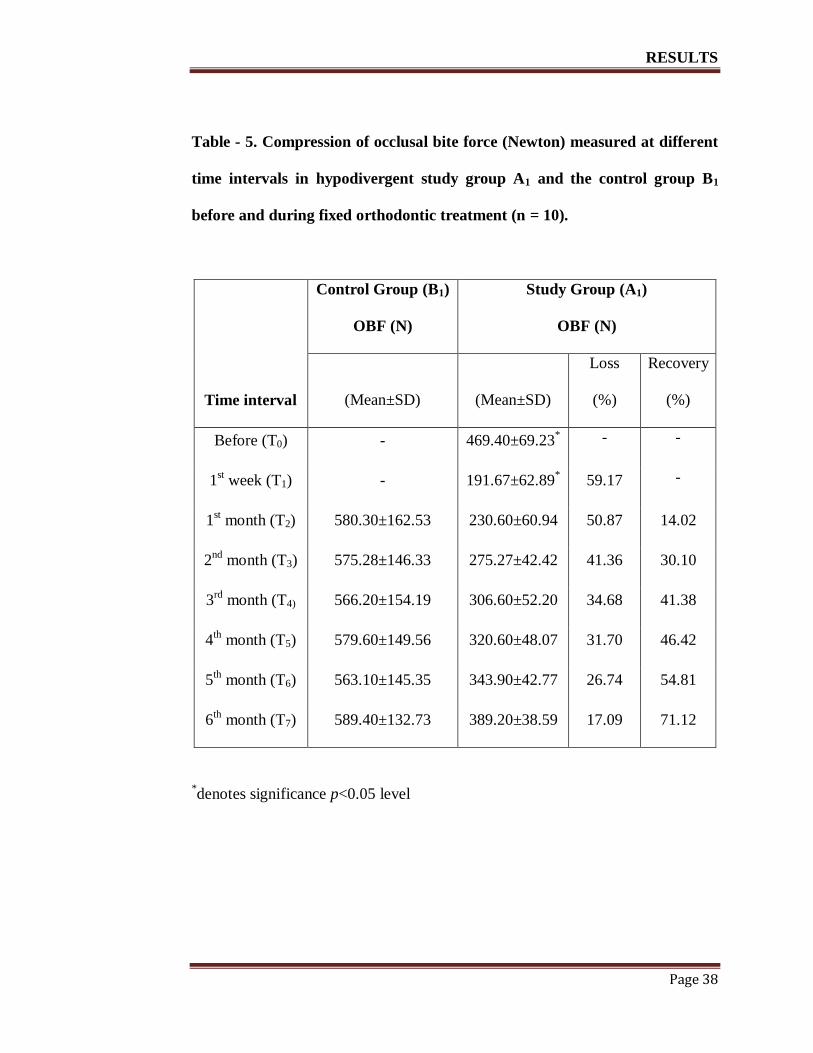
The mean OBF, standard deviation and percentages of OBF loss and
recovery during orthodontic treatment at the different time intervals for control
and study hypodivergent group (B1 & A1), normodivergent group (B2 & A2) and
hyperdivergent group (B3 & A3) are shown in Table - 5, Table - 6 and Table - 7
respectively.
From the repeated measures ANOVA (Within-Subjects) table, the F value
is calculated for the "time" factor, its associated significance level and effect size
("Partial Eta Squared"). The values in the "Greenhouse-Geisser" row were taken
in account for the overall comparison of statistical significant with different study
groups (A1, A2, and A3). The Post hoc tests using the Bonferroni correction, Tests
of Within-Subjects effects table was used to study the overall significant
difference between the means at the different time points (T0 to T7) by pairwise
comparison.
A repeated measures ANOVA with a Greenhouse-Geisser correction
determined that mean OBF differed statistically significant between time points in
study group (A1), the mean scores for OBF in study group (A1) were statistically
significantly different (F (3.133, 28.196) =75.335, p < 0.0005). Post hoc tests
using the Bonferroni correction revealed that in the study group A1 there was no
significant difference in OBF between time T1 and T2 (p =0.301), T2 and T3
(p =0.264), T3 and T4 (p =0.232), T4 and T5 (p =0.619), T5 and T6 (p =0.063), and
RESULTS
Page 40
T6 and T7 (p =0.072), remaining time points are significantly differed at p<0.005
level.
The mean OBF in B1, B2 and B3 control group was 580.30±162.53N,
536.30±162.53N and 480.30±162.53N respectively. The mean OBF in A1, A2, A3
treatment group was 469.40±69.23 N, 435.93±48.47 N and 348.87±28.16 N
respectively (p < 0.005). No significant differences in OBF magnitude were found
over the six month period in the control group (p > 0.05).
A repeated measures ANOVA with a Greenhouse-Geisser correction
determined that mean OBF differed statistically significantly between time points
in study group (A2), the mean scores for OBF in study group (A2) were
statistically significantly different (F (2.352, 21.164) = 132.064, p < 0.0005). Post
hoc tests using the Bonferroni correction revealed that in the study group A2 there
was no significant difference in OBF between time T0 and T7 (p =0.307),
remaining all time points are significantly different at p<0.005 level.
A repeated measures ANOVA with a Greenhouse-Geisser correction
determined that mean OBF are statistically significantly different between time
points in study group (A3), the mean scores for OBF in study group (A3) were
statistically significant difference (F(2.370, 21.329) = 181.543, p < 0.0005). Post
hoc tests using the Bonferroni correction revealed that in the study group A3 there
RESULTS
Page 41
was no significant difference in OBF between time T0 and T6 (p =0.396), T0 and
T7 (p =1.00) and T2 and T3 (p =0.340).
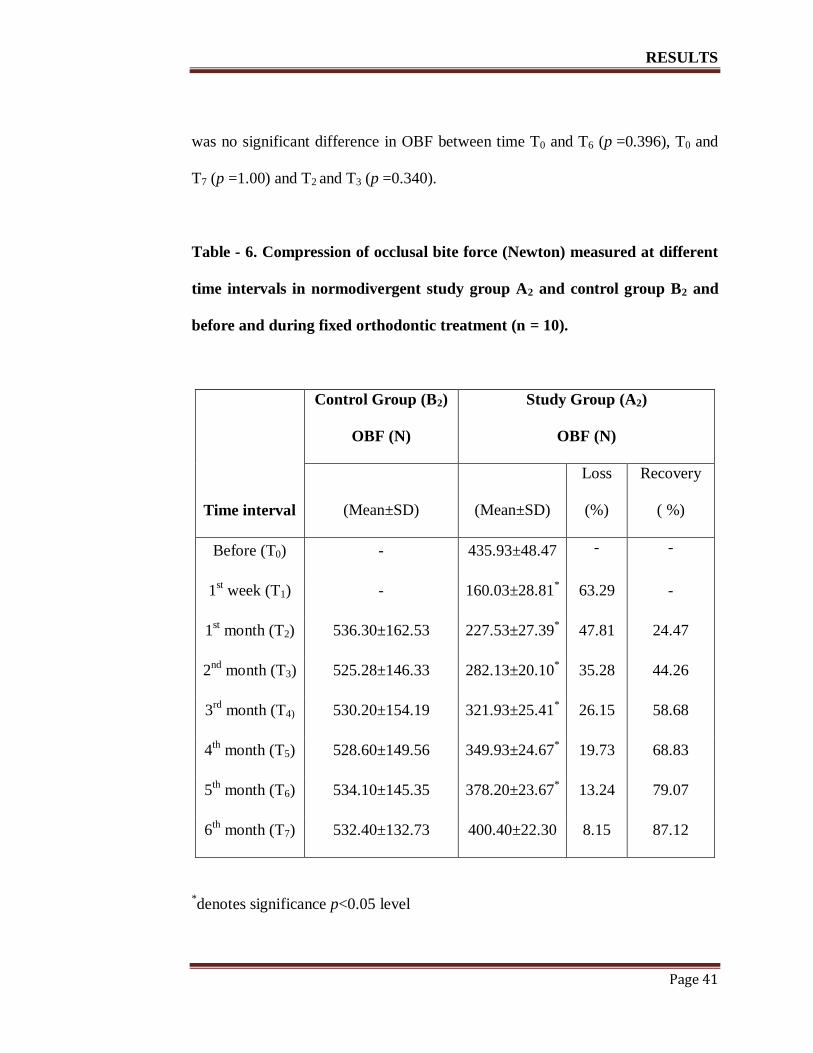
Table - 6. Compression of occlusal bite force (Newton) measured at different
time intervals in normodivergent study group A2 and control group B2 and
before and during fixed orthodontic treatment (n = 10).
Control Group (B2)
OBF (N)
Study Group (A2)
OBF (N)
Time interval (Mean±SD) (Mean±SD)
Loss
(%)
Recovery
( %)
Before (T0) - 435.93±48.47 - -
1st week (T1) - 160.03±28.81
* 63.29 -
1st month (T2) 536.30±162.53 227.53±27.39
* 47.81 24.47
2nd
month (T3) 525.28±146.33 282.13±20.10* 35.28 44.26
3rd
month (T4) 530.20±154.19 321.93±25.41* 26.15 58.68
4th
month (T5) 528.60±149.56 349.93±24.67* 19.73 68.83
5th
month (T6) 534.10±145.35 378.20±23.67* 13.24 79.07
6th
month (T7) 532.40±132.73 400.40±22.30 8.15 87.12
*denotes significance p<0.05 level
RESULTS
Page 42
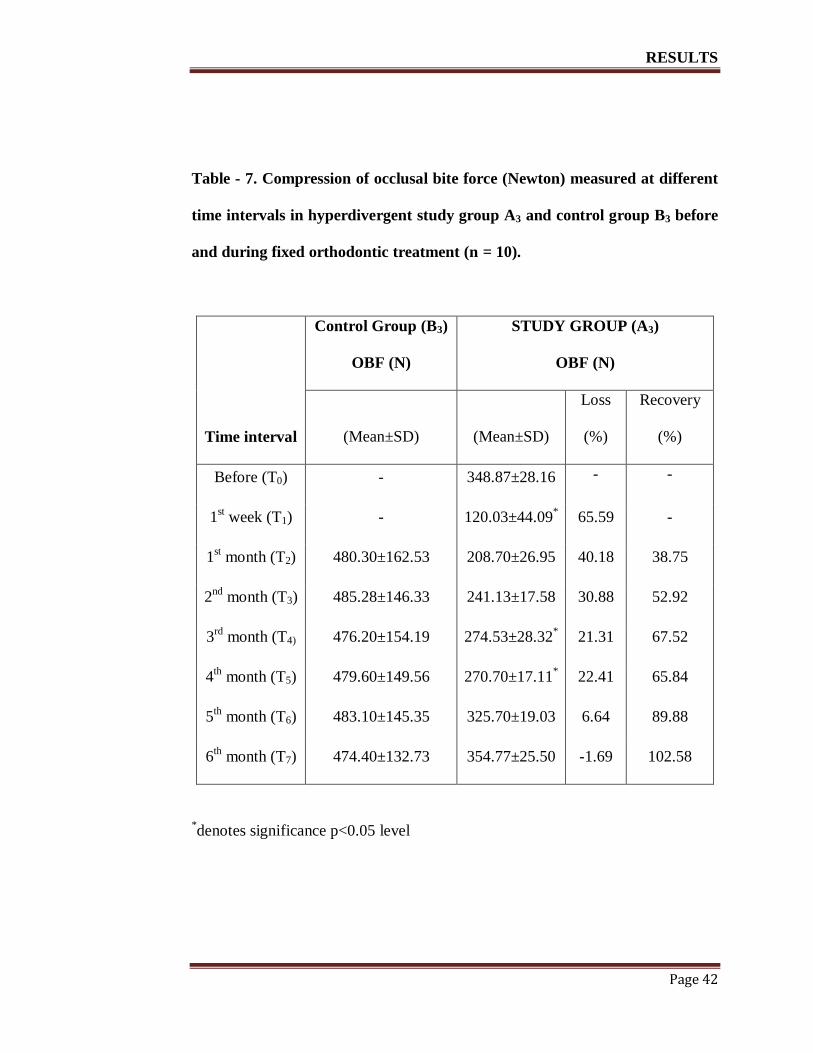
Table - 7. Compression of occlusal bite force (Newton) measured at different
time intervals in hyperdivergent study group A3 and control group B3 before
and during fixed orthodontic treatment (n = 10).
Control Group (B3)
OBF (N)
STUDY GROUP (A3)
OBF (N)
Time interval (Mean±SD) (Mean±SD)
Loss
(%)
Recovery
(%)
Before (T0) - 348.87±28.16 - -
1st week (T1) - 120.03±44.09
* 65.59 -
1st month (T2) 480.30±162.53 208.70±26.95 40.18 38.75
2nd
month (T3) 485.28±146.33 241.13±17.58 30.88 52.92
3rd
month (T4) 476.20±154.19 274.53±28.32* 21.31 67.52
4th
month (T5) 479.60±149.56 270.70±17.11* 22.41 65.84
5th
month (T6) 483.10±145.35 325.70±19.03 6.64 89.88
6th
month (T7) 474.40±132.73 354.77±25.50 -1.69 102.58
*denotes significance p<0.05 level
RESULTS
Page 43
The patterns of OBF changes during orthodontic treatment at different
time intervals (T0 - T7) for hypodivergent (A1), Normodivergent (A2) and
hyperdivergent (A3) treatment group are shown in Fig. 3. There was a significant
difference in OBF values associated with the different time intervals (p < 0.001).
The lowest reported OBF was at T1. The highest reported OBF was at T0 followed
by T7 for hypodivergent treatment group (A1) and normodivergent treatment
group (A2) and highest OBF was at T7 for hyperdivergent treatment group (A3).
Percentage (%) Occlusal Bite Force loss and recovery at different time
intervals in A1, A2 and A3 study group patients, before and during fixed
orthodontic treatment are represented in Fig. 4.
The Occlusal Bite Force loss percentage at T1 is 59.17, 63.29 and 65.59
for hypodivergent, normodivergent and hyperdivergent treatment group
respectively. The Occlusal Bite Force loss percentage at T7 is 17.09, 8.15 and -
1.69 for hypodivergent, normodivergent and hyperdivergent treatment group
respectively. The bite force recovery percentage was high in all study groups at
time T7.
However the recovery percentage is greater for hyperdivergent study
group (A3) of about 102.52%, 87.12% for normodivergent study group (A2) and
71.12% for hypodivergent study group (A1).
RESULTS
Page 44
Figure 3. Changes in occlusal bite force (in Newton) at different time
intervals in A1, A2 and A3 study group, before and during fixed orthodontic
treatment (n = 10; Error bars = S.D).
RESULTS
Page 45
Figure 4. Percentage (%) occlusal bite force loss and recovery at different
time intervals in A1, A2 and A3 group patients, before and during fixed
orthodontic treatment (n = 10).
DISCUSSION
Page 46
DISCUSSION
Improvement of functional efficiency is one of the aims of orthodontic
treatment. Biting efficiency is an important aspect of oral functions. Occlusal bite
force is one of the parameters in assessing the biting efficiency and this force is
likely to change during orthodontic treatment due to changes in interarch cusp and
fossa relationships during tooth movement. Patients wearing fixed appliances
reported higher values for intensities of pressure, tension, pain, and sensitivity to
teeth as compared with those treated with removable orthodontic treatment, as
observed by Stewart et al.57
Hence bite forces are likely to be affected and
masitcatory efficiencies are expected to be compromised during fixed orthodontic
treatment.
Occlusal bite force has been shown to vary in patients with different
vertical facial morphological characteristics.58
Only few studies have addressed
the issue of occlusal bite force changes during fixed appliance orthodontic
treatment.21, 22
Previous reports have measured OBF before and after orthodontic
treatment58
but have not reported OBF during treatment especially in patients with
different facial morphology. In the present study, occlusal bite force changes
during fixed orthodontic treatment in patient with different vertical facial
morphology is analysed. In this study, OBF changes in a control group of subjects
with normal occlusion and in study subjects who were undergoing orthodontic
DISCUSSION
Page 47
treatment, every month during the study period of six months was recorded. As no
significant changes in OBF values were found in the control group over the six
months, the changes in OBF measured in study subjects during this study were
considered a result of orthodontic treatment.
In the present study Subjects aged 15 years and above were recruited as
previous evidence suggested that OBF increases with age to stabilise after the age
of 14 years. With physiological aging process the bite forces start declining from
about 50 years of age. In children with permanent dentition between the ages of 6
and 18, bite force has been significantly correlating with age. However, Varga et
al.60
found that there was minimal increase in bite force following the cessation of
the pubertal growth spurt.
Gnathodynamometers have been used to measure bite force for a long
time and some investigators use strain-gauges mounted dynamometer for
recordings.61
Recently, deformation-sensitive piezoelectric film has been
employed as a force detection recording system.62
Another recording device is the
dental prescale system which consists of a horse-shoe shaped bite foil of a
pressure-sensitive film and a computerized scanning system for analysis of the
load. When the force is applied to occlusal contact, a graded colour is produced
by the chemical reaction. The exposed pressure-sensitive foils (PSF) are analyzed
in the occlusal scanner. The scanner reads the area and colour intensity of the red
DISCUSSION
Page 48
dots to assess occlusal contact area and pressure. Finally, it calculates occlusal
loads automatically.63
The present study employed a strain gauge transducer with a biting
element encased in polymeric covering. The most widely accepted bite force
recording device is the strain-gage bite force transducer.3 The biting element is
encased in a polymeric material which provides a comfortable surface for
maximum bite force. Tortopidis et al16
have used acrylic appliances in contact
with the metal faces of the strain-gage transducers to minimize the risk of
fracturing teeth when biting hard on the transducer. It had been reported that when
the subject bites the hard metal surface of transducer, the neuromuscular reaction
of subject generates irregular movements that prevent maximum bite force.
Malocclusions are often associated with reduced OBF.17
In the present
study, the OBF in the treatment group, each of which possessed a Class I
malocclusion, exhibited lower OBF values prior to treatment, compared with a
control group with acceptable occlusions. This supports previous findings which
reported that masticatory performance is highest in subjects with Class I
occlusions followed by Class I, Class II and Class III malocclusions in descending
order.18
DISCUSSION
Page 49
Maximum bite force varies with varying cranio-facial morphology. In the
present study the OBF among the study group hyperdivergent facial morphology
exhibited lower occlusal bite force and hypodivergent facial morphology
exhibited higher occlusal bite force when compared to normodivergent facial
morphology. This confirms the previous finding that short-faced people exhibit
stronger bite force and the long-faced type of the cranio-facial morphology has
been associated with smaller value of the bite force.57
A, a large reduction in OBF (50%) occurred at the end of the first week
following the placement of separators. It is well-known that placement of
orthodontic separators (brass wire, elastomerics, spring type steel separators, and
latex elastics) results in a painful experience for almost all patients.63
An
electromyographic (EMG) study, performed to evaluate the motor and sensory
changes associated with separator placement, showed a decrease in motor output
as well as pressure pain threshold in muscles of mastication.64
They suggested this
to be a protective mechanism against further damage to the injured part of the
masticatory system. It is clear that pain is associated with the process of
orthodontic separation and starts within 4 hours of its placement with a peak level
at day 2 that might last for 7 days.
DISCUSSION
Page 50
The results of the present study confirmed those of Thomas et al.22
who
reported a reduction in OBF during treatment. In addition, the present results were
supported by Goldreich et al.66
who suggested that orthodontic adjustments
tended to reduce functional muscle activity. This was explained by transient
changes in occlusal support, periodontal mechanoreceptor effects and jaw elevator
muscle reflexes. The reduction in OBF observed in the present study may be due
to changes in occlusal contacts which occurred during treatment, as it was
previously reported that occlusal contacts determine 10% to 20% of the variation
of maximum bite force in adults.
OBF showed a tendency to return to pretreatment levels after the second
month of orthodontic treatment in the present study. Pain associated with initial
archwire placement has been previously researched. Jones (1984)67
reported that
pain is experienced by the majority of patients 4 hours after archwire placement,
which will peak at 24 hours and then decline. The pain will usually last for 2 – 3
days and will gradually decrease in its intensity by fifth or sixth day. Smith et al68
and Goldreich et al.66
, through different experiments, evaluated the effect of
orthodontic archwire activation on the masseter muscle through EMG activity.
They observed a reduction in masseter muscle activity and attributed this to the
noxious stimuli emulating from the periodontal membrane or paradental receptors
triggering a reflex mechanism, which caused inhibition of jaw-closing muscles.
DISCUSSION
Page 51
In the present study, Bite force remained significantly reduced during the
first week and in the first month and then gradually increased which may be due
to reduction in the occlusal disturbances and increase in the pain threshold for the
patients.
OBF shows a tendency to return to pretreatment level in treatment group
at the completion of aligning and leveling stage of fixed orthodontic treatment.
This may be due to the increase in the occlusal contact area by improvement in
alignment of teeth and leveling the curve of spee and correction .This is in
accordance to the previous studies which states that leveling the curve of spee
increases the occlusal contact area of the posterior teeth.69
OBF shows a tendency to return to pretreatment in hyperdivergent
treatment group and OBF reaches beyond the pretreatment level but is statistically
insignificant.OBF showed a tendency to reach close to the pretreatment in
normodivergent and hypodivergent treatment group. This may be due to the delay
in the time interval during the alignment and leveling stage in hypodivergent
vertical facial morphology. Researchers have suggested a significant correlation
between bite force and muscle thicknesses and between masseter-temporal muscle
thickness and facial morphology.47
In this respect, Farella et al12
have stated that
masseter muscles are thicker in shortfaced subjects than in normal or long-faced
subjects.
DISCUSSION
Page 52
Ferrario et al71
have observed that males have larger teeth size and a
correspondingly larger periodontal area and therefore record a higher bite force as
compared to females. In contrast, Wichelhaus et al72
have studied the functional
forces occurring during nocturnal sleep and found found no significant differences
in bite force between males and females. They have suggested that it might be due
to the small number of subjects included in their study. Even if some authors have
found a non-significant gender effect, most studies have confirmed the differences
of bite force values between males and females. OBF finding may be affected by
gender was not an aim of this study.
LIMITATIONS
This study was done only during initial stages of aligning and leveling only.
Further studies are recommended to check the bite force levels during and post
orthodontic treatment also.
Further studies with larger sample sizes can be done for further affirmations and
clarifications.
Yurkatas et al opines that in post orthodontics phase, muscle’s ability to
rebuild and strengthen increases, reversing the typical avoidance of tough foods
that prevailed during active treatment time. Furthermore, as in the study of Bakke
et al,1 bite force correlated with the number of occlusal contacts and that the peak
force was reached three months after debonding.
DISCUSSION
Page 53
Considering these views, it also recommended that the bite force value be
assessed in post orthodontic phase.
DISCUSSION
Page 54
SUMMARY AND CONCLUSION
Page 54
SUMMARY AND CONCLUSION
Occlusal Bite Force (OBF) is one of the important parameters to assess
optimal functional status of occlusion or the masticatory performance. The OBF
has been reported to differ with varying facial patterns. Changes in interocclusal
relationships during orthodontic treatment do cause occlusal disturbances and are
likely to disturb OBF. Evaluating the same in patients with different vertical facial
morphology will enable us to understand the changes in their masticatory
efficiency during treatment and would enable the clinician to take steps to
minimise disturbances, like reducing force levels and discomforts and thereby
improving the quality of mastication even during orthodontic treatment.
Therefore this study was done to assess the changes in maximum
voluntary bite force during aligning and leveling stage of fixed orthodontic
appliance treatment in patients with different vertical facial morphology and to
Compare and assess deviation of bite force in malocclusion patients with different
facial types with the optimal bite force value estimated in individuals with
acceptable occlusion and of different facial types.
SUMMARY AND CONCLUSION
Page 55
30 patients age group of 14-24 yrs, were divided in to 3 groups as
hypodivergent, normodivergent and hyperdivergent groups and their OBF was
recorded during the study period of six months and anlaysed.
From the findings observed in the study it can be concluded that
OBF is altered due to fixed orthodontics.
Occlusal bite force is reduced to 50% of the pretreatment level by the end
of the first week of fixed orthodontic treatment.
OBF showed a tendency to return to pretreatment levels after the second
month of orthodontic treatment.
Occulusal bite force is least, average and higher in hyperdivergent ,
normodivergent and hypodivergent individuals respectively, with or
without orthodontic treatment.
After aligning and leveling stage, the OBF reaches the baseline level in
hyperdivergent treatment group, while it reaches close to pretreatment
level in hypodivergent and normodivergent treatment groups.
BIBLIOGRAPHY
Page 55
BIBLIOGRAPHY
1. Bakke, M. Bite Force and Occlusion. Sem in Ortho, 2006; 12: 120-126.
2. Hatch, J., Shinkai, R., Sakai, S., Rugh, D., & Paunovich, E.
Determinants of masticatory performance in dentate adults. Archives of
Oral Biology, 2001; 46: 641-648.
3. Koc, D., A. Dogan, & B. Bek. Bite Force and influential factor on bite
force measurements: A Literaturre Review. Eur J Denti, 2010; 4: 223-232.
4. Carlsson, G. E. Bite force and chewing efficiency. Frontiers of oral
physiology, 1974; 1: 265-292.
5. Sasaki, K., Hannam, A. G. & Wood, W. W. Relationships between the
size, position, and angulation of human jaw muscles and unilateral first
molar bite force. Journal of Dental Research, 1989; 68: 499-503.
6. Kiliaridis, S., Kjellber, G, H., Wenneberg, B. & Engström, C. The
relationship between maximal bite force, bite force endurance, and facial
morphology during growth. A cross-sectional study. Acta Odontologica
Scandinavica, 1993a; 51: 323-331.
7. Şahin, S., Çehreli, M. C. & Yalçin, E. The influence of functional forces
on the biomechanics of implant-supported prostheses. Journal of
Dentistry, 2002; 30: 271-282.
8. Haraldson, T., Karlsson, U. & Carlsson, G. E. Bite force and oral
function in complete denture wearers. J Oral Rehab, 1979; 6: 41-48.
BIBLIOGRAPHY
Page 56
9. Helkimo, E., Carlsson, G. E. & Carmeli, Y. Bite force in patients with
functional disturbances of the masticatory system. Journal of Oral
Rehabilitation, 1975; 2: 397-406.
10. Kampe, T., T. Haraldson, H. Hannerz, & G.E. Carlsson. Occlusal
percepsion and bite force in young subjects with or without dental fillings.
Acta Odontologica Scandinavica, 1987; 45: 101-107.
11. Ingervall, B., & Minder, C. Correlation between maximum bite force
and facial morphology in children. Angle Orthod, 1997; 67: 415-422.
12. Farella, M., Bakke, M., Michelotti, A., Rapuano, A., & Martina, R.
Masseter thickness, endurance and exercise-induced pain in subjects with
different vertical cranio-facial morphology. Eur J Oral Sci, 2003; 111:
183-188.
13. Braun, S., Bantleon, H., Hnat, W., Freudenthaler, J., Marcotte, M.,
& Johnson, B. A study of bite force, part 1: relationship to various
physical characteristics. Angle Orthod, 1995; 65: 367-372.
14. Shinogaya, T., Bakke, M., Thomsen, C.E., Vilmann, A., & Sodeyama,
A. Effects of ethnicity, gender and age on clenching force and load
distribution. Clinical Oral Investigation, 2001a; 5: 63-68.
15. Morita, M., Nishi, K., Kimura, T., Fukushima, M., Watanabe, T.,
Yamashita, F., & Zhou Yang, J. Xu. Correlation between periodontal
status and biting ability in Chinese adults population. J Oral Rehabil,
2003; 30: 260-264.
BIBLIOGRAPHY
Page 57
16. Tortopidis, D, Lyons, M. F, Baxendle, R. H, & Gilmour, W. H. The
variability of bite force measurements between sessions, in different
positions within the dental arch. J Oral Rehabil, 1998; 25: 681-686.
17. English, J. D, Buschang, P. H, & Throckmorton, G. S. Does
malocclusion affect masticatory performance. Angle Orth, 2002;72: 21-27.
18. Araújo, S. C. C. S, Vieira, M. M, Gasparotto, C. A, & Bommarito, S.
Bite force analysis in different types of angle malocclusions. Angle Orth,
19. Sonnesen, L., & Bakke, M. Bite force in children with unilateral
crossbite before and after orthodontic treatment. A prospective
longitudinal study. Eur J Orthod, 2007a; 29: 310-313.
20. Winocur, E., Davidov, I., Gazit, E., Brosh, T., & Vardimon, A. Centric
slide, bite force and muscle tenderness changes over 6 months following
fixed orthodontic treatment. Angle Orthod, 2007; 77: 254-259.
21. Yawaka, Y., Hironaka, S., Akiyama, A., Matzuduka, I., Takasaki, C.,
& Oguchi, H. Changes in occlusal contact area and average bite pressure
during treatment of anterior crossbite in primary dentition. J Clin Pediatr
Dent, 2003; 28: 75-79.
22. Thomas, G., Throckmorton, G., Ellis, E., & Sinn, D.P. The effects of
orthodontic treatment on isometric bite forces and mandibular motion in
patients prior to orthognathic surgery. J Oral Max Surg, 1995;53:673-687.
23. Mountain, G. Bite characteristics of children and the fidelity of testing
method as they apply to toy safety. Ph. D. thesis, university of Leeds.
2008.
BIBLIOGRAPHY
Page 58
24. Black, G. V. The Force exerted in the closure of the jaws. Dent Cosmos,
1895.
25. Sonneson, L., Bakke, M., & Solow, B. Temporomandibular disorders
in relations to cranio-facial dimensions, head posture and bite force
in children selected for orthodontic treatment. Eur J Orthod,
2001a; 23: 179-192.
26. Lindquist, B., & M. Rinqvist. Bite force in children with bruxism .Acta
Odontologica Scandinavica, 1973; 31: 255-259.
27. Calderon, P. S., E. M. Kogawa, J. R. P. Lauris, & P. C. R. Conti. The
influence of gender and bruxism on the human maximum bite force.
Journal of Applied Oral Science, 2006; 14: 448-453.
28. Rismanchian, M., F. Bajoghli, Z. Mostajeran, A. Fazel & P.
Eshkevori. Effects of implants on maximum bite force in
edentulous patients. Journal of Oral Implantology, 2009; 35: 196-
200.
29. Van der Built. Assessment of mastication with implications for oral
rehabilitation. Review article. Journal of oral rehabilitation, 2011; 38:
754-780.
30. Ow, R. K., Carlsson, G. E. & Jemt, T. Biting forces in patients with
craniomandibular disorders. Cranio: the journal of craniomandibular
practice, 1989; 7: 119.
31. Bakke, M., A. Tuxen, P. Vilmann, B. R. Jensen, A. Vilmann, & M.
Toft. Ultrasound image of human masseter muscle related to bite force,
BIBLIOGRAPHY
Page 59
electromyography, facial morphology, and occlusal factors. Scandinavian
Journal of Dental Research. 1992; 100: 164-171.
32. Julien, K. C., Buschang, P. H., Throck morton, G. S., & Dechow, P.
C. Normal masticatory performance in young adult and children. Arch
Oral Biol, 1996; 41: 69-75.
33. Rentes, A. M., M. B .D. Gaviao & J. R. Amaral. Bite force
determination in children with primary dentition. Journal of oral
rehabilitation, 2002; 29: 1174-1180.
34. Koc, D., Doǧan, A., & Bek, B. Effect of gender, facial dimensions, body
mass index and type of functional occlusion on bite force. Journal of
Applied Oral Science, 2011; 19: 274-279.
35. Toro, A., P. H. Buschange, G. Throckmorton, & S. Roldan.
Masticatory performance in children and adolescents with class
I and II malocclusions. European journal of Orthodontics, 2006; 28:
112-119.
36. Sonnesen, L., & Bakke, M. Molar bite force in relation to occlusion,
craniofacial dimensions, and head posture in pre-orthodontic children.
European Journal of Orthodontics, 2005; 27: 58-63.
37. Kiliaridis, S., Kjellberg, H., Wenneberg, B. & Engström, C. The
relationship between maximal bite force, bite force endurance, and facial
morphology during growth. A cross-sectional study. Acta Odontologica
Scandinavica, 1993b; 51: 323-331.
BIBLIOGRAPHY
Page 60
38. Bakke, M., Holm, B., Jensen, B. L., Michler, L. & Möller, E.
Unilateral, isometric bite force in 8-68-year-old women and men related to
occlusal factors. Scandinavian Journal of Dental Research, 1990; 98: 149-
158.
39. Sonnesen, L., Bakke, M., & Solow, B. Temporomandibular disorders
in relations to cranio-facial dimensions, head posture and bite force
inn children selected for orthodontic treatment. Eur J Orthod,
2001b; 23: 179-192.
40. Yurkastas, A. A. The masticatory act. A review. Journal of Prosthetic
Dentistry. 1965; 15: 248-262.
41. Mountain, G., D. Wood & J. Toumba. Bite force measurements in
children with primary dentition. International journal of paediatric
dentistry, 2011; 21: 112-118.
42. Castelo, P. M., M. B. Gaviao, L. J. Pereira, & L. R. Bonjardim.
Masticatory muscle thickness, bite force and occlusal contacts in
young children with unilateral posterior crossbite. European Journal
of Orthodontics, 2007; 29: 149-156.
43. Kamegai, T., Tatsuki, T., Nagano, H., Mitsuhashi, H., Kumeta, J.,
Tatsuki, Y. & Inaba, D. A determination of bite force in northern
Japanese children. European Journal of Orthodontics, 2005; 27: 53-57.
44. Proffit, W. R., Fields, H. W. & Nixon, W. L. Occlusal forces in normal
and long- face adults. Journal of Dental Research, 1983; 62: 566-570.
BIBLIOGRAPHY
Page 61
45. Lemos, A. D., F. R. Gambareli, M. D. Serra, R. L. Pocztaruk, M. B.
Gaviao. Chewing performance and bite force in children. Brazilian Journal
of Oral sciences. 2006; 5: 1101-1108.
46. Shinogaya, T., Bakke, M., Thomsen C. E., Vilmann A., Sodeyama A.
& Matsumoto, M.. Effects of ethnicity gender and age on clenching force
and load distribution. Clinical oral investigations, 2000b; 5: 63-68.
47. Pizolato, R. A., Gavião, M. B. D., Berretin-Felix, G., Sampaio, A. C.
M. & Trindadejr, A. S. Maximal bite force in young adults with
temporomandibular disorders and bruxism. Brazilian Oral Research,
2007; 21:278-283.
48. Pereira, L. J., Steenks, M. H., De Wijer, A., Speksnijder, C. M. & Van
Der Bilt, A.. Masticatory function in subacute TMD patients before and
after treatment. Journal of Oral Rehabilitation, 2009; 36: 391-402.
49. Kogawa, E. M., Calderon, P. S., Lauris, J. R. P., Araujo, C. R. P. &
Conti, P. C. Evaluation of maximal bite force in temporomandibular
disorders patients. Journal of Oral Rehabilitation, 2006; 33: 559-565.
50. Alkan, A., Keskiner, I., Arici, S. & Sato, S. The effect of periodontitis
on biting abilities. Journal of Periodontology, 2006; 77: 1442-1445.
51. Williams, W. N., Low, S. B., Cooper, W. R. & Cornell, C. E. The effect
of periodontal bone loss on bite force discrimination. Journal of
Periodontology, 1987; 58: 236.
BIBLIOGRAPHY
Page 62
52. Helkimo, E., Carlsson, G. E. & Carmeli, Y. Bite force in patients with
functional disturbances of the masticatory system. Journal of Oral
Rehabilitation, 1975; 2:397-406.
53. Linderholm, H. & Wennström, A. Isometric bite force and its relation to
general muscle force and body build. Acta Odontologica Scandinavica,
1970; 28: 679-689.
54. Tortopidis, D., Lyons, M. F., Baxendale, R. H. & Gilmour, W. H. The
variability of bite force measurement between sessions, in different
positions within the dental arch. Journal of Oral Rehabilitation, 1998b;
25: 681-686.
55. Mountain, G. D., Wood, & J. Toumba. Bite force measurements in
children with primary dentition. International journal of paediatric
dentistry, 2011; 21: 112-118.
56. Fernandes, C. P., Glantz, P. O. J., Svensson, S. A. & Bergmark, A. A
novel sensor for bite force determinations. Dental Materials, 2003; 19,
118- 126.
57. Stewart, F. N., Kerr, W. J. S., & Taylor, P. J. S. Appliance wear, the
patient’s point of view. European Journal of Orthodontics, 1997; 19: 377-
382.
58. Abu Alhaija, E., Al Zo'ubi, I., Al Rousan, M., & Hammad, M.
Maximum occlusal bite forces in Jordanian individuals with different
dentofacial vertical skeletal patterns. Eur J Orthod, 2010; 32: 71-77.
BIBLIOGRAPHY
Page 63
59. Sonnesen, L., & Bakke, M. Bite force in children with unilateral
crossbite before and after orthodontic treatment. A prospective
longitudinal study. Eur J Orthod, 2007b; 29: 310-313.
60. Varga, S., Spalj, S., Varga, M., Milosevic, S., Mestrovic, S., & Slaj, M.
Maximum voluntary molar bite force in subjects with normal occlusion.
Eur J Orthod, 2011; 33: 427-433.
61. Linderholm, H., & Wennström, A. Isometric bite force and its relation
to general muscle force and body build. Acta Odontol Scand, 1970; 28:
679-689.
62. Takeuchi, H., Ikeda, T., & Clark, G.T. A piezoelectric film-based
intrasplint detection method for bruxism. J Pros Dent, 2001; 86: 195-202.
63. Ortuğ, G. A new device for measuring mastication force. Ann Anat, 2002;
184: 393-363.
64. Ngan, P., Kess, B., & Wilson, S. Perception of discomfort by patients
undergoing orthodontic treatment. Am J Orthodontics and Dentofacial
Orthopedics 1989; 96: 47-53.
65. Michelotti, A., Farella, M., & Martina, R. Sensory and motor changes
of the human jaw muscles during induced orthodontic pain. European
Journal of Orthodontics, 1999; 21: 397.
66. Goldreich, H., Gazit, E., & Lieberman, M. The effect of pain from
orthodontic arch wire adjustment on masseter muscle electromyographic
activity. Am J Orthod Dentofacial Orthop, 1994; 106: 365-370.
BIBLIOGRAPHY
Page 64
67. Jones, M. L. An investigation into the initial discomfort caused by
placement of an archwire. Eur J Orthodontics, 1984; 6: 48-54.
68. Smith, B. R., Flanary, C. M., Hurst, L. L., & Rugh, J. D. Effects of
orthodontic archwire changes on masseter muscle activity. Journal of
Dental Research, 1984; 63: 258 (abstract).
69. Sawsan, A., Alomari., Elham, S., & Abu Alhaija. Occlusal bite force
changes during 6 months of orthodontic treatment with fixed appliances
Aust Orthod J, 2012; 28: 197-203.
70. De Praeter, J., & Dermaut, L., Long term stability of the leveling of the
curve of spee. Am J Orthod Dentofacial Orthop, 2002; 121: 266-272.
71. Ferrario, V. F, S forza, C., Zanotti, G., & Tartagilia, G. M. Maximal
bite force in healthy young adults as predicted by surface
electromyography. J Dent., 2004; 32: 451-457.
72. Wichelhaus, A., Hüffmeier, S., & Sander, F. G. Dynamic functional
force measurements on an anterior bite plane during the night. J Orofac
Orthop, 2003; 64: 417-425.
73. Yurkstas, A. The effect of masticatory exercise on the maximum force
tolerance of individual teeth. J Dent Res, 1953; 32: 322–327.
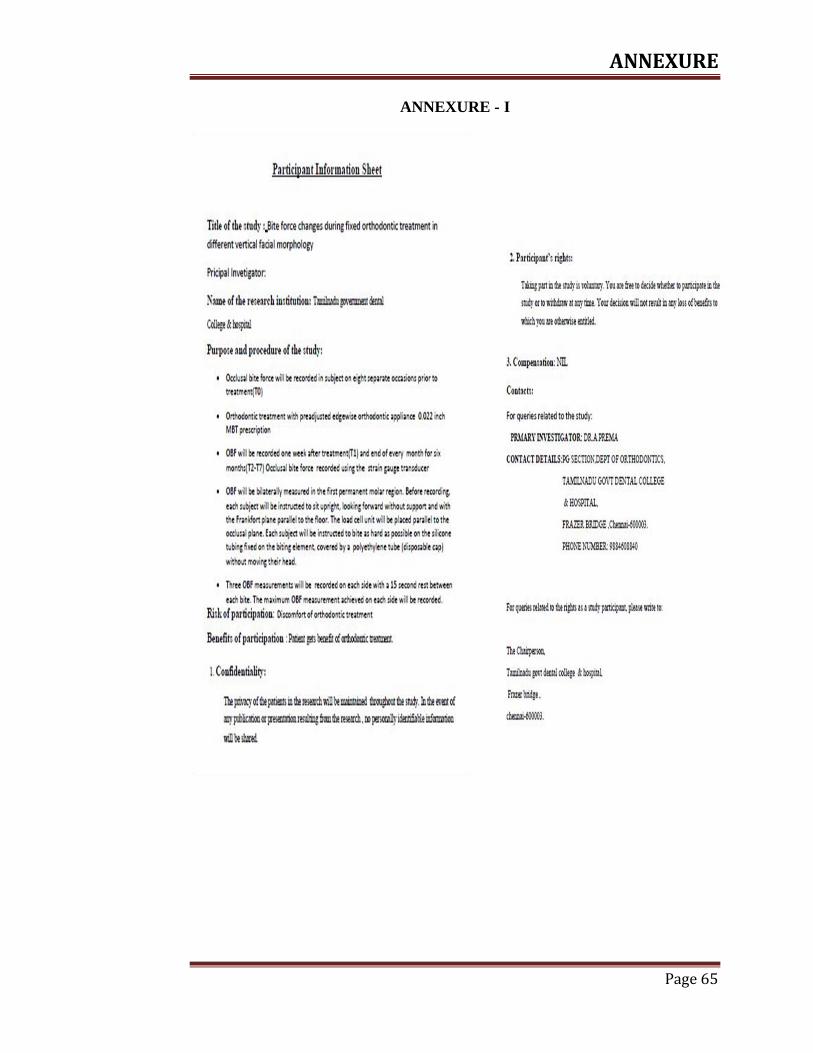
ANNEXURE
Page 65
ANNEXURE - I
ANNEXURE
Page 66
ANNEXURE - II
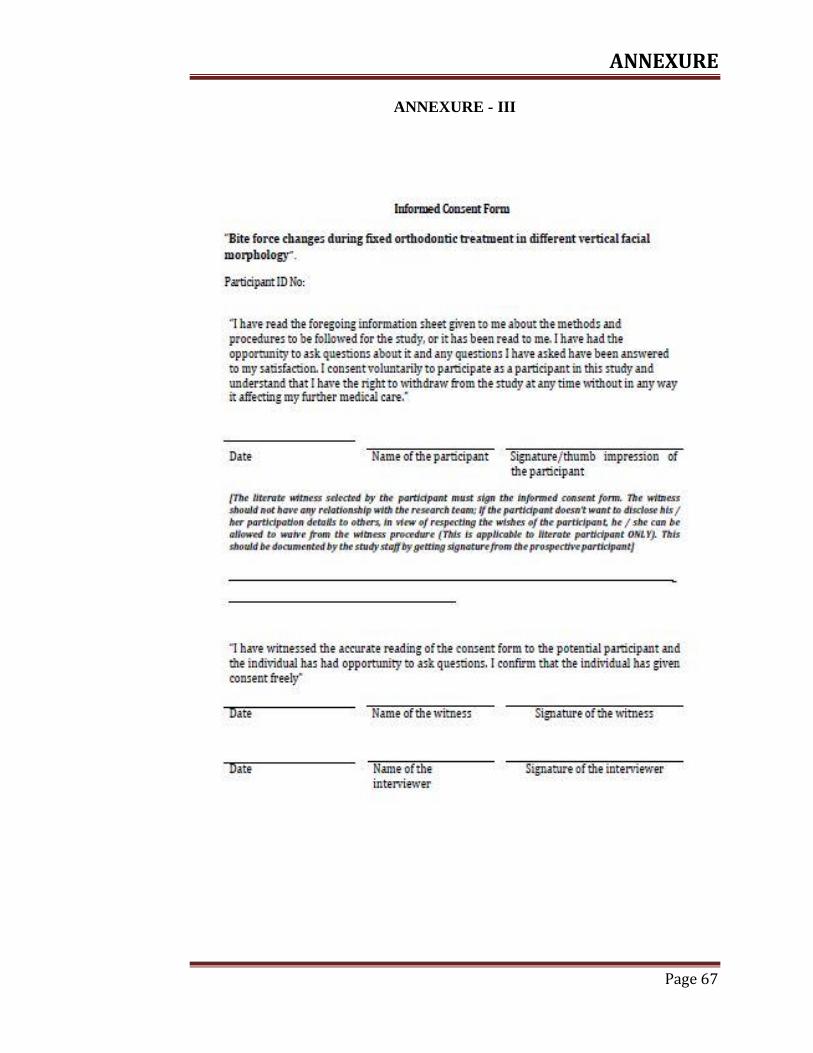
ANNEXURE
Page 67
ANNEXURE - III
ANNEXURE
Page 68
ANNEXURE - IV
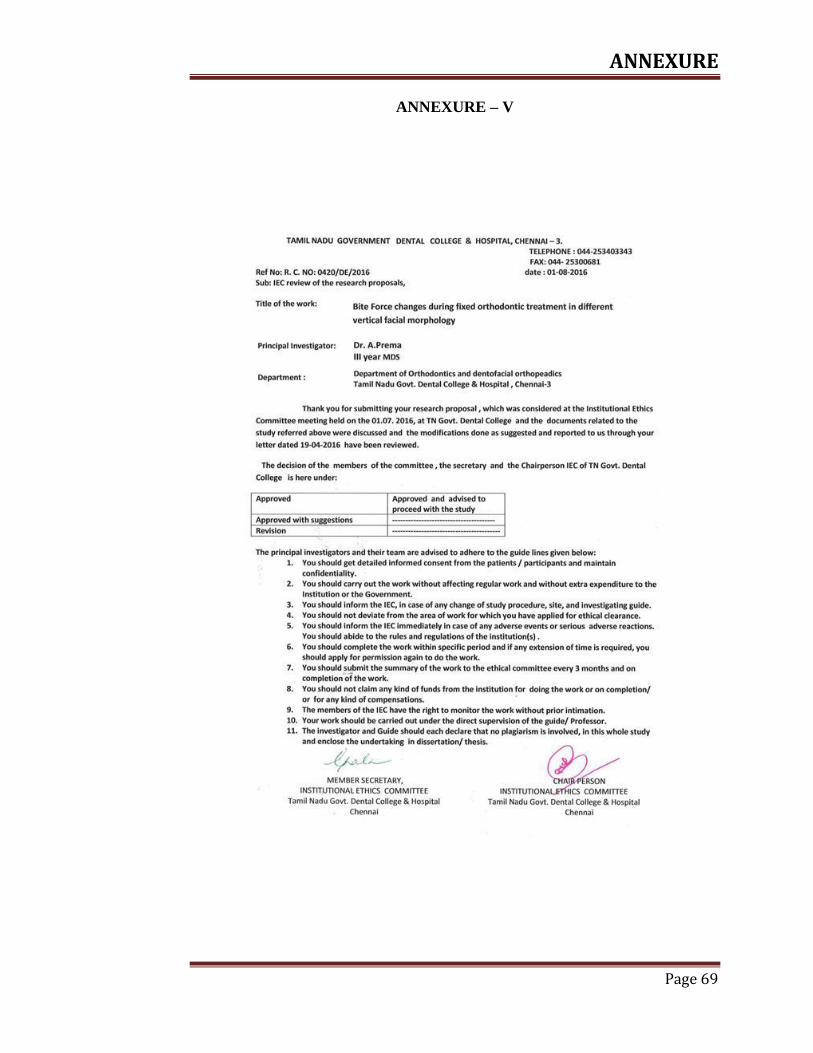
ANNEXURE
Page 69
ANNEXURE – V
Recommended