Offering Circular Supplement(To Offering CircularDated June 1, 2010)
$905,431,677
Freddie MacMulticlass Certificates, Series 4011
Offered Classes: REMIC Classes shown below and MACR Classes shown on Appendix A
Offering Terms: The underwriter named below is offering the Classes in negotiated transactions at varying prices.
Closing Date: March 30, 2012
REMICClasses
OriginalBalance
PrincipalType(1)
ClassCoupon
InterestType(1)
CUSIPNumber
Final PaymentDate
Group 1BA . . . . . $15,000,000 SC/SEQ 4.0% FIX 3137AMWW3 September 15, 2041DA . . . . . 32,262,094 SC/SEQ 4.0 FIX 3137AM X J 1 September 15, 2041ZA . . . . . 1,000 SC/SEQ 4.0 FIX/Z 3137AM Z P 5 September 15, 2041
Group 2IK . . . . . 5,351,200 NTL(PAC) 2.5 FIX/IO 3137AM Y 5 0 March 15, 2022KE . . . . . 20,000,000 SUP 2.5 FIX 3137AM Y J 0 March 15, 2022KM . . . . . 26,756,000 PAC 2.0 FIX 3137AM Y K 7 March 15, 2022KZ . . . . . 2,000 SUP 2.5 FIX/Z 3137AM Y L 5 March 15, 2022
Group 3BI . . . . . 32,181,818 SC/NTL(PT) 5.5 FIX/IO 3137AMWZ6 March 15, 2040BM . . . . . 59,000,000 SC/PT 1.5 FIX 3137AM X 3 6 March 15, 2040
Group 4GB . . . . . 10,000,000 SEQ 3.5 FIX 3137AM X Y 8 June 15, 2039GL . . . . . 2,232,000 SEQ 3.5 FIX 3137AM Y 2 7 March 15, 2042
Group 5AA . . . . . 1,645,000 SUP/RTL 3.5 FIX 3137AMWQ6 August 15, 2040BB . . . . . 2,900,000 SUP/RTL 3.5 FIX 3137AMWX1 March 15, 2041CC . . . . . 1,475,000 SUP/RTL 3.5 FIX 3137AM X 7 7 October 15, 2041DD . . . . . 2,000,000 SUP/RTL 3.5 FIX 3137AMXM4 March 15, 2042EE . . . . . 1,200,000 SUP/RTL 3.0 FIX 3137AM X T 9 August 15, 2040GG . . . . . 1,200,000 SUP/RTL 4.0 FIX 3137AM X Z 5 August 15, 2040NB . . . . . 20,630,000 PAC 4.5 FIX 3137AM Y Z 4 August 15, 2041NE . . . . . 2,850,076 PAC 3.5 FIX 3137AM Z 3 4 March 15, 2042NH . . . . . 100,000 SUP 3.5 FIX 3137AM Z 4 2 March 15, 2041NJ . . . . . 1,525,000 SUP 3.5 FIX 3137AM Z 6 7 October 15, 2041NK . . . . . 528,000 SUP 3.5 FIX 3137AM Z 7 5 March 15, 2042NP . . . . . 35,390,000 PAC 3.0 FIX 3137AM Z A 8 July 15, 2039NQ . . . . . 5,870,000 PAC 3.0 FIX 3137AM Z B 6 August 15, 2041
Group 6FA . . . . . 51,428,571 PT (2) FLT 3137AMXW2 March 15, 2042FB . . . . . 25,551,854 SUP (2) FLT/DLY 3137AM X X 0 March 15, 2042IB . . . . . 14,601,060 NTL(SUP) (2) INV/IO/S/DLY 3137AM Y 3 5 March 15, 2042PA . . . . . 83,012,041 PAC 2.0 FIX 3137AM Z E 0 June 15, 2041PI . . . . . 27,670,680 NTL(PAC) 4.5 FIX/IO 3137AM Z F 7 June 15, 2041PL . . . . . 5,406,474 PAC 3.5 FIX 3137AM Z G 5 March 15, 2042S . . . . . 14,601,060 SUP (2) INV/S/DLY 3137AM Z M 2 March 15, 2042SA . . . . . 51,428,571 NTL(PT) (2) INV/IO 3137AM Z N 0 March 15, 2042
Group 7ZD . . . . . 52,324,189 SC/SEQ 6.0 FIX/Z 3137AM Z R 1 October 15, 2036ZE . . . . . 29,432,357 SC/SEQ 6.0 FIX/Z 3137AM Z S 9 October 15, 2036
Group 8ZG . . . . . 50,054,397 SC/SEQ 5.0 FIX/Z 3137AM Z T 7 May 15, 2038
REMICClasses
OriginalBalance
PrincipalType(1)
ClassCoupon
InterestType(1)
CUSIPNumber
Final PaymentDate
ZH . . . . . $24,653,658 SC/SEQ 5.0% FIX/Z 3137AM Z U 4 May 15, 2038
Group 9CW . . . . . 17,203,000 SC/SEQ/PAC 3.5 FIX 3137AM X G 7 January 15, 2042CY . . . . . 12,458,000 SC/SEQ/PAC 3.5 FIX 3137AM X H 5 January 15, 2042
Group 10MC . . . . . 3,722,423 SUP 3.0 FIX 3137AM Y Q 4 March 15, 2027MI . . . . . 5,130,000 NTL(PAC) 3.0 FIX/IO 3137AM Y V 3 March 15, 2027MP . . . . . 15,390,000 PAC 2.0 FIX 3137AM Y X 9 March 15, 2027
Group 11DG . . . . . 50,000,000 SEQ 2.5 FIX 3137AM X N 2 February 15, 2026DU . . . . . 3,000,000 SEQ 2.5 FIX 3137AM X R 3 September 15, 2026DW. . . . . 3,000,000 SEQ 2.5 FIX 3137AM X S 1 March 15, 2027
Group 12CA . . . . . 10,258,484 SUP 3.0 FIX 3137AM X 6 9 March 15, 2032CI . . . . . 10,000,000 NTL(PT) 3.5 FIX/IO 3137AM X A 0 March 15, 2032CJ . . . . . 23,712,682 SEQ 2.25 FIX 3137AM X B 8 January 15, 2031CK . . . . . 2,697,318 SEQ 3.0 FIX 3137AM X C 6 March 15, 2032CP . . . . . 31,669,573 PAC 3.0 FIX 3137AM X E 2 August 15, 2031CQ . . . . . 1,661,943 PAC 3.0 FIX 3137AM X F 9 March 15, 2032IC . . . . . 5,081,289 NTL(SEQ) 3.5 FIX/IO 3137AM Y 4 3 January 15, 2031
Group 13AB . . . . . 5,000,000 SEQ 2.0 FIX 3137AMWR4 March 15, 2031AI . . . . . 2,500,000 NTL(SEQ) 4.0 FIX/IO 3137AM W S 2 March 15, 2031AL . . . . . 509,103 SEQ 4.0 FIX 3137AMWT0 March 15, 2032BD . . . . . 10,000,000 SEQ 2.5 FIX 3137AMWY9 July 15, 2030BL . . . . . 1,665,079 SEQ 4.0 FIX 3137AM X 2 8 March 15, 2032IO . . . . . 3,750,000 NTL(SEQ) 4.0 FIX/IO 3137AM Y 7 6 July 15, 2030
Group 14DB . . . . . 18,500,000 SC/SEQ 4.0 FIX 3137AM X K 8 September 15, 2041DC . . . . . 7,500,000 SC/SEQ 4.0 FIX 3137AM X L 6 September 15, 2041ZB . . . . . 1,000 SC/SEQ 4.0 FIX/Z 3137AM Z Q 3 September 15, 2041
Group 15M . . . . . 52,855,000 SEQ 3.0 FIX 3137AMYM3 November 15, 2026ML . . . . . 1,894,059 SEQ 3.0 FIX 3137AMYW1 March 15, 2027
Group 16J . . . . . 46,131,000 PAC 4.0 FIX 3137AM Y B 7 December 15, 2041JZ . . . . . 7,283,242 SUP 4.0 FIX/Z 3137AM Y H 4 March 15, 2042ZJ . . . . . 289,000 PAC 4.0 FIX/Z 3137AM Z V 2 March 15, 2042
ResidualR . . . . . 0 NPR 0.0 NPR 3137AM Z H 3 March 15, 2042RS . . . . . 0 NPR 0.0 NPR 3137AM Z K 6 March 15, 2042
(1) See Appendix II to the Offering Circular.(2) See Terms Sheet — Interest.
The Certificates may not be suitable investments for you. You should not purchase Certificates unless you have carefullyconsidered and are able to bear the associated prepayment, interest rate, yield and market risks of investing in them.Certain Risk Considerations on page S-2 highlights some of these risks.
You should purchase Certificates only if you have read and understood this Supplement, the attached Offering Circularand the documents identified under Available Information.
We guarantee principal and interest payments on the Certificates. These payments are not guaranteed by, and are not debtsor obligations of, the United States or any federal agency or instrumentality other than Freddie Mac. The Certificates arenot tax-exempt. Because of applicable securities law exemptions, we have not registered the Certificates with any federalor state securities commission. No securities commission has reviewed this Supplement.
J.P. Morgan
February 14, 2012
CERTAIN RISK CONSIDERATIONS
Although we guarantee the payments on the Certificates, and so bear the associated credit risk, as aninvestor you will bear the other risks of owning mortgage securities. This section highlights some of theserisks. You should also read Risk Factors and Prepayment, Yield and Suitability Considerations in theOffering Circular for further discussions of these risks.
The Certificates May Not be Suitable Investments for You. The Certificates are complexsecurities. You should not purchase Certificates unless you are able to understand and bear the associatedprepayment, interest rate, yield and market risks.
In particular, the Interest Only, Inverse Floating Rate, Support, Accrual, Retail and Residual Classeshave special risks and are not suitable for all investors.
Prepayments Can Reduce Your Yield. The yield on your Certificates could be lower than youexpect if:
• You buy your Certificates at a premium over their principal amount and principal paymentsare faster than you expect.
• You buy your Certificates at a discount to their principal amount and principal payments areslower than you expect.
If you buy an Interest Only Class and prepayments are fast, you may not even recover your investment.
LIBOR Levels Can Reduce Your Yield if You Own a Floating Rate or Inverse Floating RateClass. The yield on your Certificates could be lower than you expect if:
• You buy a Floating Rate Class and LIBOR levels are lower than you expect.
• You buy an Inverse Floating Rate Class and LIBOR levels are higher than you expect.
If you buy an Interest Only Inverse Floating Rate Class, you may not even recover your investment ifLIBOR levels are high or prepayments are fast.
The Group 4, 5 and 16 Assets are Backed By Super-Conforming Mortgages. Super-ConformingMortgages may tend to prepay differently than standard conforming Mortgages because of a number offactors, including their larger relative principal balance (and larger resulting savings in the case ofrefinancing in a low interest rate environment), the presence of Freddie Mac and Fannie Mae in thesecondary market for such Mortgages (which may tend to reduce the prevailing interest rates offered bylenders for extending such Mortgages and to increase funds available for such Mortgages) and thepossible geographic concentration of such Mortgages. See Prepayment and Yield Analysis — General.
Retail Classes Have Special Payment Rules. If you invest in a Retail Class, you will receiveprincipal payments in $1,000 increments called “Retail Class Units,” subject to the priorities andlimitations described in Appendix IV to the Offering Circular. The weighted average lives and yields ofindividual Retail Class Units will vary among different investors.
The Certificates are Subject to Market Risks. You will bear all of the market risks of yourinvestment. The market value of your Certificates will vary over time, primarily in response to changes inprevailing interest rates. If you sell your Certificates when their market value is low, you may experiencesignificant losses. The underwriter named on the front cover (the “Underwriter”) intends to make amarket for the purchase and sale of the Certificates after they are issued, but has no obligation to do so. Asecondary market may not develop. Even if one does develop, it may not be liquid enough to allow you tosell your Certificates easily or at your desired price.
Our Multiclass Certificates Offering Circular dated June 1, 2010 (the “Offering Circular”),attached to this Supplement, defines many of the terms we use in this Supplement.
S-2
TERMS SHEET
This Terms Sheet contains selected information about this Series. You should refer to theremainder of this Supplement for further information.
In this Supplement, we refer to Classes only by their letter designations. For example, “R” refers tothe R Class of this Series.
Payment Dates
We make payments of principal and interest on the Certificates on each monthly Payment Datebeginning in April 2012.
Form of Classes
Regular (non-Retail) and MACR Classes: Book-entry on Fed System
Retail Classes: Book-entry on DTC System; issued and paid in $1,000 Retail Class Units
Residual Classes: Certificated
Interest
The Fixed Rate Classes bear interest at the Class Coupons shown on the front cover and Appendix A.
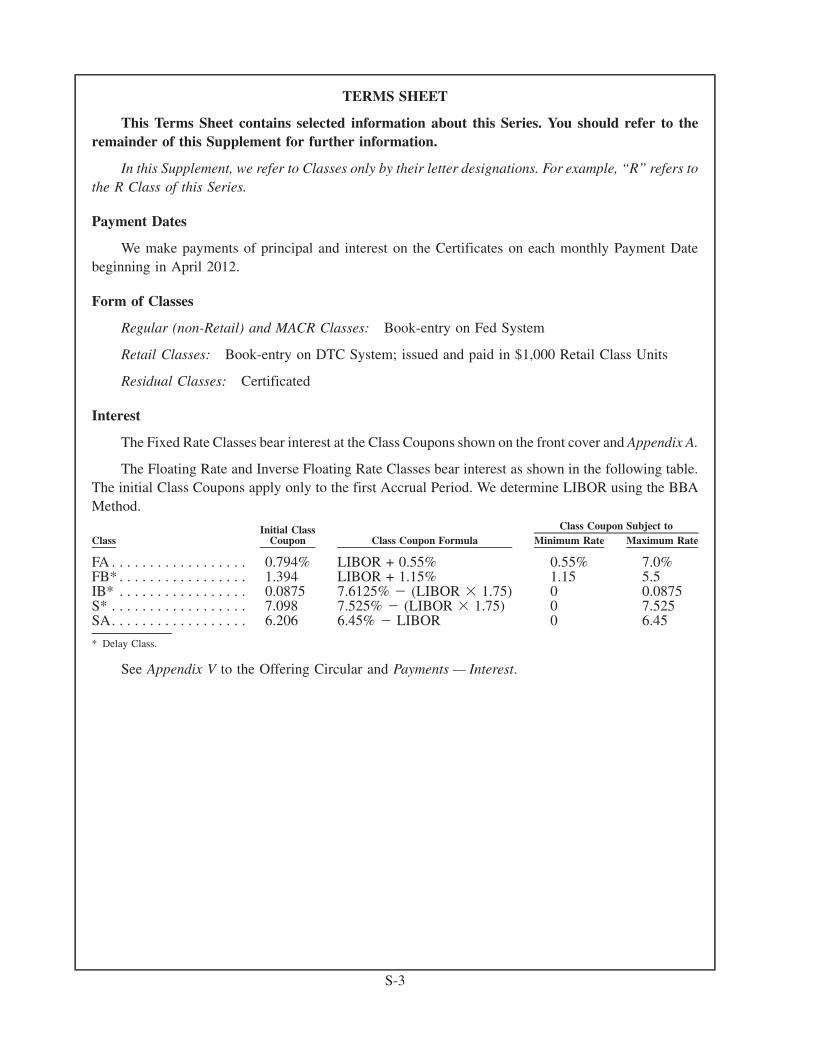
The Floating Rate and Inverse Floating Rate Classes bear interest as shown in the following table.The initial Class Coupons apply only to the first Accrual Period. We determine LIBOR using the BBAMethod.
ClassInitial Class
Coupon Class Coupon Formula Minimum Rate Maximum RateClass Coupon Subject to
FA . . . . . . . . . . . . . . . . . . 0.794% LIBOR + 0.55% 0.55% 7.0%FB* . . . . . . . . . . . . . . . . . 1.394 LIBOR + 1.15% 1.15 5.5IB* . . . . . . . . . . . . . . . . . 0.0875 7.6125% � (LIBOR � 1.75) 0 0.0875S* . . . . . . . . . . . . . . . . . . 7.098 7.525% � (LIBOR � 1.75) 0 7.525SA. . . . . . . . . . . . . . . . . . 6.206 6.45% � LIBOR 0 6.45
* Delay Class.
See Appendix V to the Offering Circular and Payments — Interest.
S-3
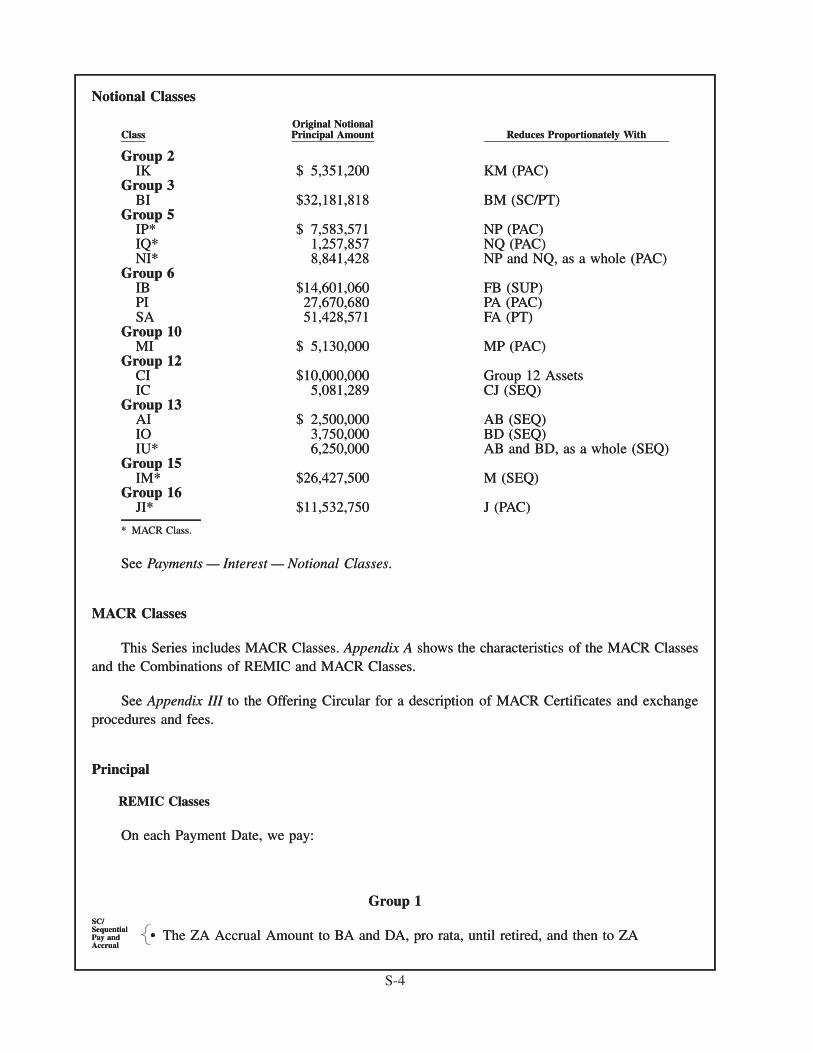
Notional Classes
ClassOriginal NotionalPrincipal Amount Reduces Proportionately With
Group 2IK $ 5,351,200 KM (PAC)
Group 3BI $32,181,818 BM (SC/PT)
Group 5IP* $ 7,583,571 NP (PAC)IQ* 1,257,857 NQ (PAC)NI* 8,841,428 NP and NQ, as a whole (PAC)
Group 6IB $14,601,060 FB (SUP)PI 27,670,680 PA (PAC)SA 51,428,571 FA (PT)
Group 10MI $ 5,130,000 MP (PAC)
Group 12CI $10,000,000 Group 12 AssetsIC 5,081,289 CJ (SEQ)
Group 13AI $ 2,500,000 AB (SEQ)IO 3,750,000 BD (SEQ)IU* 6,250,000 AB and BD, as a whole (SEQ)
Group 15IM* $26,427,500 M (SEQ)
Group 16JI* $11,532,750 J (PAC)
* MACR Class.
See Payments — Interest — Notional Classes.
MACR Classes
This Series includes MACR Classes. Appendix A shows the characteristics of the MACR Classesand the Combinations of REMIC and MACR Classes.
See Appendix III to the Offering Circular for a description of MACR Certificates and exchangeprocedures and fees.
Principal
REMIC Classes
On each Payment Date, we pay:
Group 1
• The ZA Accrual Amount to BA and DA, pro rata, until retired, and then to ZASC/SequentialPay andAccrual
Notional Classes
ClassOriginal NotionalPrincipal Amount Reduces Proportionately With
Group 2IK $ 5,351,200 KM (PAC)
Group 3BI $32,181,818 BM (SC/PT)
Group 5IP* $ 7,583,571 NP (PAC)IQ* 1,257,857 NQ (PAC)NI* 8,841,428 NP and NQ, as a whole (PAC)
Group 6IB $14,601,060 FB (SUP)PI 27,670,680 PA (PAC)SA 51,428,571 FA (PT)
Group 10MI $ 5,130,000 MP (PAC)
Group 12CI $10,000,000 Group 12 AssetsIC 5,081,289 CJ (SEQ)
Group 13AI $ 2,500,000 AB (SEQ)IO 3,750,000 BD (SEQ)IU* 6,250,000 AB and BD, as a whole (SEQ)
Group 15IM* $26,427,500 M (SEQ)
Group 16JI* $11,532,750 J (PAC)
* MACR Class.
See Payments — Interest — Notional Classes.
MACR Classes
This Series includes MACR Classes. Appendix A shows the characteristics of the MACR Classesand the Combinations of REMIC and MACR Classes.
See Appendix III to the Offering Circular for a description of MACR Certificates and exchangeprocedures and fees.
Principal
REMIC Classes
On each Payment Date, we pay:
Group 1
• The ZA Accrual Amount to BA and DA, pro rata, until retired, and then to ZA�����
SC/SequentialPay andAccrual
S-4
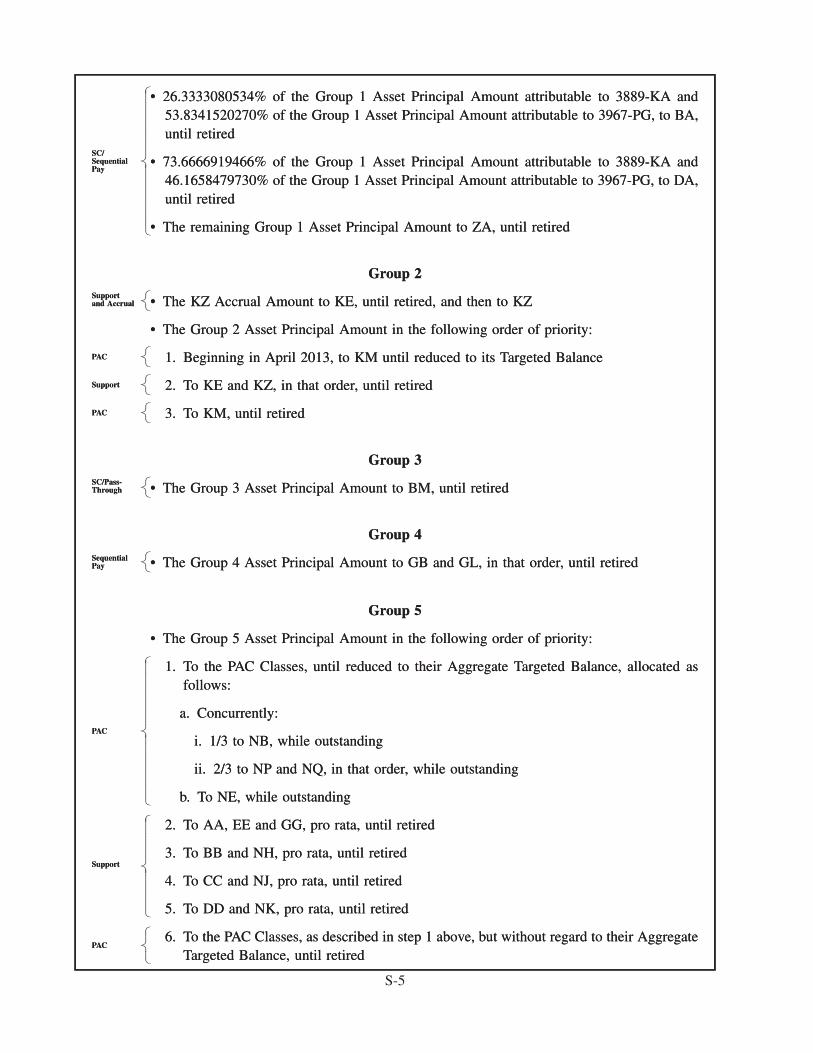
• 26.3333080534% of the Group 1 Asset Principal Amount attributable to 3889-KA and53.8341520270% of the Group 1 Asset Principal Amount attributable to 3967-PG, to BA,until retired
• 73.6666919466% of the Group 1 Asset Principal Amount attributable to 3889-KA and46.1658479730% of the Group 1 Asset Principal Amount attributable to 3967-PG, to DA,until retired
• The remaining Group 1 Asset Principal Amount to ZA, until retired
SC/SequentialPay
Group 2
• The KZ Accrual Amount to KE, until retired, and then to KZSupportand Accrual
• The Group 2 Asset Principal Amount in the following order of priority:
1. Beginning in April 2013, to KM until reduced to its Targeted BalancePAC
2. To KE and KZ, in that order, until retiredSupport
3. To KM, until retiredPAC
Group 3
• The Group 3 Asset Principal Amount to BM, until retiredSC/Pass-Through
Group 4
• The Group 4 Asset Principal Amount to GB and GL, in that order, until retiredSequentialPay
Group 5
• The Group 5 Asset Principal Amount in the following order of priority:
1. To the PAC Classes, until reduced to their Aggregate Targeted Balance, allocated asfollows:
a. Concurrently:
i. 1/3 to NB, while outstanding
ii. 2/3 to NP and NQ, in that order, while outstanding
b. To NE, while outstanding
PAC
2. To AA, EE and GG, pro rata, until retired
3. To BB and NH, pro rata, until retired
4. To CC and NJ, pro rata, until retired
5. To DD and NK, pro rata, until retired
Support
6. To the PAC Classes, as described in step 1 above, but without regard to their AggregateTargeted Balance, until retired
PAC
• 26.3333080534% of the Group 1 Asset Principal Amount attributable to 3889-KA and53.8341520270% of the Group 1 Asset Principal Amount attributable to 3967-PG, to BA,until retired
• 73.6666919466% of the Group 1 Asset Principal Amount attributable to 3889-KA and46.1658479730% of the Group 1 Asset Principal Amount attributable to 3967-PG, to DA,until retired
• The remaining Group 1 Asset Principal Amount to ZA, until retired
���������������������������������������������������
SC/SequentialPay
Group 2
• The KZ Accrual Amount to KE, until retired, and then to KZ�����
Supportand Accrual
• The Group 2 Asset Principal Amount in the following order of priority:
1. Beginning in April 2013, to KM until reduced to its Targeted Balance�����PAC
2. To KE and KZ, in that order, until retired�����Support
3. To KM, until retired�����PAC
Group 3
• The Group 3 Asset Principal Amount to BM, until retired�����
SC/Pass-Through
Group 4
• The Group 4 Asset Principal Amount to GB and GL, in that order, until retired�����
SequentialPay
Group 5
• The Group 5 Asset Principal Amount in the following order of priority:
1. To the PAC Classes, until reduced to their Aggregate Targeted Balance, allocated asfollows:
a. Concurrently:
i. 1/3 to NB, while outstanding
ii. 2/3 to NP and NQ, in that order, while outstanding
b. To NE, while outstanding
���������������������������������������������������
PAC
2. To AA, EE and GG, pro rata, until retired
3. To BB and NH, pro rata, until retired
4. To CC and NJ, pro rata, until retired
5. To DD and NK, pro rata, until retired
�����������������������������������
Support
6. To the PAC Classes, as described in step 1 above, but without regard to their AggregateTargeted Balance, until retired
�����������
PAC
S-5
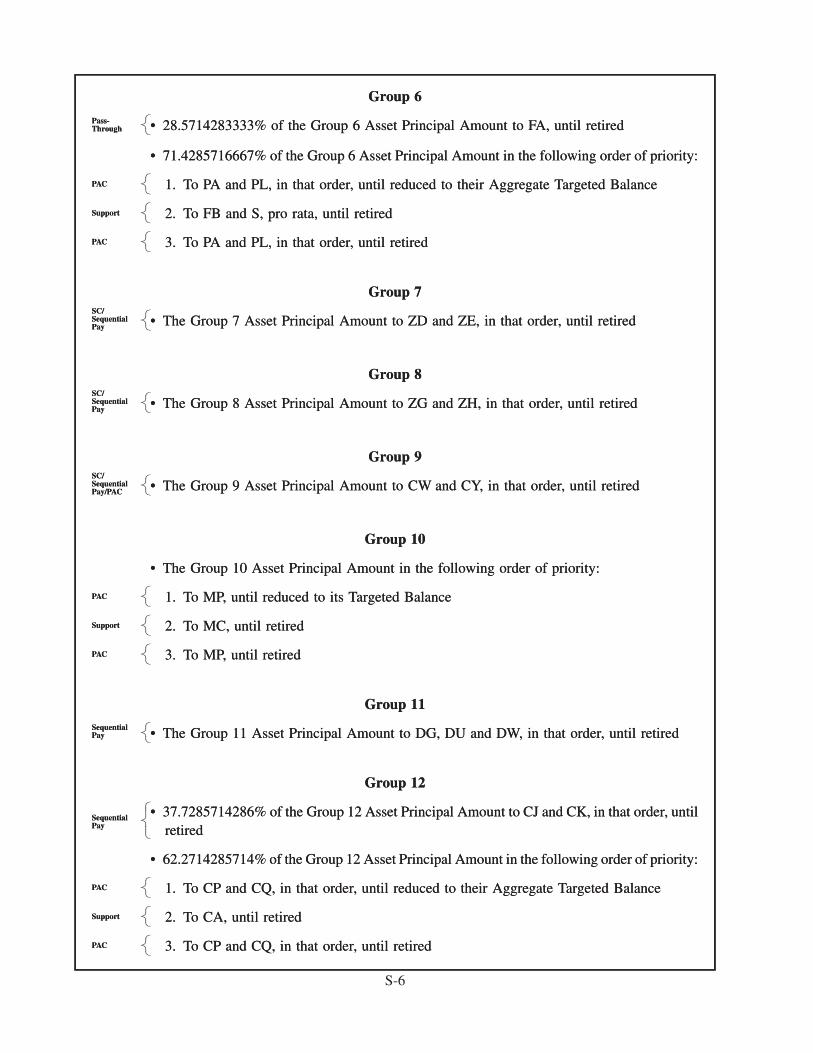
Group 6
• 28.5714283333% of the Group 6 Asset Principal Amount to FA, until retiredPass-Through
• 71.4285716667% of the Group 6 Asset Principal Amount in the following order of priority:
1. To PA and PL, in that order, until reduced to their Aggregate Targeted BalancePAC
2. To FB and S, pro rata, until retiredSupport
3. To PA and PL, in that order, until retiredPAC
Group 7
• The Group 7 Asset Principal Amount to ZD and ZE, in that order, until retiredSC/SequentialPay
Group 8
• The Group 8 Asset Principal Amount to ZG and ZH, in that order, until retiredSC/SequentialPay
Group 9
• The Group 9 Asset Principal Amount to CW and CY, in that order, until retiredSC/SequentialPay/PAC
Group 10
• The Group 10 Asset Principal Amount in the following order of priority:
1. To MP, until reduced to its Targeted BalancePAC
2. To MC, until retiredSupport
3. To MP, until retiredPAC
Group 11
• The Group 11 Asset Principal Amount to DG, DU and DW, in that order, until retiredSequentialPay
Group 12
• 37.7285714286% of the Group 12 Asset Principal Amount to CJ and CK, in that order, untilretired
SequentialPay
• 62.2714285714% of the Group 12 Asset Principal Amount in the following order of priority:
1. To CP and CQ, in that order, until reduced to their Aggregate Targeted BalancePAC
2. To CA, until retiredSupport
3. To CP and CQ, in that order, until retiredPAC
Group 6
• 28.5714283333% of the Group 6 Asset Principal Amount to FA, until retired�����
Pass-Through
• 71.4285716667% of the Group 6 Asset Principal Amount in the following order of priority:
1. To PA and PL, in that order, until reduced to their Aggregate Targeted Balance�����PAC
2. To FB and S, pro rata, until retired�����Support
3. To PA and PL, in that order, until retired�����PAC
Group 7
• The Group 7 Asset Principal Amount to ZD and ZE, in that order, until retired�����
SC/SequentialPay
Group 8
• The Group 8 Asset Principal Amount to ZG and ZH, in that order, until retired�����
SC/SequentialPay
Group 9
• The Group 9 Asset Principal Amount to CW and CY, in that order, until retired�����
SC/SequentialPay/PAC
Group 10
• The Group 10 Asset Principal Amount in the following order of priority:
1. To MP, until reduced to its Targeted Balance�����PAC
2. To MC, until retired�����Support
3. To MP, until retired�����PAC
Group 11
• The Group 11 Asset Principal Amount to DG, DU and DW, in that order, until retired�����
SequentialPay
Group 12
• 37.7285714286% of the Group 12 Asset Principal Amount to CJ and CK, in that order, untilretired
�����������
SequentialPay
• 62.2714285714% of the Group 12 Asset Principal Amount in the following order of priority:
1. To CP and CQ, in that order, until reduced to their Aggregate Targeted Balance�����PAC
2. To CA, until retired�����Support
3. To CP and CQ, in that order, until retired�����PAC
S-6
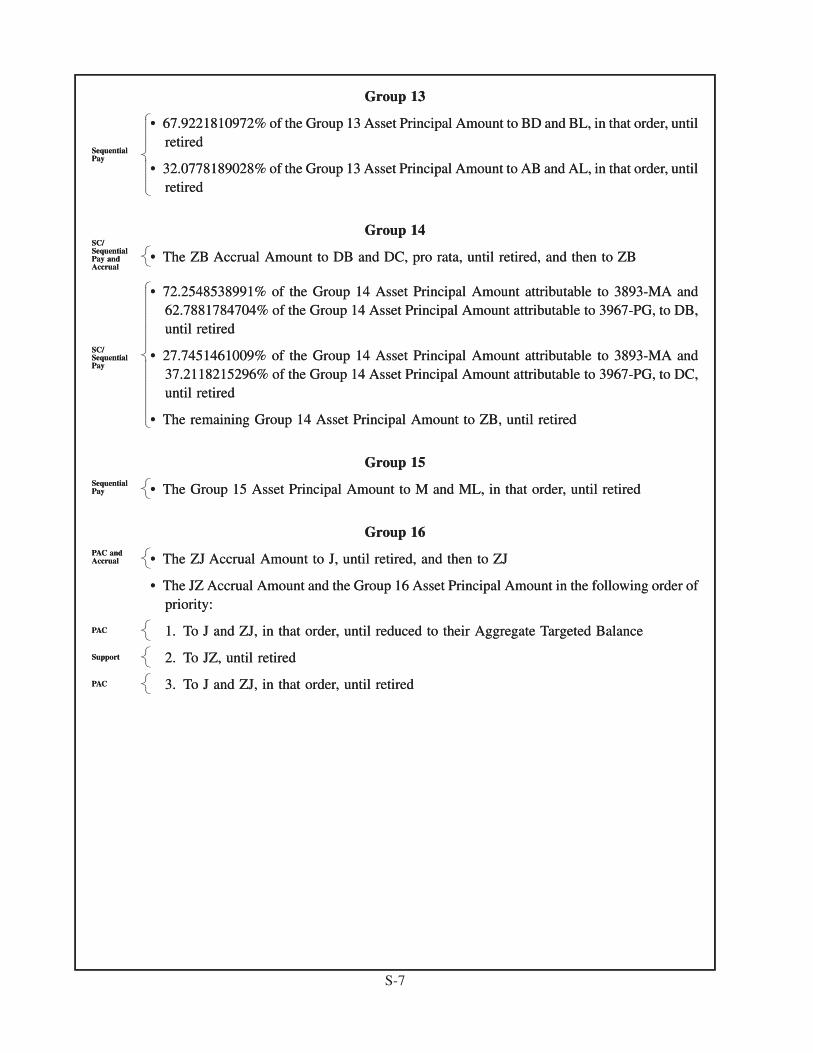
Group 13
• 67.9221810972% of the Group 13 Asset Principal Amount to BD and BL, in that order, untilretired
• 32.0778189028% of the Group 13 Asset Principal Amount to AB and AL, in that order, untilretired
SequentialPay
Group 14
• The ZB Accrual Amount to DB and DC, pro rata, until retired, and then to ZBSC/SequentialPay andAccrual
• 72.2548538991% of the Group 14 Asset Principal Amount attributable to 3893-MA and62.7881784704% of the Group 14 Asset Principal Amount attributable to 3967-PG, to DB,until retired
• 27.7451461009% of the Group 14 Asset Principal Amount attributable to 3893-MA and37.2118215296% of the Group 14 Asset Principal Amount attributable to 3967-PG, to DC,until retired
• The remaining Group 14 Asset Principal Amount to ZB, until retired
SC/SequentialPay
Group 15
• The Group 15 Asset Principal Amount to M and ML, in that order, until retiredSequentialPay
Group 16
• The ZJ Accrual Amount to J, until retired, and then to ZJPAC andAccrual
• The JZ Accrual Amount and the Group 16 Asset Principal Amount in the following order ofpriority:
1. To J and ZJ, in that order, until reduced to their Aggregate Targeted BalancePAC
2. To JZ, until retiredSupport
3. To J and ZJ, in that order, until retiredPAC
Group 13
• 67.9221810972% of the Group 13 Asset Principal Amount to BD and BL, in that order, untilretired
• 32.0778189028% of the Group 13 Asset Principal Amount to AB and AL, in that order, untilretired
���������������������������
SequentialPay
Group 14
• The ZB Accrual Amount to DB and DC, pro rata, until retired, and then to ZB�����
SC/SequentialPay andAccrual
• 72.2548538991% of the Group 14 Asset Principal Amount attributable to 3893-MA and62.7881784704% of the Group 14 Asset Principal Amount attributable to 3967-PG, to DB,until retired
• 27.7451461009% of the Group 14 Asset Principal Amount attributable to 3893-MA and37.2118215296% of the Group 14 Asset Principal Amount attributable to 3967-PG, to DC,until retired
• The remaining Group 14 Asset Principal Amount to ZB, until retired
�������������������������������������������������
SC/SequentialPay
Group 15
• The Group 15 Asset Principal Amount to M and ML, in that order, until retired�����
SequentialPay
Group 16
• The ZJ Accrual Amount to J, until retired, and then to ZJ�����
PAC andAccrual
• The JZ Accrual Amount and the Group 16 Asset Principal Amount in the following order ofpriority:
1. To J and ZJ, in that order, until reduced to their Aggregate Targeted Balance�����PAC
2. To JZ, until retired�����Support
3. To J and ZJ, in that order, until retired�����PAC
S-7
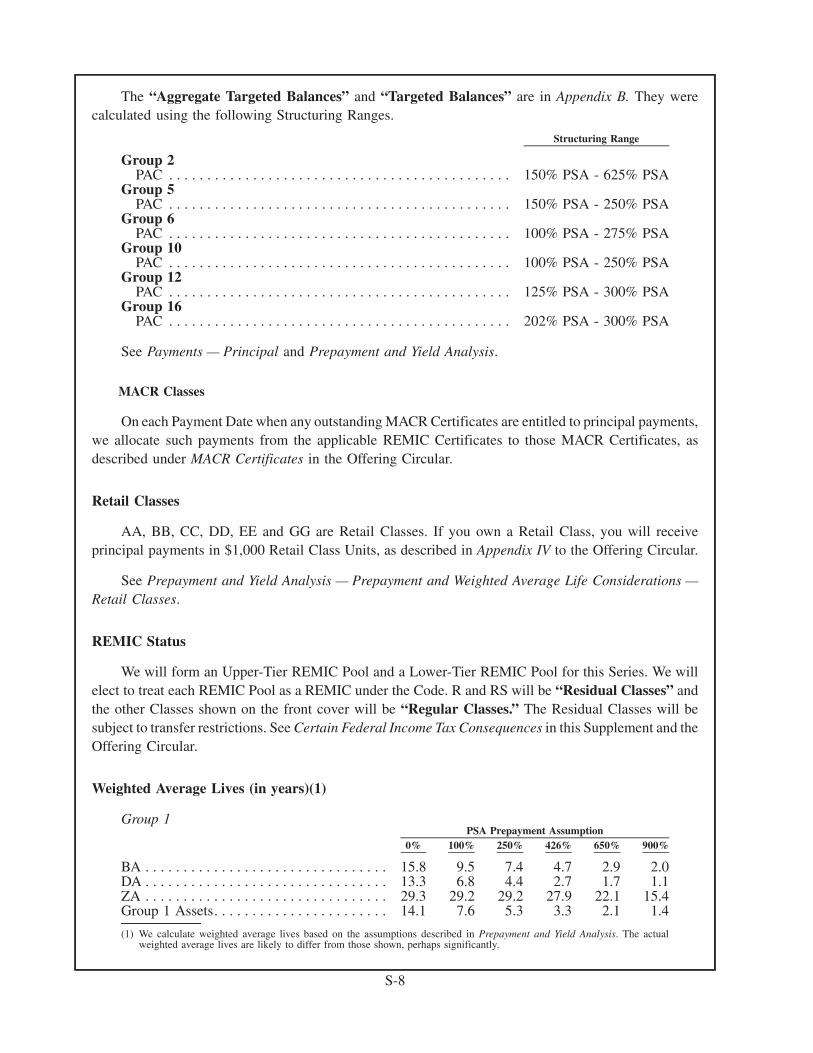
The “Aggregate Targeted Balances” and “Targeted Balances” are in Appendix B. They werecalculated using the following Structuring Ranges.
Structuring Range
Group 2PAC . . . . . . . . . . . . . . . . . . . . . . . . . . . . . . . . . . . . . . . . . . . . . 150% PSA - 625% PSA
Group 5PAC . . . . . . . . . . . . . . . . . . . . . . . . . . . . . . . . . . . . . . . . . . . . . 150% PSA - 250% PSA
Group 6PAC . . . . . . . . . . . . . . . . . . . . . . . . . . . . . . . . . . . . . . . . . . . . . 100% PSA - 275% PSA
Group 10PAC . . . . . . . . . . . . . . . . . . . . . . . . . . . . . . . . . . . . . . . . . . . . . 100% PSA - 250% PSA
Group 12PAC . . . . . . . . . . . . . . . . . . . . . . . . . . . . . . . . . . . . . . . . . . . . . 125% PSA - 300% PSA
Group 16PAC . . . . . . . . . . . . . . . . . . . . . . . . . . . . . . . . . . . . . . . . . . . . . 202% PSA - 300% PSA
See Payments — Principal and Prepayment and Yield Analysis.
MACR Classes
On each Payment Date when any outstanding MACR Certificates are entitled to principal payments,we allocate such payments from the applicable REMIC Certificates to those MACR Certificates, asdescribed under MACR Certificates in the Offering Circular.
Retail Classes
AA, BB, CC, DD, EE and GG are Retail Classes. If you own a Retail Class, you will receiveprincipal payments in $1,000 Retail Class Units, as described in Appendix IV to the Offering Circular.
See Prepayment and Yield Analysis — Prepayment and Weighted Average Life Considerations —Retail Classes.
REMIC Status
We will form an Upper-Tier REMIC Pool and a Lower-Tier REMIC Pool for this Series. We willelect to treat each REMIC Pool as a REMIC under the Code. R and RS will be “Residual Classes” andthe other Classes shown on the front cover will be “Regular Classes.” The Residual Classes will besubject to transfer restrictions. See Certain Federal Income Tax Consequences in this Supplement and theOffering Circular.
Weighted Average Lives (in years)(1)
Group 1
0% 100% 250% 426% 650% 900%PSA Prepayment Assumption
BA . . . . . . . . . . . . . . . . . . . . . . . . . . . . . . . . 15.8 9.5 7.4 4.7 2.9 2.0DA . . . . . . . . . . . . . . . . . . . . . . . . . . . . . . . . 13.3 6.8 4.4 2.7 1.7 1.1ZA . . . . . . . . . . . . . . . . . . . . . . . . . . . . . . . . 29.3 29.2 29.2 27.9 22.1 15.4Group 1 Assets. . . . . . . . . . . . . . . . . . . . . . . 14.1 7.6 5.3 3.3 2.1 1.4
(1) We calculate weighted average lives based on the assumptions described in Prepayment and Yield Analysis. The actualweighted average lives are likely to differ from those shown, perhaps significantly.
S-8
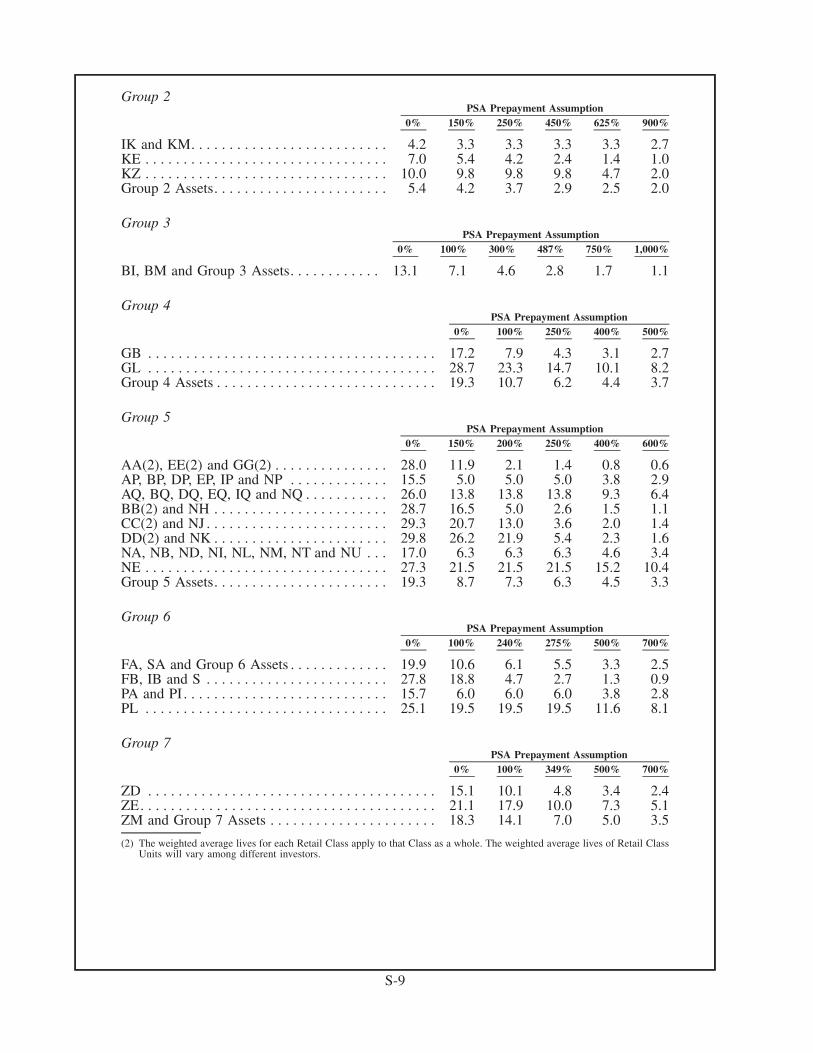
Group 2
0% 150% 250% 450% 625% 900%PSA Prepayment Assumption
IK and KM. . . . . . . . . . . . . . . . . . . . . . . . . . 4.2 3.3 3.3 3.3 3.3 2.7KE . . . . . . . . . . . . . . . . . . . . . . . . . . . . . . . . 7.0 5.4 4.2 2.4 1.4 1.0KZ . . . . . . . . . . . . . . . . . . . . . . . . . . . . . . . . 10.0 9.8 9.8 9.8 4.7 2.0Group 2 Assets. . . . . . . . . . . . . . . . . . . . . . . 5.4 4.2 3.7 2.9 2.5 2.0
Group 3
0% 100% 300% 487% 750% 1,000%PSA Prepayment Assumption
BI, BM and Group 3 Assets. . . . . . . . . . . . 13.1 7.1 4.6 2.8 1.7 1.1
Group 4
0% 100% 250% 400% 500%PSA Prepayment Assumption
GB . . . . . . . . . . . . . . . . . . . . . . . . . . . . . . . . . . . . . . 17.2 7.9 4.3 3.1 2.7GL . . . . . . . . . . . . . . . . . . . . . . . . . . . . . . . . . . . . . . 28.7 23.3 14.7 10.1 8.2Group 4 Assets . . . . . . . . . . . . . . . . . . . . . . . . . . . . . 19.3 10.7 6.2 4.4 3.7
Group 5
0% 150% 200% 250% 400% 600%PSA Prepayment Assumption
AA(2), EE(2) and GG(2) . . . . . . . . . . . . . . . 28.0 11.9 2.1 1.4 0.8 0.6AP, BP, DP, EP, IP and NP . . . . . . . . . . . . . 15.5 5.0 5.0 5.0 3.8 2.9AQ, BQ, DQ, EQ, IQ and NQ . . . . . . . . . . . 26.0 13.8 13.8 13.8 9.3 6.4BB(2) and NH . . . . . . . . . . . . . . . . . . . . . . . 28.7 16.5 5.0 2.6 1.5 1.1CC(2) and NJ . . . . . . . . . . . . . . . . . . . . . . . . 29.3 20.7 13.0 3.6 2.0 1.4DD(2) and NK . . . . . . . . . . . . . . . . . . . . . . . 29.8 26.2 21.9 5.4 2.3 1.6NA, NB, ND, NI, NL, NM, NT and NU . . . 17.0 6.3 6.3 6.3 4.6 3.4NE . . . . . . . . . . . . . . . . . . . . . . . . . . . . . . . . 27.3 21.5 21.5 21.5 15.2 10.4Group 5 Assets. . . . . . . . . . . . . . . . . . . . . . . 19.3 8.7 7.3 6.3 4.5 3.3
Group 6
0% 100% 240% 275% 500% 700%PSA Prepayment Assumption
FA, SA and Group 6 Assets . . . . . . . . . . . . . 19.9 10.6 6.1 5.5 3.3 2.5FB, IB and S . . . . . . . . . . . . . . . . . . . . . . . . 27.8 18.8 4.7 2.7 1.3 0.9PA and PI . . . . . . . . . . . . . . . . . . . . . . . . . . . 15.7 6.0 6.0 6.0 3.8 2.8PL . . . . . . . . . . . . . . . . . . . . . . . . . . . . . . . . 25.1 19.5 19.5 19.5 11.6 8.1
Group 7
0% 100% 349% 500% 700%PSA Prepayment Assumption
ZD . . . . . . . . . . . . . . . . . . . . . . . . . . . . . . . . . . . . . . 15.1 10.1 4.8 3.4 2.4ZE. . . . . . . . . . . . . . . . . . . . . . . . . . . . . . . . . . . . . . . 21.1 17.9 10.0 7.3 5.1ZM and Group 7 Assets . . . . . . . . . . . . . . . . . . . . . . 18.3 14.1 7.0 5.0 3.5
(2) The weighted average lives for each Retail Class apply to that Class as a whole. The weighted average lives of Retail ClassUnits will vary among different investors.
S-9
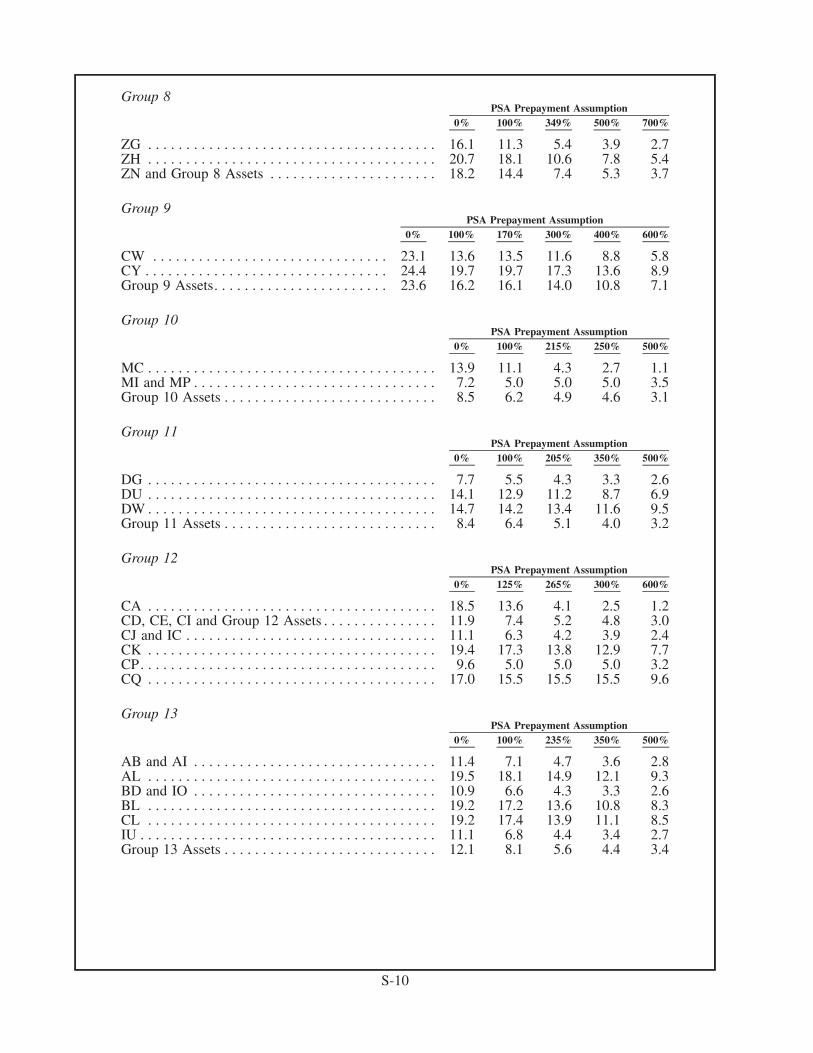
Group 8
0% 100% 349% 500% 700%PSA Prepayment Assumption
ZG . . . . . . . . . . . . . . . . . . . . . . . . . . . . . . . . . . . . . . 16.1 11.3 5.4 3.9 2.7ZH . . . . . . . . . . . . . . . . . . . . . . . . . . . . . . . . . . . . . . 20.7 18.1 10.6 7.8 5.4ZN and Group 8 Assets . . . . . . . . . . . . . . . . . . . . . . 18.2 14.4 7.4 5.3 3.7
Group 9
0% 100% 170% 300% 400% 600%PSA Prepayment Assumption
CW . . . . . . . . . . . . . . . . . . . . . . . . . . . . . . . 23.1 13.6 13.5 11.6 8.8 5.8CY . . . . . . . . . . . . . . . . . . . . . . . . . . . . . . . . 24.4 19.7 19.7 17.3 13.6 8.9Group 9 Assets. . . . . . . . . . . . . . . . . . . . . . . 23.6 16.2 16.1 14.0 10.8 7.1
Group 10
0% 100% 215% 250% 500%PSA Prepayment Assumption
MC . . . . . . . . . . . . . . . . . . . . . . . . . . . . . . . . . . . . . . 13.9 11.1 4.3 2.7 1.1MI and MP . . . . . . . . . . . . . . . . . . . . . . . . . . . . . . . . 7.2 5.0 5.0 5.0 3.5Group 10 Assets . . . . . . . . . . . . . . . . . . . . . . . . . . . . 8.5 6.2 4.9 4.6 3.1
Group 11
0% 100% 205% 350% 500%PSA Prepayment Assumption
DG . . . . . . . . . . . . . . . . . . . . . . . . . . . . . . . . . . . . . . 7.7 5.5 4.3 3.3 2.6DU . . . . . . . . . . . . . . . . . . . . . . . . . . . . . . . . . . . . . . 14.1 12.9 11.2 8.7 6.9DW . . . . . . . . . . . . . . . . . . . . . . . . . . . . . . . . . . . . . . 14.7 14.2 13.4 11.6 9.5Group 11 Assets . . . . . . . . . . . . . . . . . . . . . . . . . . . . 8.4 6.4 5.1 4.0 3.2
Group 12
0% 125% 265% 300% 600%PSA Prepayment Assumption
CA . . . . . . . . . . . . . . . . . . . . . . . . . . . . . . . . . . . . . . 18.5 13.6 4.1 2.5 1.2CD, CE, CI and Group 12 Assets . . . . . . . . . . . . . . . 11.9 7.4 5.2 4.8 3.0CJ and IC . . . . . . . . . . . . . . . . . . . . . . . . . . . . . . . . . 11.1 6.3 4.2 3.9 2.4CK . . . . . . . . . . . . . . . . . . . . . . . . . . . . . . . . . . . . . . 19.4 17.3 13.8 12.9 7.7CP. . . . . . . . . . . . . . . . . . . . . . . . . . . . . . . . . . . . . . . 9.6 5.0 5.0 5.0 3.2CQ . . . . . . . . . . . . . . . . . . . . . . . . . . . . . . . . . . . . . . 17.0 15.5 15.5 15.5 9.6
Group 13
0% 100% 235% 350% 500%PSA Prepayment Assumption
AB and AI . . . . . . . . . . . . . . . . . . . . . . . . . . . . . . . . 11.4 7.1 4.7 3.6 2.8AL . . . . . . . . . . . . . . . . . . . . . . . . . . . . . . . . . . . . . . 19.5 18.1 14.9 12.1 9.3BD and IO . . . . . . . . . . . . . . . . . . . . . . . . . . . . . . . . 10.9 6.6 4.3 3.3 2.6BL . . . . . . . . . . . . . . . . . . . . . . . . . . . . . . . . . . . . . . 19.2 17.2 13.6 10.8 8.3CL . . . . . . . . . . . . . . . . . . . . . . . . . . . . . . . . . . . . . . 19.2 17.4 13.9 11.1 8.5IU . . . . . . . . . . . . . . . . . . . . . . . . . . . . . . . . . . . . . . . 11.1 6.8 4.4 3.4 2.7Group 13 Assets . . . . . . . . . . . . . . . . . . . . . . . . . . . . 12.1 8.1 5.6 4.4 3.4
S-10
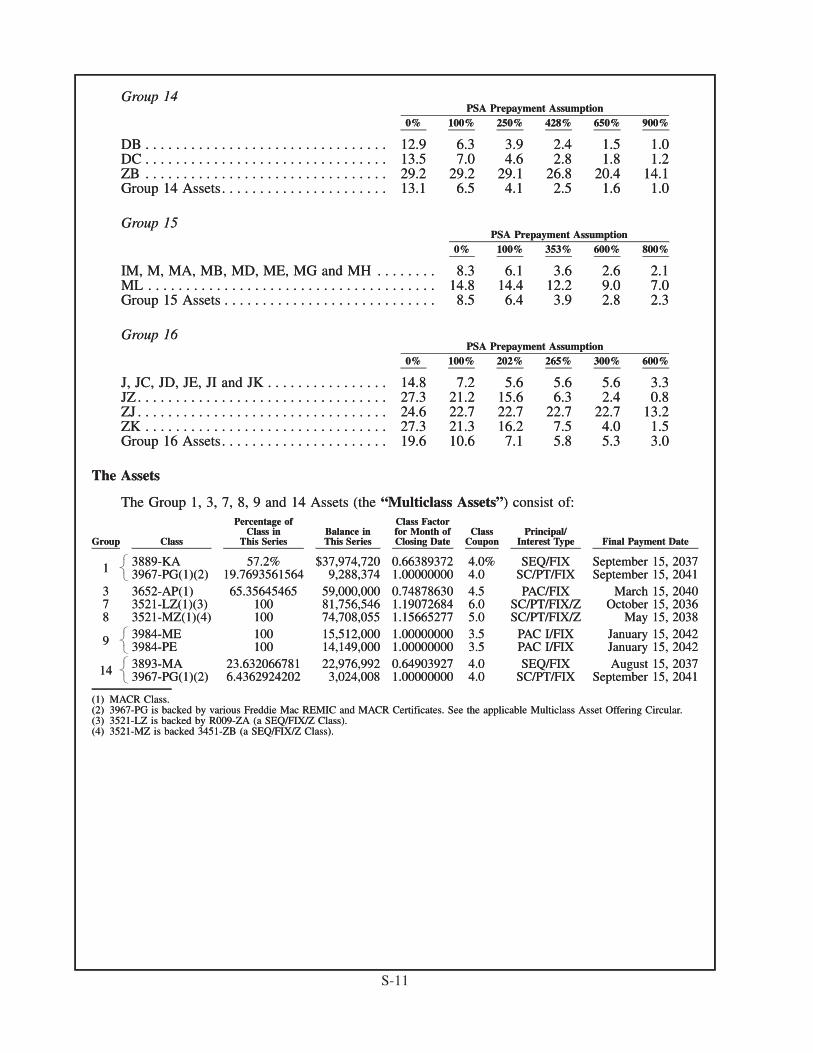
Group 14
0% 100% 250% 428% 650% 900%PSA Prepayment Assumption
DB . . . . . . . . . . . . . . . . . . . . . . . . . . . . . . . . 12.9 6.3 3.9 2.4 1.5 1.0DC . . . . . . . . . . . . . . . . . . . . . . . . . . . . . . . . 13.5 7.0 4.6 2.8 1.8 1.2ZB . . . . . . . . . . . . . . . . . . . . . . . . . . . . . . . . 29.2 29.2 29.1 26.8 20.4 14.1Group 14 Assets. . . . . . . . . . . . . . . . . . . . . . 13.1 6.5 4.1 2.5 1.6 1.0
Group 15
0% 100% 353% 600% 800%PSA Prepayment Assumption
IM, M, MA, MB, MD, ME, MG and MH . . . . . . . . 8.3 6.1 3.6 2.6 2.1ML . . . . . . . . . . . . . . . . . . . . . . . . . . . . . . . . . . . . . . 14.8 14.4 12.2 9.0 7.0Group 15 Assets . . . . . . . . . . . . . . . . . . . . . . . . . . . . 8.5 6.4 3.9 2.8 2.3
Group 16
0% 100% 202% 265% 300% 600%PSA Prepayment Assumption
J, JC, JD, JE, JI and JK . . . . . . . . . . . . . . . . 14.8 7.2 5.6 5.6 5.6 3.3JZ . . . . . . . . . . . . . . . . . . . . . . . . . . . . . . . . . 27.3 21.2 15.6 6.3 2.4 0.8ZJ . . . . . . . . . . . . . . . . . . . . . . . . . . . . . . . . . 24.6 22.7 22.7 22.7 22.7 13.2ZK . . . . . . . . . . . . . . . . . . . . . . . . . . . . . . . . 27.3 21.3 16.2 7.5 4.0 1.5Group 16 Assets. . . . . . . . . . . . . . . . . . . . . . 19.6 10.6 7.1 5.8 5.3 3.0
The Assets
The Group 1, 3, 7, 8, 9 and 14 Assets (the “Multiclass Assets”) consist of:
Group Class
Percentage ofClass in
This SeriesBalance inThis Series
Class Factorfor Month ofClosing Date
ClassCoupon
Principal/Interest Type Final Payment Date
1 3889-KA 57.2% $37,974,720 0.66389372 4.0% SEQ/FIX September 15, 20373967-PG(1)(2) 19.7693561564 9,288,374 1.00000000 4.0 SC/PT/FIX September 15, 2041
3 3652-AP(1) 65.35645465 59,000,000 0.74878630 4.5 PAC/FIX March 15, 20407 3521-LZ(1)(3) 100 81,756,546 1.19072684 6.0 SC/PT/FIX/Z October 15, 20368 3521-MZ(1)(4) 100 74,708,055 1.15665277 5.0 SC/PT/FIX/Z May 15, 2038
9 3984-ME 100 15,512,000 1.00000000 3.5 PAC I/FIX January 15, 20423984-PE 100 14,149,000 1.00000000 3.5 PAC I/FIX January 15, 2042
14 3893-MA 23.632066781 22,976,992 0.64903927 4.0 SEQ/FIX August 15, 20373967-PG(1)(2) 6.4362924202 3,024,008 1.00000000 4.0 SC/PT/FIX September 15, 2041
(1) MACR Class.(2) 3967-PG is backed by various Freddie Mac REMIC and MACR Certificates. See the applicable Multiclass Asset Offering Circular.(3) 3521-LZ is backed by R009-ZA (a SEQ/FIX/Z Class).(4) 3521-MZ is backed 3451-ZB (a SEQ/FIX/Z Class).
Group 14
0% 100% 250% 428% 650% 900%PSA Prepayment Assumption
DB . . . . . . . . . . . . . . . . . . . . . . . . . . . . . . . . 12.9 6.3 3.9 2.4 1.5 1.0DC . . . . . . . . . . . . . . . . . . . . . . . . . . . . . . . . 13.5 7.0 4.6 2.8 1.8 1.2ZB . . . . . . . . . . . . . . . . . . . . . . . . . . . . . . . . 29.2 29.2 29.1 26.8 20.4 14.1Group 14 Assets. . . . . . . . . . . . . . . . . . . . . . 13.1 6.5 4.1 2.5 1.6 1.0
Group 15
0% 100% 353% 600% 800%PSA Prepayment Assumption
IM, M, MA, MB, MD, ME, MG and MH . . . . . . . . 8.3 6.1 3.6 2.6 2.1ML . . . . . . . . . . . . . . . . . . . . . . . . . . . . . . . . . . . . . . 14.8 14.4 12.2 9.0 7.0Group 15 Assets . . . . . . . . . . . . . . . . . . . . . . . . . . . . 8.5 6.4 3.9 2.8 2.3
Group 16
0% 100% 202% 265% 300% 600%PSA Prepayment Assumption
J, JC, JD, JE, JI and JK . . . . . . . . . . . . . . . . 14.8 7.2 5.6 5.6 5.6 3.3JZ . . . . . . . . . . . . . . . . . . . . . . . . . . . . . . . . . 27.3 21.2 15.6 6.3 2.4 0.8ZJ . . . . . . . . . . . . . . . . . . . . . . . . . . . . . . . . . 24.6 22.7 22.7 22.7 22.7 13.2ZK . . . . . . . . . . . . . . . . . . . . . . . . . . . . . . . . 27.3 21.3 16.2 7.5 4.0 1.5Group 16 Assets. . . . . . . . . . . . . . . . . . . . . . 19.6 10.6 7.1 5.8 5.3 3.0
The Assets
The Group 1, 3, 7, 8, 9 and 14 Assets (the “Multiclass Assets”) consist of:
Group Class
Percentage ofClass in
This SeriesBalance inThis Series
Class Factorfor Month ofClosing Date
ClassCoupon
Principal/Interest Type Final Payment Date
1 3889-KA 57.2% $37,974,720 0.66389372 4.0% SEQ/FIX September 15, 20373967-PG(1)(2) 19.7693561564 9,288,374 1.00000000 4.0 SC/PT/FIX September 15, 2041
���������
3 3652-AP(1) 65.35645465 59,000,000 0.74878630 4.5 PAC/FIX March 15, 20407 3521-LZ(1)(3) 100 81,756,546 1.19072684 6.0 SC/PT/FIX/Z October 15, 20368 3521-MZ(1)(4) 100 74,708,055 1.15665277 5.0 SC/PT/FIX/Z May 15, 2038
9 3984-ME 100 15,512,000 1.00000000 3.5 PAC I/FIX January 15, 20423984-PE 100 14,149,000 1.00000000 3.5 PAC I/FIX January 15, 2042
���������
14 3893-MA 23.632066781 22,976,992 0.64903927 4.0 SEQ/FIX August 15, 20373967-PG(1)(2) 6.4362924202 3,024,008 1.00000000 4.0 SC/PT/FIX September 15, 2041
���������
(1) MACR Class.(2) 3967-PG is backed by various Freddie Mac REMIC and MACR Certificates. See the applicable Multiclass Asset Offering Circular.(3) 3521-LZ is backed by R009-ZA (a SEQ/FIX/Z Class).(4) 3521-MZ is backed 3451-ZB (a SEQ/FIX/Z Class).
S-11
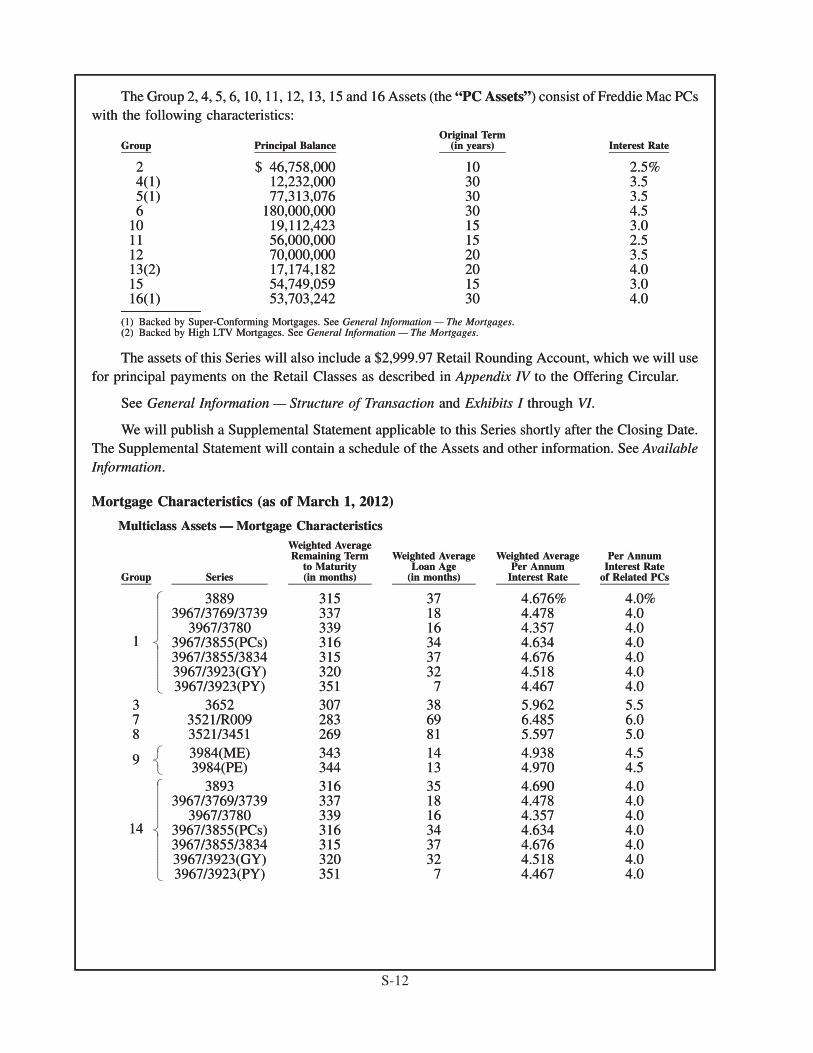
The Group 2, 4, 5, 6, 10, 11, 12, 13, 15 and 16 Assets (the “PC Assets”) consist of Freddie Mac PCswith the following characteristics:
Group Principal BalanceOriginal Term
(in years) Interest Rate
2 $ 46,758,000 10 2.5%4(1) 12,232,000 30 3.55(1) 77,313,076 30 3.56 180,000,000 30 4.5
10 19,112,423 15 3.011 56,000,000 15 2.512 70,000,000 20 3.513(2) 17,174,182 20 4.015 54,749,059 15 3.016(1) 53,703,242 30 4.0
(1) Backed by Super-Conforming Mortgages. See General Information — The Mortgages.(2) Backed by High LTV Mortgages. See General Information — The Mortgages.
The assets of this Series will also include a $2,999.97 Retail Rounding Account, which we will usefor principal payments on the Retail Classes as described in Appendix IV to the Offering Circular.
See General Information — Structure of Transaction and Exhibits I through VI.
We will publish a Supplemental Statement applicable to this Series shortly after the Closing Date.The Supplemental Statement will contain a schedule of the Assets and other information. See AvailableInformation.
Mortgage Characteristics (as of March 1, 2012)
Multiclass Assets — Mortgage Characteristics
Group Series
Weighted AverageRemaining Term
to Maturity(in months)
Weighted AverageLoan Age
(in months)
Weighted AveragePer Annum
Interest Rate
Per AnnumInterest Rate
of Related PCs
1
3889 315 37 4.676% 4.0%3967/3769/3739 337 18 4.478 4.0
3967/3780 339 16 4.357 4.03967/3855(PCs) 316 34 4.634 4.03967/3855/3834 315 37 4.676 4.03967/3923(GY) 320 32 4.518 4.03967/3923(PY) 351 7 4.467 4.0
3 3652 307 38 5.962 5.57 3521/R009 283 69 6.485 6.08 3521/3451 269 81 5.597 5.0
9 3984(ME) 343 14 4.938 4.53984(PE) 344 13 4.970 4.5
14
3893 316 35 4.690 4.03967/3769/3739 337 18 4.478 4.0
3967/3780 339 16 4.357 4.03967/3855(PCs) 316 34 4.634 4.03967/3855/3834 315 37 4.676 4.03967/3923(GY) 320 32 4.518 4.03967/3923(PY) 351 7 4.467 4.0
The Group 2, 4, 5, 6, 10, 11, 12, 13, 15 and 16 Assets (the “PC Assets”) consist of Freddie Mac PCswith the following characteristics:
Group Principal BalanceOriginal Term
(in years) Interest Rate
2 $ 46,758,000 10 2.5%4(1) 12,232,000 30 3.55(1) 77,313,076 30 3.56 180,000,000 30 4.5
10 19,112,423 15 3.011 56,000,000 15 2.512 70,000,000 20 3.513(2) 17,174,182 20 4.015 54,749,059 15 3.016(1) 53,703,242 30 4.0
(1) Backed by Super-Conforming Mortgages. See General Information — The Mortgages.(2) Backed by High LTV Mortgages. See General Information — The Mortgages.
The assets of this Series will also include a $2,999.97 Retail Rounding Account, which we will usefor principal payments on the Retail Classes as described in Appendix IV to the Offering Circular.
See General Information — Structure of Transaction and Exhibits I through VI.
We will publish a Supplemental Statement applicable to this Series shortly after the Closing Date.The Supplemental Statement will contain a schedule of the Assets and other information. See AvailableInformation.
Mortgage Characteristics (as of March 1, 2012)
Multiclass Assets — Mortgage Characteristics
Group Series
Weighted AverageRemaining Term
to Maturity(in months)
Weighted AverageLoan Age
(in months)
Weighted AveragePer Annum
Interest Rate
Per AnnumInterest Rate
of Related PCs
1
3889 315 37 4.676% 4.0%3967/3769/3739 337 18 4.478 4.0
3967/3780 339 16 4.357 4.03967/3855(PCs) 316 34 4.634 4.03967/3855/3834 315 37 4.676 4.03967/3923(GY) 320 32 4.518 4.03967/3923(PY) 351 7 4.467 4.0
�����������������������������������
3 3652 307 38 5.962 5.57 3521/R009 283 69 6.485 6.08 3521/3451 269 81 5.597 5.0
9 3984(ME) 343 14 4.938 4.53984(PE) 344 13 4.970 4.5
���������
14
3893 316 35 4.690 4.03967/3769/3739 337 18 4.478 4.0
3967/3780 339 16 4.357 4.03967/3855(PCs) 316 34 4.634 4.03967/3855/3834 315 37 4.676 4.03967/3923(GY) 320 32 4.518 4.03967/3923(PY) 351 7 4.467 4.0
�����������������������������������
S-12
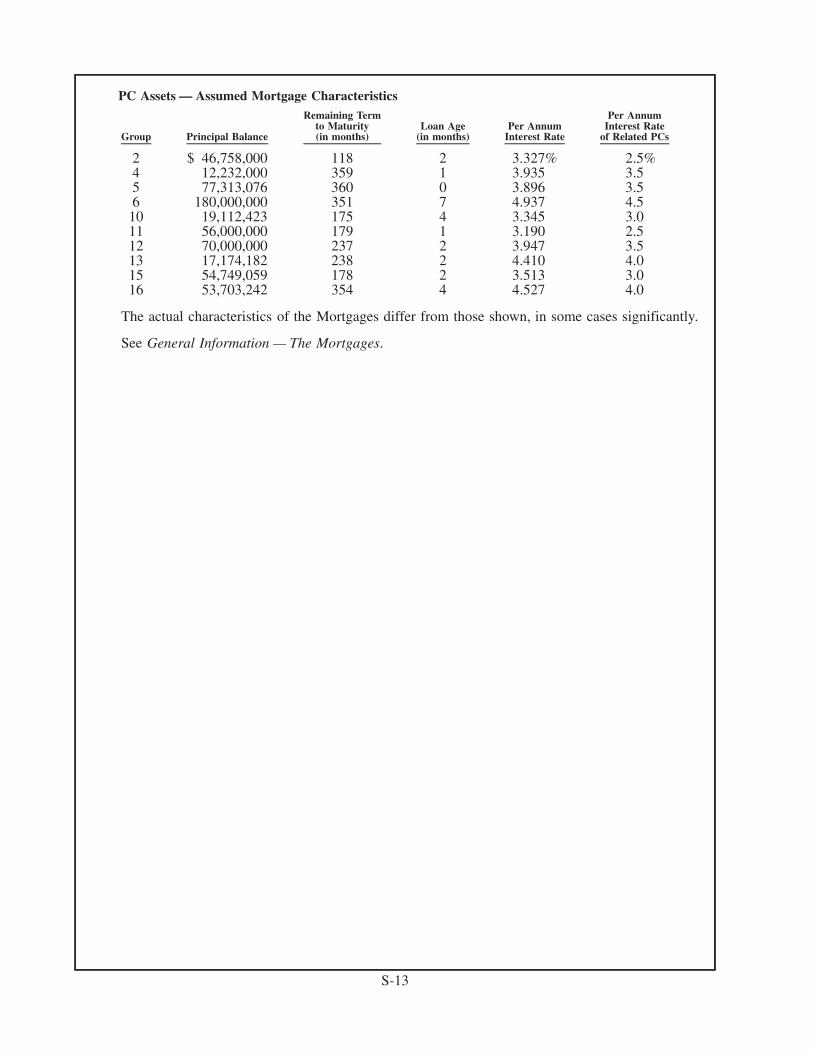
PC Assets — Assumed Mortgage Characteristics
Group Principal Balance
Remaining Termto Maturity(in months)
Loan Age(in months)
Per AnnumInterest Rate
Per AnnumInterest Rate
of Related PCs
2 $ 46,758,000 118 2 3.327% 2.5%4 12,232,000 359 1 3.935 3.55 77,313,076 360 0 3.896 3.56 180,000,000 351 7 4.937 4.510 19,112,423 175 4 3.345 3.011 56,000,000 179 1 3.190 2.512 70,000,000 237 2 3.947 3.513 17,174,182 238 2 4.410 4.015 54,749,059 178 2 3.513 3.016 53,703,242 354 4 4.527 4.0
The actual characteristics of the Mortgages differ from those shown, in some cases significantly.
See General Information — The Mortgages.
S-13
AVAILABLE INFORMATION
We incorporate by reference in this Supplement the Incorporated Documents listed under AdditionalInformation in the Offering Circular. For purposes of this Supplement, the “Incorporated Documents”also include, if you are investing in a Group 1, 3, 7, 8, 9 or 14 Class, our Offering Circular Supplementsfor the related Multiclass Assets (each, a “Multiclass Asset Offering Circular”), the front covers, TermsSheets and, if applicable, MACR tables from which are in Exhibits I through VI.
When we incorporate documents by reference, that means we are disclosing information to you byreferring to those documents rather than by providing you with separate copies. The IncorporatedDocuments are considered part of this Supplement. You should purchase Certificates only if you haveread and understood this Supplement, the Offering Circular and the Incorporated Documents. Infor-mation that we incorporate by reference will automatically update information in this Supplement. Wewill also publish a Supplemental Statement applicable to this Series shortly after the Closing Date. TheSupplemental Statement will contain a schedule of the Assets and other information. You should relyonly on the most current information provided or incorporated by reference in this Supplement and anyapplicable Supplemental Statement.
You may read and copy any document we file with the SEC at the SEC’s public reference room at100 F Street, N.E., Washington, D.C. 20549. Please call the SEC at 1-800-SEC-0330 for furtherinformation on the public reference room. The SEC also maintains a website at http://www.sec.gov thatcontains reports, proxy and information statements, and other information regarding companies that fileelectronically with the SEC.
You can obtain, without charge, copies of the Incorporated Documents, any documents wesubsequently file with the SEC, the Trust Agreement and current information concerning the Assetsand Certificates, as well as the disclosure documents and current information for any other securities weissue, from our Investor Inquiry Department or our internet website as described on page 7 of the OfferingCircular. You can also obtain the documents listed above from the Underwriter at:
J.P. Morgan Securities LLCc/o Broadridge Financial Solutions
Prospectus Department1155 Long Island Avenue
Edgewood, New York 11717(631) 274-2740
GENERAL INFORMATION
The Trust Agreement
We will form a trust fund to hold the Assets and to issue the Certificates, each pursuant to theMulticlass Certificates Master Trust Agreement dated June 1, 2010 and a Terms Supplement dated theClosing Date (together, the “Trust Agreement”). We will act as Trustee and Administrator under theTrust Agreement.
You should refer to the Trust Agreement for a complete description of your rights and obligationsand those of Freddie Mac. You will acquire your Certificates subject to the terms and conditions of theTrust Agreement, including the Terms Supplement.
S-14
Form of Certificates
The non-Retail Regular and MACR Classes are issued, held and transferable on the Fed System. TheRetail Classes are issued, held and transferable on the DTC System in $1,000 Retail Class Units. TheResidual Classes are issued and held in certificated form and are transferable at the office of the Registrar.
Only a Fed Participant can be a Holder of a non-Retail Regular or MACR Class. DTC or its nomineeis the Holder of each Retail Class. As an investor in Certificates, you are not necessarily the Holder.
See Description of Certificates — Form, Holders and Payment Procedures in the Offering Circular.
Denominations of Certificates
See Description of Certificates — Form, Holders and Payment Procedures in the Offering Circularfor the minimum denominations of the Classes.
Structure of Transaction
General
This Series is a Double-Tier Series, structured as follows:
REMIC Pool Classes Issued from REMIC Pool REMIC Pool Assets
Upper-Tier All Regular Classes and R All Lower-Tier regular interests andRetail Rounding Account
Lower-Tier RS The Assets
See Description of Certificates — REMIC Pool Structures in the Offering Circular.
The PC Assets
The PC Assets are Gold PCs and/or Gold Giant PCs.
The Multiclass Assets
The Multiclass Assets consist of previously issued Freddie Mac REMIC and MACR Certificates,which represent interests in their underlying PCs.
For additional information about the Multiclass Assets, see the Multiclass Asset Offering Circularsand other related information on our internet website. We have attached the front covers, Terms Sheetsand, if applicable, MACR tables from the Multiclass Asset Offering Circulars as Exhibits to thisSupplement.
There may have been material changes since we prepared the Multiclass Asset Offering Circulars,including changes in prepayment rates, prevailing interest rates and other economic factors. Thesechanges may limit the usefulness of, and be inconsistent with the assumptions used in preparing, theMulticlass Asset Offering Circulars.
The Mortgages
The Mortgages underlying the Assets (the “Mortgages”) are fixed-rate, first lien residentialmortgages and mortgage participations.
For purposes of this Supplement, we have made certain assumptions regarding the Mortgagesunderlying the PC Assets, as shown under Terms Sheet — Mortgage Characteristics. The weighted
S-15
average remaining terms to maturity, weighted average loan ages and weighted average interest rates ofthe Mortgages underlying the Multiclass Assets, as of March 1, 2012, are shown under Terms Sheet —Mortgage Characteristics. However, the actual characteristics of most of the Mortgages differ from thoseassumed or shown, perhaps significantly. This is the case even if the weighted average characteristics ofthe Mortgages are the same as those of mortgages having the characteristics assumed or shown.
The Group 4, 5 and 16 Assets are backed by Super-Conforming Mortgages. A “Super-ConformingMortgage” is a Mortgage secured by a property located in a designated high-cost area with an originalprincipal balance exceeding the base conforming loan limit ($417,000 for a one-family residence, or upto 125% of the median house price for certain geographic areas, not to exceed $729,750 for a one-familyresidence).
The Group 13 Assets are backed by High LTV Mortgages. A “High LTV Mortgage” is a Mortgagethat has a loan-to-value ratio at origination of greater than 105% and equal to or lower than 125% and maybe a fixed-rate Relief Refinance Mortgage originated under our Home Affordable Refinance Program.We pool High LTV Mortgages separately from our other Mortgages.
We may furnish some or all of the Assets from our own portfolio. Assets from our portfolio, or fromother sources, may emphasize specific Mortgage characteristics, such as loan purpose, source oforigination, geographic distribution or loan size, or specific borrower characteristics, such as creditscore or equity in the property. You can obtain information about the underlying Mortgage characteristicsfor the Assets from our internet website.
PAYMENTS
Payment Dates; Record Dates
We make payments of principal and interest on the Certificates on each Payment Date, beginning inthe month following the Closing Date. A “Payment Date” is the 15th of each month or, if the 15th is not aBusiness Day, the next Business Day.
On each Payment Date, any payment on a Certificate is made to the Holder of record as of the end ofthe preceding calendar month.
On each Payment Date, DTC remits payments on the Retail Classes to those DTC participants thatheld Retail Class Units of record as of the end of the preceding calendar month.
Method of Payment
You will receive payments on your Certificates in the manner described under Description ofCertificates — Form, Holders and Payment Procedures in the Offering Circular.
Categories of Classes
For purposes of principal and interest payments, we have categorized the Classes as shown under“Principal Type” and “Interest Type” on the front cover and Appendix A. Appendix II to the OfferingCircular explains the abbreviations used for categories of Classes.
S-16
Interest
We pay 30 days’ interest on each Payment Date to the Holders of each Class on which interest hasaccrued, except that the Accrual Classes receive payments as described below. We calculate each interestpayment on the outstanding balance of the Class immediately before the Payment Date and on the basisof a 360-day year of twelve 30-day months.
Accrual Period
The “Accrual Period” for each Payment Date is:
• For Fixed Rate and Delay Classes — the preceding calendar month.
• For Floating Rate and Inverse Floating Rate Classes other than Delay Classes — from the15th of the preceding month to the 15th of the month of that Payment Date.
Fixed Rate Classes
The Fixed Rate Classes bear interest at the Class Coupons shown on the front cover and Appendix A.
Notional Classes
The Notional Classes do not receive principal payments. For calculating interest payments, theNotional Classes have notional principal amounts that will reduce as shown under Terms Sheet —Notional Classes.
Floating Rate and Inverse Floating Rate Classes
The Floating Rate and Inverse Floating Rate Classes bear interest as shown under Terms Sheet —Interest. Their Class Coupons are based on one-month LIBOR.
We determine LIBOR and calculate the Class Coupons for the Floating Rate and Inverse FloatingRate Classes as described in Appendix V to the Offering Circular.
Accrual Classes
JZ, KZ, ZA, ZB, ZD, ZE, ZG, ZH, ZJ, ZK, ZM and ZN are Accrual Classes. The Accrual Classes donot receive interest payments; rather, interest accrued on an Accrual Class during each Accrual Period isadded to its principal amount on the related Payment Date. In the case of JZ, KZ, ZA, ZB, ZJ and ZK theamount so added is initially used to reduce other Classes. We pay principal on each Accrual Class,including accrued interest that has been added to its principal amount, as described under Terms Sheet —Principal.
Principal
We pay principal on each Payment Date to the Holders of the Classes on which principal is then due.Holders receive principal payments on a pro rata basis among the Certificates of their Class, subject tospecial allocation procedures for investors in a Retail Class.
S-17
Amount of Payments
The principal payments on the Certificates on each Payment Date equal:
• The amount of interest accrued on JZ, KZ, ZA, ZB and ZJ during the related Accrual Periodand not payable as interest on that Payment Date (the “JZ Accrual Amount,” the“KZ Accrual Amount” and so forth).
• The amount of principal required to be paid in the same month on the Assets of each Group,including, with respect to the Group 7 and 8 Asset Principal Amounts, any applicableAccrual Amounts paid as principal on such Assets in their own Series (the “Group 1 AssetPrincipal Amount,” the “Group 2 Asset Principal Amount” and so forth).
Allocation of Payments
On each Payment Date, we pay the Accrual Amounts and the Asset Principal Amounts for thatPayment Date as described under Terms Sheet — Principal. Principal allocable to the Classes receivingpayments from a particular Asset Group will be allocated only to those Classes and will not be availablefor Classes receiving payments from the other Asset Groups.
Retail Classes
Appendix IV to the Offering Circular describes how we make principal payments on the RetailClasses.
Class Factors
General
We make Class Factors available on or about the fifth business day of each month after the ClosingDate. See Description of Certificates — Payments — Class Factors in the Offering Circular.
Use of Factors
You can calculate principal and interest payments by using the Class Factors.
For example, the reduction (or for an Accrual Class, the increase) in the balance of a Certificate inFebruary will equal its original balance times the difference between its January and February ClassFactors. (The Class Factor for each Retail Class applies to that Class as a whole, not to individual RetailClass Units, and disregards any rounding of principal payments.) The amount of interest to be paid on (orfor an Accrual Class, added to the principal balance of) a Certificate in February will equal 30 days’interest at its Class Coupon, accrued during the related Accrual Period, on the balance of that Certificatedetermined by its January Class Factor. (The interest payable on each outstanding Retail Class Unit inFebruary will be based on its $1,000 balance, without regard to the January Class Factor.)
Guarantees
We guarantee to each Holder of a Certificate the timely payment of interest at its Class Coupon andthe payment of its principal amount as described in this Supplement. See Description of Certificates —Payments — Guarantees in the Offering Circular.
S-18

1% Clean-up Call
We have a 1% Clean-up Call Right. If we exercise this right, all of the Classes then outstanding willbe paid in full and will retire. 3889-KA and 3893-MA will not, and the other Multiclass Assets may,become subject to the similar 1% Clean-up Call Rights in their Series. See Description of Certificates —Payments — 1% Clean-up Call in the Offering Circular.
Residual Proceeds
Upon surrender of their Certificates to the Registrar, the Holders of each Residual Class will receivethe proceeds of any remaining assets of the related REMIC Pool after all required principal and interestpayments on the Classes have been made. Any remaining assets are likely to be insignificant. For R, theywill include the Retail Rounding Account. See Description of Certificates — Payments — ResidualClasses in the Offering Circular.
PREPAYMENT AND YIELD ANALYSIS
General
Mortgage Prepayments
The rates of principal payments on the Assets and the Certificates will depend on the rates ofprincipal payments, including prepayments, on the underlying Mortgages. The Mortgages are subject toprepayment at any time without penalty. Mortgage prepayment rates fluctuate continuously and, in somemarket conditions, substantially. See Prepayment, Yield and Suitability Considerations — Prepaymentsin the Offering Circular for a discussion of Mortgage prepayment considerations and risks.
Super-Conforming Mortgages may tend to prepay differently than standard conforming Mortgagesbecause of a number of factors, including their larger relative principal balance (and larger resultingsavings in the case of refinancing in a low interest rate environment), the presence of Freddie Mac andFannie Mae in the secondary market for such Mortgages (which may tend to reduce the prevailing interestrates offered by lenders for extending such Mortgages and to increase funds available for suchMortgages) and the possible geographic concentration of such Mortgages.
High LTV Mortgages may have different prepayment and default characteristics than othermortgages. High loan-to-value ratios are frequently associated with a lower likelihood of voluntaryprepayment and a greater risk of default. However, at this time, we do not have sufficient information todetermine whether or how the prepayment and default characteristics of High LTV Mortgages willcompare with those of other mortgages over an extended period of time.
Yield
As an investor in the Certificates, your yield will depend on:
• Your purchase price.
• The rate of principal payments on the underlying Mortgages.
• The actual characteristics of the underlying Mortgages.
• If you own a Floating Rate or Inverse Floating Rate Class, the level of LIBOR.
S-19
• If you own a Fixed Rate or Delay Class, the delay between its Accrual Period and the relatedPayment Date.
• If you own a Group 1, 3, 7, 8, 9 or 14 Class, the payment characteristics of the relatedMulticlass Assets in their own Series, as described in the Terms Sheets of the relatedMulticlass Asset Offering Circulars.
• If you own Retail Class Units, when they retire as a result of the special Retail Class principalpayment rules described in Appendix IV to the Offering Circular.
See Prepayment, Yield and Suitability Considerations — Yields in the Offering Circular for adiscussion of yield considerations and risks.
Suitability
The Certificates may not be suitable investments for you. See Prepayment, Yield and SuitabilityConsiderations — Suitability in the Offering Circular for a discussion of suitability considerations andrisks.
Modeling Assumptions
To prepare the tables in this Supplement, we have made several assumptions. Unless otherwisenoted, each table employs the following assumptions (the “Modeling Assumptions”), among others:
• The Mortgages underlying the PC Assets have the characteristics shown under TermsSheet — Mortgage Characteristics.
• As of March 1, 2012, each Mortgage underlying the Multiclass Assets has a remaining termto maturity equal to the weighted average remaining term to maturity, a loan age equal to theweighted average loan age, and an interest rate equal to the weighted average interest rate, ofall the Mortgages underlying the same PC.
• As of the Closing Date, the Assets have the balances shown under Terms Sheet — The Assets.
• The Multiclass Assets receive payments as described in the Multiclass Asset OfferingCirculars.
• The Classes and Assets always receive payments on the 15th of the month, whether or not aBusiness Day.
• We do not exercise our 1% Clean-up Call Right.
• We do not round Retail Class principal payments to multiples of $1,000.
• Each Class is outstanding from the Closing Date to retirement and no exchanges occur.
The Modeling Assumptions, like any other stated assumptions, are likely to differ from actualexperience in many cases. For example, the Mortgages have characteristics more diverse than thoseassumed, many Payment Dates will occur on a Business Day after the dates assumed and we may exerciseour 1% Clean-up Call Right. Moreover, Mortgage prepayment rates will differ from the percentages of
S-20
PSA shown in the tables. These differences will affect the actual payment behavior, weighted averagelives and yields of the Classes, perhaps significantly.
See Prepayment, Yield and Suitability Considerations — Tabular Information in Supplements in theOffering Circular for descriptions of weighted average life and yield calculations and the PSA prepay-ment model.
Prepayment and Weighted Average Life Considerations
PAC Classes
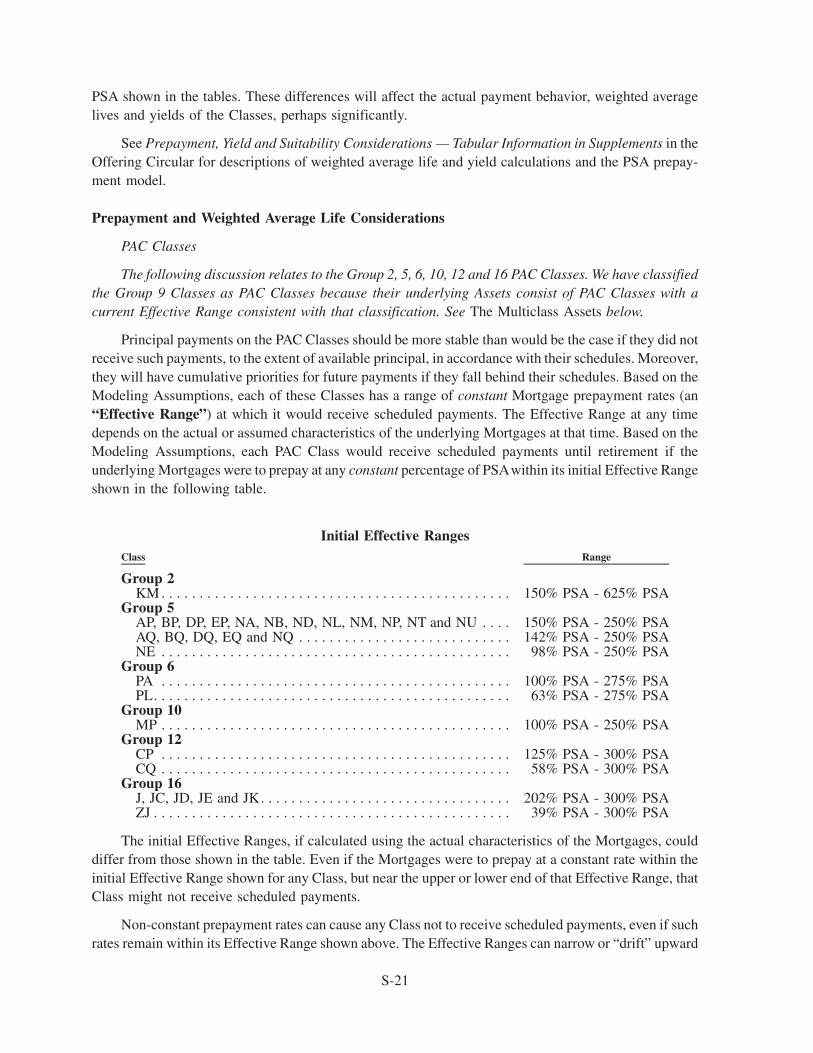
The following discussion relates to the Group 2, 5, 6, 10, 12 and 16 PAC Classes. We have classifiedthe Group 9 Classes as PAC Classes because their underlying Assets consist of PAC Classes with acurrent Effective Range consistent with that classification. See The Multiclass Assets below.
Principal payments on the PAC Classes should be more stable than would be the case if they did notreceive such payments, to the extent of available principal, in accordance with their schedules. Moreover,they will have cumulative priorities for future payments if they fall behind their schedules. Based on theModeling Assumptions, each of these Classes has a range of constant Mortgage prepayment rates (an“Effective Range”) at which it would receive scheduled payments. The Effective Range at any timedepends on the actual or assumed characteristics of the underlying Mortgages at that time. Based on theModeling Assumptions, each PAC Class would receive scheduled payments until retirement if theunderlying Mortgages were to prepay at any constant percentage of PSAwithin its initial Effective Rangeshown in the following table.
Initial Effective RangesClass Range
Group 2KM . . . . . . . . . . . . . . . . . . . . . . . . . . . . . . . . . . . . . . . . . . . . . . 150% PSA - 625% PSA
Group 5AP, BP, DP, EP, NA, NB, ND, NL, NM, NP, NT and NU . . . . 150% PSA - 250% PSAAQ, BQ, DQ, EQ and NQ . . . . . . . . . . . . . . . . . . . . . . . . . . . . 142% PSA - 250% PSANE . . . . . . . . . . . . . . . . . . . . . . . . . . . . . . . . . . . . . . . . . . . . . . 98% PSA - 250% PSA
Group 6PA . . . . . . . . . . . . . . . . . . . . . . . . . . . . . . . . . . . . . . . . . . . . . . 100% PSA - 275% PSAPL. . . . . . . . . . . . . . . . . . . . . . . . . . . . . . . . . . . . . . . . . . . . . . . 63% PSA - 275% PSA
Group 10MP . . . . . . . . . . . . . . . . . . . . . . . . . . . . . . . . . . . . . . . . . . . . . . 100% PSA - 250% PSA
Group 12CP . . . . . . . . . . . . . . . . . . . . . . . . . . . . . . . . . . . . . . . . . . . . . . 125% PSA - 300% PSACQ . . . . . . . . . . . . . . . . . . . . . . . . . . . . . . . . . . . . . . . . . . . . . . 58% PSA - 300% PSA
Group 16J, JC, JD, JE and JK. . . . . . . . . . . . . . . . . . . . . . . . . . . . . . . . . 202% PSA - 300% PSAZJ . . . . . . . . . . . . . . . . . . . . . . . . . . . . . . . . . . . . . . . . . . . . . . . 39% PSA - 300% PSA
The initial Effective Ranges, if calculated using the actual characteristics of the Mortgages, coulddiffer from those shown in the table. Even if the Mortgages were to prepay at a constant rate within theinitial Effective Range shown for any Class, but near the upper or lower end of that Effective Range, thatClass might not receive scheduled payments.
Non-constant prepayment rates can cause any Class not to receive scheduled payments, even if suchrates remain within its Effective Range shown above. The Effective Ranges can narrow or “drift” upward
S-21
or downward over time. Under many scenarios the Classes shown in the table would not receivescheduled payments.
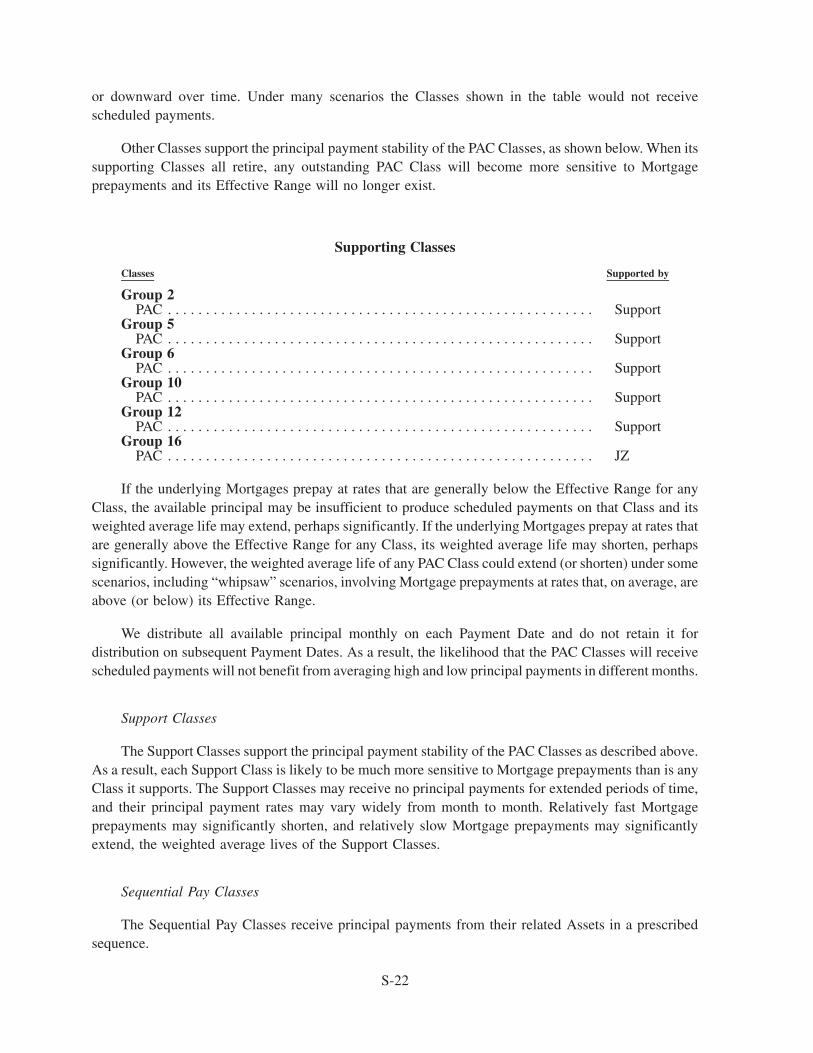
Other Classes support the principal payment stability of the PAC Classes, as shown below. When itssupporting Classes all retire, any outstanding PAC Class will become more sensitive to Mortgageprepayments and its Effective Range will no longer exist.
Supporting Classes
Classes Supported by
Group 2PAC . . . . . . . . . . . . . . . . . . . . . . . . . . . . . . . . . . . . . . . . . . . . . . . . . . . . . . . . Support
Group 5PAC . . . . . . . . . . . . . . . . . . . . . . . . . . . . . . . . . . . . . . . . . . . . . . . . . . . . . . . . Support
Group 6PAC . . . . . . . . . . . . . . . . . . . . . . . . . . . . . . . . . . . . . . . . . . . . . . . . . . . . . . . . Support
Group 10PAC . . . . . . . . . . . . . . . . . . . . . . . . . . . . . . . . . . . . . . . . . . . . . . . . . . . . . . . . Support
Group 12PAC . . . . . . . . . . . . . . . . . . . . . . . . . . . . . . . . . . . . . . . . . . . . . . . . . . . . . . . . Support
Group 16PAC . . . . . . . . . . . . . . . . . . . . . . . . . . . . . . . . . . . . . . . . . . . . . . . . . . . . . . . . JZ
If the underlying Mortgages prepay at rates that are generally below the Effective Range for anyClass, the available principal may be insufficient to produce scheduled payments on that Class and itsweighted average life may extend, perhaps significantly. If the underlying Mortgages prepay at rates thatare generally above the Effective Range for any Class, its weighted average life may shorten, perhapssignificantly. However, the weighted average life of any PAC Class could extend (or shorten) under somescenarios, including “whipsaw” scenarios, involving Mortgage prepayments at rates that, on average, areabove (or below) its Effective Range.
We distribute all available principal monthly on each Payment Date and do not retain it fordistribution on subsequent Payment Dates. As a result, the likelihood that the PAC Classes will receivescheduled payments will not benefit from averaging high and low principal payments in different months.
Support Classes
The Support Classes support the principal payment stability of the PAC Classes as described above.As a result, each Support Class is likely to be much more sensitive to Mortgage prepayments than is anyClass it supports. The Support Classes may receive no principal payments for extended periods of time,and their principal payment rates may vary widely from month to month. Relatively fast Mortgageprepayments may significantly shorten, and relatively slow Mortgage prepayments may significantlyextend, the weighted average lives of the Support Classes.
Sequential Pay Classes
The Sequential Pay Classes receive principal payments from their related Assets in a prescribedsequence.
S-22
Pass-Through Classes
Each Pass-Through Class receives all or a specified portion of the principal payments made on itsrelated Assets. The sensitivity of each Pass-Through Class to prepayments on the underlying Mortgagesis the same as that of its related Assets.
The Multiclass Assets
The Group 1 and 14 Assets consist of Sequential Pay Classes and a Pass-Through Class. TheseSequential Pay Classes receive principal payments from their related Assets in a prescribed sequencewith other Classes in their Series. The Pass-Through Class receives all or a specified portion of theprincipal payments made on its related Assets.
The Group 3 and 9 Assets consist of PAC Classes that were structured to receive principal paymentsin accordance with schedules. Based on the Modeling Assumptions for this Series, the Group 3 Assetscurrently have an Effective Range of 255% PSA through 296% PSA, and the Group 9 Assets, as a whole,currently have an Effective Range of 108% PSA through 226% PSA. We cannot predict whether or forhow long these PAC Classes might receive scheduled payments.
The Group 7 and 8 Assets consist of Pass-Through Classes that receive a specified portion of theprincipal payments (and additions to principal) made on their underlying Assets, each of which is anAccrual Class.
See Prepayment and Yield Analysis in the Multiclass Asset Offering Circulars.
MACR Classes
The payment characteristics of the MACR Classes reflect the payment characteristics of theirrelated REMIC Classes.
Retail Classes
Principal payments on each Retail Class will depend on the prepayment rate on the underlyingMortgages. As a result, it is uncertain when principal payments on the Retail Classes will begin, how fastthey will occur and when the Retail Classes will retire. Under some prepayment scenarios, your RetailClass Units could retire on the first Payment Date, especially if you invest in AA, EE or GG. On the otherhand, they could retire as late as the Final Payment Date for your Retail Class.
The amount of principal available for payment on a Retail Class on any given Payment Date will belimited. As a result, if you request a Retail Class principal payment, your request may not be honoreduntil long after you submit it. The likelihood that your request will be honored at any particular time willdepend in part on the number of Retail Class Units owned by Deceased Owners who have a prior right ofpayment and on the number of Retail Class Units owned by other Living Owners who have submittedrequests. On the other hand, the amount of principal available for payment on your Retail Class on anygiven Payment Date could exceed the amount necessary to honor all requests. In that case, you mayreceive principal payments you did not request.
When prevailing interest rates are higher than the Class Coupon of a Retail Class, a greater numberof investors in that Class are likely to request Retail Class principal payments. At the same time, however,Mortgage prepayment rates are likely to decline, reducing the funds available for Retail Class principalpayments. By contrast, Mortgage prepayment rates are likely to accelerate when prevailing interest ratesdecline, while investors may be less likely to request Retail Class principal payments. If your Retail
S-23
Class Units are selected for payment under such conditions, you may not be able to reinvest yourpayments in comparable securities at as high a yield.
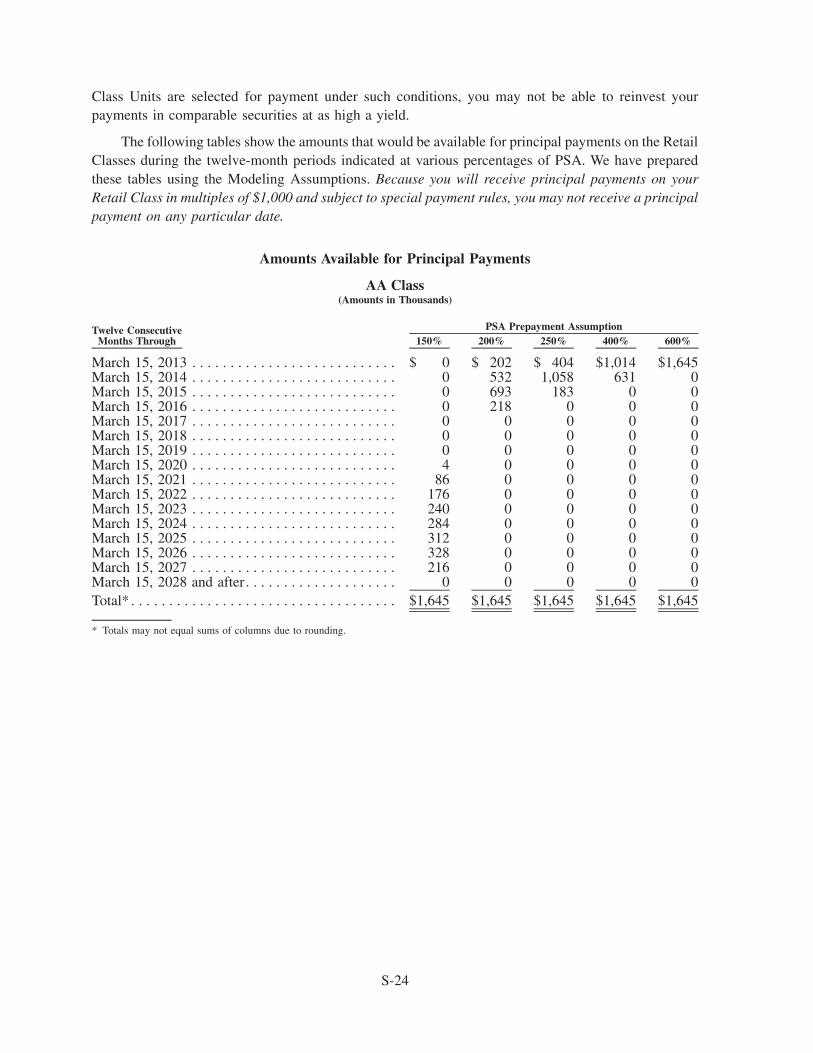
The following tables show the amounts that would be available for principal payments on the RetailClasses during the twelve-month periods indicated at various percentages of PSA. We have preparedthese tables using the Modeling Assumptions. Because you will receive principal payments on yourRetail Class in multiples of $1,000 and subject to special payment rules, you may not receive a principalpayment on any particular date.
Amounts Available for Principal Payments
AA Class(Amounts in Thousands)
Twelve ConsecutiveMonths Through 150% 200% 250% 400% 600%
PSA Prepayment Assumption
March 15, 2013 . . . . . . . . . . . . . . . . . . . . . . . . . . . $ 0 $ 202 $ 404 $1,014 $1,645March 15, 2014 . . . . . . . . . . . . . . . . . . . . . . . . . . . 0 532 1,058 631 0March 15, 2015 . . . . . . . . . . . . . . . . . . . . . . . . . . . 0 693 183 0 0March 15, 2016 . . . . . . . . . . . . . . . . . . . . . . . . . . . 0 218 0 0 0March 15, 2017 . . . . . . . . . . . . . . . . . . . . . . . . . . . 0 0 0 0 0March 15, 2018 . . . . . . . . . . . . . . . . . . . . . . . . . . . 0 0 0 0 0March 15, 2019 . . . . . . . . . . . . . . . . . . . . . . . . . . . 0 0 0 0 0March 15, 2020 . . . . . . . . . . . . . . . . . . . . . . . . . . . 4 0 0 0 0March 15, 2021 . . . . . . . . . . . . . . . . . . . . . . . . . . . 86 0 0 0 0March 15, 2022 . . . . . . . . . . . . . . . . . . . . . . . . . . . 176 0 0 0 0March 15, 2023 . . . . . . . . . . . . . . . . . . . . . . . . . . . 240 0 0 0 0March 15, 2024 . . . . . . . . . . . . . . . . . . . . . . . . . . . 284 0 0 0 0March 15, 2025 . . . . . . . . . . . . . . . . . . . . . . . . . . . 312 0 0 0 0March 15, 2026 . . . . . . . . . . . . . . . . . . . . . . . . . . . 328 0 0 0 0March 15, 2027 . . . . . . . . . . . . . . . . . . . . . . . . . . . 216 0 0 0 0March 15, 2028 and after . . . . . . . . . . . . . . . . . . . . 0 0 0 0 0Total* . . . . . . . . . . . . . . . . . . . . . . . . . . . . . . . . . . . $1,645 $1,645 $1,645 $1,645 $1,645
* Totals may not equal sums of columns due to rounding.
S-24
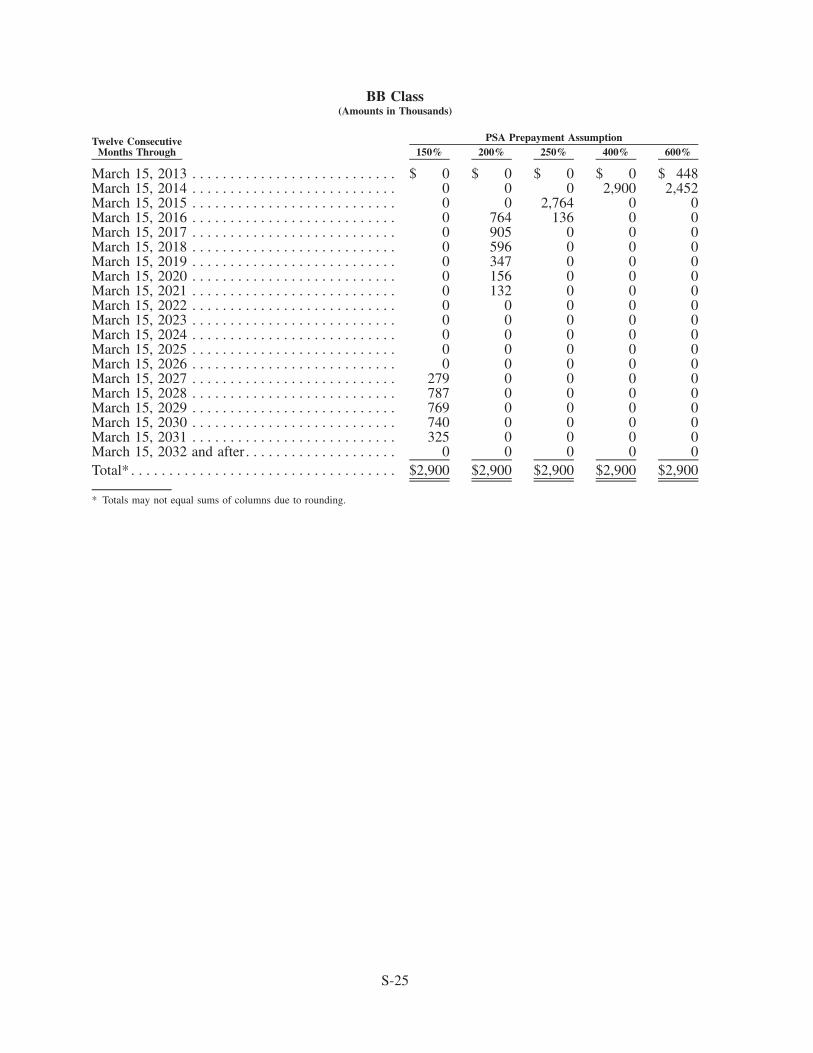
BB Class(Amounts in Thousands)
Twelve ConsecutiveMonths Through 150% 200% 250% 400% 600%
PSA Prepayment Assumption
March 15, 2013 . . . . . . . . . . . . . . . . . . . . . . . . . . . $ 0 $ 0 $ 0 $ 0 $ 448March 15, 2014 . . . . . . . . . . . . . . . . . . . . . . . . . . . 0 0 0 2,900 2,452March 15, 2015 . . . . . . . . . . . . . . . . . . . . . . . . . . . 0 0 2,764 0 0March 15, 2016 . . . . . . . . . . . . . . . . . . . . . . . . . . . 0 764 136 0 0March 15, 2017 . . . . . . . . . . . . . . . . . . . . . . . . . . . 0 905 0 0 0March 15, 2018 . . . . . . . . . . . . . . . . . . . . . . . . . . . 0 596 0 0 0March 15, 2019 . . . . . . . . . . . . . . . . . . . . . . . . . . . 0 347 0 0 0March 15, 2020 . . . . . . . . . . . . . . . . . . . . . . . . . . . 0 156 0 0 0March 15, 2021 . . . . . . . . . . . . . . . . . . . . . . . . . . . 0 132 0 0 0March 15, 2022 . . . . . . . . . . . . . . . . . . . . . . . . . . . 0 0 0 0 0March 15, 2023 . . . . . . . . . . . . . . . . . . . . . . . . . . . 0 0 0 0 0March 15, 2024 . . . . . . . . . . . . . . . . . . . . . . . . . . . 0 0 0 0 0March 15, 2025 . . . . . . . . . . . . . . . . . . . . . . . . . . . 0 0 0 0 0March 15, 2026 . . . . . . . . . . . . . . . . . . . . . . . . . . . 0 0 0 0 0March 15, 2027 . . . . . . . . . . . . . . . . . . . . . . . . . . . 279 0 0 0 0March 15, 2028 . . . . . . . . . . . . . . . . . . . . . . . . . . . 787 0 0 0 0March 15, 2029 . . . . . . . . . . . . . . . . . . . . . . . . . . . 769 0 0 0 0March 15, 2030 . . . . . . . . . . . . . . . . . . . . . . . . . . . 740 0 0 0 0March 15, 2031 . . . . . . . . . . . . . . . . . . . . . . . . . . . 325 0 0 0 0March 15, 2032 and after . . . . . . . . . . . . . . . . . . . . 0 0 0 0 0Total* . . . . . . . . . . . . . . . . . . . . . . . . . . . . . . . . . . . $2,900 $2,900 $2,900 $2,900 $2,900
* Totals may not equal sums of columns due to rounding.
S-25
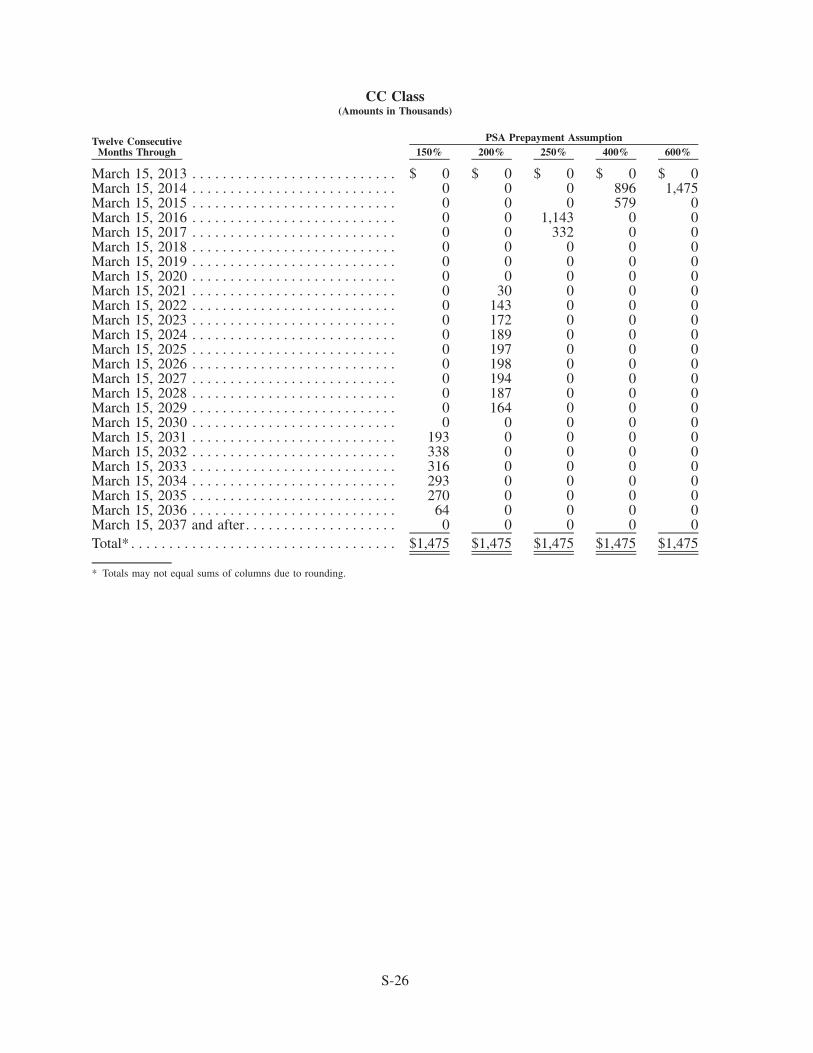
CC Class(Amounts in Thousands)
Twelve ConsecutiveMonths Through 150% 200% 250% 400% 600%
PSA Prepayment Assumption
March 15, 2013 . . . . . . . . . . . . . . . . . . . . . . . . . . . $ 0 $ 0 $ 0 $ 0 $ 0March 15, 2014 . . . . . . . . . . . . . . . . . . . . . . . . . . . 0 0 0 896 1,475March 15, 2015 . . . . . . . . . . . . . . . . . . . . . . . . . . . 0 0 0 579 0March 15, 2016 . . . . . . . . . . . . . . . . . . . . . . . . . . . 0 0 1,143 0 0March 15, 2017 . . . . . . . . . . . . . . . . . . . . . . . . . . . 0 0 332 0 0March 15, 2018 . . . . . . . . . . . . . . . . . . . . . . . . . . . 0 0 0 0 0March 15, 2019 . . . . . . . . . . . . . . . . . . . . . . . . . . . 0 0 0 0 0March 15, 2020 . . . . . . . . . . . . . . . . . . . . . . . . . . . 0 0 0 0 0March 15, 2021 . . . . . . . . . . . . . . . . . . . . . . . . . . . 0 30 0 0 0March 15, 2022 . . . . . . . . . . . . . . . . . . . . . . . . . . . 0 143 0 0 0March 15, 2023 . . . . . . . . . . . . . . . . . . . . . . . . . . . 0 172 0 0 0March 15, 2024 . . . . . . . . . . . . . . . . . . . . . . . . . . . 0 189 0 0 0March 15, 2025 . . . . . . . . . . . . . . . . . . . . . . . . . . . 0 197 0 0 0March 15, 2026 . . . . . . . . . . . . . . . . . . . . . . . . . . . 0 198 0 0 0March 15, 2027 . . . . . . . . . . . . . . . . . . . . . . . . . . . 0 194 0 0 0March 15, 2028 . . . . . . . . . . . . . . . . . . . . . . . . . . . 0 187 0 0 0March 15, 2029 . . . . . . . . . . . . . . . . . . . . . . . . . . . 0 164 0 0 0March 15, 2030 . . . . . . . . . . . . . . . . . . . . . . . . . . . 0 0 0 0 0March 15, 2031 . . . . . . . . . . . . . . . . . . . . . . . . . . . 193 0 0 0 0March 15, 2032 . . . . . . . . . . . . . . . . . . . . . . . . . . . 338 0 0 0 0March 15, 2033 . . . . . . . . . . . . . . . . . . . . . . . . . . . 316 0 0 0 0March 15, 2034 . . . . . . . . . . . . . . . . . . . . . . . . . . . 293 0 0 0 0March 15, 2035 . . . . . . . . . . . . . . . . . . . . . . . . . . . 270 0 0 0 0March 15, 2036 . . . . . . . . . . . . . . . . . . . . . . . . . . . 64 0 0 0 0March 15, 2037 and after . . . . . . . . . . . . . . . . . . . . 0 0 0 0 0Total* . . . . . . . . . . . . . . . . . . . . . . . . . . . . . . . . . . . $1,475 $1,475 $1,475 $1,475 $1,475
* Totals may not equal sums of columns due to rounding.
S-26
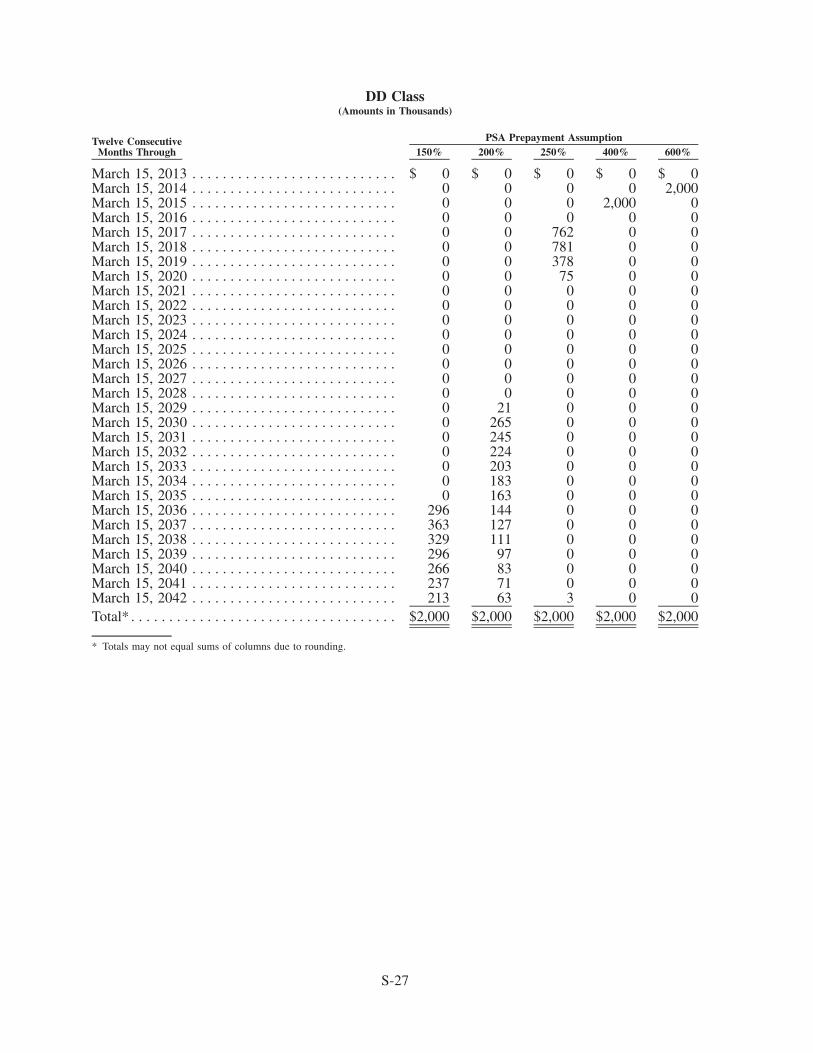
DD Class(Amounts in Thousands)
Twelve ConsecutiveMonths Through 150% 200% 250% 400% 600%
PSA Prepayment Assumption
March 15, 2013 . . . . . . . . . . . . . . . . . . . . . . . . . . . $ 0 $ 0 $ 0 $ 0 $ 0March 15, 2014 . . . . . . . . . . . . . . . . . . . . . . . . . . . 0 0 0 0 2,000March 15, 2015 . . . . . . . . . . . . . . . . . . . . . . . . . . . 0 0 0 2,000 0March 15, 2016 . . . . . . . . . . . . . . . . . . . . . . . . . . . 0 0 0 0 0March 15, 2017 . . . . . . . . . . . . . . . . . . . . . . . . . . . 0 0 762 0 0March 15, 2018 . . . . . . . . . . . . . . . . . . . . . . . . . . . 0 0 781 0 0March 15, 2019 . . . . . . . . . . . . . . . . . . . . . . . . . . . 0 0 378 0 0March 15, 2020 . . . . . . . . . . . . . . . . . . . . . . . . . . . 0 0 75 0 0March 15, 2021 . . . . . . . . . . . . . . . . . . . . . . . . . . . 0 0 0 0 0March 15, 2022 . . . . . . . . . . . . . . . . . . . . . . . . . . . 0 0 0 0 0March 15, 2023 . . . . . . . . . . . . . . . . . . . . . . . . . . . 0 0 0 0 0March 15, 2024 . . . . . . . . . . . . . . . . . . . . . . . . . . . 0 0 0 0 0March 15, 2025 . . . . . . . . . . . . . . . . . . . . . . . . . . . 0 0 0 0 0March 15, 2026 . . . . . . . . . . . . . . . . . . . . . . . . . . . 0 0 0 0 0March 15, 2027 . . . . . . . . . . . . . . . . . . . . . . . . . . . 0 0 0 0 0March 15, 2028 . . . . . . . . . . . . . . . . . . . . . . . . . . . 0 0 0 0 0March 15, 2029 . . . . . . . . . . . . . . . . . . . . . . . . . . . 0 21 0 0 0March 15, 2030 . . . . . . . . . . . . . . . . . . . . . . . . . . . 0 265 0 0 0March 15, 2031 . . . . . . . . . . . . . . . . . . . . . . . . . . . 0 245 0 0 0March 15, 2032 . . . . . . . . . . . . . . . . . . . . . . . . . . . 0 224 0 0 0March 15, 2033 . . . . . . . . . . . . . . . . . . . . . . . . . . . 0 203 0 0 0March 15, 2034 . . . . . . . . . . . . . . . . . . . . . . . . . . . 0 183 0 0 0March 15, 2035 . . . . . . . . . . . . . . . . . . . . . . . . . . . 0 163 0 0 0March 15, 2036 . . . . . . . . . . . . . . . . . . . . . . . . . . . 296 144 0 0 0March 15, 2037 . . . . . . . . . . . . . . . . . . . . . . . . . . . 363 127 0 0 0March 15, 2038 . . . . . . . . . . . . . . . . . . . . . . . . . . . 329 111 0 0 0March 15, 2039 . . . . . . . . . . . . . . . . . . . . . . . . . . . 296 97 0 0 0March 15, 2040 . . . . . . . . . . . . . . . . . . . . . . . . . . . 266 83 0 0 0March 15, 2041 . . . . . . . . . . . . . . . . . . . . . . . . . . . 237 71 0 0 0March 15, 2042 . . . . . . . . . . . . . . . . . . . . . . . . . . . 213 63 3 0 0Total* . . . . . . . . . . . . . . . . . . . . . . . . . . . . . . . . . . . $2,000 $2,000 $2,000 $2,000 $2,000
* Totals may not equal sums of columns due to rounding.
S-27
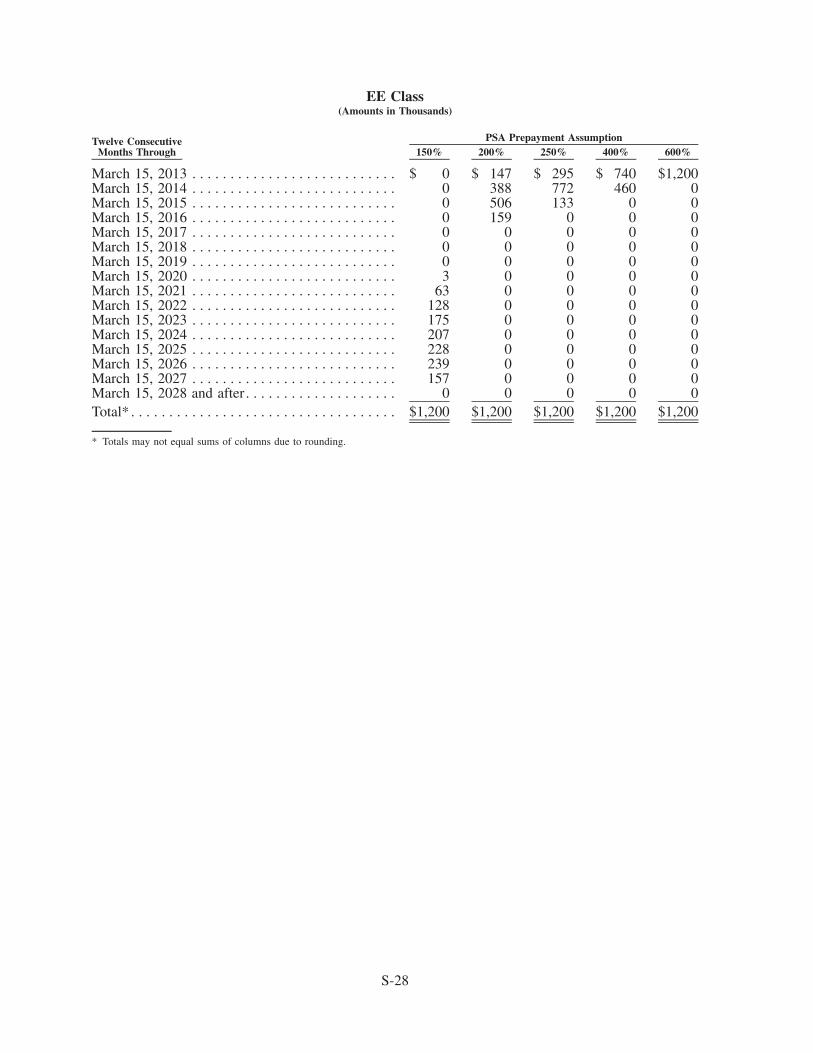
EE Class(Amounts in Thousands)
Twelve ConsecutiveMonths Through 150% 200% 250% 400% 600%
PSA Prepayment Assumption
March 15, 2013 . . . . . . . . . . . . . . . . . . . . . . . . . . . $ 0 $ 147 $ 295 $ 740 $1,200March 15, 2014 . . . . . . . . . . . . . . . . . . . . . . . . . . . 0 388 772 460 0March 15, 2015 . . . . . . . . . . . . . . . . . . . . . . . . . . . 0 506 133 0 0March 15, 2016 . . . . . . . . . . . . . . . . . . . . . . . . . . . 0 159 0 0 0March 15, 2017 . . . . . . . . . . . . . . . . . . . . . . . . . . . 0 0 0 0 0March 15, 2018 . . . . . . . . . . . . . . . . . . . . . . . . . . . 0 0 0 0 0March 15, 2019 . . . . . . . . . . . . . . . . . . . . . . . . . . . 0 0 0 0 0March 15, 2020 . . . . . . . . . . . . . . . . . . . . . . . . . . . 3 0 0 0 0March 15, 2021 . . . . . . . . . . . . . . . . . . . . . . . . . . . 63 0 0 0 0March 15, 2022 . . . . . . . . . . . . . . . . . . . . . . . . . . . 128 0 0 0 0March 15, 2023 . . . . . . . . . . . . . . . . . . . . . . . . . . . 175 0 0 0 0March 15, 2024 . . . . . . . . . . . . . . . . . . . . . . . . . . . 207 0 0 0 0March 15, 2025 . . . . . . . . . . . . . . . . . . . . . . . . . . . 228 0 0 0 0March 15, 2026 . . . . . . . . . . . . . . . . . . . . . . . . . . . 239 0 0 0 0March 15, 2027 . . . . . . . . . . . . . . . . . . . . . . . . . . . 157 0 0 0 0March 15, 2028 and after . . . . . . . . . . . . . . . . . . . . 0 0 0 0 0Total* . . . . . . . . . . . . . . . . . . . . . . . . . . . . . . . . . . . $1,200 $1,200 $1,200 $1,200 $1,200
* Totals may not equal sums of columns due to rounding.
S-28
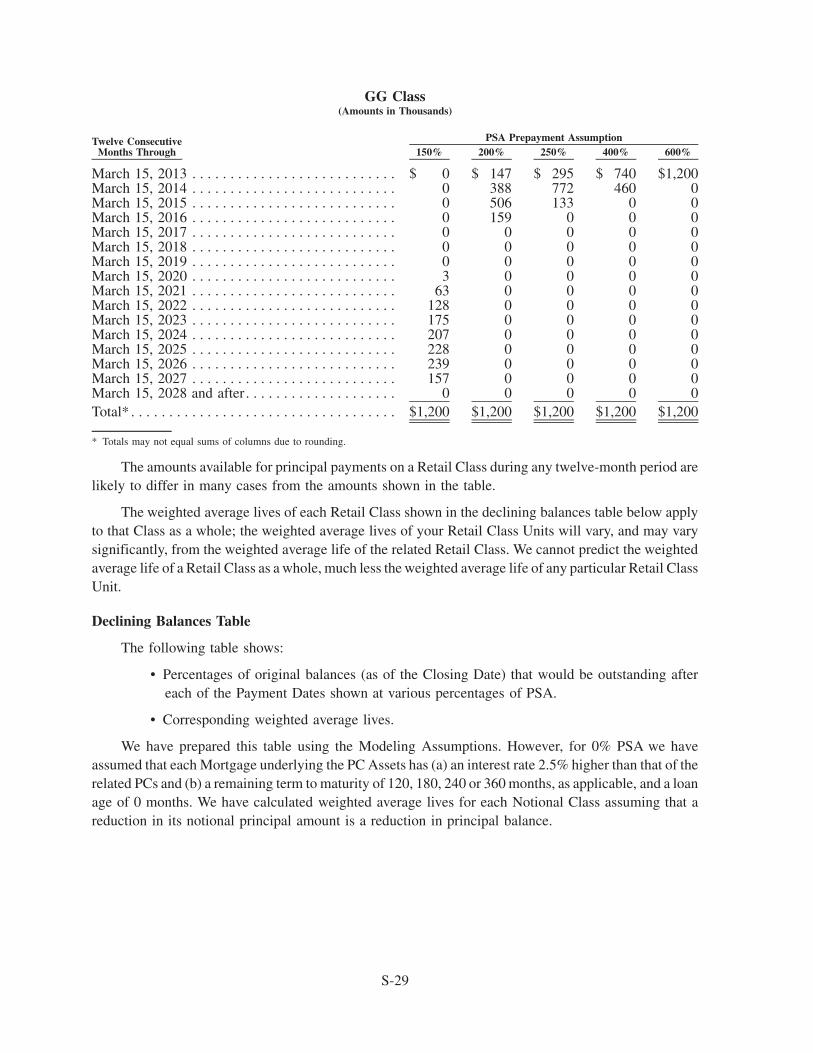
GG Class(Amounts in Thousands)
Twelve ConsecutiveMonths Through 150% 200% 250% 400% 600%
PSA Prepayment Assumption
March 15, 2013 . . . . . . . . . . . . . . . . . . . . . . . . . . . $ 0 $ 147 $ 295 $ 740 $1,200March 15, 2014 . . . . . . . . . . . . . . . . . . . . . . . . . . . 0 388 772 460 0March 15, 2015 . . . . . . . . . . . . . . . . . . . . . . . . . . . 0 506 133 0 0March 15, 2016 . . . . . . . . . . . . . . . . . . . . . . . . . . . 0 159 0 0 0March 15, 2017 . . . . . . . . . . . . . . . . . . . . . . . . . . . 0 0 0 0 0March 15, 2018 . . . . . . . . . . . . . . . . . . . . . . . . . . . 0 0 0 0 0March 15, 2019 . . . . . . . . . . . . . . . . . . . . . . . . . . . 0 0 0 0 0March 15, 2020 . . . . . . . . . . . . . . . . . . . . . . . . . . . 3 0 0 0 0March 15, 2021 . . . . . . . . . . . . . . . . . . . . . . . . . . . 63 0 0 0 0March 15, 2022 . . . . . . . . . . . . . . . . . . . . . . . . . . . 128 0 0 0 0March 15, 2023 . . . . . . . . . . . . . . . . . . . . . . . . . . . 175 0 0 0 0March 15, 2024 . . . . . . . . . . . . . . . . . . . . . . . . . . . 207 0 0 0 0March 15, 2025 . . . . . . . . . . . . . . . . . . . . . . . . . . . 228 0 0 0 0March 15, 2026 . . . . . . . . . . . . . . . . . . . . . . . . . . . 239 0 0 0 0March 15, 2027 . . . . . . . . . . . . . . . . . . . . . . . . . . . 157 0 0 0 0March 15, 2028 and after . . . . . . . . . . . . . . . . . . . . 0 0 0 0 0Total* . . . . . . . . . . . . . . . . . . . . . . . . . . . . . . . . . . . $1,200 $1,200 $1,200 $1,200 $1,200
* Totals may not equal sums of columns due to rounding.
The amounts available for principal payments on a Retail Class during any twelve-month period arelikely to differ in many cases from the amounts shown in the table.
The weighted average lives of each Retail Class shown in the declining balances table below applyto that Class as a whole; the weighted average lives of your Retail Class Units will vary, and may varysignificantly, from the weighted average life of the related Retail Class. We cannot predict the weightedaverage life of a Retail Class as a whole, much less the weighted average life of any particular Retail ClassUnit.
Declining Balances Table
The following table shows:
• Percentages of original balances (as of the Closing Date) that would be outstanding aftereach of the Payment Dates shown at various percentages of PSA.
• Corresponding weighted average lives.
We have prepared this table using the Modeling Assumptions. However, for 0% PSA we haveassumed that each Mortgage underlying the PC Assets has (a) an interest rate 2.5% higher than that of therelated PCs and (b) a remaining term to maturity of 120, 180, 240 or 360 months, as applicable, and a loanage of 0 months. We have calculated weighted average lives for each Notional Class assuming that areduction in its notional principal amount is a reduction in principal balance.
S-29
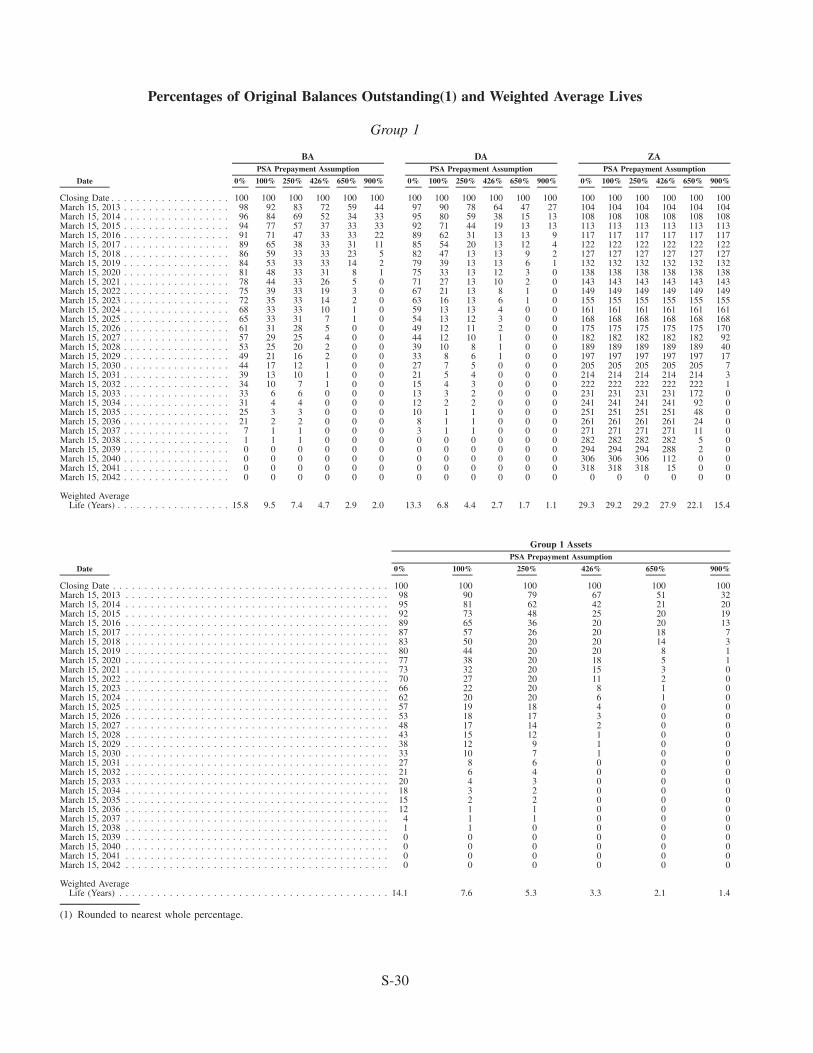
Percentages of Original Balances Outstanding(1) and Weighted Average Lives
Group 1
Date 0% 100% 250% 426% 650% 900% 0% 100% 250% 426% 650% 900% 0% 100% 250% 426% 650% 900%
PSA Prepayment AssumptionPSA Prepayment AssumptionPSA Prepayment Assumption
ZADABA
Closing Date . . . . . . . . . . . . . . . . . . . 100 100 100 100 100 100 100 100 100 100 100 100 100 100 100 100 100 100March 15, 2013 . . . . . . . . . . . . . . . . . 98 92 83 72 59 44 97 90 78 64 47 27 104 104 104 104 104 104March 15, 2014 . . . . . . . . . . . . . . . . . 96 84 69 52 34 33 95 80 59 38 15 13 108 108 108 108 108 108March 15, 2015 . . . . . . . . . . . . . . . . . 94 77 57 37 33 33 92 71 44 19 13 13 113 113 113 113 113 113March 15, 2016 . . . . . . . . . . . . . . . . . 91 71 47 33 33 22 89 62 31 13 13 9 117 117 117 117 117 117March 15, 2017 . . . . . . . . . . . . . . . . . 89 65 38 33 31 11 85 54 20 13 12 4 122 122 122 122 122 122March 15, 2018 . . . . . . . . . . . . . . . . . 86 59 33 33 23 5 82 47 13 13 9 2 127 127 127 127 127 127March 15, 2019 . . . . . . . . . . . . . . . . . 84 53 33 33 14 2 79 39 13 13 6 1 132 132 132 132 132 132March 15, 2020 . . . . . . . . . . . . . . . . . 81 48 33 31 8 1 75 33 13 12 3 0 138 138 138 138 138 138March 15, 2021 . . . . . . . . . . . . . . . . . 78 44 33 26 5 0 71 27 13 10 2 0 143 143 143 143 143 143March 15, 2022 . . . . . . . . . . . . . . . . . 75 39 33 19 3 0 67 21 13 8 1 0 149 149 149 149 149 149March 15, 2023 . . . . . . . . . . . . . . . . . 72 35 33 14 2 0 63 16 13 6 1 0 155 155 155 155 155 155March 15, 2024 . . . . . . . . . . . . . . . . . 68 33 33 10 1 0 59 13 13 4 0 0 161 161 161 161 161 161March 15, 2025 . . . . . . . . . . . . . . . . . 65 33 31 7 1 0 54 13 12 3 0 0 168 168 168 168 168 168March 15, 2026 . . . . . . . . . . . . . . . . . 61 31 28 5 0 0 49 12 11 2 0 0 175 175 175 175 175 170March 15, 2027 . . . . . . . . . . . . . . . . . 57 29 25 4 0 0 44 12 10 1 0 0 182 182 182 182 182 92March 15, 2028 . . . . . . . . . . . . . . . . . 53 25 20 2 0 0 39 10 8 1 0 0 189 189 189 189 189 40March 15, 2029 . . . . . . . . . . . . . . . . . 49 21 16 2 0 0 33 8 6 1 0 0 197 197 197 197 197 17March 15, 2030 . . . . . . . . . . . . . . . . . 44 17 12 1 0 0 27 7 5 0 0 0 205 205 205 205 205 7March 15, 2031 . . . . . . . . . . . . . . . . . 39 13 10 1 0 0 21 5 4 0 0 0 214 214 214 214 214 3March 15, 2032 . . . . . . . . . . . . . . . . . 34 10 7 1 0 0 15 4 3 0 0 0 222 222 222 222 222 1March 15, 2033 . . . . . . . . . . . . . . . . . 33 6 6 0 0 0 13 3 2 0 0 0 231 231 231 231 172 0March 15, 2034 . . . . . . . . . . . . . . . . . 31 4 4 0 0 0 12 2 2 0 0 0 241 241 241 241 92 0March 15, 2035 . . . . . . . . . . . . . . . . . 25 3 3 0 0 0 10 1 1 0 0 0 251 251 251 251 48 0March 15, 2036 . . . . . . . . . . . . . . . . . 21 2 2 0 0 0 8 1 1 0 0 0 261 261 261 261 24 0March 15, 2037 . . . . . . . . . . . . . . . . . 7 1 1 0 0 0 3 1 1 0 0 0 271 271 271 271 11 0March 15, 2038 . . . . . . . . . . . . . . . . . 1 1 1 0 0 0 0 0 0 0 0 0 282 282 282 282 5 0March 15, 2039 . . . . . . . . . . . . . . . . . 0 0 0 0 0 0 0 0 0 0 0 0 294 294 294 288 2 0March 15, 2040 . . . . . . . . . . . . . . . . . 0 0 0 0 0 0 0 0 0 0 0 0 306 306 306 112 0 0March 15, 2041 . . . . . . . . . . . . . . . . . 0 0 0 0 0 0 0 0 0 0 0 0 318 318 318 15 0 0March 15, 2042 . . . . . . . . . . . . . . . . . 0 0 0 0 0 0 0 0 0 0 0 0 0 0 0 0 0 0
Weighted AverageLife (Years) . . . . . . . . . . . . . . . . . . 15.8 9.5 7.4 4.7 2.9 2.0 13.3 6.8 4.4 2.7 1.7 1.1 29.3 29.2 29.2 27.9 22.1 15.4
Date 0% 100% 250% 426% 650% 900%
PSA Prepayment Assumption
Group 1 Assets
Closing Date . . . . . . . . . . . . . . . . . . . . . . . . . . . . . . . . . . . . . . . . . . . . 100 100 100 100 100 100March 15, 2013 . . . . . . . . . . . . . . . . . . . . . . . . . . . . . . . . . . . . . . . . . . 98 90 79 67 51 32March 15, 2014 . . . . . . . . . . . . . . . . . . . . . . . . . . . . . . . . . . . . . . . . . . 95 81 62 42 21 20March 15, 2015 . . . . . . . . . . . . . . . . . . . . . . . . . . . . . . . . . . . . . . . . . . 92 73 48 25 20 19March 15, 2016 . . . . . . . . . . . . . . . . . . . . . . . . . . . . . . . . . . . . . . . . . . 89 65 36 20 20 13March 15, 2017 . . . . . . . . . . . . . . . . . . . . . . . . . . . . . . . . . . . . . . . . . . 87 57 26 20 18 7March 15, 2018 . . . . . . . . . . . . . . . . . . . . . . . . . . . . . . . . . . . . . . . . . . 83 50 20 20 14 3March 15, 2019 . . . . . . . . . . . . . . . . . . . . . . . . . . . . . . . . . . . . . . . . . . 80 44 20 20 8 1March 15, 2020 . . . . . . . . . . . . . . . . . . . . . . . . . . . . . . . . . . . . . . . . . . 77 38 20 18 5 1March 15, 2021 . . . . . . . . . . . . . . . . . . . . . . . . . . . . . . . . . . . . . . . . . . 73 32 20 15 3 0March 15, 2022 . . . . . . . . . . . . . . . . . . . . . . . . . . . . . . . . . . . . . . . . . . 70 27 20 11 2 0March 15, 2023 . . . . . . . . . . . . . . . . . . . . . . . . . . . . . . . . . . . . . . . . . . 66 22 20 8 1 0March 15, 2024 . . . . . . . . . . . . . . . . . . . . . . . . . . . . . . . . . . . . . . . . . . 62 20 20 6 1 0March 15, 2025 . . . . . . . . . . . . . . . . . . . . . . . . . . . . . . . . . . . . . . . . . . 57 19 18 4 0 0March 15, 2026 . . . . . . . . . . . . . . . . . . . . . . . . . . . . . . . . . . . . . . . . . . 53 18 17 3 0 0March 15, 2027 . . . . . . . . . . . . . . . . . . . . . . . . . . . . . . . . . . . . . . . . . . 48 17 14 2 0 0March 15, 2028 . . . . . . . . . . . . . . . . . . . . . . . . . . . . . . . . . . . . . . . . . . 43 15 12 1 0 0March 15, 2029 . . . . . . . . . . . . . . . . . . . . . . . . . . . . . . . . . . . . . . . . . . 38 12 9 1 0 0March 15, 2030 . . . . . . . . . . . . . . . . . . . . . . . . . . . . . . . . . . . . . . . . . . 33 10 7 1 0 0March 15, 2031 . . . . . . . . . . . . . . . . . . . . . . . . . . . . . . . . . . . . . . . . . . 27 8 6 0 0 0March 15, 2032 . . . . . . . . . . . . . . . . . . . . . . . . . . . . . . . . . . . . . . . . . . 21 6 4 0 0 0March 15, 2033 . . . . . . . . . . . . . . . . . . . . . . . . . . . . . . . . . . . . . . . . . . 20 4 3 0 0 0March 15, 2034 . . . . . . . . . . . . . . . . . . . . . . . . . . . . . . . . . . . . . . . . . . 18 3 2 0 0 0March 15, 2035 . . . . . . . . . . . . . . . . . . . . . . . . . . . . . . . . . . . . . . . . . . 15 2 2 0 0 0March 15, 2036 . . . . . . . . . . . . . . . . . . . . . . . . . . . . . . . . . . . . . . . . . . 12 1 1 0 0 0March 15, 2037 . . . . . . . . . . . . . . . . . . . . . . . . . . . . . . . . . . . . . . . . . . 4 1 1 0 0 0March 15, 2038 . . . . . . . . . . . . . . . . . . . . . . . . . . . . . . . . . . . . . . . . . . 1 1 0 0 0 0March 15, 2039 . . . . . . . . . . . . . . . . . . . . . . . . . . . . . . . . . . . . . . . . . . 0 0 0 0 0 0March 15, 2040 . . . . . . . . . . . . . . . . . . . . . . . . . . . . . . . . . . . . . . . . . . 0 0 0 0 0 0March 15, 2041 . . . . . . . . . . . . . . . . . . . . . . . . . . . . . . . . . . . . . . . . . . 0 0 0 0 0 0March 15, 2042 . . . . . . . . . . . . . . . . . . . . . . . . . . . . . . . . . . . . . . . . . . 0 0 0 0 0 0
Weighted AverageLife (Years) . . . . . . . . . . . . . . . . . . . . . . . . . . . . . . . . . . . . . . . . . . . 14.1 7.6 5.3 3.3 2.1 1.4
(1) Rounded to nearest whole percentage.
S-30
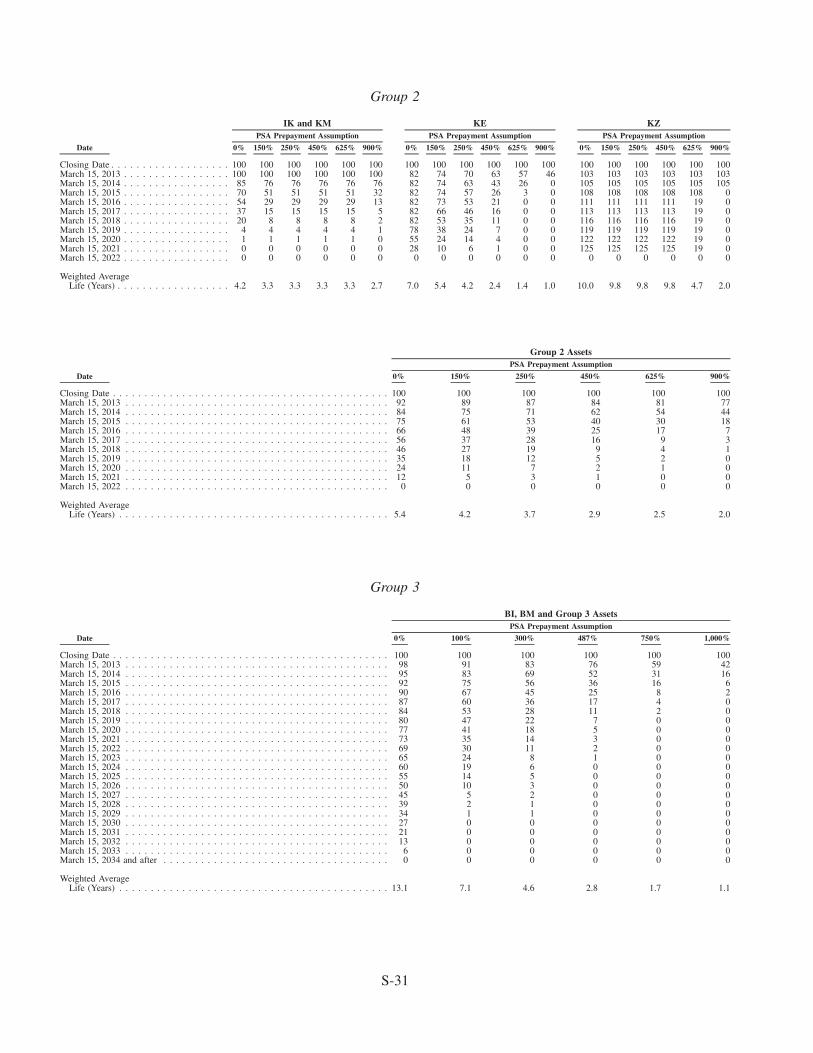
Group 2
Date 0% 150% 250% 450% 625% 900% 0% 150% 250% 450% 625% 900% 0% 150% 250% 450% 625% 900%
PSA Prepayment AssumptionPSA Prepayment AssumptionPSA Prepayment Assumption
KZKEIK and KM
Closing Date . . . . . . . . . . . . . . . . . . . 100 100 100 100 100 100 100 100 100 100 100 100 100 100 100 100 100 100March 15, 2013 . . . . . . . . . . . . . . . . . 100 100 100 100 100 100 82 74 70 63 57 46 103 103 103 103 103 103March 15, 2014 . . . . . . . . . . . . . . . . . 85 76 76 76 76 76 82 74 63 43 26 0 105 105 105 105 105 105March 15, 2015 . . . . . . . . . . . . . . . . . 70 51 51 51 51 32 82 74 57 26 3 0 108 108 108 108 108 0March 15, 2016 . . . . . . . . . . . . . . . . . 54 29 29 29 29 13 82 73 53 21 0 0 111 111 111 111 19 0March 15, 2017 . . . . . . . . . . . . . . . . . 37 15 15 15 15 5 82 66 46 16 0 0 113 113 113 113 19 0March 15, 2018 . . . . . . . . . . . . . . . . . 20 8 8 8 8 2 82 53 35 11 0 0 116 116 116 116 19 0March 15, 2019 . . . . . . . . . . . . . . . . . 4 4 4 4 4 1 78 38 24 7 0 0 119 119 119 119 19 0March 15, 2020 . . . . . . . . . . . . . . . . . 1 1 1 1 1 0 55 24 14 4 0 0 122 122 122 122 19 0March 15, 2021 . . . . . . . . . . . . . . . . . 0 0 0 0 0 0 28 10 6 1 0 0 125 125 125 125 19 0March 15, 2022 . . . . . . . . . . . . . . . . . 0 0 0 0 0 0 0 0 0 0 0 0 0 0 0 0 0 0
Weighted AverageLife (Years) . . . . . . . . . . . . . . . . . . 4.2 3.3 3.3 3.3 3.3 2.7 7.0 5.4 4.2 2.4 1.4 1.0 10.0 9.8 9.8 9.8 4.7 2.0
Date 0% 150% 250% 450% 625% 900%
PSA Prepayment Assumption
Group 2 Assets
Closing Date . . . . . . . . . . . . . . . . . . . . . . . . . . . . . . . . . . . . . . . . . . . . 100 100 100 100 100 100March 15, 2013 . . . . . . . . . . . . . . . . . . . . . . . . . . . . . . . . . . . . . . . . . . 92 89 87 84 81 77March 15, 2014 . . . . . . . . . . . . . . . . . . . . . . . . . . . . . . . . . . . . . . . . . . 84 75 71 62 54 44March 15, 2015 . . . . . . . . . . . . . . . . . . . . . . . . . . . . . . . . . . . . . . . . . . 75 61 53 40 30 18March 15, 2016 . . . . . . . . . . . . . . . . . . . . . . . . . . . . . . . . . . . . . . . . . . 66 48 39 25 17 7March 15, 2017 . . . . . . . . . . . . . . . . . . . . . . . . . . . . . . . . . . . . . . . . . . 56 37 28 16 9 3March 15, 2018 . . . . . . . . . . . . . . . . . . . . . . . . . . . . . . . . . . . . . . . . . . 46 27 19 9 4 1March 15, 2019 . . . . . . . . . . . . . . . . . . . . . . . . . . . . . . . . . . . . . . . . . . 35 18 12 5 2 0March 15, 2020 . . . . . . . . . . . . . . . . . . . . . . . . . . . . . . . . . . . . . . . . . . 24 11 7 2 1 0March 15, 2021 . . . . . . . . . . . . . . . . . . . . . . . . . . . . . . . . . . . . . . . . . . 12 5 3 1 0 0March 15, 2022 . . . . . . . . . . . . . . . . . . . . . . . . . . . . . . . . . . . . . . . . . . 0 0 0 0 0 0
Weighted AverageLife (Years) . . . . . . . . . . . . . . . . . . . . . . . . . . . . . . . . . . . . . . . . . . . 5.4 4.2 3.7 2.9 2.5 2.0
Group 3
Date 0% 100% 300% 487% 750% 1,000%
PSA Prepayment Assumption
BI, BM and Group 3 Assets
Closing Date . . . . . . . . . . . . . . . . . . . . . . . . . . . . . . . . . . . . . . . . . . . . 100 100 100 100 100 100March 15, 2013 . . . . . . . . . . . . . . . . . . . . . . . . . . . . . . . . . . . . . . . . . . 98 91 83 76 59 42March 15, 2014 . . . . . . . . . . . . . . . . . . . . . . . . . . . . . . . . . . . . . . . . . . 95 83 69 52 31 16March 15, 2015 . . . . . . . . . . . . . . . . . . . . . . . . . . . . . . . . . . . . . . . . . . 92 75 56 36 16 6March 15, 2016 . . . . . . . . . . . . . . . . . . . . . . . . . . . . . . . . . . . . . . . . . . 90 67 45 25 8 2March 15, 2017 . . . . . . . . . . . . . . . . . . . . . . . . . . . . . . . . . . . . . . . . . . 87 60 36 17 4 0March 15, 2018 . . . . . . . . . . . . . . . . . . . . . . . . . . . . . . . . . . . . . . . . . . 84 53 28 11 2 0March 15, 2019 . . . . . . . . . . . . . . . . . . . . . . . . . . . . . . . . . . . . . . . . . . 80 47 22 7 0 0March 15, 2020 . . . . . . . . . . . . . . . . . . . . . . . . . . . . . . . . . . . . . . . . . . 77 41 18 5 0 0March 15, 2021 . . . . . . . . . . . . . . . . . . . . . . . . . . . . . . . . . . . . . . . . . . 73 35 14 3 0 0March 15, 2022 . . . . . . . . . . . . . . . . . . . . . . . . . . . . . . . . . . . . . . . . . . 69 30 11 2 0 0March 15, 2023 . . . . . . . . . . . . . . . . . . . . . . . . . . . . . . . . . . . . . . . . . . 65 24 8 1 0 0March 15, 2024 . . . . . . . . . . . . . . . . . . . . . . . . . . . . . . . . . . . . . . . . . . 60 19 6 0 0 0March 15, 2025 . . . . . . . . . . . . . . . . . . . . . . . . . . . . . . . . . . . . . . . . . . 55 14 5 0 0 0March 15, 2026 . . . . . . . . . . . . . . . . . . . . . . . . . . . . . . . . . . . . . . . . . . 50 10 3 0 0 0March 15, 2027 . . . . . . . . . . . . . . . . . . . . . . . . . . . . . . . . . . . . . . . . . . 45 5 2 0 0 0March 15, 2028 . . . . . . . . . . . . . . . . . . . . . . . . . . . . . . . . . . . . . . . . . . 39 2 1 0 0 0March 15, 2029 . . . . . . . . . . . . . . . . . . . . . . . . . . . . . . . . . . . . . . . . . . 34 1 1 0 0 0March 15, 2030 . . . . . . . . . . . . . . . . . . . . . . . . . . . . . . . . . . . . . . . . . . 27 0 0 0 0 0March 15, 2031 . . . . . . . . . . . . . . . . . . . . . . . . . . . . . . . . . . . . . . . . . . 21 0 0 0 0 0March 15, 2032 . . . . . . . . . . . . . . . . . . . . . . . . . . . . . . . . . . . . . . . . . . 13 0 0 0 0 0March 15, 2033 . . . . . . . . . . . . . . . . . . . . . . . . . . . . . . . . . . . . . . . . . . 6 0 0 0 0 0March 15, 2034 and after . . . . . . . . . . . . . . . . . . . . . . . . . . . . . . . . . . . . 0 0 0 0 0 0
Weighted AverageLife (Years) . . . . . . . . . . . . . . . . . . . . . . . . . . . . . . . . . . . . . . . . . . . 13.1 7.1 4.6 2.8 1.7 1.1
S-31
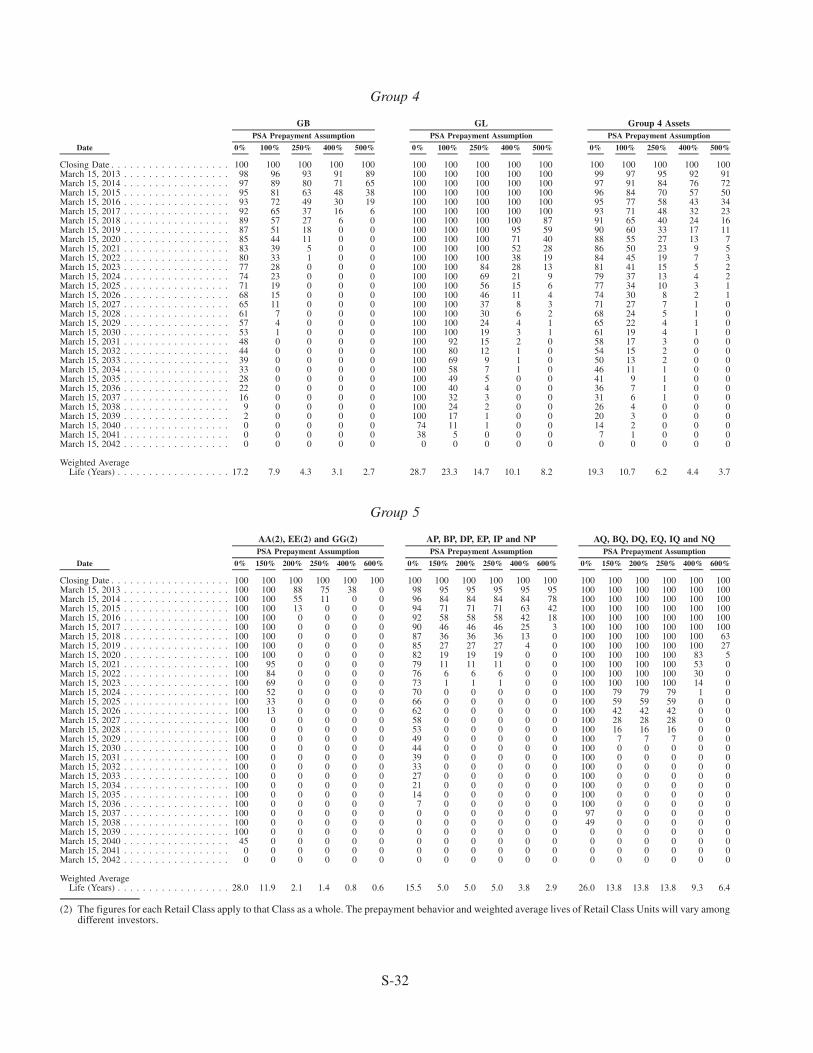
Group 4
Date 0% 100% 250% 400% 500% 0% 100% 250% 400% 500% 0% 100% 250% 400% 500%
PSA Prepayment AssumptionPSA Prepayment AssumptionPSA Prepayment Assumption
Group 4 AssetsGLGB
Closing Date . . . . . . . . . . . . . . . . . . . 100 100 100 100 100 100 100 100 100 100 100 100 100 100 100March 15, 2013 . . . . . . . . . . . . . . . . . 98 96 93 91 89 100 100 100 100 100 99 97 95 92 91March 15, 2014 . . . . . . . . . . . . . . . . . 97 89 80 71 65 100 100 100 100 100 97 91 84 76 72March 15, 2015 . . . . . . . . . . . . . . . . . 95 81 63 48 38 100 100 100 100 100 96 84 70 57 50March 15, 2016 . . . . . . . . . . . . . . . . . 93 72 49 30 19 100 100 100 100 100 95 77 58 43 34March 15, 2017 . . . . . . . . . . . . . . . . . 92 65 37 16 6 100 100 100 100 100 93 71 48 32 23March 15, 2018 . . . . . . . . . . . . . . . . . 89 57 27 6 0 100 100 100 100 87 91 65 40 24 16March 15, 2019 . . . . . . . . . . . . . . . . . 87 51 18 0 0 100 100 100 95 59 90 60 33 17 11March 15, 2020 . . . . . . . . . . . . . . . . . 85 44 11 0 0 100 100 100 71 40 88 55 27 13 7March 15, 2021 . . . . . . . . . . . . . . . . . 83 39 5 0 0 100 100 100 52 28 86 50 23 9 5March 15, 2022 . . . . . . . . . . . . . . . . . 80 33 1 0 0 100 100 100 38 19 84 45 19 7 3March 15, 2023 . . . . . . . . . . . . . . . . . 77 28 0 0 0 100 100 84 28 13 81 41 15 5 2March 15, 2024 . . . . . . . . . . . . . . . . . 74 23 0 0 0 100 100 69 21 9 79 37 13 4 2March 15, 2025 . . . . . . . . . . . . . . . . . 71 19 0 0 0 100 100 56 15 6 77 34 10 3 1March 15, 2026 . . . . . . . . . . . . . . . . . 68 15 0 0 0 100 100 46 11 4 74 30 8 2 1March 15, 2027 . . . . . . . . . . . . . . . . . 65 11 0 0 0 100 100 37 8 3 71 27 7 1 0March 15, 2028 . . . . . . . . . . . . . . . . . 61 7 0 0 0 100 100 30 6 2 68 24 5 1 0March 15, 2029 . . . . . . . . . . . . . . . . . 57 4 0 0 0 100 100 24 4 1 65 22 4 1 0March 15, 2030 . . . . . . . . . . . . . . . . . 53 1 0 0 0 100 100 19 3 1 61 19 4 1 0March 15, 2031 . . . . . . . . . . . . . . . . . 48 0 0 0 0 100 92 15 2 0 58 17 3 0 0March 15, 2032 . . . . . . . . . . . . . . . . . 44 0 0 0 0 100 80 12 1 0 54 15 2 0 0March 15, 2033 . . . . . . . . . . . . . . . . . 39 0 0 0 0 100 69 9 1 0 50 13 2 0 0March 15, 2034 . . . . . . . . . . . . . . . . . 33 0 0 0 0 100 58 7 1 0 46 11 1 0 0March 15, 2035 . . . . . . . . . . . . . . . . . 28 0 0 0 0 100 49 5 0 0 41 9 1 0 0March 15, 2036 . . . . . . . . . . . . . . . . . 22 0 0 0 0 100 40 4 0 0 36 7 1 0 0March 15, 2037 . . . . . . . . . . . . . . . . . 16 0 0 0 0 100 32 3 0 0 31 6 1 0 0March 15, 2038 . . . . . . . . . . . . . . . . . 9 0 0 0 0 100 24 2 0 0 26 4 0 0 0March 15, 2039 . . . . . . . . . . . . . . . . . 2 0 0 0 0 100 17 1 0 0 20 3 0 0 0March 15, 2040 . . . . . . . . . . . . . . . . . 0 0 0 0 0 74 11 1 0 0 14 2 0 0 0March 15, 2041 . . . . . . . . . . . . . . . . . 0 0 0 0 0 38 5 0 0 0 7 1 0 0 0March 15, 2042 . . . . . . . . . . . . . . . . . 0 0 0 0 0 0 0 0 0 0 0 0 0 0 0
Weighted AverageLife (Years) . . . . . . . . . . . . . . . . . . 17.2 7.9 4.3 3.1 2.7 28.7 23.3 14.7 10.1 8.2 19.3 10.7 6.2 4.4 3.7
Group 5
Date 0% 150% 200% 250% 400% 600% 0% 150% 200% 250% 400% 600% 0% 150% 200% 250% 400% 600%
PSA Prepayment AssumptionPSA Prepayment AssumptionPSA Prepayment Assumption
AQ, BQ, DQ, EQ, IQ and NQAP, BP, DP, EP, IP and NPAA(2), EE(2) and GG(2)
Closing Date . . . . . . . . . . . . . . . . . . . 100 100 100 100 100 100 100 100 100 100 100 100 100 100 100 100 100 100March 15, 2013 . . . . . . . . . . . . . . . . . 100 100 88 75 38 0 98 95 95 95 95 95 100 100 100 100 100 100March 15, 2014 . . . . . . . . . . . . . . . . . 100 100 55 11 0 0 96 84 84 84 84 78 100 100 100 100 100 100March 15, 2015 . . . . . . . . . . . . . . . . . 100 100 13 0 0 0 94 71 71 71 63 42 100 100 100 100 100 100March 15, 2016 . . . . . . . . . . . . . . . . . 100 100 0 0 0 0 92 58 58 58 42 18 100 100 100 100 100 100March 15, 2017 . . . . . . . . . . . . . . . . . 100 100 0 0 0 0 90 46 46 46 25 3 100 100 100 100 100 100March 15, 2018 . . . . . . . . . . . . . . . . . 100 100 0 0 0 0 87 36 36 36 13 0 100 100 100 100 100 63March 15, 2019 . . . . . . . . . . . . . . . . . 100 100 0 0 0 0 85 27 27 27 4 0 100 100 100 100 100 27March 15, 2020 . . . . . . . . . . . . . . . . . 100 100 0 0 0 0 82 19 19 19 0 0 100 100 100 100 83 5March 15, 2021 . . . . . . . . . . . . . . . . . 100 95 0 0 0 0 79 11 11 11 0 0 100 100 100 100 53 0March 15, 2022 . . . . . . . . . . . . . . . . . 100 84 0 0 0 0 76 6 6 6 0 0 100 100 100 100 30 0March 15, 2023 . . . . . . . . . . . . . . . . . 100 69 0 0 0 0 73 1 1 1 0 0 100 100 100 100 14 0March 15, 2024 . . . . . . . . . . . . . . . . . 100 52 0 0 0 0 70 0 0 0 0 0 100 79 79 79 1 0March 15, 2025 . . . . . . . . . . . . . . . . . 100 33 0 0 0 0 66 0 0 0 0 0 100 59 59 59 0 0March 15, 2026 . . . . . . . . . . . . . . . . . 100 13 0 0 0 0 62 0 0 0 0 0 100 42 42 42 0 0March 15, 2027 . . . . . . . . . . . . . . . . . 100 0 0 0 0 0 58 0 0 0 0 0 100 28 28 28 0 0March 15, 2028 . . . . . . . . . . . . . . . . . 100 0 0 0 0 0 53 0 0 0 0 0 100 16 16 16 0 0March 15, 2029 . . . . . . . . . . . . . . . . . 100 0 0 0 0 0 49 0 0 0 0 0 100 7 7 7 0 0March 15, 2030 . . . . . . . . . . . . . . . . . 100 0 0 0 0 0 44 0 0 0 0 0 100 0 0 0 0 0March 15, 2031 . . . . . . . . . . . . . . . . . 100 0 0 0 0 0 39 0 0 0 0 0 100 0 0 0 0 0March 15, 2032 . . . . . . . . . . . . . . . . . 100 0 0 0 0 0 33 0 0 0 0 0 100 0 0 0 0 0March 15, 2033 . . . . . . . . . . . . . . . . . 100 0 0 0 0 0 27 0 0 0 0 0 100 0 0 0 0 0March 15, 2034 . . . . . . . . . . . . . . . . . 100 0 0 0 0 0 21 0 0 0 0 0 100 0 0 0 0 0March 15, 2035 . . . . . . . . . . . . . . . . . 100 0 0 0 0 0 14 0 0 0 0 0 100 0 0 0 0 0March 15, 2036 . . . . . . . . . . . . . . . . . 100 0 0 0 0 0 7 0 0 0 0 0 100 0 0 0 0 0March 15, 2037 . . . . . . . . . . . . . . . . . 100 0 0 0 0 0 0 0 0 0 0 0 97 0 0 0 0 0March 15, 2038 . . . . . . . . . . . . . . . . . 100 0 0 0 0 0 0 0 0 0 0 0 49 0 0 0 0 0March 15, 2039 . . . . . . . . . . . . . . . . . 100 0 0 0 0 0 0 0 0 0 0 0 0 0 0 0 0 0March 15, 2040 . . . . . . . . . . . . . . . . . 45 0 0 0 0 0 0 0 0 0 0 0 0 0 0 0 0 0March 15, 2041 . . . . . . . . . . . . . . . . . 0 0 0 0 0 0 0 0 0 0 0 0 0 0 0 0 0 0March 15, 2042 . . . . . . . . . . . . . . . . . 0 0 0 0 0 0 0 0 0 0 0 0 0 0 0 0 0 0
Weighted AverageLife (Years) . . . . . . . . . . . . . . . . . . 28.0 11.9 2.1 1.4 0.8 0.6 15.5 5.0 5.0 5.0 3.8 2.9 26.0 13.8 13.8 13.8 9.3 6.4
(2) The figures for each Retail Class apply to that Class as a whole. The prepayment behavior and weighted average lives of Retail Class Units will vary amongdifferent investors.
S-32
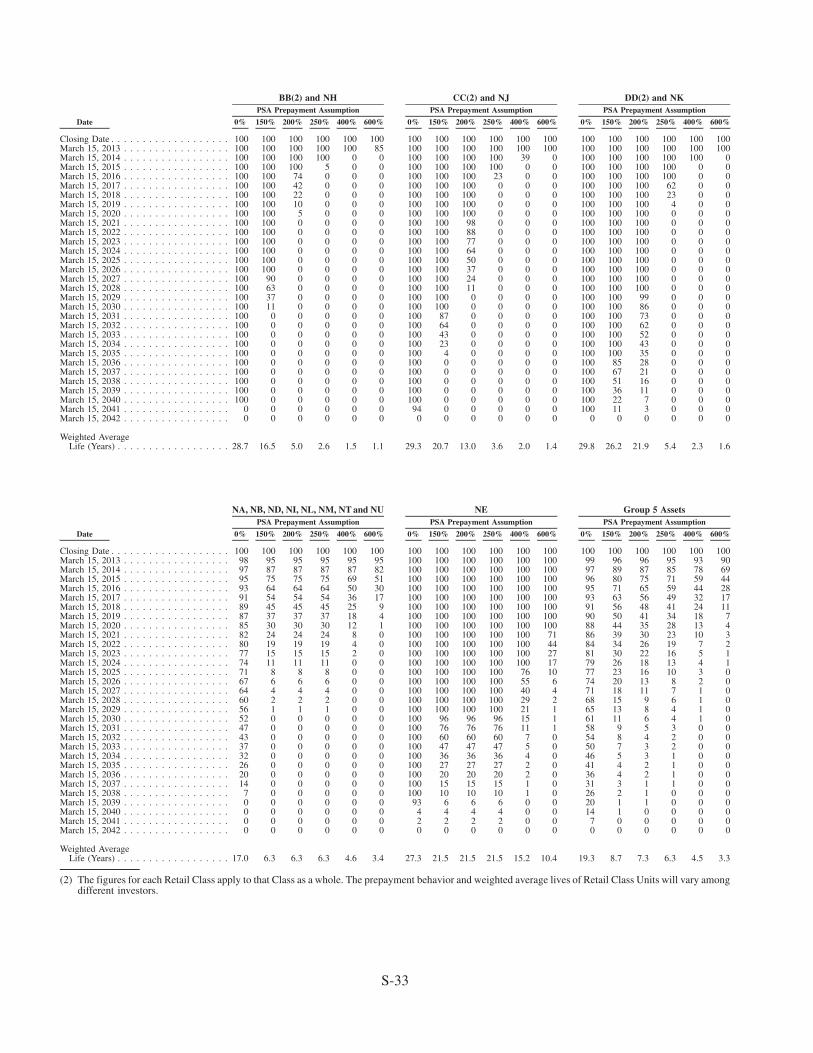
Date 0% 150% 200% 250% 400% 600% 0% 150% 200% 250% 400% 600% 0% 150% 200% 250% 400% 600%
PSA Prepayment AssumptionPSA Prepayment AssumptionPSA Prepayment Assumption
DD(2) and NKCC(2) and NJBB(2) and NH
Closing Date . . . . . . . . . . . . . . . . . . . 100 100 100 100 100 100 100 100 100 100 100 100 100 100 100 100 100 100March 15, 2013 . . . . . . . . . . . . . . . . . 100 100 100 100 100 85 100 100 100 100 100 100 100 100 100 100 100 100March 15, 2014 . . . . . . . . . . . . . . . . . 100 100 100 100 0 0 100 100 100 100 39 0 100 100 100 100 100 0March 15, 2015 . . . . . . . . . . . . . . . . . 100 100 100 5 0 0 100 100 100 100 0 0 100 100 100 100 0 0March 15, 2016 . . . . . . . . . . . . . . . . . 100 100 74 0 0 0 100 100 100 23 0 0 100 100 100 100 0 0March 15, 2017 . . . . . . . . . . . . . . . . . 100 100 42 0 0 0 100 100 100 0 0 0 100 100 100 62 0 0March 15, 2018 . . . . . . . . . . . . . . . . . 100 100 22 0 0 0 100 100 100 0 0 0 100 100 100 23 0 0March 15, 2019 . . . . . . . . . . . . . . . . . 100 100 10 0 0 0 100 100 100 0 0 0 100 100 100 4 0 0March 15, 2020 . . . . . . . . . . . . . . . . . 100 100 5 0 0 0 100 100 100 0 0 0 100 100 100 0 0 0March 15, 2021 . . . . . . . . . . . . . . . . . 100 100 0 0 0 0 100 100 98 0 0 0 100 100 100 0 0 0March 15, 2022 . . . . . . . . . . . . . . . . . 100 100 0 0 0 0 100 100 88 0 0 0 100 100 100 0 0 0March 15, 2023 . . . . . . . . . . . . . . . . . 100 100 0 0 0 0 100 100 77 0 0 0 100 100 100 0 0 0March 15, 2024 . . . . . . . . . . . . . . . . . 100 100 0 0 0 0 100 100 64 0 0 0 100 100 100 0 0 0March 15, 2025 . . . . . . . . . . . . . . . . . 100 100 0 0 0 0 100 100 50 0 0 0 100 100 100 0 0 0March 15, 2026 . . . . . . . . . . . . . . . . . 100 100 0 0 0 0 100 100 37 0 0 0 100 100 100 0 0 0March 15, 2027 . . . . . . . . . . . . . . . . . 100 90 0 0 0 0 100 100 24 0 0 0 100 100 100 0 0 0March 15, 2028 . . . . . . . . . . . . . . . . . 100 63 0 0 0 0 100 100 11 0 0 0 100 100 100 0 0 0March 15, 2029 . . . . . . . . . . . . . . . . . 100 37 0 0 0 0 100 100 0 0 0 0 100 100 99 0 0 0March 15, 2030 . . . . . . . . . . . . . . . . . 100 11 0 0 0 0 100 100 0 0 0 0 100 100 86 0 0 0March 15, 2031 . . . . . . . . . . . . . . . . . 100 0 0 0 0 0 100 87 0 0 0 0 100 100 73 0 0 0March 15, 2032 . . . . . . . . . . . . . . . . . 100 0 0 0 0 0 100 64 0 0 0 0 100 100 62 0 0 0March 15, 2033 . . . . . . . . . . . . . . . . . 100 0 0 0 0 0 100 43 0 0 0 0 100 100 52 0 0 0March 15, 2034 . . . . . . . . . . . . . . . . . 100 0 0 0 0 0 100 23 0 0 0 0 100 100 43 0 0 0March 15, 2035 . . . . . . . . . . . . . . . . . 100 0 0 0 0 0 100 4 0 0 0 0 100 100 35 0 0 0March 15, 2036 . . . . . . . . . . . . . . . . . 100 0 0 0 0 0 100 0 0 0 0 0 100 85 28 0 0 0March 15, 2037 . . . . . . . . . . . . . . . . . 100 0 0 0 0 0 100 0 0 0 0 0 100 67 21 0 0 0March 15, 2038 . . . . . . . . . . . . . . . . . 100 0 0 0 0 0 100 0 0 0 0 0 100 51 16 0 0 0March 15, 2039 . . . . . . . . . . . . . . . . . 100 0 0 0 0 0 100 0 0 0 0 0 100 36 11 0 0 0March 15, 2040 . . . . . . . . . . . . . . . . . 100 0 0 0 0 0 100 0 0 0 0 0 100 22 7 0 0 0March 15, 2041 . . . . . . . . . . . . . . . . . 0 0 0 0 0 0 94 0 0 0 0 0 100 11 3 0 0 0March 15, 2042 . . . . . . . . . . . . . . . . . 0 0 0 0 0 0 0 0 0 0 0 0 0 0 0 0 0 0
Weighted AverageLife (Years) . . . . . . . . . . . . . . . . . . 28.7 16.5 5.0 2.6 1.5 1.1 29.3 20.7 13.0 3.6 2.0 1.4 29.8 26.2 21.9 5.4 2.3 1.6
Date 0% 150% 200% 250% 400% 600% 0% 150% 200% 250% 400% 600% 0% 150% 200% 250% 400% 600%
PSA Prepayment AssumptionPSA Prepayment AssumptionPSA Prepayment Assumption
Group 5 AssetsNENA, NB, ND, NI, NL, NM, NT and NU
Closing Date . . . . . . . . . . . . . . . . . . . 100 100 100 100 100 100 100 100 100 100 100 100 100 100 100 100 100 100March 15, 2013 . . . . . . . . . . . . . . . . . 98 95 95 95 95 95 100 100 100 100 100 100 99 96 96 95 93 90March 15, 2014 . . . . . . . . . . . . . . . . . 97 87 87 87 87 82 100 100 100 100 100 100 97 89 87 85 78 69March 15, 2015 . . . . . . . . . . . . . . . . . 95 75 75 75 69 51 100 100 100 100 100 100 96 80 75 71 59 44March 15, 2016 . . . . . . . . . . . . . . . . . 93 64 64 64 50 30 100 100 100 100 100 100 95 71 65 59 44 28March 15, 2017 . . . . . . . . . . . . . . . . . 91 54 54 54 36 17 100 100 100 100 100 100 93 63 56 49 32 17March 15, 2018 . . . . . . . . . . . . . . . . . 89 45 45 45 25 9 100 100 100 100 100 100 91 56 48 41 24 11March 15, 2019 . . . . . . . . . . . . . . . . . 87 37 37 37 18 4 100 100 100 100 100 100 90 50 41 34 18 7March 15, 2020 . . . . . . . . . . . . . . . . . 85 30 30 30 12 1 100 100 100 100 100 100 88 44 35 28 13 4March 15, 2021 . . . . . . . . . . . . . . . . . 82 24 24 24 8 0 100 100 100 100 100 71 86 39 30 23 10 3March 15, 2022 . . . . . . . . . . . . . . . . . 80 19 19 19 4 0 100 100 100 100 100 44 84 34 26 19 7 2March 15, 2023 . . . . . . . . . . . . . . . . . 77 15 15 15 2 0 100 100 100 100 100 27 81 30 22 16 5 1March 15, 2024 . . . . . . . . . . . . . . . . . 74 11 11 11 0 0 100 100 100 100 100 17 79 26 18 13 4 1March 15, 2025 . . . . . . . . . . . . . . . . . 71 8 8 8 0 0 100 100 100 100 76 10 77 23 16 10 3 0March 15, 2026 . . . . . . . . . . . . . . . . . 67 6 6 6 0 0 100 100 100 100 55 6 74 20 13 8 2 0March 15, 2027 . . . . . . . . . . . . . . . . . 64 4 4 4 0 0 100 100 100 100 40 4 71 18 11 7 1 0March 15, 2028 . . . . . . . . . . . . . . . . . 60 2 2 2 0 0 100 100 100 100 29 2 68 15 9 6 1 0March 15, 2029 . . . . . . . . . . . . . . . . . 56 1 1 1 0 0 100 100 100 100 21 1 65 13 8 4 1 0March 15, 2030 . . . . . . . . . . . . . . . . . 52 0 0 0 0 0 100 96 96 96 15 1 61 11 6 4 1 0March 15, 2031 . . . . . . . . . . . . . . . . . 47 0 0 0 0 0 100 76 76 76 11 1 58 9 5 3 0 0March 15, 2032 . . . . . . . . . . . . . . . . . 43 0 0 0 0 0 100 60 60 60 7 0 54 8 4 2 0 0March 15, 2033 . . . . . . . . . . . . . . . . . 37 0 0 0 0 0 100 47 47 47 5 0 50 7 3 2 0 0March 15, 2034 . . . . . . . . . . . . . . . . . 32 0 0 0 0 0 100 36 36 36 4 0 46 5 3 1 0 0March 15, 2035 . . . . . . . . . . . . . . . . . 26 0 0 0 0 0 100 27 27 27 2 0 41 4 2 1 0 0March 15, 2036 . . . . . . . . . . . . . . . . . 20 0 0 0 0 0 100 20 20 20 2 0 36 4 2 1 0 0March 15, 2037 . . . . . . . . . . . . . . . . . 14 0 0 0 0 0 100 15 15 15 1 0 31 3 1 1 0 0March 15, 2038 . . . . . . . . . . . . . . . . . 7 0 0 0 0 0 100 10 10 10 1 0 26 2 1 0 0 0March 15, 2039 . . . . . . . . . . . . . . . . . 0 0 0 0 0 0 93 6 6 6 0 0 20 1 1 0 0 0March 15, 2040 . . . . . . . . . . . . . . . . . 0 0 0 0 0 0 4 4 4 4 0 0 14 1 0 0 0 0March 15, 2041 . . . . . . . . . . . . . . . . . 0 0 0 0 0 0 2 2 2 2 0 0 7 0 0 0 0 0March 15, 2042 . . . . . . . . . . . . . . . . . 0 0 0 0 0 0 0 0 0 0 0 0 0 0 0 0 0 0
Weighted AverageLife (Years) . . . . . . . . . . . . . . . . . . 17.0 6.3 6.3 6.3 4.6 3.4 27.3 21.5 21.5 21.5 15.2 10.4 19.3 8.7 7.3 6.3 4.5 3.3
(2) The figures for each Retail Class apply to that Class as a whole. The prepayment behavior and weighted average lives of Retail Class Units will vary amongdifferent investors.
S-33
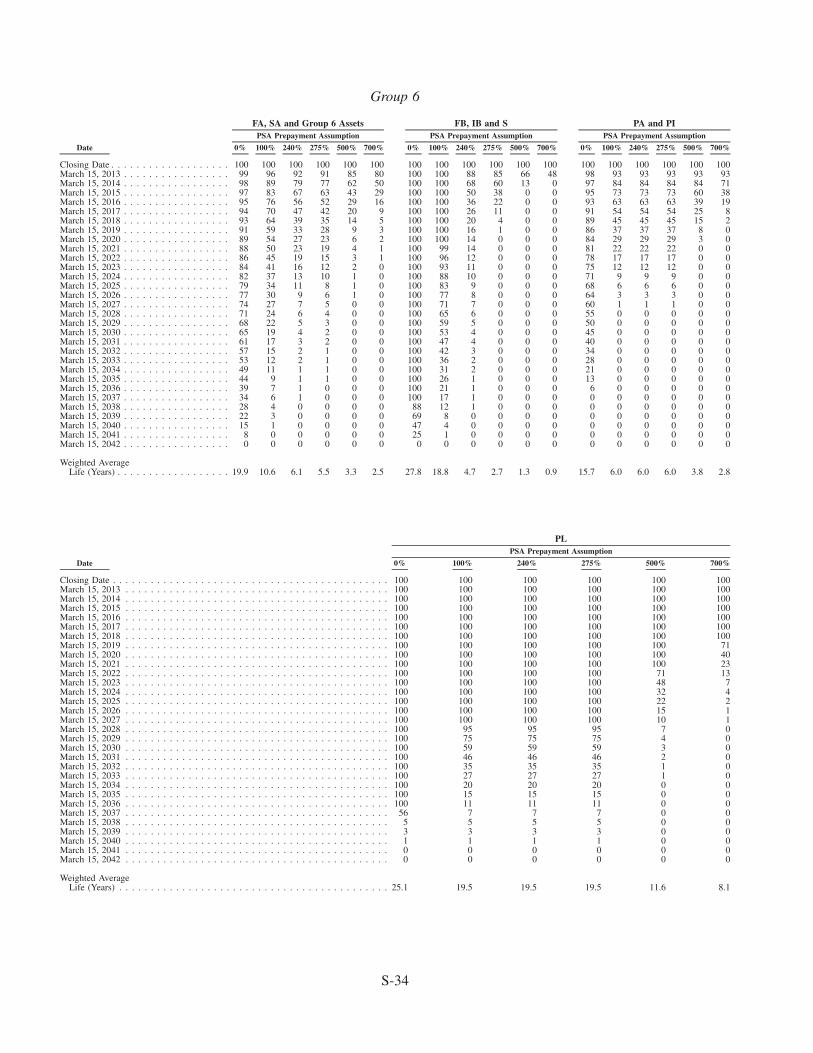
Group 6
Date 0% 100% 240% 275% 500% 700% 0% 100% 240% 275% 500% 700% 0% 100% 240% 275% 500% 700%
PSA Prepayment AssumptionPSA Prepayment AssumptionPSA Prepayment Assumption
PA and PIFB, IB and SFA, SA and Group 6 Assets
Closing Date . . . . . . . . . . . . . . . . . . . 100 100 100 100 100 100 100 100 100 100 100 100 100 100 100 100 100 100March 15, 2013 . . . . . . . . . . . . . . . . . 99 96 92 91 85 80 100 100 88 85 66 48 98 93 93 93 93 93March 15, 2014 . . . . . . . . . . . . . . . . . 98 89 79 77 62 50 100 100 68 60 13 0 97 84 84 84 84 71March 15, 2015 . . . . . . . . . . . . . . . . . 97 83 67 63 43 29 100 100 50 38 0 0 95 73 73 73 60 38March 15, 2016 . . . . . . . . . . . . . . . . . 95 76 56 52 29 16 100 100 36 22 0 0 93 63 63 63 39 19March 15, 2017 . . . . . . . . . . . . . . . . . 94 70 47 42 20 9 100 100 26 11 0 0 91 54 54 54 25 8March 15, 2018 . . . . . . . . . . . . . . . . . 93 64 39 35 14 5 100 100 20 4 0 0 89 45 45 45 15 2March 15, 2019 . . . . . . . . . . . . . . . . . 91 59 33 28 9 3 100 100 16 1 0 0 86 37 37 37 8 0March 15, 2020 . . . . . . . . . . . . . . . . . 89 54 27 23 6 2 100 100 14 0 0 0 84 29 29 29 3 0March 15, 2021 . . . . . . . . . . . . . . . . . 88 50 23 19 4 1 100 99 14 0 0 0 81 22 22 22 0 0March 15, 2022 . . . . . . . . . . . . . . . . . 86 45 19 15 3 1 100 96 12 0 0 0 78 17 17 17 0 0March 15, 2023 . . . . . . . . . . . . . . . . . 84 41 16 12 2 0 100 93 11 0 0 0 75 12 12 12 0 0March 15, 2024 . . . . . . . . . . . . . . . . . 82 37 13 10 1 0 100 88 10 0 0 0 71 9 9 9 0 0March 15, 2025 . . . . . . . . . . . . . . . . . 79 34 11 8 1 0 100 83 9 0 0 0 68 6 6 6 0 0March 15, 2026 . . . . . . . . . . . . . . . . . 77 30 9 6 1 0 100 77 8 0 0 0 64 3 3 3 0 0March 15, 2027 . . . . . . . . . . . . . . . . . 74 27 7 5 0 0 100 71 7 0 0 0 60 1 1 1 0 0March 15, 2028 . . . . . . . . . . . . . . . . . 71 24 6 4 0 0 100 65 6 0 0 0 55 0 0 0 0 0March 15, 2029 . . . . . . . . . . . . . . . . . 68 22 5 3 0 0 100 59 5 0 0 0 50 0 0 0 0 0March 15, 2030 . . . . . . . . . . . . . . . . . 65 19 4 2 0 0 100 53 4 0 0 0 45 0 0 0 0 0March 15, 2031 . . . . . . . . . . . . . . . . . 61 17 3 2 0 0 100 47 4 0 0 0 40 0 0 0 0 0March 15, 2032 . . . . . . . . . . . . . . . . . 57 15 2 1 0 0 100 42 3 0 0 0 34 0 0 0 0 0March 15, 2033 . . . . . . . . . . . . . . . . . 53 12 2 1 0 0 100 36 2 0 0 0 28 0 0 0 0 0March 15, 2034 . . . . . . . . . . . . . . . . . 49 11 1 1 0 0 100 31 2 0 0 0 21 0 0 0 0 0March 15, 2035 . . . . . . . . . . . . . . . . . 44 9 1 1 0 0 100 26 1 0 0 0 13 0 0 0 0 0March 15, 2036 . . . . . . . . . . . . . . . . . 39 7 1 0 0 0 100 21 1 0 0 0 6 0 0 0 0 0March 15, 2037 . . . . . . . . . . . . . . . . . 34 6 1 0 0 0 100 17 1 0 0 0 0 0 0 0 0 0March 15, 2038 . . . . . . . . . . . . . . . . . 28 4 0 0 0 0 88 12 1 0 0 0 0 0 0 0 0 0March 15, 2039 . . . . . . . . . . . . . . . . . 22 3 0 0 0 0 69 8 0 0 0 0 0 0 0 0 0 0March 15, 2040 . . . . . . . . . . . . . . . . . 15 1 0 0 0 0 47 4 0 0 0 0 0 0 0 0 0 0March 15, 2041 . . . . . . . . . . . . . . . . . 8 0 0 0 0 0 25 1 0 0 0 0 0 0 0 0 0 0March 15, 2042 . . . . . . . . . . . . . . . . . 0 0 0 0 0 0 0 0 0 0 0 0 0 0 0 0 0 0
Weighted AverageLife (Years) . . . . . . . . . . . . . . . . . . 19.9 10.6 6.1 5.5 3.3 2.5 27.8 18.8 4.7 2.7 1.3 0.9 15.7 6.0 6.0 6.0 3.8 2.8
Date 0% 100% 240% 275% 500% 700%
PSA Prepayment Assumption
PL
Closing Date . . . . . . . . . . . . . . . . . . . . . . . . . . . . . . . . . . . . . . . . . . . . 100 100 100 100 100 100March 15, 2013 . . . . . . . . . . . . . . . . . . . . . . . . . . . . . . . . . . . . . . . . . . 100 100 100 100 100 100March 15, 2014 . . . . . . . . . . . . . . . . . . . . . . . . . . . . . . . . . . . . . . . . . . 100 100 100 100 100 100March 15, 2015 . . . . . . . . . . . . . . . . . . . . . . . . . . . . . . . . . . . . . . . . . . 100 100 100 100 100 100March 15, 2016 . . . . . . . . . . . . . . . . . . . . . . . . . . . . . . . . . . . . . . . . . . 100 100 100 100 100 100March 15, 2017 . . . . . . . . . . . . . . . . . . . . . . . . . . . . . . . . . . . . . . . . . . 100 100 100 100 100 100March 15, 2018 . . . . . . . . . . . . . . . . . . . . . . . . . . . . . . . . . . . . . . . . . . 100 100 100 100 100 100March 15, 2019 . . . . . . . . . . . . . . . . . . . . . . . . . . . . . . . . . . . . . . . . . . 100 100 100 100 100 71March 15, 2020 . . . . . . . . . . . . . . . . . . . . . . . . . . . . . . . . . . . . . . . . . . 100 100 100 100 100 40March 15, 2021 . . . . . . . . . . . . . . . . . . . . . . . . . . . . . . . . . . . . . . . . . . 100 100 100 100 100 23March 15, 2022 . . . . . . . . . . . . . . . . . . . . . . . . . . . . . . . . . . . . . . . . . . 100 100 100 100 71 13March 15, 2023 . . . . . . . . . . . . . . . . . . . . . . . . . . . . . . . . . . . . . . . . . . 100 100 100 100 48 7March 15, 2024 . . . . . . . . . . . . . . . . . . . . . . . . . . . . . . . . . . . . . . . . . . 100 100 100 100 32 4March 15, 2025 . . . . . . . . . . . . . . . . . . . . . . . . . . . . . . . . . . . . . . . . . . 100 100 100 100 22 2March 15, 2026 . . . . . . . . . . . . . . . . . . . . . . . . . . . . . . . . . . . . . . . . . . 100 100 100 100 15 1March 15, 2027 . . . . . . . . . . . . . . . . . . . . . . . . . . . . . . . . . . . . . . . . . . 100 100 100 100 10 1March 15, 2028 . . . . . . . . . . . . . . . . . . . . . . . . . . . . . . . . . . . . . . . . . . 100 95 95 95 7 0March 15, 2029 . . . . . . . . . . . . . . . . . . . . . . . . . . . . . . . . . . . . . . . . . . 100 75 75 75 4 0March 15, 2030 . . . . . . . . . . . . . . . . . . . . . . . . . . . . . . . . . . . . . . . . . . 100 59 59 59 3 0March 15, 2031 . . . . . . . . . . . . . . . . . . . . . . . . . . . . . . . . . . . . . . . . . . 100 46 46 46 2 0March 15, 2032 . . . . . . . . . . . . . . . . . . . . . . . . . . . . . . . . . . . . . . . . . . 100 35 35 35 1 0March 15, 2033 . . . . . . . . . . . . . . . . . . . . . . . . . . . . . . . . . . . . . . . . . . 100 27 27 27 1 0March 15, 2034 . . . . . . . . . . . . . . . . . . . . . . . . . . . . . . . . . . . . . . . . . . 100 20 20 20 0 0March 15, 2035 . . . . . . . . . . . . . . . . . . . . . . . . . . . . . . . . . . . . . . . . . . 100 15 15 15 0 0March 15, 2036 . . . . . . . . . . . . . . . . . . . . . . . . . . . . . . . . . . . . . . . . . . 100 11 11 11 0 0March 15, 2037 . . . . . . . . . . . . . . . . . . . . . . . . . . . . . . . . . . . . . . . . . . 56 7 7 7 0 0March 15, 2038 . . . . . . . . . . . . . . . . . . . . . . . . . . . . . . . . . . . . . . . . . . 5 5 5 5 0 0March 15, 2039 . . . . . . . . . . . . . . . . . . . . . . . . . . . . . . . . . . . . . . . . . . 3 3 3 3 0 0March 15, 2040 . . . . . . . . . . . . . . . . . . . . . . . . . . . . . . . . . . . . . . . . . . 1 1 1 1 0 0March 15, 2041 . . . . . . . . . . . . . . . . . . . . . . . . . . . . . . . . . . . . . . . . . . 0 0 0 0 0 0March 15, 2042 . . . . . . . . . . . . . . . . . . . . . . . . . . . . . . . . . . . . . . . . . . 0 0 0 0 0 0
Weighted AverageLife (Years) . . . . . . . . . . . . . . . . . . . . . . . . . . . . . . . . . . . . . . . . . . . 25.1 19.5 19.5 19.5 11.6 8.1
S-34
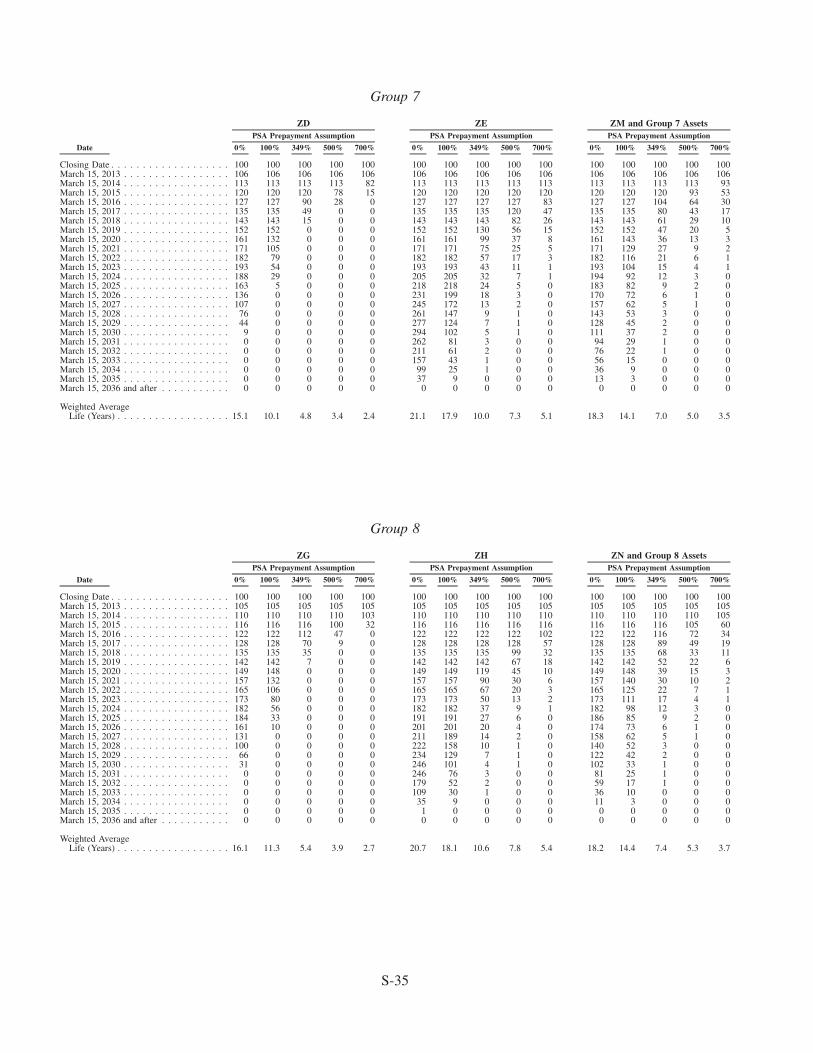
Group 7
Date 0% 100% 349% 500% 700% 0% 100% 349% 500% 700% 0% 100% 349% 500% 700%
PSA Prepayment AssumptionPSA Prepayment AssumptionPSA Prepayment Assumption
ZM and Group 7 AssetsZEZD
Closing Date . . . . . . . . . . . . . . . . . . . 100 100 100 100 100 100 100 100 100 100 100 100 100 100 100March 15, 2013 . . . . . . . . . . . . . . . . . 106 106 106 106 106 106 106 106 106 106 106 106 106 106 106March 15, 2014 . . . . . . . . . . . . . . . . . 113 113 113 113 82 113 113 113 113 113 113 113 113 113 93March 15, 2015 . . . . . . . . . . . . . . . . . 120 120 120 78 15 120 120 120 120 120 120 120 120 93 53March 15, 2016 . . . . . . . . . . . . . . . . . 127 127 90 28 0 127 127 127 127 83 127 127 104 64 30March 15, 2017 . . . . . . . . . . . . . . . . . 135 135 49 0 0 135 135 135 120 47 135 135 80 43 17March 15, 2018 . . . . . . . . . . . . . . . . . 143 143 15 0 0 143 143 143 82 26 143 143 61 29 10March 15, 2019 . . . . . . . . . . . . . . . . . 152 152 0 0 0 152 152 130 56 15 152 152 47 20 5March 15, 2020 . . . . . . . . . . . . . . . . . 161 132 0 0 0 161 161 99 37 8 161 143 36 13 3March 15, 2021 . . . . . . . . . . . . . . . . . 171 105 0 0 0 171 171 75 25 5 171 129 27 9 2March 15, 2022 . . . . . . . . . . . . . . . . . 182 79 0 0 0 182 182 57 17 3 182 116 21 6 1March 15, 2023 . . . . . . . . . . . . . . . . . 193 54 0 0 0 193 193 43 11 1 193 104 15 4 1March 15, 2024 . . . . . . . . . . . . . . . . . 188 29 0 0 0 205 205 32 7 1 194 92 12 3 0March 15, 2025 . . . . . . . . . . . . . . . . . 163 5 0 0 0 218 218 24 5 0 183 82 9 2 0March 15, 2026 . . . . . . . . . . . . . . . . . 136 0 0 0 0 231 199 18 3 0 170 72 6 1 0March 15, 2027 . . . . . . . . . . . . . . . . . 107 0 0 0 0 245 172 13 2 0 157 62 5 1 0March 15, 2028 . . . . . . . . . . . . . . . . . 76 0 0 0 0 261 147 9 1 0 143 53 3 0 0March 15, 2029 . . . . . . . . . . . . . . . . . 44 0 0 0 0 277 124 7 1 0 128 45 2 0 0March 15, 2030 . . . . . . . . . . . . . . . . . 9 0 0 0 0 294 102 5 1 0 111 37 2 0 0March 15, 2031 . . . . . . . . . . . . . . . . . 0 0 0 0 0 262 81 3 0 0 94 29 1 0 0March 15, 2032 . . . . . . . . . . . . . . . . . 0 0 0 0 0 211 61 2 0 0 76 22 1 0 0March 15, 2033 . . . . . . . . . . . . . . . . . 0 0 0 0 0 157 43 1 0 0 56 15 0 0 0March 15, 2034 . . . . . . . . . . . . . . . . . 0 0 0 0 0 99 25 1 0 0 36 9 0 0 0March 15, 2035 . . . . . . . . . . . . . . . . . 0 0 0 0 0 37 9 0 0 0 13 3 0 0 0March 15, 2036 and after . . . . . . . . . . . 0 0 0 0 0 0 0 0 0 0 0 0 0 0 0
Weighted AverageLife (Years) . . . . . . . . . . . . . . . . . . 15.1 10.1 4.8 3.4 2.4 21.1 17.9 10.0 7.3 5.1 18.3 14.1 7.0 5.0 3.5
Group 8
Date 0% 100% 349% 500% 700% 0% 100% 349% 500% 700% 0% 100% 349% 500% 700%
PSA Prepayment AssumptionPSA Prepayment AssumptionPSA Prepayment Assumption
ZN and Group 8 AssetsZHZG
Closing Date . . . . . . . . . . . . . . . . . . . 100 100 100 100 100 100 100 100 100 100 100 100 100 100 100March 15, 2013 . . . . . . . . . . . . . . . . . 105 105 105 105 105 105 105 105 105 105 105 105 105 105 105March 15, 2014 . . . . . . . . . . . . . . . . . 110 110 110 110 103 110 110 110 110 110 110 110 110 110 105March 15, 2015 . . . . . . . . . . . . . . . . . 116 116 116 100 32 116 116 116 116 116 116 116 116 105 60March 15, 2016 . . . . . . . . . . . . . . . . . 122 122 112 47 0 122 122 122 122 102 122 122 116 72 34March 15, 2017 . . . . . . . . . . . . . . . . . 128 128 70 9 0 128 128 128 128 57 128 128 89 49 19March 15, 2018 . . . . . . . . . . . . . . . . . 135 135 35 0 0 135 135 135 99 32 135 135 68 33 11March 15, 2019 . . . . . . . . . . . . . . . . . 142 142 7 0 0 142 142 142 67 18 142 142 52 22 6March 15, 2020 . . . . . . . . . . . . . . . . . 149 148 0 0 0 149 149 119 45 10 149 148 39 15 3March 15, 2021 . . . . . . . . . . . . . . . . . 157 132 0 0 0 157 157 90 30 6 157 140 30 10 2March 15, 2022 . . . . . . . . . . . . . . . . . 165 106 0 0 0 165 165 67 20 3 165 125 22 7 1March 15, 2023 . . . . . . . . . . . . . . . . . 173 80 0 0 0 173 173 50 13 2 173 111 17 4 1March 15, 2024 . . . . . . . . . . . . . . . . . 182 56 0 0 0 182 182 37 9 1 182 98 12 3 0March 15, 2025 . . . . . . . . . . . . . . . . . 184 33 0 0 0 191 191 27 6 0 186 85 9 2 0March 15, 2026 . . . . . . . . . . . . . . . . . 161 10 0 0 0 201 201 20 4 0 174 73 6 1 0March 15, 2027 . . . . . . . . . . . . . . . . . 131 0 0 0 0 211 189 14 2 0 158 62 5 1 0March 15, 2028 . . . . . . . . . . . . . . . . . 100 0 0 0 0 222 158 10 1 0 140 52 3 0 0March 15, 2029 . . . . . . . . . . . . . . . . . 66 0 0 0 0 234 129 7 1 0 122 42 2 0 0March 15, 2030 . . . . . . . . . . . . . . . . . 31 0 0 0 0 246 101 4 1 0 102 33 1 0 0March 15, 2031 . . . . . . . . . . . . . . . . . 0 0 0 0 0 246 76 3 0 0 81 25 1 0 0March 15, 2032 . . . . . . . . . . . . . . . . . 0 0 0 0 0 179 52 2 0 0 59 17 1 0 0March 15, 2033 . . . . . . . . . . . . . . . . . 0 0 0 0 0 109 30 1 0 0 36 10 0 0 0March 15, 2034 . . . . . . . . . . . . . . . . . 0 0 0 0 0 35 9 0 0 0 11 3 0 0 0March 15, 2035 . . . . . . . . . . . . . . . . . 0 0 0 0 0 1 0 0 0 0 0 0 0 0 0March 15, 2036 and after . . . . . . . . . . . 0 0 0 0 0 0 0 0 0 0 0 0 0 0 0
Weighted AverageLife (Years) . . . . . . . . . . . . . . . . . . 16.1 11.3 5.4 3.9 2.7 20.7 18.1 10.6 7.8 5.4 18.2 14.4 7.4 5.3 3.7
S-35
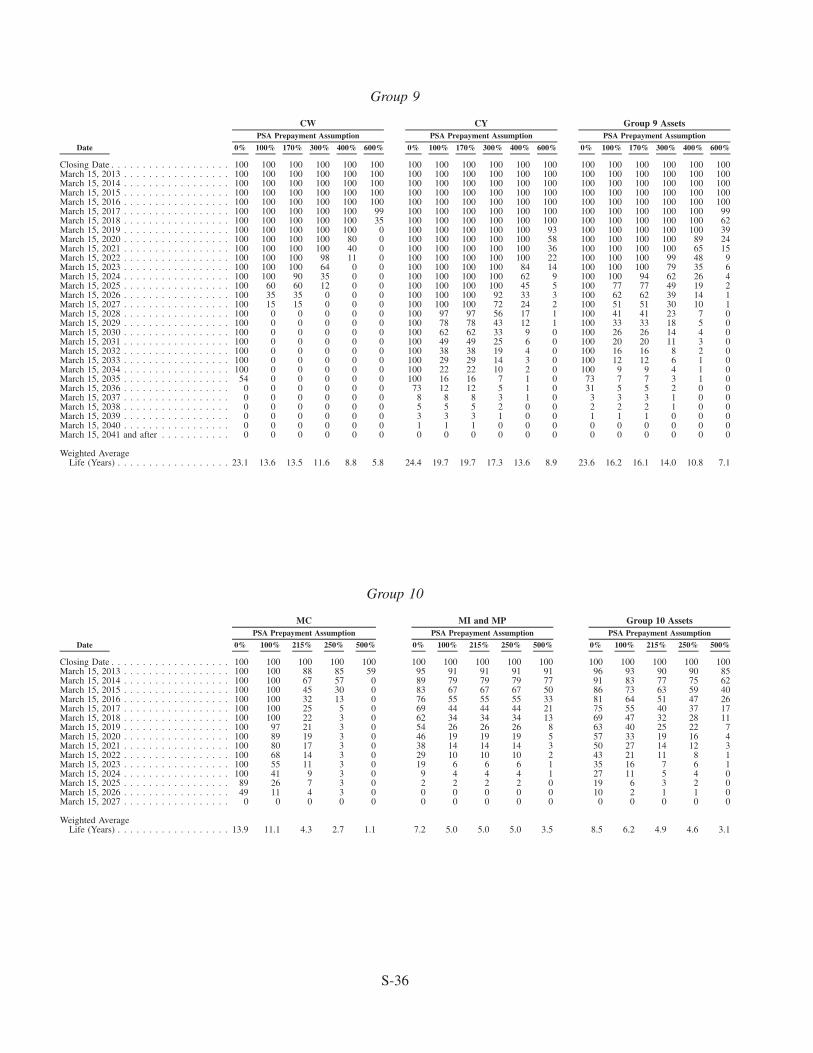
Group 9
Date 0% 100% 170% 300% 400% 600% 0% 100% 170% 300% 400% 600% 0% 100% 170% 300% 400% 600%
PSA Prepayment AssumptionPSA Prepayment AssumptionPSA Prepayment Assumption
Group 9 AssetsCYCW
Closing Date . . . . . . . . . . . . . . . . . . . 100 100 100 100 100 100 100 100 100 100 100 100 100 100 100 100 100 100March 15, 2013 . . . . . . . . . . . . . . . . . 100 100 100 100 100 100 100 100 100 100 100 100 100 100 100 100 100 100March 15, 2014 . . . . . . . . . . . . . . . . . 100 100 100 100 100 100 100 100 100 100 100 100 100 100 100 100 100 100March 15, 2015 . . . . . . . . . . . . . . . . . 100 100 100 100 100 100 100 100 100 100 100 100 100 100 100 100 100 100March 15, 2016 . . . . . . . . . . . . . . . . . 100 100 100 100 100 100 100 100 100 100 100 100 100 100 100 100 100 100March 15, 2017 . . . . . . . . . . . . . . . . . 100 100 100 100 100 99 100 100 100 100 100 100 100 100 100 100 100 99March 15, 2018 . . . . . . . . . . . . . . . . . 100 100 100 100 100 35 100 100 100 100 100 100 100 100 100 100 100 62March 15, 2019 . . . . . . . . . . . . . . . . . 100 100 100 100 100 0 100 100 100 100 100 93 100 100 100 100 100 39March 15, 2020 . . . . . . . . . . . . . . . . . 100 100 100 100 80 0 100 100 100 100 100 58 100 100 100 100 89 24March 15, 2021 . . . . . . . . . . . . . . . . . 100 100 100 100 40 0 100 100 100 100 100 36 100 100 100 100 65 15March 15, 2022 . . . . . . . . . . . . . . . . . 100 100 100 98 11 0 100 100 100 100 100 22 100 100 100 99 48 9March 15, 2023 . . . . . . . . . . . . . . . . . 100 100 100 64 0 0 100 100 100 100 84 14 100 100 100 79 35 6March 15, 2024 . . . . . . . . . . . . . . . . . 100 100 90 35 0 0 100 100 100 100 62 9 100 100 94 62 26 4March 15, 2025 . . . . . . . . . . . . . . . . . 100 60 60 12 0 0 100 100 100 100 45 5 100 77 77 49 19 2March 15, 2026 . . . . . . . . . . . . . . . . . 100 35 35 0 0 0 100 100 100 92 33 3 100 62 62 39 14 1March 15, 2027 . . . . . . . . . . . . . . . . . 100 15 15 0 0 0 100 100 100 72 24 2 100 51 51 30 10 1March 15, 2028 . . . . . . . . . . . . . . . . . 100 0 0 0 0 0 100 97 97 56 17 1 100 41 41 23 7 0March 15, 2029 . . . . . . . . . . . . . . . . . 100 0 0 0 0 0 100 78 78 43 12 1 100 33 33 18 5 0March 15, 2030 . . . . . . . . . . . . . . . . . 100 0 0 0 0 0 100 62 62 33 9 0 100 26 26 14 4 0March 15, 2031 . . . . . . . . . . . . . . . . . 100 0 0 0 0 0 100 49 49 25 6 0 100 20 20 11 3 0March 15, 2032 . . . . . . . . . . . . . . . . . 100 0 0 0 0 0 100 38 38 19 4 0 100 16 16 8 2 0March 15, 2033 . . . . . . . . . . . . . . . . . 100 0 0 0 0 0 100 29 29 14 3 0 100 12 12 6 1 0March 15, 2034 . . . . . . . . . . . . . . . . . 100 0 0 0 0 0 100 22 22 10 2 0 100 9 9 4 1 0March 15, 2035 . . . . . . . . . . . . . . . . . 54 0 0 0 0 0 100 16 16 7 1 0 73 7 7 3 1 0March 15, 2036 . . . . . . . . . . . . . . . . . 0 0 0 0 0 0 73 12 12 5 1 0 31 5 5 2 0 0March 15, 2037 . . . . . . . . . . . . . . . . . 0 0 0 0 0 0 8 8 8 3 1 0 3 3 3 1 0 0March 15, 2038 . . . . . . . . . . . . . . . . . 0 0 0 0 0 0 5 5 5 2 0 0 2 2 2 1 0 0March 15, 2039 . . . . . . . . . . . . . . . . . 0 0 0 0 0 0 3 3 3 1 0 0 1 1 1 0 0 0March 15, 2040 . . . . . . . . . . . . . . . . . 0 0 0 0 0 0 1 1 1 0 0 0 0 0 0 0 0 0March 15, 2041 and after . . . . . . . . . . . 0 0 0 0 0 0 0 0 0 0 0 0 0 0 0 0 0 0
Weighted AverageLife (Years) . . . . . . . . . . . . . . . . . . 23.1 13.6 13.5 11.6 8.8 5.8 24.4 19.7 19.7 17.3 13.6 8.9 23.6 16.2 16.1 14.0 10.8 7.1
Group 10
Date 0% 100% 215% 250% 500% 0% 100% 215% 250% 500% 0% 100% 215% 250% 500%
PSA Prepayment AssumptionPSA Prepayment AssumptionPSA Prepayment Assumption
Group 10 AssetsMI and MPMC
Closing Date . . . . . . . . . . . . . . . . . . . 100 100 100 100 100 100 100 100 100 100 100 100 100 100 100March 15, 2013 . . . . . . . . . . . . . . . . . 100 100 88 85 59 95 91 91 91 91 96 93 90 90 85March 15, 2014 . . . . . . . . . . . . . . . . . 100 100 67 57 0 89 79 79 79 77 91 83 77 75 62March 15, 2015 . . . . . . . . . . . . . . . . . 100 100 45 30 0 83 67 67 67 50 86 73 63 59 40March 15, 2016 . . . . . . . . . . . . . . . . . 100 100 32 13 0 76 55 55 55 33 81 64 51 47 26March 15, 2017 . . . . . . . . . . . . . . . . . 100 100 25 5 0 69 44 44 44 21 75 55 40 37 17March 15, 2018 . . . . . . . . . . . . . . . . . 100 100 22 3 0 62 34 34 34 13 69 47 32 28 11March 15, 2019 . . . . . . . . . . . . . . . . . 100 97 21 3 0 54 26 26 26 8 63 40 25 22 7March 15, 2020 . . . . . . . . . . . . . . . . . 100 89 19 3 0 46 19 19 19 5 57 33 19 16 4March 15, 2021 . . . . . . . . . . . . . . . . . 100 80 17 3 0 38 14 14 14 3 50 27 14 12 3March 15, 2022 . . . . . . . . . . . . . . . . . 100 68 14 3 0 29 10 10 10 2 43 21 11 8 1March 15, 2023 . . . . . . . . . . . . . . . . . 100 55 11 3 0 19 6 6 6 1 35 16 7 6 1March 15, 2024 . . . . . . . . . . . . . . . . . 100 41 9 3 0 9 4 4 4 1 27 11 5 4 0March 15, 2025 . . . . . . . . . . . . . . . . . 89 26 7 3 0 2 2 2 2 0 19 6 3 2 0March 15, 2026 . . . . . . . . . . . . . . . . . 49 11 4 3 0 0 0 0 0 0 10 2 1 1 0March 15, 2027 . . . . . . . . . . . . . . . . . 0 0 0 0 0 0 0 0 0 0 0 0 0 0 0
Weighted AverageLife (Years) . . . . . . . . . . . . . . . . . . 13.9 11.1 4.3 2.7 1.1 7.2 5.0 5.0 5.0 3.5 8.5 6.2 4.9 4.6 3.1
S-36
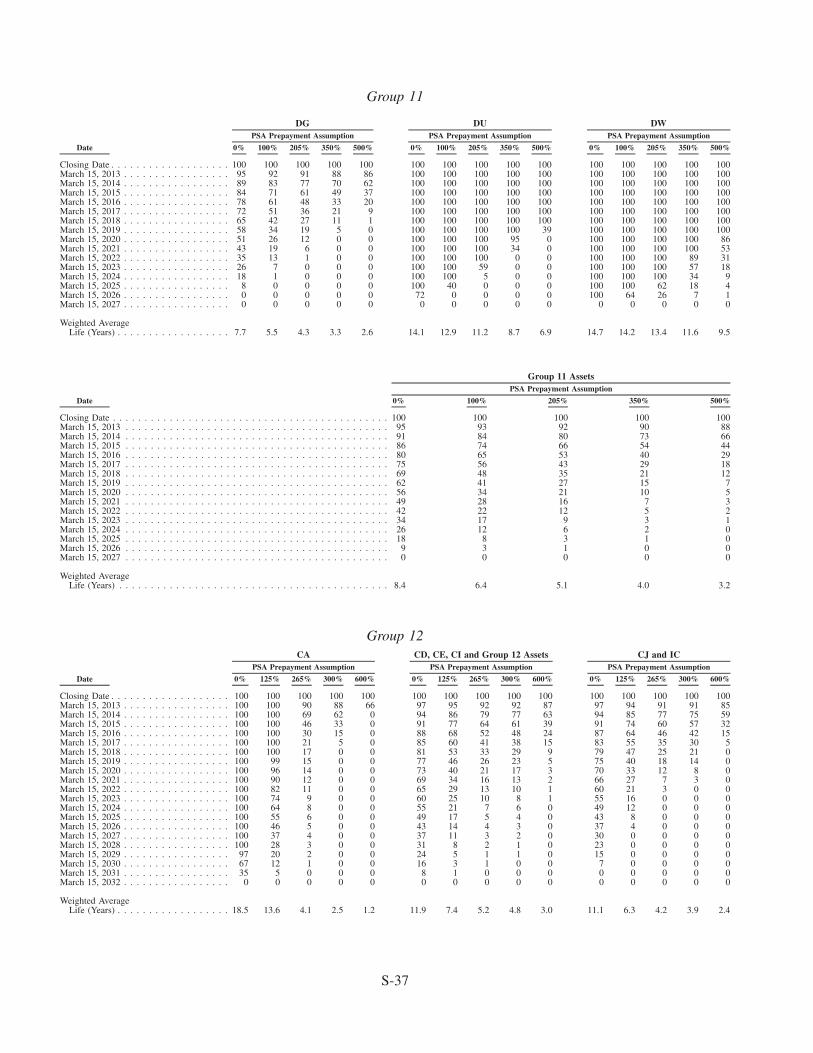
Group 11
Date 0% 100% 205% 350% 500% 0% 100% 205% 350% 500% 0% 100% 205% 350% 500%
PSA Prepayment AssumptionPSA Prepayment AssumptionPSA Prepayment Assumption
DWDUDG
Closing Date . . . . . . . . . . . . . . . . . . . 100 100 100 100 100 100 100 100 100 100 100 100 100 100 100March 15, 2013 . . . . . . . . . . . . . . . . . 95 92 91 88 86 100 100 100 100 100 100 100 100 100 100March 15, 2014 . . . . . . . . . . . . . . . . . 89 83 77 70 62 100 100 100 100 100 100 100 100 100 100March 15, 2015 . . . . . . . . . . . . . . . . . 84 71 61 49 37 100 100 100 100 100 100 100 100 100 100March 15, 2016 . . . . . . . . . . . . . . . . . 78 61 48 33 20 100 100 100 100 100 100 100 100 100 100March 15, 2017 . . . . . . . . . . . . . . . . . 72 51 36 21 9 100 100 100 100 100 100 100 100 100 100March 15, 2018 . . . . . . . . . . . . . . . . . 65 42 27 11 1 100 100 100 100 100 100 100 100 100 100March 15, 2019 . . . . . . . . . . . . . . . . . 58 34 19 5 0 100 100 100 100 39 100 100 100 100 100March 15, 2020 . . . . . . . . . . . . . . . . . 51 26 12 0 0 100 100 100 95 0 100 100 100 100 86March 15, 2021 . . . . . . . . . . . . . . . . . 43 19 6 0 0 100 100 100 34 0 100 100 100 100 53March 15, 2022 . . . . . . . . . . . . . . . . . 35 13 1 0 0 100 100 100 0 0 100 100 100 89 31March 15, 2023 . . . . . . . . . . . . . . . . . 26 7 0 0 0 100 100 59 0 0 100 100 100 57 18March 15, 2024 . . . . . . . . . . . . . . . . . 18 1 0 0 0 100 100 5 0 0 100 100 100 34 9March 15, 2025 . . . . . . . . . . . . . . . . . 8 0 0 0 0 100 40 0 0 0 100 100 62 18 4March 15, 2026 . . . . . . . . . . . . . . . . . 0 0 0 0 0 72 0 0 0 0 100 64 26 7 1March 15, 2027 . . . . . . . . . . . . . . . . . 0 0 0 0 0 0 0 0 0 0 0 0 0 0 0
Weighted AverageLife (Years) . . . . . . . . . . . . . . . . . . 7.7 5.5 4.3 3.3 2.6 14.1 12.9 11.2 8.7 6.9 14.7 14.2 13.4 11.6 9.5
Date 0% 100% 205% 350% 500%
PSA Prepayment Assumption
Group 11 Assets
Closing Date . . . . . . . . . . . . . . . . . . . . . . . . . . . . . . . . . . . . . . . . . . . . 100 100 100 100 100March 15, 2013 . . . . . . . . . . . . . . . . . . . . . . . . . . . . . . . . . . . . . . . . . . 95 93 92 90 88March 15, 2014 . . . . . . . . . . . . . . . . . . . . . . . . . . . . . . . . . . . . . . . . . . 91 84 80 73 66March 15, 2015 . . . . . . . . . . . . . . . . . . . . . . . . . . . . . . . . . . . . . . . . . . 86 74 66 54 44March 15, 2016 . . . . . . . . . . . . . . . . . . . . . . . . . . . . . . . . . . . . . . . . . . 80 65 53 40 29March 15, 2017 . . . . . . . . . . . . . . . . . . . . . . . . . . . . . . . . . . . . . . . . . . 75 56 43 29 18March 15, 2018 . . . . . . . . . . . . . . . . . . . . . . . . . . . . . . . . . . . . . . . . . . 69 48 35 21 12March 15, 2019 . . . . . . . . . . . . . . . . . . . . . . . . . . . . . . . . . . . . . . . . . . 62 41 27 15 7March 15, 2020 . . . . . . . . . . . . . . . . . . . . . . . . . . . . . . . . . . . . . . . . . . 56 34 21 10 5March 15, 2021 . . . . . . . . . . . . . . . . . . . . . . . . . . . . . . . . . . . . . . . . . . 49 28 16 7 3March 15, 2022 . . . . . . . . . . . . . . . . . . . . . . . . . . . . . . . . . . . . . . . . . . 42 22 12 5 2March 15, 2023 . . . . . . . . . . . . . . . . . . . . . . . . . . . . . . . . . . . . . . . . . . 34 17 9 3 1March 15, 2024 . . . . . . . . . . . . . . . . . . . . . . . . . . . . . . . . . . . . . . . . . . 26 12 6 2 0March 15, 2025 . . . . . . . . . . . . . . . . . . . . . . . . . . . . . . . . . . . . . . . . . . 18 8 3 1 0March 15, 2026 . . . . . . . . . . . . . . . . . . . . . . . . . . . . . . . . . . . . . . . . . . 9 3 1 0 0March 15, 2027 . . . . . . . . . . . . . . . . . . . . . . . . . . . . . . . . . . . . . . . . . . 0 0 0 0 0
Weighted AverageLife (Years) . . . . . . . . . . . . . . . . . . . . . . . . . . . . . . . . . . . . . . . . . . . 8.4 6.4 5.1 4.0 3.2
Group 12
Date 0% 125% 265% 300% 600% 0% 125% 265% 300% 600% 0% 125% 265% 300% 600%
PSA Prepayment AssumptionPSA Prepayment AssumptionPSA Prepayment Assumption
CJ and ICCD, CE, CI and Group 12 AssetsCA
Closing Date . . . . . . . . . . . . . . . . . . . 100 100 100 100 100 100 100 100 100 100 100 100 100 100 100March 15, 2013 . . . . . . . . . . . . . . . . . 100 100 90 88 66 97 95 92 92 87 97 94 91 91 85March 15, 2014 . . . . . . . . . . . . . . . . . 100 100 69 62 0 94 86 79 77 63 94 85 77 75 59March 15, 2015 . . . . . . . . . . . . . . . . . 100 100 46 33 0 91 77 64 61 39 91 74 60 57 32March 15, 2016 . . . . . . . . . . . . . . . . . 100 100 30 15 0 88 68 52 48 24 87 64 46 42 15March 15, 2017 . . . . . . . . . . . . . . . . . 100 100 21 5 0 85 60 41 38 15 83 55 35 30 5March 15, 2018 . . . . . . . . . . . . . . . . . 100 100 17 0 0 81 53 33 29 9 79 47 25 21 0March 15, 2019 . . . . . . . . . . . . . . . . . 100 99 15 0 0 77 46 26 23 5 75 40 18 14 0March 15, 2020 . . . . . . . . . . . . . . . . . 100 96 14 0 0 73 40 21 17 3 70 33 12 8 0March 15, 2021 . . . . . . . . . . . . . . . . . 100 90 12 0 0 69 34 16 13 2 66 27 7 3 0March 15, 2022 . . . . . . . . . . . . . . . . . 100 82 11 0 0 65 29 13 10 1 60 21 3 0 0March 15, 2023 . . . . . . . . . . . . . . . . . 100 74 9 0 0 60 25 10 8 1 55 16 0 0 0March 15, 2024 . . . . . . . . . . . . . . . . . 100 64 8 0 0 55 21 7 6 0 49 12 0 0 0March 15, 2025 . . . . . . . . . . . . . . . . . 100 55 6 0 0 49 17 5 4 0 43 8 0 0 0March 15, 2026 . . . . . . . . . . . . . . . . . 100 46 5 0 0 43 14 4 3 0 37 4 0 0 0March 15, 2027 . . . . . . . . . . . . . . . . . 100 37 4 0 0 37 11 3 2 0 30 0 0 0 0March 15, 2028 . . . . . . . . . . . . . . . . . 100 28 3 0 0 31 8 2 1 0 23 0 0 0 0March 15, 2029 . . . . . . . . . . . . . . . . . 97 20 2 0 0 24 5 1 1 0 15 0 0 0 0March 15, 2030 . . . . . . . . . . . . . . . . . 67 12 1 0 0 16 3 1 0 0 7 0 0 0 0March 15, 2031 . . . . . . . . . . . . . . . . . 35 5 0 0 0 8 1 0 0 0 0 0 0 0 0March 15, 2032 . . . . . . . . . . . . . . . . . 0 0 0 0 0 0 0 0 0 0 0 0 0 0 0
Weighted AverageLife (Years) . . . . . . . . . . . . . . . . . . 18.5 13.6 4.1 2.5 1.2 11.9 7.4 5.2 4.8 3.0 11.1 6.3 4.2 3.9 2.4
S-37
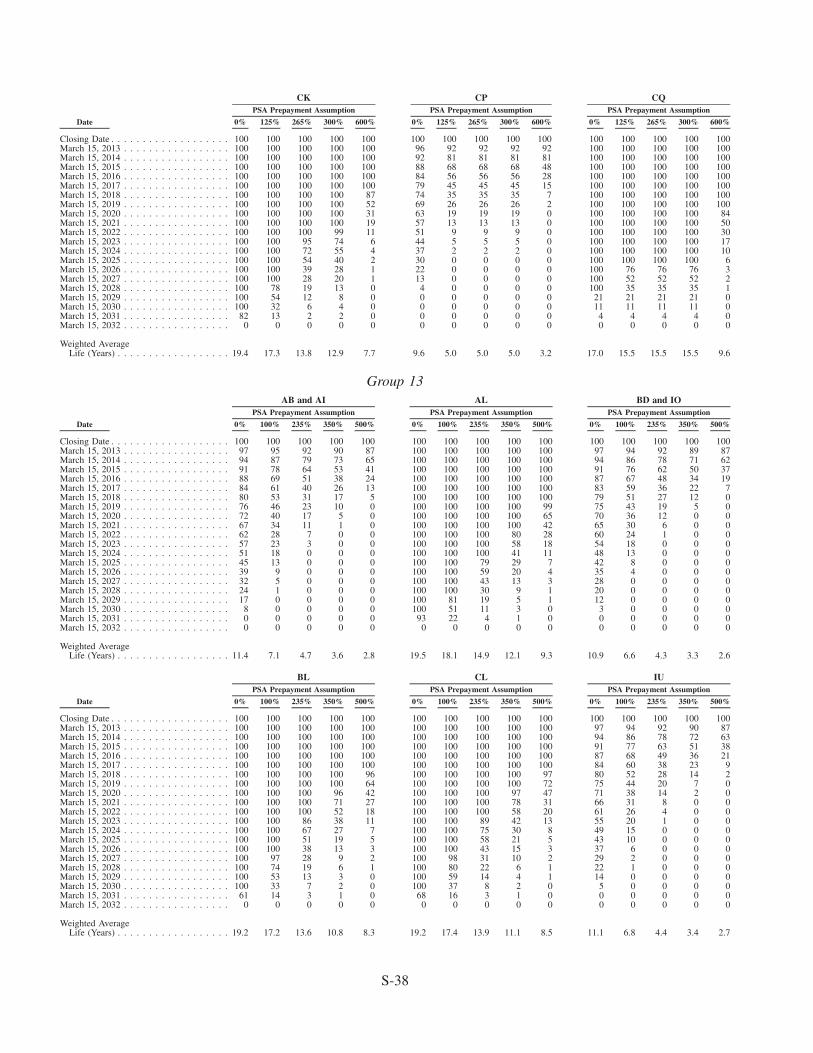
Date 0% 125% 265% 300% 600% 0% 125% 265% 300% 600% 0% 125% 265% 300% 600%
PSA Prepayment AssumptionPSA Prepayment AssumptionPSA Prepayment Assumption
CQCPCK
Closing Date . . . . . . . . . . . . . . . . . . . 100 100 100 100 100 100 100 100 100 100 100 100 100 100 100March 15, 2013 . . . . . . . . . . . . . . . . . 100 100 100 100 100 96 92 92 92 92 100 100 100 100 100March 15, 2014 . . . . . . . . . . . . . . . . . 100 100 100 100 100 92 81 81 81 81 100 100 100 100 100March 15, 2015 . . . . . . . . . . . . . . . . . 100 100 100 100 100 88 68 68 68 48 100 100 100 100 100March 15, 2016 . . . . . . . . . . . . . . . . . 100 100 100 100 100 84 56 56 56 28 100 100 100 100 100March 15, 2017 . . . . . . . . . . . . . . . . . 100 100 100 100 100 79 45 45 45 15 100 100 100 100 100March 15, 2018 . . . . . . . . . . . . . . . . . 100 100 100 100 87 74 35 35 35 7 100 100 100 100 100March 15, 2019 . . . . . . . . . . . . . . . . . 100 100 100 100 52 69 26 26 26 2 100 100 100 100 100March 15, 2020 . . . . . . . . . . . . . . . . . 100 100 100 100 31 63 19 19 19 0 100 100 100 100 84March 15, 2021 . . . . . . . . . . . . . . . . . 100 100 100 100 19 57 13 13 13 0 100 100 100 100 50March 15, 2022 . . . . . . . . . . . . . . . . . 100 100 100 99 11 51 9 9 9 0 100 100 100 100 30March 15, 2023 . . . . . . . . . . . . . . . . . 100 100 95 74 6 44 5 5 5 0 100 100 100 100 17March 15, 2024 . . . . . . . . . . . . . . . . . 100 100 72 55 4 37 2 2 2 0 100 100 100 100 10March 15, 2025 . . . . . . . . . . . . . . . . . 100 100 54 40 2 30 0 0 0 0 100 100 100 100 6March 15, 2026 . . . . . . . . . . . . . . . . . 100 100 39 28 1 22 0 0 0 0 100 76 76 76 3March 15, 2027 . . . . . . . . . . . . . . . . . 100 100 28 20 1 13 0 0 0 0 100 52 52 52 2March 15, 2028 . . . . . . . . . . . . . . . . . 100 78 19 13 0 4 0 0 0 0 100 35 35 35 1March 15, 2029 . . . . . . . . . . . . . . . . . 100 54 12 8 0 0 0 0 0 0 21 21 21 21 0March 15, 2030 . . . . . . . . . . . . . . . . . 100 32 6 4 0 0 0 0 0 0 11 11 11 11 0March 15, 2031 . . . . . . . . . . . . . . . . . 82 13 2 2 0 0 0 0 0 0 4 4 4 4 0March 15, 2032 . . . . . . . . . . . . . . . . . 0 0 0 0 0 0 0 0 0 0 0 0 0 0 0
Weighted AverageLife (Years) . . . . . . . . . . . . . . . . . . 19.4 17.3 13.8 12.9 7.7 9.6 5.0 5.0 5.0 3.2 17.0 15.5 15.5 15.5 9.6
Group 13
Date 0% 100% 235% 350% 500% 0% 100% 235% 350% 500% 0% 100% 235% 350% 500%
PSA Prepayment AssumptionPSA Prepayment AssumptionPSA Prepayment Assumption
BD and IOALAB and AI
Closing Date . . . . . . . . . . . . . . . . . . . 100 100 100 100 100 100 100 100 100 100 100 100 100 100 100March 15, 2013 . . . . . . . . . . . . . . . . . 97 95 92 90 87 100 100 100 100 100 97 94 92 89 87March 15, 2014 . . . . . . . . . . . . . . . . . 94 87 79 73 65 100 100 100 100 100 94 86 78 71 62March 15, 2015 . . . . . . . . . . . . . . . . . 91 78 64 53 41 100 100 100 100 100 91 76 62 50 37March 15, 2016 . . . . . . . . . . . . . . . . . 88 69 51 38 24 100 100 100 100 100 87 67 48 34 19March 15, 2017 . . . . . . . . . . . . . . . . . 84 61 40 26 13 100 100 100 100 100 83 59 36 22 7March 15, 2018 . . . . . . . . . . . . . . . . . 80 53 31 17 5 100 100 100 100 100 79 51 27 12 0March 15, 2019 . . . . . . . . . . . . . . . . . 76 46 23 10 0 100 100 100 100 99 75 43 19 5 0March 15, 2020 . . . . . . . . . . . . . . . . . 72 40 17 5 0 100 100 100 100 65 70 36 12 0 0March 15, 2021 . . . . . . . . . . . . . . . . . 67 34 11 1 0 100 100 100 100 42 65 30 6 0 0March 15, 2022 . . . . . . . . . . . . . . . . . 62 28 7 0 0 100 100 100 80 28 60 24 1 0 0March 15, 2023 . . . . . . . . . . . . . . . . . 57 23 3 0 0 100 100 100 58 18 54 18 0 0 0March 15, 2024 . . . . . . . . . . . . . . . . . 51 18 0 0 0 100 100 100 41 11 48 13 0 0 0March 15, 2025 . . . . . . . . . . . . . . . . . 45 13 0 0 0 100 100 79 29 7 42 8 0 0 0March 15, 2026 . . . . . . . . . . . . . . . . . 39 9 0 0 0 100 100 59 20 4 35 4 0 0 0March 15, 2027 . . . . . . . . . . . . . . . . . 32 5 0 0 0 100 100 43 13 3 28 0 0 0 0March 15, 2028 . . . . . . . . . . . . . . . . . 24 1 0 0 0 100 100 30 9 1 20 0 0 0 0March 15, 2029 . . . . . . . . . . . . . . . . . 17 0 0 0 0 100 81 19 5 1 12 0 0 0 0March 15, 2030 . . . . . . . . . . . . . . . . . 8 0 0 0 0 100 51 11 3 0 3 0 0 0 0March 15, 2031 . . . . . . . . . . . . . . . . . 0 0 0 0 0 93 22 4 1 0 0 0 0 0 0March 15, 2032 . . . . . . . . . . . . . . . . . 0 0 0 0 0 0 0 0 0 0 0 0 0 0 0
Weighted AverageLife (Years) . . . . . . . . . . . . . . . . . . 11.4 7.1 4.7 3.6 2.8 19.5 18.1 14.9 12.1 9.3 10.9 6.6 4.3 3.3 2.6
Date 0% 100% 235% 350% 500% 0% 100% 235% 350% 500% 0% 100% 235% 350% 500%
PSA Prepayment AssumptionPSA Prepayment AssumptionPSA Prepayment Assumption
IUCLBL
Closing Date . . . . . . . . . . . . . . . . . . . 100 100 100 100 100 100 100 100 100 100 100 100 100 100 100March 15, 2013 . . . . . . . . . . . . . . . . . 100 100 100 100 100 100 100 100 100 100 97 94 92 90 87March 15, 2014 . . . . . . . . . . . . . . . . . 100 100 100 100 100 100 100 100 100 100 94 86 78 72 63March 15, 2015 . . . . . . . . . . . . . . . . . 100 100 100 100 100 100 100 100 100 100 91 77 63 51 38March 15, 2016 . . . . . . . . . . . . . . . . . 100 100 100 100 100 100 100 100 100 100 87 68 49 36 21March 15, 2017 . . . . . . . . . . . . . . . . . 100 100 100 100 100 100 100 100 100 100 84 60 38 23 9March 15, 2018 . . . . . . . . . . . . . . . . . 100 100 100 100 96 100 100 100 100 97 80 52 28 14 2March 15, 2019 . . . . . . . . . . . . . . . . . 100 100 100 100 64 100 100 100 100 72 75 44 20 7 0March 15, 2020 . . . . . . . . . . . . . . . . . 100 100 100 96 42 100 100 100 97 47 71 38 14 2 0March 15, 2021 . . . . . . . . . . . . . . . . . 100 100 100 71 27 100 100 100 78 31 66 31 8 0 0March 15, 2022 . . . . . . . . . . . . . . . . . 100 100 100 52 18 100 100 100 58 20 61 26 4 0 0March 15, 2023 . . . . . . . . . . . . . . . . . 100 100 86 38 11 100 100 89 42 13 55 20 1 0 0March 15, 2024 . . . . . . . . . . . . . . . . . 100 100 67 27 7 100 100 75 30 8 49 15 0 0 0March 15, 2025 . . . . . . . . . . . . . . . . . 100 100 51 19 5 100 100 58 21 5 43 10 0 0 0March 15, 2026 . . . . . . . . . . . . . . . . . 100 100 38 13 3 100 100 43 15 3 37 6 0 0 0March 15, 2027 . . . . . . . . . . . . . . . . . 100 97 28 9 2 100 98 31 10 2 29 2 0 0 0March 15, 2028 . . . . . . . . . . . . . . . . . 100 74 19 6 1 100 80 22 6 1 22 1 0 0 0March 15, 2029 . . . . . . . . . . . . . . . . . 100 53 13 3 0 100 59 14 4 1 14 0 0 0 0March 15, 2030 . . . . . . . . . . . . . . . . . 100 33 7 2 0 100 37 8 2 0 5 0 0 0 0March 15, 2031 . . . . . . . . . . . . . . . . . 61 14 3 1 0 68 16 3 1 0 0 0 0 0 0March 15, 2032 . . . . . . . . . . . . . . . . . 0 0 0 0 0 0 0 0 0 0 0 0 0 0 0
Weighted AverageLife (Years) . . . . . . . . . . . . . . . . . . 19.2 17.2 13.6 10.8 8.3 19.2 17.4 13.9 11.1 8.5 11.1 6.8 4.4 3.4 2.7
S-38
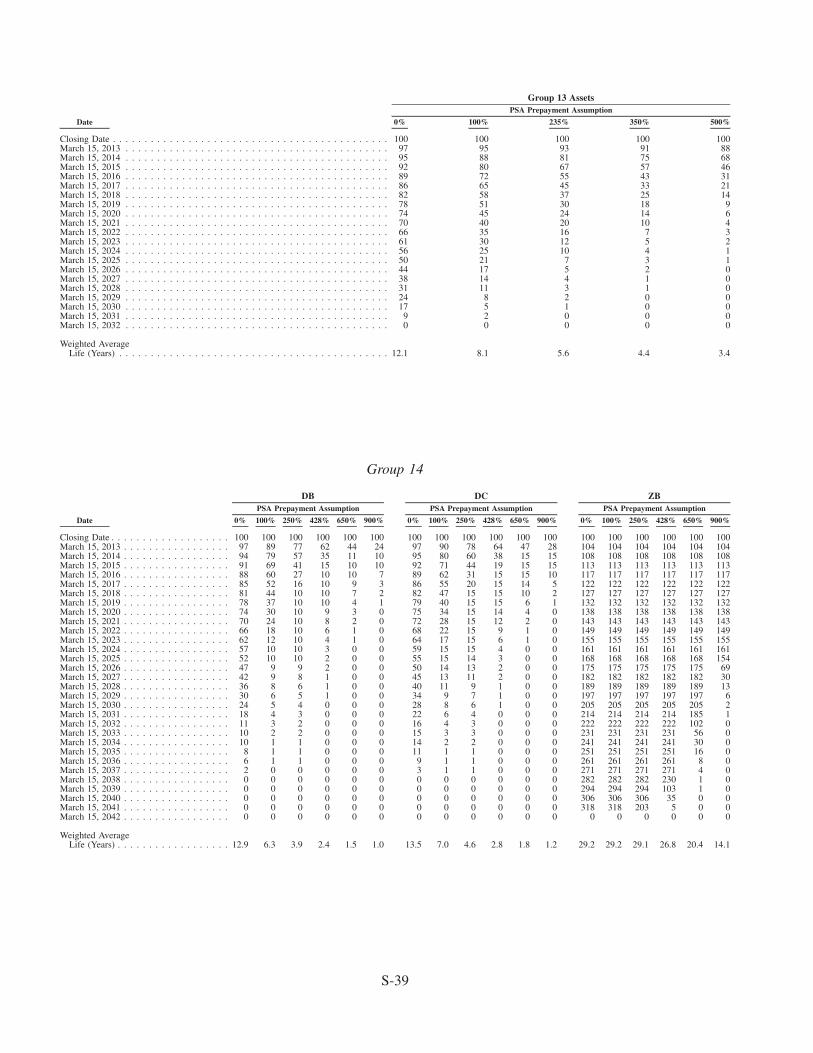
Date 0% 100% 235% 350% 500%
PSA Prepayment Assumption
Group 13 Assets
Closing Date . . . . . . . . . . . . . . . . . . . . . . . . . . . . . . . . . . . . . . . . . . . . 100 100 100 100 100March 15, 2013 . . . . . . . . . . . . . . . . . . . . . . . . . . . . . . . . . . . . . . . . . . 97 95 93 91 88March 15, 2014 . . . . . . . . . . . . . . . . . . . . . . . . . . . . . . . . . . . . . . . . . . 95 88 81 75 68March 15, 2015 . . . . . . . . . . . . . . . . . . . . . . . . . . . . . . . . . . . . . . . . . . 92 80 67 57 46March 15, 2016 . . . . . . . . . . . . . . . . . . . . . . . . . . . . . . . . . . . . . . . . . . 89 72 55 43 31March 15, 2017 . . . . . . . . . . . . . . . . . . . . . . . . . . . . . . . . . . . . . . . . . . 86 65 45 33 21March 15, 2018 . . . . . . . . . . . . . . . . . . . . . . . . . . . . . . . . . . . . . . . . . . 82 58 37 25 14March 15, 2019 . . . . . . . . . . . . . . . . . . . . . . . . . . . . . . . . . . . . . . . . . . 78 51 30 18 9March 15, 2020 . . . . . . . . . . . . . . . . . . . . . . . . . . . . . . . . . . . . . . . . . . 74 45 24 14 6March 15, 2021 . . . . . . . . . . . . . . . . . . . . . . . . . . . . . . . . . . . . . . . . . . 70 40 20 10 4March 15, 2022 . . . . . . . . . . . . . . . . . . . . . . . . . . . . . . . . . . . . . . . . . . 66 35 16 7 3March 15, 2023 . . . . . . . . . . . . . . . . . . . . . . . . . . . . . . . . . . . . . . . . . . 61 30 12 5 2March 15, 2024 . . . . . . . . . . . . . . . . . . . . . . . . . . . . . . . . . . . . . . . . . . 56 25 10 4 1March 15, 2025 . . . . . . . . . . . . . . . . . . . . . . . . . . . . . . . . . . . . . . . . . . 50 21 7 3 1March 15, 2026 . . . . . . . . . . . . . . . . . . . . . . . . . . . . . . . . . . . . . . . . . . 44 17 5 2 0March 15, 2027 . . . . . . . . . . . . . . . . . . . . . . . . . . . . . . . . . . . . . . . . . . 38 14 4 1 0March 15, 2028 . . . . . . . . . . . . . . . . . . . . . . . . . . . . . . . . . . . . . . . . . . 31 11 3 1 0March 15, 2029 . . . . . . . . . . . . . . . . . . . . . . . . . . . . . . . . . . . . . . . . . . 24 8 2 0 0March 15, 2030 . . . . . . . . . . . . . . . . . . . . . . . . . . . . . . . . . . . . . . . . . . 17 5 1 0 0March 15, 2031 . . . . . . . . . . . . . . . . . . . . . . . . . . . . . . . . . . . . . . . . . . 9 2 0 0 0March 15, 2032 . . . . . . . . . . . . . . . . . . . . . . . . . . . . . . . . . . . . . . . . . . 0 0 0 0 0
Weighted AverageLife (Years) . . . . . . . . . . . . . . . . . . . . . . . . . . . . . . . . . . . . . . . . . . . 12.1 8.1 5.6 4.4 3.4
Group 14
Date 0% 100% 250% 428% 650% 900% 0% 100% 250% 428% 650% 900% 0% 100% 250% 428% 650% 900%
PSA Prepayment AssumptionPSA Prepayment AssumptionPSA Prepayment Assumption
ZBDCDB
Closing Date . . . . . . . . . . . . . . . . . . . 100 100 100 100 100 100 100 100 100 100 100 100 100 100 100 100 100 100March 15, 2013 . . . . . . . . . . . . . . . . . 97 89 77 62 44 24 97 90 78 64 47 28 104 104 104 104 104 104March 15, 2014 . . . . . . . . . . . . . . . . . 94 79 57 35 11 10 95 80 60 38 15 15 108 108 108 108 108 108March 15, 2015 . . . . . . . . . . . . . . . . . 91 69 41 15 10 10 92 71 44 19 15 15 113 113 113 113 113 113March 15, 2016 . . . . . . . . . . . . . . . . . 88 60 27 10 10 7 89 62 31 15 15 10 117 117 117 117 117 117March 15, 2017 . . . . . . . . . . . . . . . . . 85 52 16 10 9 3 86 55 20 15 14 5 122 122 122 122 122 122March 15, 2018 . . . . . . . . . . . . . . . . . 81 44 10 10 7 2 82 47 15 15 10 2 127 127 127 127 127 127March 15, 2019 . . . . . . . . . . . . . . . . . 78 37 10 10 4 1 79 40 15 15 6 1 132 132 132 132 132 132March 15, 2020 . . . . . . . . . . . . . . . . . 74 30 10 9 3 0 75 34 15 14 4 0 138 138 138 138 138 138March 15, 2021 . . . . . . . . . . . . . . . . . 70 24 10 8 2 0 72 28 15 12 2 0 143 143 143 143 143 143March 15, 2022 . . . . . . . . . . . . . . . . . 66 18 10 6 1 0 68 22 15 9 1 0 149 149 149 149 149 149March 15, 2023 . . . . . . . . . . . . . . . . . 62 12 10 4 1 0 64 17 15 6 1 0 155 155 155 155 155 155March 15, 2024 . . . . . . . . . . . . . . . . . 57 10 10 3 0 0 59 15 15 4 0 0 161 161 161 161 161 161March 15, 2025 . . . . . . . . . . . . . . . . . 52 10 10 2 0 0 55 15 14 3 0 0 168 168 168 168 168 154March 15, 2026 . . . . . . . . . . . . . . . . . 47 9 9 2 0 0 50 14 13 2 0 0 175 175 175 175 175 69March 15, 2027 . . . . . . . . . . . . . . . . . 42 9 8 1 0 0 45 13 11 2 0 0 182 182 182 182 182 30March 15, 2028 . . . . . . . . . . . . . . . . . 36 8 6 1 0 0 40 11 9 1 0 0 189 189 189 189 189 13March 15, 2029 . . . . . . . . . . . . . . . . . 30 6 5 1 0 0 34 9 7 1 0 0 197 197 197 197 197 6March 15, 2030 . . . . . . . . . . . . . . . . . 24 5 4 0 0 0 28 8 6 1 0 0 205 205 205 205 205 2March 15, 2031 . . . . . . . . . . . . . . . . . 18 4 3 0 0 0 22 6 4 0 0 0 214 214 214 214 185 1March 15, 2032 . . . . . . . . . . . . . . . . . 11 3 2 0 0 0 16 4 3 0 0 0 222 222 222 222 102 0March 15, 2033 . . . . . . . . . . . . . . . . . 10 2 2 0 0 0 15 3 3 0 0 0 231 231 231 231 56 0March 15, 2034 . . . . . . . . . . . . . . . . . 10 1 1 0 0 0 14 2 2 0 0 0 241 241 241 241 30 0March 15, 2035 . . . . . . . . . . . . . . . . . 8 1 1 0 0 0 11 1 1 0 0 0 251 251 251 251 16 0March 15, 2036 . . . . . . . . . . . . . . . . . 6 1 1 0 0 0 9 1 1 0 0 0 261 261 261 261 8 0March 15, 2037 . . . . . . . . . . . . . . . . . 2 0 0 0 0 0 3 1 1 0 0 0 271 271 271 271 4 0March 15, 2038 . . . . . . . . . . . . . . . . . 0 0 0 0 0 0 0 0 0 0 0 0 282 282 282 230 1 0March 15, 2039 . . . . . . . . . . . . . . . . . 0 0 0 0 0 0 0 0 0 0 0 0 294 294 294 103 1 0March 15, 2040 . . . . . . . . . . . . . . . . . 0 0 0 0 0 0 0 0 0 0 0 0 306 306 306 35 0 0March 15, 2041 . . . . . . . . . . . . . . . . . 0 0 0 0 0 0 0 0 0 0 0 0 318 318 203 5 0 0March 15, 2042 . . . . . . . . . . . . . . . . . 0 0 0 0 0 0 0 0 0 0 0 0 0 0 0 0 0 0
Weighted AverageLife (Years) . . . . . . . . . . . . . . . . . . 12.9 6.3 3.9 2.4 1.5 1.0 13.5 7.0 4.6 2.8 1.8 1.2 29.2 29.2 29.1 26.8 20.4 14.1
S-39
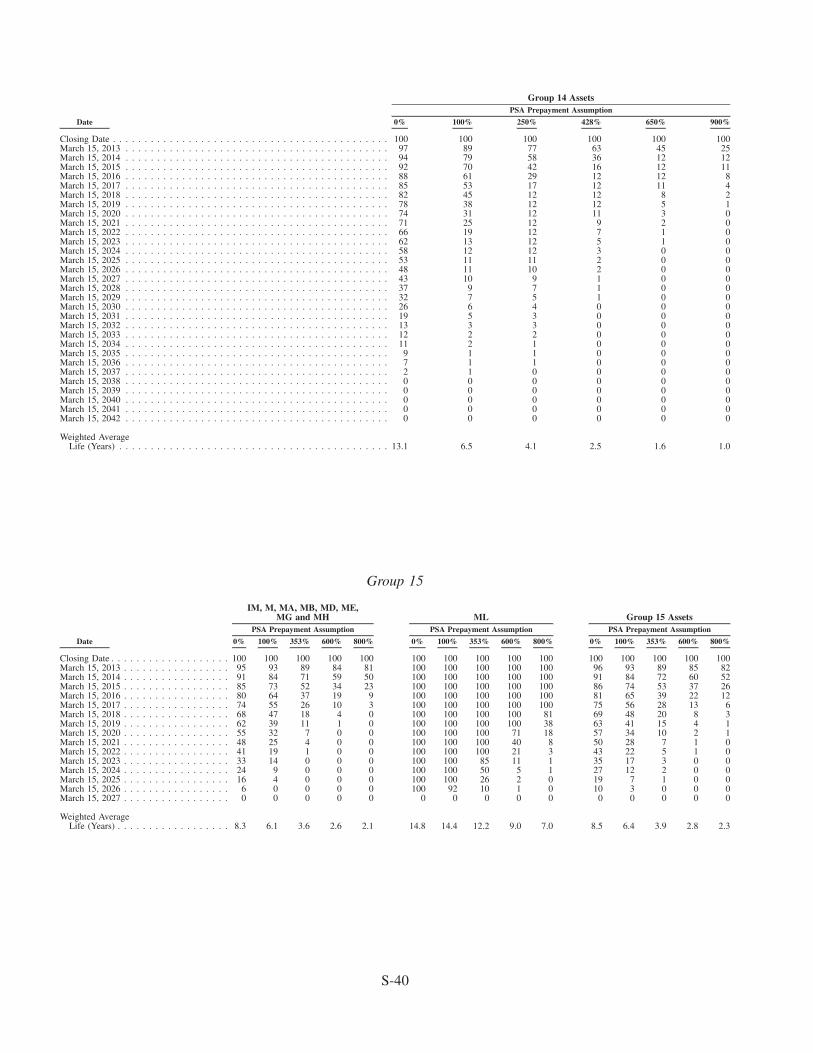
Date 0% 100% 250% 428% 650% 900%
PSA Prepayment Assumption
Group 14 Assets
Closing Date . . . . . . . . . . . . . . . . . . . . . . . . . . . . . . . . . . . . . . . . . . . . 100 100 100 100 100 100March 15, 2013 . . . . . . . . . . . . . . . . . . . . . . . . . . . . . . . . . . . . . . . . . . 97 89 77 63 45 25March 15, 2014 . . . . . . . . . . . . . . . . . . . . . . . . . . . . . . . . . . . . . . . . . . 94 79 58 36 12 12March 15, 2015 . . . . . . . . . . . . . . . . . . . . . . . . . . . . . . . . . . . . . . . . . . 92 70 42 16 12 11March 15, 2016 . . . . . . . . . . . . . . . . . . . . . . . . . . . . . . . . . . . . . . . . . . 88 61 29 12 12 8March 15, 2017 . . . . . . . . . . . . . . . . . . . . . . . . . . . . . . . . . . . . . . . . . . 85 53 17 12 11 4March 15, 2018 . . . . . . . . . . . . . . . . . . . . . . . . . . . . . . . . . . . . . . . . . . 82 45 12 12 8 2March 15, 2019 . . . . . . . . . . . . . . . . . . . . . . . . . . . . . . . . . . . . . . . . . . 78 38 12 12 5 1March 15, 2020 . . . . . . . . . . . . . . . . . . . . . . . . . . . . . . . . . . . . . . . . . . 74 31 12 11 3 0March 15, 2021 . . . . . . . . . . . . . . . . . . . . . . . . . . . . . . . . . . . . . . . . . . 71 25 12 9 2 0March 15, 2022 . . . . . . . . . . . . . . . . . . . . . . . . . . . . . . . . . . . . . . . . . . 66 19 12 7 1 0March 15, 2023 . . . . . . . . . . . . . . . . . . . . . . . . . . . . . . . . . . . . . . . . . . 62 13 12 5 1 0March 15, 2024 . . . . . . . . . . . . . . . . . . . . . . . . . . . . . . . . . . . . . . . . . . 58 12 12 3 0 0March 15, 2025 . . . . . . . . . . . . . . . . . . . . . . . . . . . . . . . . . . . . . . . . . . 53 11 11 2 0 0March 15, 2026 . . . . . . . . . . . . . . . . . . . . . . . . . . . . . . . . . . . . . . . . . . 48 11 10 2 0 0March 15, 2027 . . . . . . . . . . . . . . . . . . . . . . . . . . . . . . . . . . . . . . . . . . 43 10 9 1 0 0March 15, 2028 . . . . . . . . . . . . . . . . . . . . . . . . . . . . . . . . . . . . . . . . . . 37 9 7 1 0 0March 15, 2029 . . . . . . . . . . . . . . . . . . . . . . . . . . . . . . . . . . . . . . . . . . 32 7 5 1 0 0March 15, 2030 . . . . . . . . . . . . . . . . . . . . . . . . . . . . . . . . . . . . . . . . . . 26 6 4 0 0 0March 15, 2031 . . . . . . . . . . . . . . . . . . . . . . . . . . . . . . . . . . . . . . . . . . 19 5 3 0 0 0March 15, 2032 . . . . . . . . . . . . . . . . . . . . . . . . . . . . . . . . . . . . . . . . . . 13 3 3 0 0 0March 15, 2033 . . . . . . . . . . . . . . . . . . . . . . . . . . . . . . . . . . . . . . . . . . 12 2 2 0 0 0March 15, 2034 . . . . . . . . . . . . . . . . . . . . . . . . . . . . . . . . . . . . . . . . . . 11 2 1 0 0 0March 15, 2035 . . . . . . . . . . . . . . . . . . . . . . . . . . . . . . . . . . . . . . . . . . 9 1 1 0 0 0March 15, 2036 . . . . . . . . . . . . . . . . . . . . . . . . . . . . . . . . . . . . . . . . . . 7 1 1 0 0 0March 15, 2037 . . . . . . . . . . . . . . . . . . . . . . . . . . . . . . . . . . . . . . . . . . 2 1 0 0 0 0March 15, 2038 . . . . . . . . . . . . . . . . . . . . . . . . . . . . . . . . . . . . . . . . . . 0 0 0 0 0 0March 15, 2039 . . . . . . . . . . . . . . . . . . . . . . . . . . . . . . . . . . . . . . . . . . 0 0 0 0 0 0March 15, 2040 . . . . . . . . . . . . . . . . . . . . . . . . . . . . . . . . . . . . . . . . . . 0 0 0 0 0 0March 15, 2041 . . . . . . . . . . . . . . . . . . . . . . . . . . . . . . . . . . . . . . . . . . 0 0 0 0 0 0March 15, 2042 . . . . . . . . . . . . . . . . . . . . . . . . . . . . . . . . . . . . . . . . . . 0 0 0 0 0 0
Weighted AverageLife (Years) . . . . . . . . . . . . . . . . . . . . . . . . . . . . . . . . . . . . . . . . . . . 13.1 6.5 4.1 2.5 1.6 1.0
Group 15
Date 0% 100% 353% 600% 800% 0% 100% 353% 600% 800% 0% 100% 353% 600% 800%
PSA Prepayment AssumptionPSA Prepayment AssumptionPSA Prepayment Assumption
Group 15 AssetsMLIM, M, MA, MB, MD, ME,
MG and MH
Closing Date . . . . . . . . . . . . . . . . . . . 100 100 100 100 100 100 100 100 100 100 100 100 100 100 100March 15, 2013 . . . . . . . . . . . . . . . . . 95 93 89 84 81 100 100 100 100 100 96 93 89 85 82March 15, 2014 . . . . . . . . . . . . . . . . . 91 84 71 59 50 100 100 100 100 100 91 84 72 60 52March 15, 2015 . . . . . . . . . . . . . . . . . 85 73 52 34 23 100 100 100 100 100 86 74 53 37 26March 15, 2016 . . . . . . . . . . . . . . . . . 80 64 37 19 9 100 100 100 100 100 81 65 39 22 12March 15, 2017 . . . . . . . . . . . . . . . . . 74 55 26 10 3 100 100 100 100 100 75 56 28 13 6March 15, 2018 . . . . . . . . . . . . . . . . . 68 47 18 4 0 100 100 100 100 81 69 48 20 8 3March 15, 2019 . . . . . . . . . . . . . . . . . 62 39 11 1 0 100 100 100 100 38 63 41 15 4 1March 15, 2020 . . . . . . . . . . . . . . . . . 55 32 7 0 0 100 100 100 71 18 57 34 10 2 1March 15, 2021 . . . . . . . . . . . . . . . . . 48 25 4 0 0 100 100 100 40 8 50 28 7 1 0March 15, 2022 . . . . . . . . . . . . . . . . . 41 19 1 0 0 100 100 100 21 3 43 22 5 1 0March 15, 2023 . . . . . . . . . . . . . . . . . 33 14 0 0 0 100 100 85 11 1 35 17 3 0 0March 15, 2024 . . . . . . . . . . . . . . . . . 24 9 0 0 0 100 100 50 5 1 27 12 2 0 0March 15, 2025 . . . . . . . . . . . . . . . . . 16 4 0 0 0 100 100 26 2 0 19 7 1 0 0March 15, 2026 . . . . . . . . . . . . . . . . . 6 0 0 0 0 100 92 10 1 0 10 3 0 0 0March 15, 2027 . . . . . . . . . . . . . . . . . 0 0 0 0 0 0 0 0 0 0 0 0 0 0 0
Weighted AverageLife (Years) . . . . . . . . . . . . . . . . . . 8.3 6.1 3.6 2.6 2.1 14.8 14.4 12.2 9.0 7.0 8.5 6.4 3.9 2.8 2.3
S-40
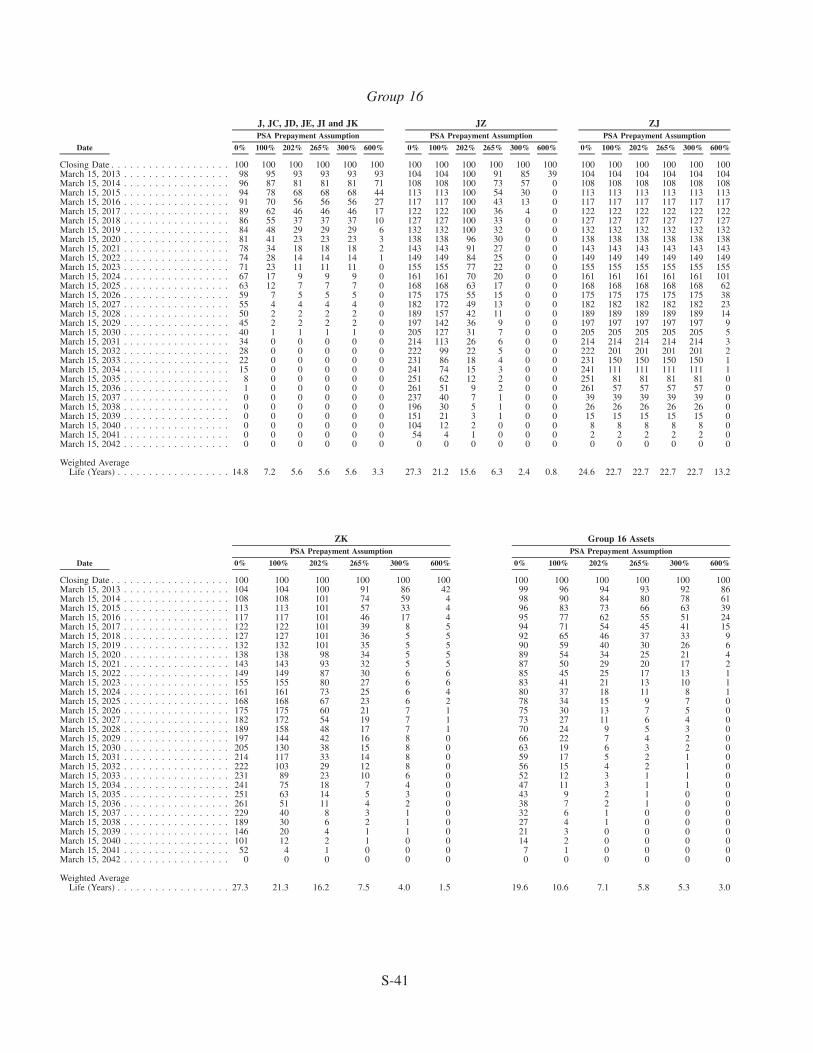
Group 16
Date 0% 100% 202% 265% 300% 600% 0% 100% 202% 265% 300% 600% 0% 100% 202% 265% 300% 600%
PSA Prepayment AssumptionPSA Prepayment AssumptionPSA Prepayment Assumption
ZJJZJ, JC, JD, JE, JI and JK
Closing Date . . . . . . . . . . . . . . . . . . . 100 100 100 100 100 100 100 100 100 100 100 100 100 100 100 100 100 100March 15, 2013 . . . . . . . . . . . . . . . . . 98 95 93 93 93 93 104 104 100 91 85 39 104 104 104 104 104 104March 15, 2014 . . . . . . . . . . . . . . . . . 96 87 81 81 81 71 108 108 100 73 57 0 108 108 108 108 108 108March 15, 2015 . . . . . . . . . . . . . . . . . 94 78 68 68 68 44 113 113 100 54 30 0 113 113 113 113 113 113March 15, 2016 . . . . . . . . . . . . . . . . . 91 70 56 56 56 27 117 117 100 43 13 0 117 117 117 117 117 117March 15, 2017 . . . . . . . . . . . . . . . . . 89 62 46 46 46 17 122 122 100 36 4 0 122 122 122 122 122 122March 15, 2018 . . . . . . . . . . . . . . . . . 86 55 37 37 37 10 127 127 100 33 0 0 127 127 127 127 127 127March 15, 2019 . . . . . . . . . . . . . . . . . 84 48 29 29 29 6 132 132 100 32 0 0 132 132 132 132 132 132March 15, 2020 . . . . . . . . . . . . . . . . . 81 41 23 23 23 3 138 138 96 30 0 0 138 138 138 138 138 138March 15, 2021 . . . . . . . . . . . . . . . . . 78 34 18 18 18 2 143 143 91 27 0 0 143 143 143 143 143 143March 15, 2022 . . . . . . . . . . . . . . . . . 74 28 14 14 14 1 149 149 84 25 0 0 149 149 149 149 149 149March 15, 2023 . . . . . . . . . . . . . . . . . 71 23 11 11 11 0 155 155 77 22 0 0 155 155 155 155 155 155March 15, 2024 . . . . . . . . . . . . . . . . . 67 17 9 9 9 0 161 161 70 20 0 0 161 161 161 161 161 101March 15, 2025 . . . . . . . . . . . . . . . . . 63 12 7 7 7 0 168 168 63 17 0 0 168 168 168 168 168 62March 15, 2026 . . . . . . . . . . . . . . . . . 59 7 5 5 5 0 175 175 55 15 0 0 175 175 175 175 175 38March 15, 2027 . . . . . . . . . . . . . . . . . 55 4 4 4 4 0 182 172 49 13 0 0 182 182 182 182 182 23March 15, 2028 . . . . . . . . . . . . . . . . . 50 2 2 2 2 0 189 157 42 11 0 0 189 189 189 189 189 14March 15, 2029 . . . . . . . . . . . . . . . . . 45 2 2 2 2 0 197 142 36 9 0 0 197 197 197 197 197 9March 15, 2030 . . . . . . . . . . . . . . . . . 40 1 1 1 1 0 205 127 31 7 0 0 205 205 205 205 205 5March 15, 2031 . . . . . . . . . . . . . . . . . 34 0 0 0 0 0 214 113 26 6 0 0 214 214 214 214 214 3March 15, 2032 . . . . . . . . . . . . . . . . . 28 0 0 0 0 0 222 99 22 5 0 0 222 201 201 201 201 2March 15, 2033 . . . . . . . . . . . . . . . . . 22 0 0 0 0 0 231 86 18 4 0 0 231 150 150 150 150 1March 15, 2034 . . . . . . . . . . . . . . . . . 15 0 0 0 0 0 241 74 15 3 0 0 241 111 111 111 111 1March 15, 2035 . . . . . . . . . . . . . . . . . 8 0 0 0 0 0 251 62 12 2 0 0 251 81 81 81 81 0March 15, 2036 . . . . . . . . . . . . . . . . . 1 0 0 0 0 0 261 51 9 2 0 0 261 57 57 57 57 0March 15, 2037 . . . . . . . . . . . . . . . . . 0 0 0 0 0 0 237 40 7 1 0 0 39 39 39 39 39 0March 15, 2038 . . . . . . . . . . . . . . . . . 0 0 0 0 0 0 196 30 5 1 0 0 26 26 26 26 26 0March 15, 2039 . . . . . . . . . . . . . . . . . 0 0 0 0 0 0 151 21 3 1 0 0 15 15 15 15 15 0March 15, 2040 . . . . . . . . . . . . . . . . . 0 0 0 0 0 0 104 12 2 0 0 0 8 8 8 8 8 0March 15, 2041 . . . . . . . . . . . . . . . . . 0 0 0 0 0 0 54 4 1 0 0 0 2 2 2 2 2 0March 15, 2042 . . . . . . . . . . . . . . . . . 0 0 0 0 0 0 0 0 0 0 0 0 0 0 0 0 0 0
Weighted AverageLife (Years) . . . . . . . . . . . . . . . . . . 14.8 7.2 5.6 5.6 5.6 3.3 27.3 21.2 15.6 6.3 2.4 0.8 24.6 22.7 22.7 22.7 22.7 13.2
Date 0% 100% 202% 265% 300% 600% 0% 100% 202% 265% 300% 600%
PSA Prepayment AssumptionPSA Prepayment Assumption
Group 16 AssetsZK
Closing Date . . . . . . . . . . . . . . . . . . . 100 100 100 100 100 100 100 100 100 100 100 100March 15, 2013 . . . . . . . . . . . . . . . . . 104 104 100 91 86 42 99 96 94 93 92 86March 15, 2014 . . . . . . . . . . . . . . . . . 108 108 101 74 59 4 98 90 84 80 78 61March 15, 2015 . . . . . . . . . . . . . . . . . 113 113 101 57 33 4 96 83 73 66 63 39March 15, 2016 . . . . . . . . . . . . . . . . . 117 117 101 46 17 4 95 77 62 55 51 24March 15, 2017 . . . . . . . . . . . . . . . . . 122 122 101 39 8 5 94 71 54 45 41 15March 15, 2018 . . . . . . . . . . . . . . . . . 127 127 101 36 5 5 92 65 46 37 33 9March 15, 2019 . . . . . . . . . . . . . . . . . 132 132 101 35 5 5 90 59 40 30 26 6March 15, 2020 . . . . . . . . . . . . . . . . . 138 138 98 34 5 5 89 54 34 25 21 4March 15, 2021 . . . . . . . . . . . . . . . . . 143 143 93 32 5 5 87 50 29 20 17 2March 15, 2022 . . . . . . . . . . . . . . . . . 149 149 87 30 6 6 85 45 25 17 13 1March 15, 2023 . . . . . . . . . . . . . . . . . 155 155 80 27 6 6 83 41 21 13 10 1March 15, 2024 . . . . . . . . . . . . . . . . . 161 161 73 25 6 4 80 37 18 11 8 1March 15, 2025 . . . . . . . . . . . . . . . . . 168 168 67 23 6 2 78 34 15 9 7 0March 15, 2026 . . . . . . . . . . . . . . . . . 175 175 60 21 7 1 75 30 13 7 5 0March 15, 2027 . . . . . . . . . . . . . . . . . 182 172 54 19 7 1 73 27 11 6 4 0March 15, 2028 . . . . . . . . . . . . . . . . . 189 158 48 17 7 1 70 24 9 5 3 0March 15, 2029 . . . . . . . . . . . . . . . . . 197 144 42 16 8 0 66 22 7 4 2 0March 15, 2030 . . . . . . . . . . . . . . . . . 205 130 38 15 8 0 63 19 6 3 2 0March 15, 2031 . . . . . . . . . . . . . . . . . 214 117 33 14 8 0 59 17 5 2 1 0March 15, 2032 . . . . . . . . . . . . . . . . . 222 103 29 12 8 0 56 15 4 2 1 0March 15, 2033 . . . . . . . . . . . . . . . . . 231 89 23 10 6 0 52 12 3 1 1 0March 15, 2034 . . . . . . . . . . . . . . . . . 241 75 18 7 4 0 47 11 3 1 1 0March 15, 2035 . . . . . . . . . . . . . . . . . 251 63 14 5 3 0 43 9 2 1 0 0March 15, 2036 . . . . . . . . . . . . . . . . . 261 51 11 4 2 0 38 7 2 1 0 0March 15, 2037 . . . . . . . . . . . . . . . . . 229 40 8 3 1 0 32 6 1 0 0 0March 15, 2038 . . . . . . . . . . . . . . . . . 189 30 6 2 1 0 27 4 1 0 0 0March 15, 2039 . . . . . . . . . . . . . . . . . 146 20 4 1 1 0 21 3 0 0 0 0March 15, 2040 . . . . . . . . . . . . . . . . . 101 12 2 1 0 0 14 2 0 0 0 0March 15, 2041 . . . . . . . . . . . . . . . . . 52 4 1 0 0 0 7 1 0 0 0 0March 15, 2042 . . . . . . . . . . . . . . . . . 0 0 0 0 0 0 0 0 0 0 0 0
Weighted AverageLife (Years) . . . . . . . . . . . . . . . . . . 27.3 21.3 16.2 7.5 4.0 1.5 19.6 10.6 7.1 5.8 5.3 3.0
S-41
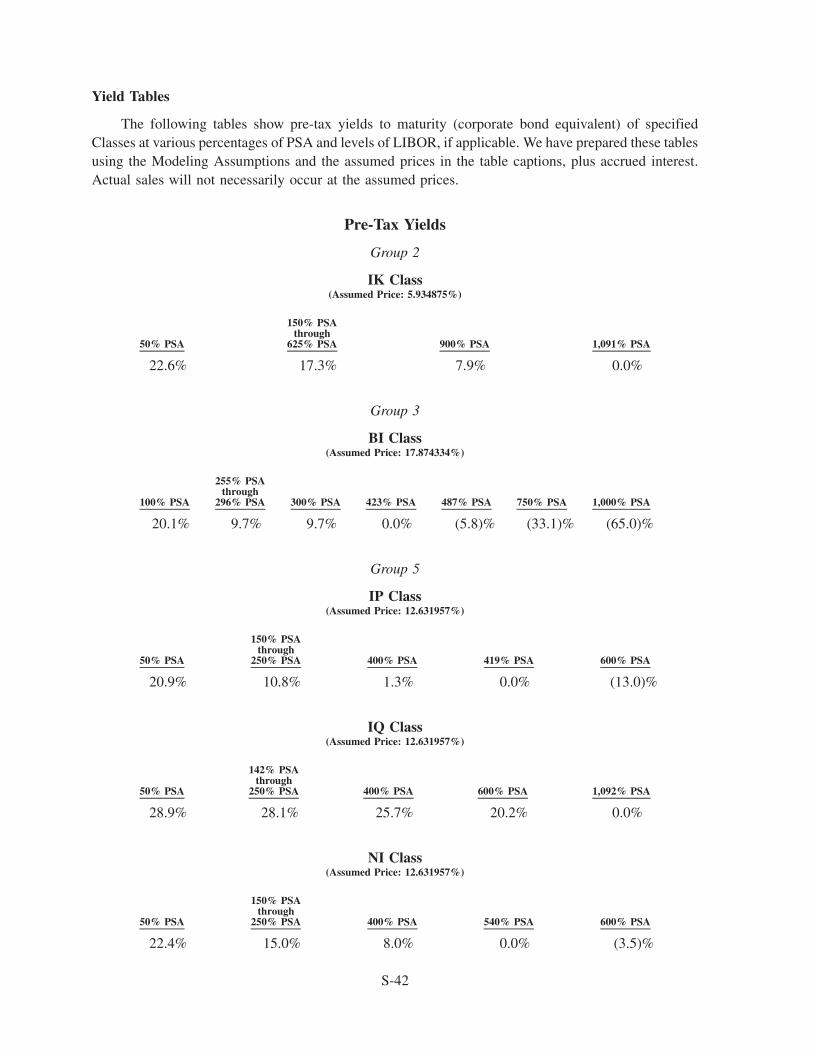
Yield Tables
The following tables show pre-tax yields to maturity (corporate bond equivalent) of specifiedClasses at various percentages of PSA and levels of LIBOR, if applicable. We have prepared these tablesusing the Modeling Assumptions and the assumed prices in the table captions, plus accrued interest.Actual sales will not necessarily occur at the assumed prices.
Pre-Tax Yields
Group 2
IK Class(Assumed Price: 5.934875%)
50% PSA
150% PSAthrough
625% PSA 900% PSA 1,091% PSA
22.6% 17.3% 7.9% 0.0%
Group 3
BI Class(Assumed Price: 17.874334%)
100% PSA
255% PSAthrough
296% PSA 300% PSA 423% PSA 487% PSA 750% PSA 1,000% PSA
20.1% 9.7% 9.7% 0.0% (5.8)% (33.1)% (65.0)%
Group 5
IP Class(Assumed Price: 12.631957%)
50% PSA
150% PSAthrough
250% PSA 400% PSA 419% PSA 600% PSA
20.9% 10.8% 1.3% 0.0% (13.0)%
IQ Class(Assumed Price: 12.631957%)
50% PSA
142% PSAthrough
250% PSA 400% PSA 600% PSA 1,092% PSA
28.9% 28.1% 25.7% 20.2% 0.0%
NI Class(Assumed Price: 12.631957%)
50% PSA
150% PSAthrough
250% PSA 400% PSA 540% PSA 600% PSA
22.4% 15.0% 8.0% 0.0% (3.5)%
S-42
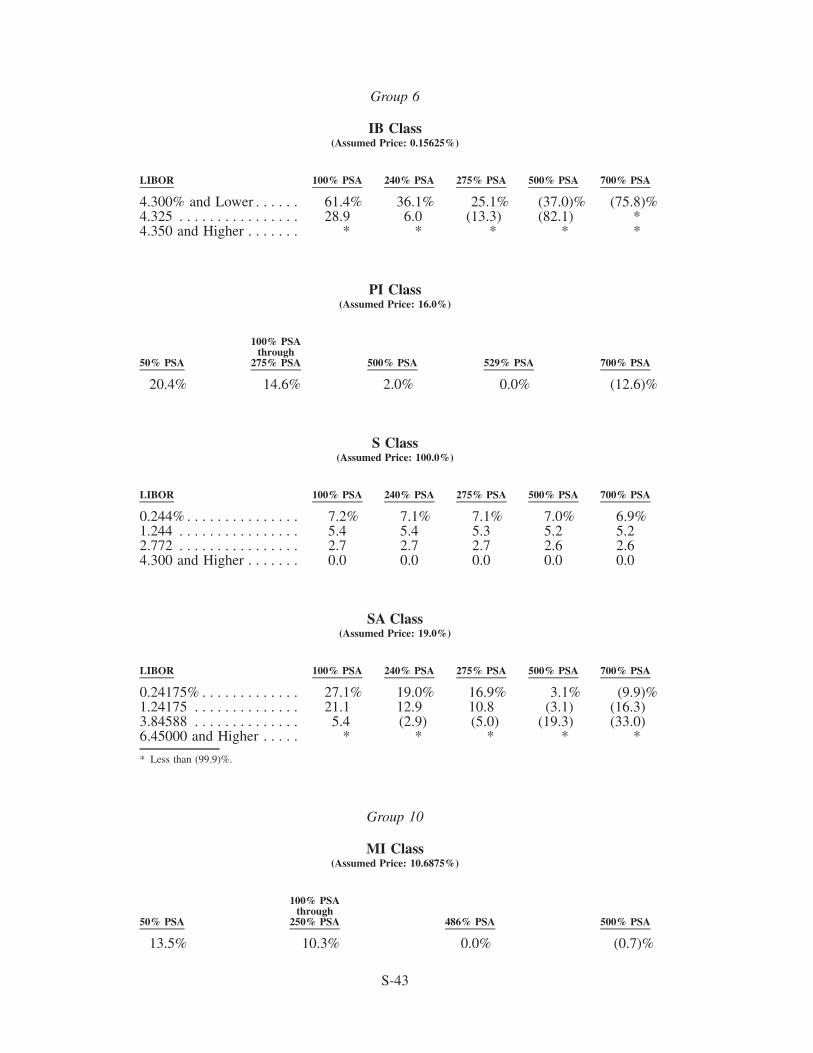
Group 6
IB Class(Assumed Price: 0.15625%)
LIBOR 100% PSA 240% PSA 275% PSA 500% PSA 700% PSA
4.300% and Lower . . . . . . 61.4% 36.1% 25.1% (37.0)% (75.8)%4.325 . . . . . . . . . . . . . . . . 28.9 6.0 (13.3) (82.1) *4.350 and Higher . . . . . . . * * * * *
PI Class(Assumed Price: 16.0%)
50% PSA
100% PSAthrough
275% PSA 500% PSA 529% PSA 700% PSA
20.4% 14.6% 2.0% 0.0% (12.6)%
S Class(Assumed Price: 100.0%)
LIBOR 100% PSA 240% PSA 275% PSA 500% PSA 700% PSA
0.244% . . . . . . . . . . . . . . . 7.2% 7.1% 7.1% 7.0% 6.9%1.244 . . . . . . . . . . . . . . . . 5.4 5.4 5.3 5.2 5.22.772 . . . . . . . . . . . . . . . . 2.7 2.7 2.7 2.6 2.64.300 and Higher . . . . . . . 0.0 0.0 0.0 0.0 0.0
SA Class(Assumed Price: 19.0%)
LIBOR 100% PSA 240% PSA 275% PSA 500% PSA 700% PSA
0.24175% . . . . . . . . . . . . . 27.1% 19.0% 16.9% 3.1% (9.9)%1.24175 . . . . . . . . . . . . . . 21.1 12.9 10.8 (3.1) (16.3)3.84588 . . . . . . . . . . . . . . 5.4 (2.9) (5.0) (19.3) (33.0)6.45000 and Higher . . . . . * * * * *
* Less than (99.9)%.
Group 10
MI Class(Assumed Price: 10.6875%)
50% PSA
100% PSAthrough
250% PSA 486% PSA 500% PSA
13.5% 10.3% 0.0% (0.7)%
S-43
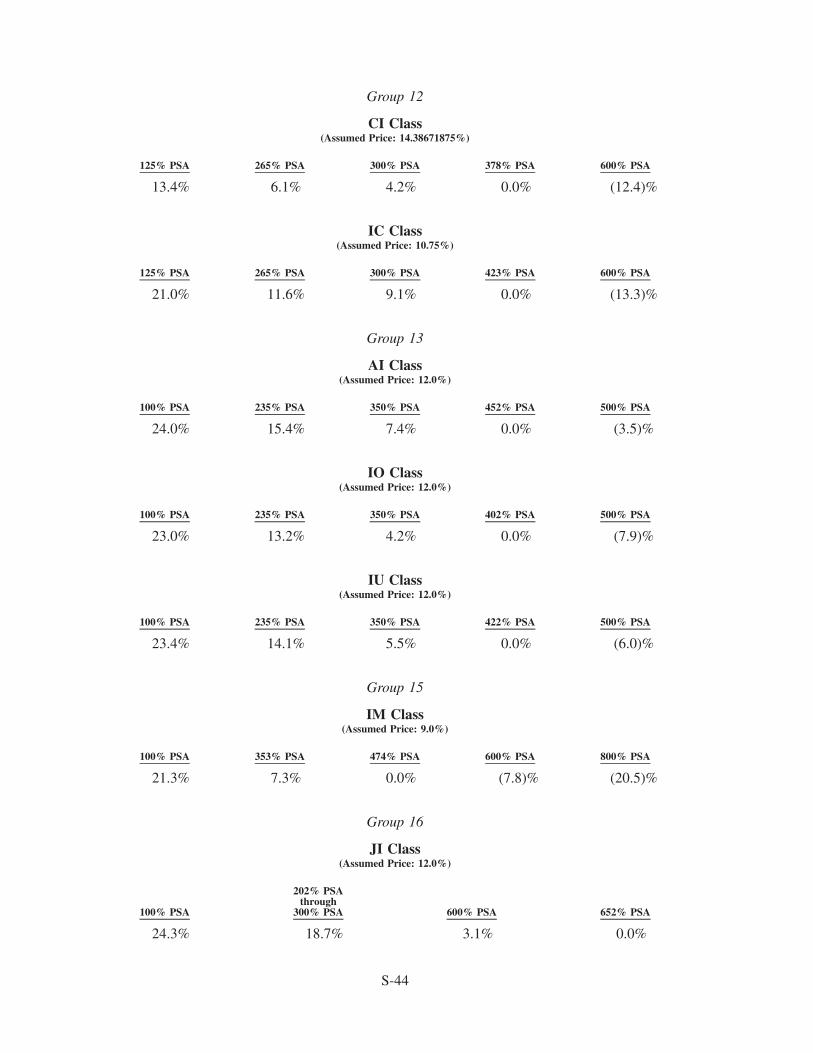
Group 12
CI Class(Assumed Price: 14.38671875%)
125% PSA 265% PSA 300% PSA 378% PSA 600% PSA
13.4% 6.1% 4.2% 0.0% (12.4)%
IC Class(Assumed Price: 10.75%)
125% PSA 265% PSA 300% PSA 423% PSA 600% PSA
21.0% 11.6% 9.1% 0.0% (13.3)%
Group 13
AI Class(Assumed Price: 12.0%)
100% PSA 235% PSA 350% PSA 452% PSA 500% PSA
24.0% 15.4% 7.4% 0.0% (3.5)%
IO Class(Assumed Price: 12.0%)
100% PSA 235% PSA 350% PSA 402% PSA 500% PSA
23.0% 13.2% 4.2% 0.0% (7.9)%
IU Class(Assumed Price: 12.0%)
100% PSA 235% PSA 350% PSA 422% PSA 500% PSA
23.4% 14.1% 5.5% 0.0% (6.0)%
Group 15
IM Class(Assumed Price: 9.0%)
100% PSA 353% PSA 474% PSA 600% PSA 800% PSA
21.3% 7.3% 0.0% (7.8)% (20.5)%
Group 16
JI Class(Assumed Price: 12.0%)
100% PSA
202% PSAthrough
300% PSA 600% PSA 652% PSA
24.3% 18.7% 3.1% 0.0%
S-44
FINAL PAYMENT DATES
The Final Payment Date for each Class is the latest date by which it will be paid in full and willretire. We calculate Final Payment Dates using highly conservative assumptions. The actual retirement ofeach Class may occur earlier than its Final Payment Date.
CERTAIN FEDERAL INCOME TAX CONSEQUENCES
General
Any discussion of tax matters herein and in the Offering Circular was not intended or written to beused, and cannot be used, by any person for the purpose of avoiding tax penalties that may be imposed onsuch person. Such discussion was written to support the promotion and marketing of the Certificates.Investors should consult their own independent tax advisors regarding the Certificates and each investor’sparticular circumstances.
Subject to the assumptions described under Certain Federal Income Tax Consequences — REMICElection in the Offering Circular, the Upper-Tier REMIC Pool and the Lower-Tier REMIC Pool will eachqualify as a REMIC for federal income tax purposes.
Regular Classes
The Regular Classes are “regular interests” in the Upper-Tier REMIC Pool. See General Informa-tion — Structure of Transaction. They are treated as debt instruments for federal income tax purposes andmay be issued with original issue discount (“OID”) or at a premium. Based in part on (a) the level ofLIBOR on the date of this Supplement and (b) information provided by the Underwriter regarding theinitial prices at which it would have expected to sell or will sell substantial portions of the RegularClasses, we expect to report income to the Internal Revenue Service and to Holders of the RegularClasses assuming they are issued as follows:
• OID: AI, BI, BM, CA, CI, CK, CQ, DU, DW, IB, IC, IK, IO, JZ, KZ, MI, PI, SA, ZA, ZB,ZD, ZE, ZG, ZH and ZJ.
• De Minimis OID: AB, BB, CC, CY, DD, EE, GL, MC, ML, NE, NH, NJ, NK, PL and S.
• Premium: AA, AL, BA, BD, BL, CJ, CP, CW, DA, DB, DC, DG, FB, GB, GG, J, KE, KM,M, MP, NB, NP, NQ and PA.
OID generally results in recognition of taxable income in advance of the receipt of cash attributableto that income. The Pricing Speeds used for OID and premium calculations are:
• Group 1 — 426% PSA
• Groups 2 and 4 — 250% PSA
• Group 3 — 487% PSA
• Group 5 — 200% PSA
• Group 6 — 240% PSA
• Groups 7 and 8 — 349% PSA
• Group 9 — 170% PSA
S-45
• Group 10 — 215% PSA
• Group 11 — 205% PSA
• Groups 12 and 16 — 265% PSA
• Group 13 — 235% PSA
• Group 14 — 428% PSA
• Group 15 — 353% PSA
See Certain Federal Income Tax Consequences — Taxation of Regular Classes — Original Issue Dis-count and — Premium in the Offering Circular. Mortgage prepayment rates will differ, perhaps signif-icantly, from the Pricing Speeds shown above.
As set forth above, we intend to report income with respect to BI assuming that Class is issued withOID. You should be aware, however, that the yield to maturity of BI, based on its Pricing Speed, isnegative. See Certain Federal Income Tax Consequences — Taxation of Regular Classes — NegativeYield in the Offering Circular.
The Group 13 Assets are backed by High LTV Mortgages and no separate REMIC election has beenmade for these Assets. Special tax considerations may apply to a real estate investment trust (“REIT”)that holds Regular Classes backed by High LTV Mortgages. Because the Assets backed by High LTVMortgages are not in a separate REMIC Pool, these special tax considerations may apply to a REIT thatholds any of the Regular Classes. Accordingly, we may be obligated to provide additional information,pursuant to regulations under Code Section 6049, on such Regular Classes. See Certain Federal IncomeTax Consequences — Status of REMIC Certificates in the Offering Circular.
Residual Classes
Each Residual Class is the “residual interest” in its related REMIC Pool. See General Informa-tion — Structure of Transaction. Special tax considerations apply to the Residual Classes. The taxation ofthe Residual Classes can produce a significantly less favorable after-tax return than if (a) the ResidualClasses were taxable as debt instruments or (b) no portion of the taxable income on the Residual Classeswere treated as “excess inclusions.” In certain periods, taxable income and the resulting tax liability on aResidual Class may exceed any payments on that Class. See Certain Federal Income Tax Consequen-ces — Taxation of Residual Classes in the Offering Circular.
A substantial tax may be imposed on certain transferors of a Residual Class and certain beneficialowners of a Residual Class that are “pass-through entities.” See Certain Federal Income Tax Con-sequences — Transfers of Interests in a Residual Class — Disqualified Organizations in the OfferingCircular. You should not purchase a Residual Class before consulting your tax advisor.
We intend to report accruals of OID and market discount and to amortize premium with respect tothe Multiclass Assets using the applicable Pricing Speeds shown above, regardless of the Pricing Speedsused in their Series.
Certain Transfers of Residual Classes
The REMIC Regulations disregard:
1. A transfer of a “noneconomic residual interest” unless no significant purpose of the transfer is toimpede the assessment or collection of tax.
S-46
2. Except in certain cases, a transfer of a residual interest to a foreign investor or a transfer of aresidual interest from a foreign investor to a U.S. investor. Accordingly, the Trust Agreementprohibits the transfer of an interest in a Residual Class to or from a foreign investor without ourwritten consent.
See Certain Federal Income Tax Consequences — Transfers of Interests in a Residual Class — Addi-tional Transfer Restrictions in the Offering Circular. In the case of a transfer that is disregarded, thetransferor would continue to be treated as the owner of the residual interest and thus would continue to besubject to tax on its allocable portion of the net income of the REMIC.
MACR Classes
The arrangement under which the MACR Classes are created (the “MACR Pool”) will be classifiedas a grantor trust under subpart E, part I of subchapter J of the Code. The interests in the Regular Classesthat have been exchanged for the MACR Classes, including any exchanges effective on the Closing Date,will be the assets of the MACR Pool and the MACR Classes will represent beneficial ownership of theseassets.
The Group 13 Assets are backed by High LTV Mortgages and no separate REMIC election has beenmade for these Assets. Special tax considerations may apply to a REIT that holds MACR Classes wherethe related REMIC Pool is backed by High LTV Mortgages. Because the Assets backed by High LTVMortgages are not in a separate REMIC Pool, these special tax considerations may apply to a REIT thatholds any of the MACR Classes. See Certain Federal Income Tax Consequences — Taxation of MACRClasses — Tax Status in the Offering Circular.
For a discussion of certain federal income tax consequences applicable to the MACR Classes, seeCertain Federal Income Tax Consequences — Taxation of MACR Classes, — Exchanges of MACRClasses and Regular Classes and — Taxation of Certain Foreign Investors in the Offering Circular.
ERISA CONSIDERATIONS
Fiduciaries of employee benefit plans should review ERISA Considerations in the Offering Circular.
ACCOUNTING CONSIDERATIONS
You should consult your accountant for advice on the appropriate accounting treatment for yourCertificates. See Accounting Considerations in the Offering Circular.
LEGAL INVESTMENT CONSIDERATIONS
You should consult your legal advisor to determine whether the Certificates are a legal investmentfor you and whether you can use the Certificates as collateral for borrowings. See Legal InvestmentConsiderations in the Offering Circular.
PLAN OF DISTRIBUTION
Under an agreement with the Underwriter, we have agreed to sell all of the REMIC Certificates tothe Underwriter in exchange for the Assets.
S-47

The Underwriter is offering the Certificates to the public in negotiated transactions at varying pricesto be determined at the time of sale, plus accrued interest on each interest-bearing Class from the first dayof its initial Accrual Period. The Underwriter is offering the Certificates subject to their issuance by usand subject to the Underwriter’s right to reject any order. The Underwriter may make sales to or throughsecurities dealers. The dealers may receive compensation in the form of discounts, concessions orcommissions from the Underwriter and commissions from any purchasers for which they act as agents.
The sales commission charged to a retail investor is likely to be a higher percentage of the sales pricethan the commission charged to an institutional investor in any Class.
Our agreement with the Underwriter provides that we will indemnify it against certain liabilities.
LEGAL MATTERS
Our General Counsel or one of our Deputy General Counsels will render an opinion on the legalityof the Certificates. Cleary Gottlieb Steen & Hamilton LLP is representing the Underwriter on legalmatters concerning the Certificates.
S-48
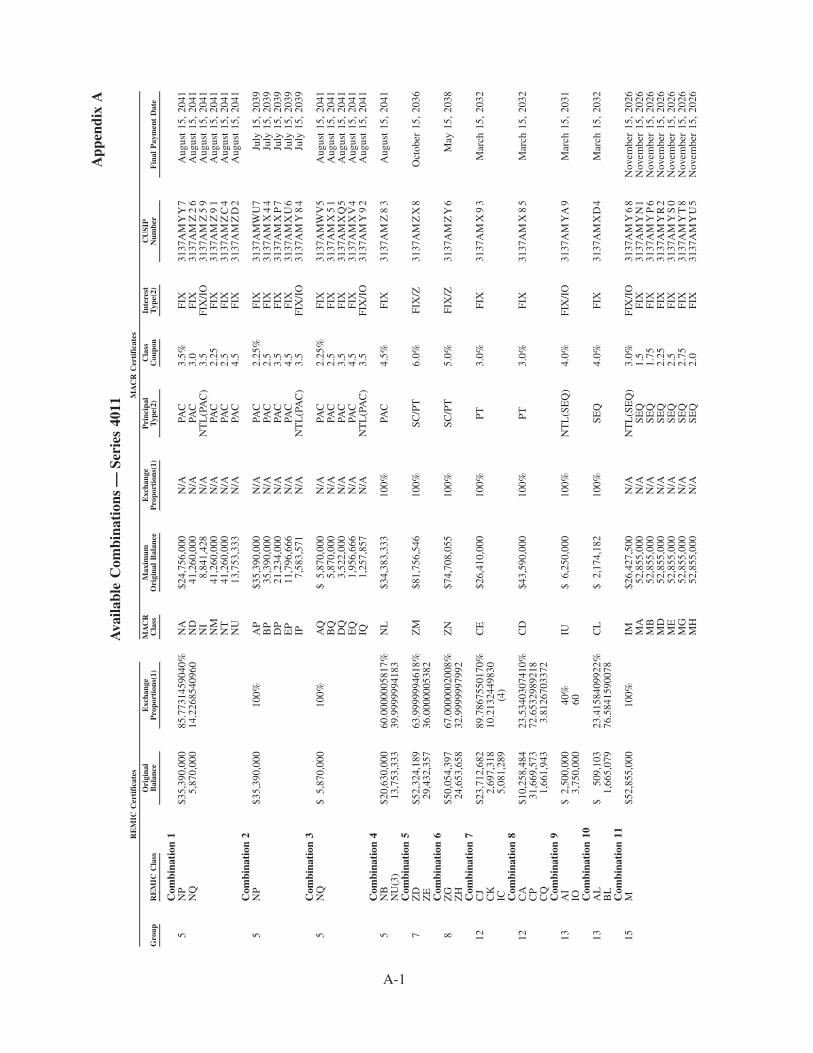
App
endi
xA
Ava
ilabl
eC
ombi
nati
ons
—Se
ries
4011
Gro
upR
EM
ICC
lass
Ori
gina
lB
alan
ceE
xcha
nge
Pro
port
ions
(1)
MA
CR
Cla
ssM
axim
umO
rigi
nal
Bal
ance
Exc
hang
eP
ropo
rtio
ns(1
)P
rinc
ipal
Typ
e(2)
Cla
ssC
oupo
nIn
tere
stT
ype(
2)C
USI
PN
umbe
rF
inal
Pay
men
tD
ate
RE
MIC
Cer
tifi
cate
sM
AC
RC
erti
fica
tes
Com
bina
tion
15
NP
$35,
390,
000
85.7
7314
5904
0%N
A$2
4,75
6,00
0N
/APA
C3.
5%FI
X31
37A
MY
Y7
Aug
ust
15,
2041
NQ
5,87
0,00
014
.226
8540
960
ND
41,2
60,0
00N
/APA
C3.
0FI
X31
37A
MZ
26
Aug
ust
15,
2041
NI
8,84
1,42
8N
/AN
TL
(PA
C)
3.5
FIX
/IO
3137
AM
Z5
9A
ugus
t15
,20
41N
M41
,260
,000
N/A
PAC
2.25
FIX
3137
AM
Z9
1A
ugus
t15
,20
41N
T41
,260
,000
N/A
PAC
2.5
FIX
3137
AM
ZC
4A
ugus
t15
,20
41N
U13
,753
,333
N/A
PAC
4.5
FIX
3137
AM
ZD
2A
ugus
t15
,20
41C
ombi
nati
on2
5N
P$3
5,39
0,00
010
0%A
P$3
5,39
0,00
0N
/APA
C2.
25%
FIX
3137
AM
WU
7Ju
ly15
,20
39B
P35
,390
,000
N/A
PAC
2.5
FIX
3137
AM
X4
4Ju
ly15
,20
39D
P21
,234
,000
N/A
PAC
3.5
FIX
3137
AM
XP
7Ju
ly15
,20
39E
P11
,796
,666
N/A
PAC
4.5
FIX
3137
AM
XU
6Ju
ly15
,20
39IP
7,58
3,57
1N
/AN
TL
(PA
C)
3.5
FIX
/IO
3137
AM
Y8
4Ju
ly15
,20
39C
ombi
nati
on3
5N
Q$
5,87
0,00
010
0%A
Q$
5,87
0,00
0N
/APA
C2.
25%
FIX
3137
AM
WV
5A
ugus
t15
,20
41B
Q5,
870,
000
N/A
PAC
2.5
FIX
3137
AM
X5
1A
ugus
t15
,20
41D
Q3,
522,
000
N/A
PAC
3.5
FIX
3137
AM
XQ
5A
ugus
t15
,20
41E
Q1,
956,
666
N/A
PAC
4.5
FIX
3137
AM
XV
4A
ugus
t15
,20
41IQ
1,25
7,85
7N
/AN
TL
(PA
C)
3.5
FIX
/IO
3137
AM
Y9
2A
ugus
t15
,20
41C
ombi
nati
on4
5N
B$2
0,63
0,00
060
.000
0005
817%
NL
$34,
383,
333
100%
PAC
4.5%
FIX
3137
AM
Z8
3A
ugus
t15
,20
41N
U(3
)13
,753
,333
39.9
9999
9418
3C
ombi
nati
on5
7Z
D$5
2,32
4,18
963
.999
9994
618%
ZM
$81,
756,
546
100%
SC/P
T6.
0%FI
X/Z
3137
AM
ZX
8O
ctob
er15
,20
36Z
E29
,432
,357
36.0
0000
0538
2C
ombi
nati
on6
8Z
G$5
0,05
4,39
767
.000
0002
008%
ZN
$74,
708,
055
100%
SC/P
T5.
0%FI
X/Z
3137
AM
ZY
6M
ay15
,20
38Z
H24
,653
,658
32.9
9999
9799
2C
ombi
nati
on7
12C
J$2
3,71
2,68
289
.786
7550
170%
CE
$26,
410,
000
100%
PT3.
0%FI
X31
37A
MX
93
Mar
ch15
,20
32C
K2,
697,
318
10.2
1324
4983
0IC
5,08
1,28
9(4
)C
ombi
nati
on8
12C
A$1
0,25
8,48
423
.534
0307
410%
CD
$43,
590,
000
100%
PT3.
0%FI
X31
37A
MX
85
Mar
ch15
,20
32C
P31
,669
,573
72.6
5329
8921
8C
Q1,
661,
943
3.81
2670
3372
Com
bina
tion
913
AI
$2,
500,
000
40%
IU$
6,25
0,00
010
0%N
TL
(SE
Q)
4.0%
FIX
/IO
3137
AM
YA
9M
arch
15,
2031
IO3,
750,
000
60C
ombi
nati
on10
13A
L$
509,
103
23.4
1584
0992
2%C
L$
2,17
4,18
210
0%SE
Q4.
0%FI
X31
37A
MX
D4
Mar
ch15
,20
32B
L1,
665,
079
76.5
8415
9007
8C
ombi
nati
on11
15M
$52,
855,
000
100%
IM$2
6,42
7,50
0N
/AN
TL
(SE
Q)
3.0%
FIX
/IO
3137
AM
Y6
8N
ovem
ber
15,
2026
MA
52,8
55,0
00N
/ASE
Q1.
5FI
X31
37A
MY
N1
Nov
embe
r15
,20
26M
B52
,855
,000
N/A
SEQ
1.75
FIX
3137
AM
YP
6N
ovem
ber
15,
2026
MD
52,8
55,0
00N
/ASE
Q2.
25FI
X31
37A
MY
R2
Nov
embe
r15
,20
26M
E52
,855
,000
N/A
SEQ
2.5
FIX
3137
AM
YS
0N
ovem
ber
15,
2026
MG
52,8
55,0
00N
/ASE
Q2.
75FI
X31
37A
MY
T8
Nov
embe
r15
,20
26M
H52
,855
,000
N/A
SEQ
2.0
FIX
3137
AM
YU
5N
ovem
ber
15,
2026
A-1
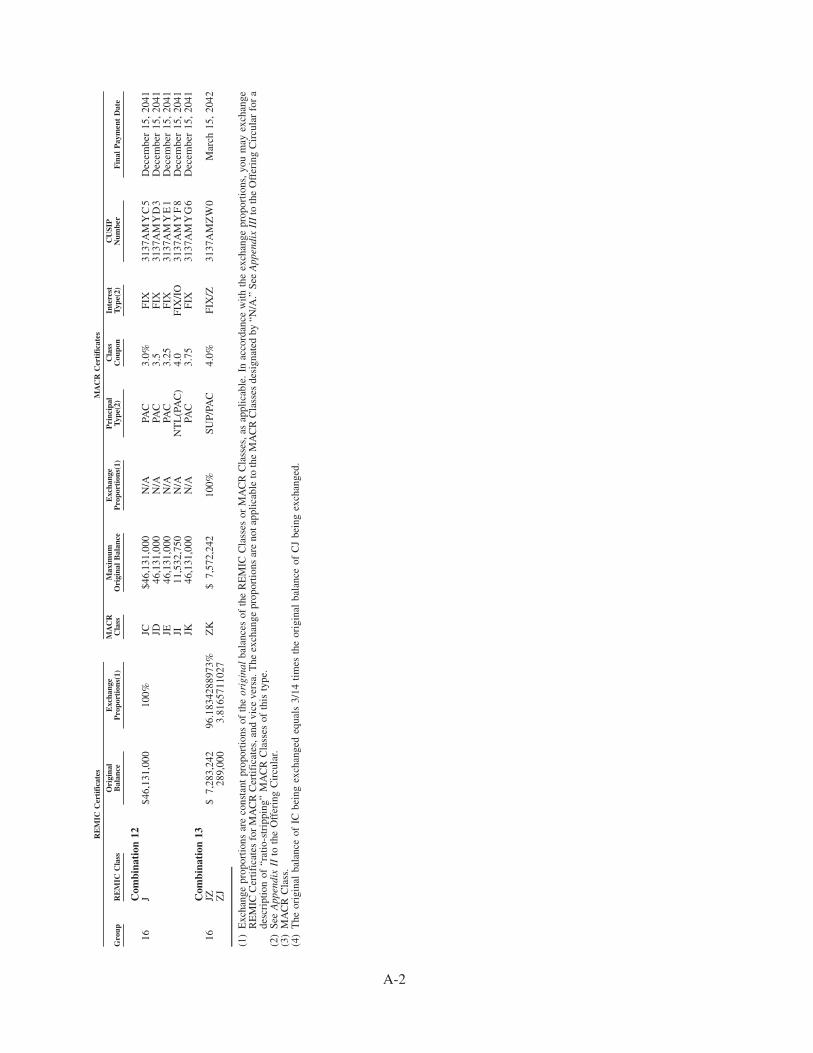
Gro
upR
EM
ICC
lass
Ori
gina
lB
alan
ceE
xcha
nge
Pro
port
ions
(1)
MA
CR
Cla
ssM
axim
umO
rigi
nal
Bal
ance
Exc
hang
eP
ropo
rtio
ns(1
)P
rinc
ipal
Typ
e(2)
Cla
ssC
oupo
nIn
tere
stT
ype(
2)C
USI
PN
umbe
rF
inal
Pay
men
tD
ate
RE
MIC
Cer
tifi
cate
sM
AC
RC
erti
fica
tes
Com
bina
tion
1216
J$4
6,13
1,00
010
0%JC
$46,
131,
000
N/A
PAC
3.0%
FIX
3137
AM
YC
5D
ecem
ber
15,
2041
JD46
,131
,000
N/A
PAC
3.5
FIX
3137
AM
YD
3D
ecem
ber
15,
2041
JE46
,131
,000
N/A
PAC
3.25
FIX
3137
AM
YE
1D
ecem
ber
15,
2041
JI11
,532
,750
N/A
NT
L(P
AC
)4.
0FI
X/I
O31
37A
MY
F8
Dec
embe
r15
,20
41JK
46,1
31,0
00N
/APA
C3.
75FI
X31
37A
MY
G6
Dec
embe
r15
,20
41C
ombi
nati
on13
16JZ
$7,
283,
242
96.1
8342
8897
3%Z
K$
7,57
2,24
210
0%SU
P/PA
C4.
0%FI
X/Z
3137
AM
ZW
0M
arch
15,
2042
ZJ
289,
000
3.81
6571
1027
(1)
Exc
hang
epr
opor
tions
are
cons
tant
prop
ortio
nsof
the
orig
inal
bala
nces
ofth
eR
EM
ICC
lass
esor
MA
CR
Cla
sses
,as
appl
icab
le.
Inac
cord
ance
with
the
exch
ange
prop
ortio
ns,y
oum
ayex
chan
geR
EM
ICC
ertif
icat
esfo
rM
AC
RC
ertif
icat
es,a
ndvi
ceve
rsa.
The
exch
ange
prop
ortio
nsar
eno
tapp
licab
leto
the
MA
CR
Cla
sses
desi
gnat
edby
“N/A
.”Se
eA
ppen
dix
III
toth
eO
ffer
ing
Cir
cula
rfo
ra
desc
ript
ion
of“r
atio
-str
ippi
ng”
MA
CR
Cla
sses
ofth
isty
pe.
(2)
See
App
endi
xII
toth
eO
ffer
ing
Cir
cula
r.(3
)M
AC
RC
lass
.(4
)T
heor
igin
alba
lanc
eof
ICbe
ing
exch
ange
deq
uals
3/14
times
the
orig
inal
bala
nce
ofC
Jbe
ing
exch
ange
d.
A-2
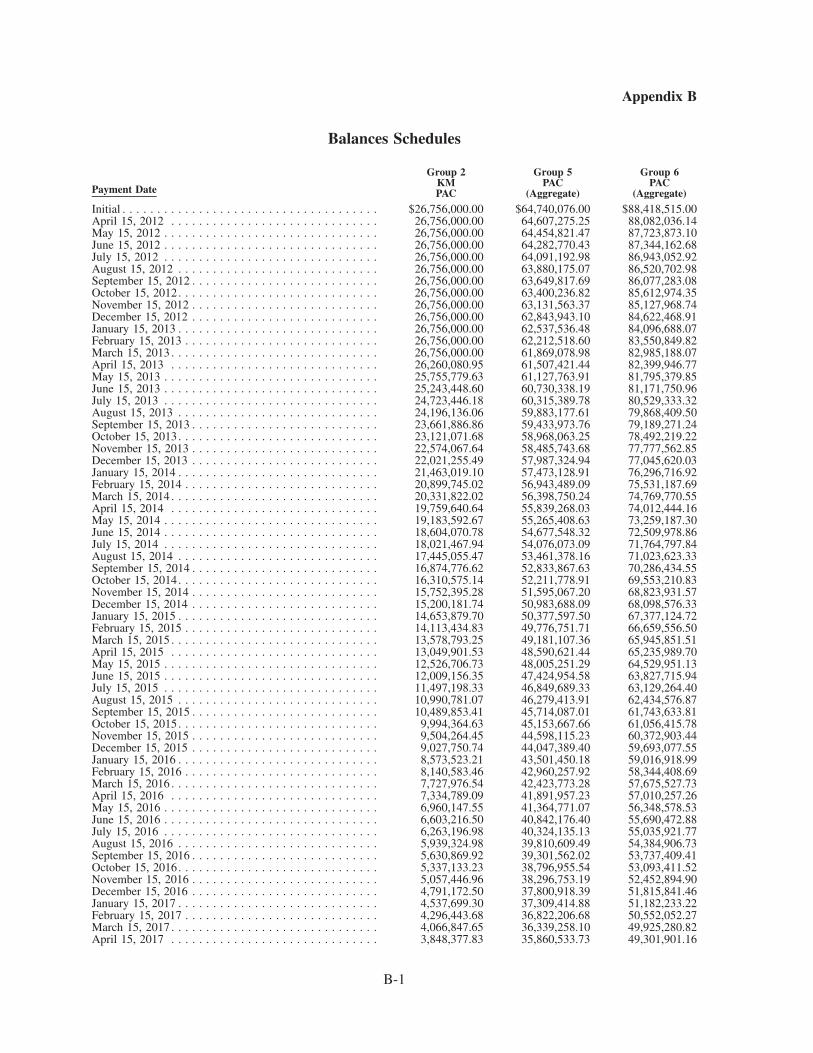
Appendix B
Balances Schedules
Payment Date
Group 2KMPAC
Group 5PAC
(Aggregate)
Group 6PAC
(Aggregate)
Initial . . . . . . . . . . . . . . . . . . . . . . . . . . . . . . . . . . . . . $26,756,000.00 $64,740,076.00 $88,418,515.00April 15, 2012 . . . . . . . . . . . . . . . . . . . . . . . . . . . . . . 26,756,000.00 64,607,275.25 88,082,036.14May 15, 2012 . . . . . . . . . . . . . . . . . . . . . . . . . . . . . . . 26,756,000.00 64,454,821.47 87,723,873.10June 15, 2012 . . . . . . . . . . . . . . . . . . . . . . . . . . . . . . . 26,756,000.00 64,282,770.43 87,344,162.68July 15, 2012 . . . . . . . . . . . . . . . . . . . . . . . . . . . . . . . 26,756,000.00 64,091,192.98 86,943,052.92August 15, 2012 . . . . . . . . . . . . . . . . . . . . . . . . . . . . . 26,756,000.00 63,880,175.07 86,520,702.98September 15, 2012 . . . . . . . . . . . . . . . . . . . . . . . . . . . 26,756,000.00 63,649,817.69 86,077,283.08October 15, 2012. . . . . . . . . . . . . . . . . . . . . . . . . . . . . 26,756,000.00 63,400,236.82 85,612,974.35November 15, 2012 . . . . . . . . . . . . . . . . . . . . . . . . . . . 26,756,000.00 63,131,563.37 85,127,968.74December 15, 2012 . . . . . . . . . . . . . . . . . . . . . . . . . . . 26,756,000.00 62,843,943.10 84,622,468.91January 15, 2013 . . . . . . . . . . . . . . . . . . . . . . . . . . . . . 26,756,000.00 62,537,536.48 84,096,688.07February 15, 2013 . . . . . . . . . . . . . . . . . . . . . . . . . . . . 26,756,000.00 62,212,518.60 83,550,849.82March 15, 2013 . . . . . . . . . . . . . . . . . . . . . . . . . . . . . . 26,756,000.00 61,869,078.98 82,985,188.07April 15, 2013 . . . . . . . . . . . . . . . . . . . . . . . . . . . . . . 26,260,080.95 61,507,421.44 82,399,946.77May 15, 2013 . . . . . . . . . . . . . . . . . . . . . . . . . . . . . . . 25,755,779.63 61,127,763.91 81,795,379.85June 15, 2013 . . . . . . . . . . . . . . . . . . . . . . . . . . . . . . . 25,243,448.60 60,730,338.19 81,171,750.96July 15, 2013 . . . . . . . . . . . . . . . . . . . . . . . . . . . . . . . 24,723,446.18 60,315,389.78 80,529,333.32August 15, 2013 . . . . . . . . . . . . . . . . . . . . . . . . . . . . . 24,196,136.06 59,883,177.61 79,868,409.50September 15, 2013 . . . . . . . . . . . . . . . . . . . . . . . . . . . 23,661,886.86 59,433,973.76 79,189,271.24October 15, 2013. . . . . . . . . . . . . . . . . . . . . . . . . . . . . 23,121,071.68 58,968,063.25 78,492,219.22November 15, 2013 . . . . . . . . . . . . . . . . . . . . . . . . . . . 22,574,067.64 58,485,743.68 77,777,562.85December 15, 2013 . . . . . . . . . . . . . . . . . . . . . . . . . . . 22,021,255.49 57,987,324.94 77,045,620.03January 15, 2014 . . . . . . . . . . . . . . . . . . . . . . . . . . . . . 21,463,019.10 57,473,128.91 76,296,716.92February 15, 2014 . . . . . . . . . . . . . . . . . . . . . . . . . . . . 20,899,745.02 56,943,489.09 75,531,187.69March 15, 2014 . . . . . . . . . . . . . . . . . . . . . . . . . . . . . . 20,331,822.02 56,398,750.24 74,769,770.55April 15, 2014 . . . . . . . . . . . . . . . . . . . . . . . . . . . . . . 19,759,640.64 55,839,268.03 74,012,444.16May 15, 2014 . . . . . . . . . . . . . . . . . . . . . . . . . . . . . . . 19,183,592.67 55,265,408.63 73,259,187.30June 15, 2014 . . . . . . . . . . . . . . . . . . . . . . . . . . . . . . . 18,604,070.78 54,677,548.32 72,509,978.86July 15, 2014 . . . . . . . . . . . . . . . . . . . . . . . . . . . . . . . 18,021,467.94 54,076,073.09 71,764,797.84August 15, 2014 . . . . . . . . . . . . . . . . . . . . . . . . . . . . . 17,445,055.47 53,461,378.16 71,023,623.33September 15, 2014 . . . . . . . . . . . . . . . . . . . . . . . . . . . 16,874,776.62 52,833,867.63 70,286,434.55October 15, 2014. . . . . . . . . . . . . . . . . . . . . . . . . . . . . 16,310,575.14 52,211,778.91 69,553,210.83November 15, 2014 . . . . . . . . . . . . . . . . . . . . . . . . . . . 15,752,395.28 51,595,067.20 68,823,931.57December 15, 2014 . . . . . . . . . . . . . . . . . . . . . . . . . . . 15,200,181.74 50,983,688.09 68,098,576.33January 15, 2015 . . . . . . . . . . . . . . . . . . . . . . . . . . . . . 14,653,879.70 50,377,597.50 67,377,124.72February 15, 2015 . . . . . . . . . . . . . . . . . . . . . . . . . . . . 14,113,434.83 49,776,751.71 66,659,556.50March 15, 2015 . . . . . . . . . . . . . . . . . . . . . . . . . . . . . . 13,578,793.25 49,181,107.36 65,945,851.51April 15, 2015 . . . . . . . . . . . . . . . . . . . . . . . . . . . . . . 13,049,901.53 48,590,621.44 65,235,989.70May 15, 2015 . . . . . . . . . . . . . . . . . . . . . . . . . . . . . . . 12,526,706.73 48,005,251.29 64,529,951.13June 15, 2015 . . . . . . . . . . . . . . . . . . . . . . . . . . . . . . . 12,009,156.35 47,424,954.58 63,827,715.94July 15, 2015 . . . . . . . . . . . . . . . . . . . . . . . . . . . . . . . 11,497,198.33 46,849,689.33 63,129,264.40August 15, 2015 . . . . . . . . . . . . . . . . . . . . . . . . . . . . . 10,990,781.07 46,279,413.91 62,434,576.87September 15, 2015 . . . . . . . . . . . . . . . . . . . . . . . . . . . 10,489,853.41 45,714,087.01 61,743,633.81October 15, 2015. . . . . . . . . . . . . . . . . . . . . . . . . . . . . 9,994,364.63 45,153,667.66 61,056,415.78November 15, 2015 . . . . . . . . . . . . . . . . . . . . . . . . . . . 9,504,264.45 44,598,115.23 60,372,903.44December 15, 2015 . . . . . . . . . . . . . . . . . . . . . . . . . . . 9,027,750.74 44,047,389.40 59,693,077.55January 15, 2016 . . . . . . . . . . . . . . . . . . . . . . . . . . . . . 8,573,523.21 43,501,450.18 59,016,918.99February 15, 2016 . . . . . . . . . . . . . . . . . . . . . . . . . . . . 8,140,583.46 42,960,257.92 58,344,408.69March 15, 2016 . . . . . . . . . . . . . . . . . . . . . . . . . . . . . . 7,727,976.54 42,423,773.28 57,675,527.73April 15, 2016 . . . . . . . . . . . . . . . . . . . . . . . . . . . . . . 7,334,789.09 41,891,957.23 57,010,257.26May 15, 2016 . . . . . . . . . . . . . . . . . . . . . . . . . . . . . . . 6,960,147.55 41,364,771.07 56,348,578.53June 15, 2016 . . . . . . . . . . . . . . . . . . . . . . . . . . . . . . . 6,603,216.50 40,842,176.40 55,690,472.88July 15, 2016 . . . . . . . . . . . . . . . . . . . . . . . . . . . . . . . 6,263,196.98 40,324,135.13 55,035,921.77August 15, 2016 . . . . . . . . . . . . . . . . . . . . . . . . . . . . . 5,939,324.98 39,810,609.49 54,384,906.73September 15, 2016 . . . . . . . . . . . . . . . . . . . . . . . . . . . 5,630,869.92 39,301,562.02 53,737,409.41October 15, 2016. . . . . . . . . . . . . . . . . . . . . . . . . . . . . 5,337,133.23 38,796,955.54 53,093,411.52November 15, 2016 . . . . . . . . . . . . . . . . . . . . . . . . . . . 5,057,446.96 38,296,753.19 52,452,894.90December 15, 2016 . . . . . . . . . . . . . . . . . . . . . . . . . . . 4,791,172.50 37,800,918.39 51,815,841.46January 15, 2017 . . . . . . . . . . . . . . . . . . . . . . . . . . . . . 4,537,699.30 37,309,414.88 51,182,233.22February 15, 2017 . . . . . . . . . . . . . . . . . . . . . . . . . . . . 4,296,443.68 36,822,206.68 50,552,052.27March 15, 2017 . . . . . . . . . . . . . . . . . . . . . . . . . . . . . . 4,066,847.65 36,339,258.10 49,925,280.82April 15, 2017 . . . . . . . . . . . . . . . . . . . . . . . . . . . . . . 3,848,377.83 35,860,533.73 49,301,901.16
B-1
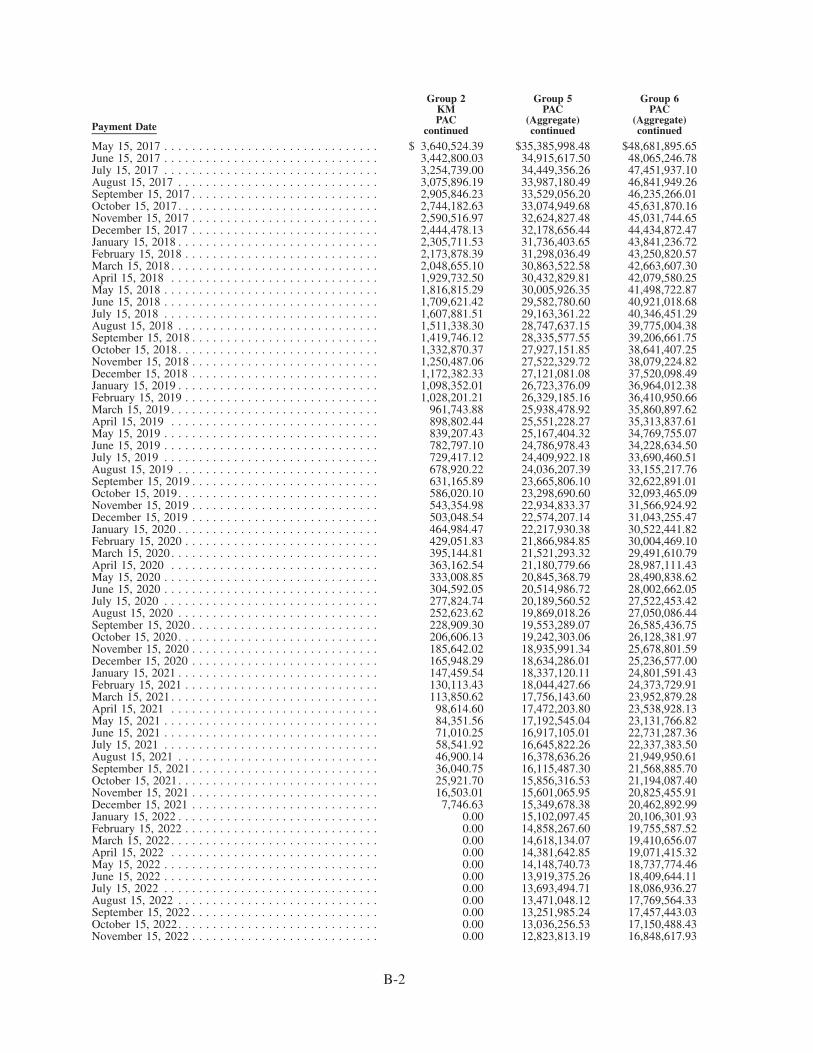
Payment Date
Group 2KMPAC
continued
Group 5PAC
(Aggregate)continued
Group 6PAC
(Aggregate)continued
May 15, 2017 . . . . . . . . . . . . . . . . . . . . . . . . . . . . . . . $ 3,640,524.39 $35,385,998.48 $48,681,895.65June 15, 2017 . . . . . . . . . . . . . . . . . . . . . . . . . . . . . . . 3,442,800.03 34,915,617.50 48,065,246.78July 15, 2017 . . . . . . . . . . . . . . . . . . . . . . . . . . . . . . . 3,254,739.00 34,449,356.26 47,451,937.10August 15, 2017 . . . . . . . . . . . . . . . . . . . . . . . . . . . . . 3,075,896.19 33,987,180.49 46,841,949.26September 15, 2017 . . . . . . . . . . . . . . . . . . . . . . . . . . . 2,905,846.23 33,529,056.20 46,235,266.01October 15, 2017. . . . . . . . . . . . . . . . . . . . . . . . . . . . . 2,744,182.63 33,074,949.68 45,631,870.16November 15, 2017 . . . . . . . . . . . . . . . . . . . . . . . . . . . 2,590,516.97 32,624,827.48 45,031,744.65December 15, 2017 . . . . . . . . . . . . . . . . . . . . . . . . . . . 2,444,478.13 32,178,656.44 44,434,872.47January 15, 2018 . . . . . . . . . . . . . . . . . . . . . . . . . . . . . 2,305,711.53 31,736,403.65 43,841,236.72February 15, 2018 . . . . . . . . . . . . . . . . . . . . . . . . . . . . 2,173,878.39 31,298,036.49 43,250,820.57March 15, 2018 . . . . . . . . . . . . . . . . . . . . . . . . . . . . . . 2,048,655.10 30,863,522.58 42,663,607.30April 15, 2018 . . . . . . . . . . . . . . . . . . . . . . . . . . . . . . 1,929,732.50 30,432,829.81 42,079,580.25May 15, 2018 . . . . . . . . . . . . . . . . . . . . . . . . . . . . . . . 1,816,815.29 30,005,926.35 41,498,722.87June 15, 2018 . . . . . . . . . . . . . . . . . . . . . . . . . . . . . . . 1,709,621.42 29,582,780.60 40,921,018.68July 15, 2018 . . . . . . . . . . . . . . . . . . . . . . . . . . . . . . . 1,607,881.51 29,163,361.22 40,346,451.29August 15, 2018 . . . . . . . . . . . . . . . . . . . . . . . . . . . . . 1,511,338.30 28,747,637.15 39,775,004.38September 15, 2018 . . . . . . . . . . . . . . . . . . . . . . . . . . . 1,419,746.12 28,335,577.55 39,206,661.75October 15, 2018. . . . . . . . . . . . . . . . . . . . . . . . . . . . . 1,332,870.37 27,927,151.85 38,641,407.25November 15, 2018 . . . . . . . . . . . . . . . . . . . . . . . . . . . 1,250,487.06 27,522,329.72 38,079,224.82December 15, 2018 . . . . . . . . . . . . . . . . . . . . . . . . . . . 1,172,382.33 27,121,081.08 37,520,098.49January 15, 2019 . . . . . . . . . . . . . . . . . . . . . . . . . . . . . 1,098,352.01 26,723,376.09 36,964,012.38February 15, 2019 . . . . . . . . . . . . . . . . . . . . . . . . . . . . 1,028,201.21 26,329,185.16 36,410,950.66March 15, 2019 . . . . . . . . . . . . . . . . . . . . . . . . . . . . . . 961,743.88 25,938,478.92 35,860,897.62April 15, 2019 . . . . . . . . . . . . . . . . . . . . . . . . . . . . . . 898,802.44 25,551,228.27 35,313,837.61May 15, 2019 . . . . . . . . . . . . . . . . . . . . . . . . . . . . . . . 839,207.43 25,167,404.32 34,769,755.07June 15, 2019 . . . . . . . . . . . . . . . . . . . . . . . . . . . . . . . 782,797.10 24,786,978.43 34,228,634.50July 15, 2019 . . . . . . . . . . . . . . . . . . . . . . . . . . . . . . . 729,417.12 24,409,922.18 33,690,460.51August 15, 2019 . . . . . . . . . . . . . . . . . . . . . . . . . . . . . 678,920.22 24,036,207.39 33,155,217.76September 15, 2019 . . . . . . . . . . . . . . . . . . . . . . . . . . . 631,165.89 23,665,806.10 32,622,891.01October 15, 2019. . . . . . . . . . . . . . . . . . . . . . . . . . . . . 586,020.10 23,298,690.60 32,093,465.09November 15, 2019 . . . . . . . . . . . . . . . . . . . . . . . . . . . 543,354.98 22,934,833.37 31,566,924.92December 15, 2019 . . . . . . . . . . . . . . . . . . . . . . . . . . . 503,048.54 22,574,207.14 31,043,255.47January 15, 2020 . . . . . . . . . . . . . . . . . . . . . . . . . . . . . 464,984.47 22,217,930.38 30,522,441.82February 15, 2020 . . . . . . . . . . . . . . . . . . . . . . . . . . . . 429,051.83 21,866,984.85 30,004,469.10March 15, 2020 . . . . . . . . . . . . . . . . . . . . . . . . . . . . . . 395,144.81 21,521,293.32 29,491,610.79April 15, 2020 . . . . . . . . . . . . . . . . . . . . . . . . . . . . . . 363,162.54 21,180,779.66 28,987,111.43May 15, 2020 . . . . . . . . . . . . . . . . . . . . . . . . . . . . . . . 333,008.85 20,845,368.79 28,490,838.62June 15, 2020 . . . . . . . . . . . . . . . . . . . . . . . . . . . . . . . 304,592.05 20,514,986.72 28,002,662.05July 15, 2020 . . . . . . . . . . . . . . . . . . . . . . . . . . . . . . . 277,824.74 20,189,560.52 27,522,453.42August 15, 2020 . . . . . . . . . . . . . . . . . . . . . . . . . . . . . 252,623.62 19,869,018.26 27,050,086.44September 15, 2020 . . . . . . . . . . . . . . . . . . . . . . . . . . . 228,909.30 19,553,289.07 26,585,436.75October 15, 2020. . . . . . . . . . . . . . . . . . . . . . . . . . . . . 206,606.13 19,242,303.06 26,128,381.97November 15, 2020 . . . . . . . . . . . . . . . . . . . . . . . . . . . 185,642.02 18,935,991.34 25,678,801.59December 15, 2020 . . . . . . . . . . . . . . . . . . . . . . . . . . . 165,948.29 18,634,286.01 25,236,577.00January 15, 2021 . . . . . . . . . . . . . . . . . . . . . . . . . . . . . 147,459.54 18,337,120.11 24,801,591.43February 15, 2021 . . . . . . . . . . . . . . . . . . . . . . . . . . . . 130,113.43 18,044,427.66 24,373,729.91March 15, 2021 . . . . . . . . . . . . . . . . . . . . . . . . . . . . . . 113,850.62 17,756,143.60 23,952,879.28April 15, 2021 . . . . . . . . . . . . . . . . . . . . . . . . . . . . . . 98,614.60 17,472,203.80 23,538,928.13May 15, 2021 . . . . . . . . . . . . . . . . . . . . . . . . . . . . . . . 84,351.56 17,192,545.04 23,131,766.82June 15, 2021 . . . . . . . . . . . . . . . . . . . . . . . . . . . . . . . 71,010.25 16,917,105.01 22,731,287.36July 15, 2021 . . . . . . . . . . . . . . . . . . . . . . . . . . . . . . . 58,541.92 16,645,822.26 22,337,383.50August 15, 2021 . . . . . . . . . . . . . . . . . . . . . . . . . . . . . 46,900.14 16,378,636.26 21,949,950.61September 15, 2021 . . . . . . . . . . . . . . . . . . . . . . . . . . . 36,040.75 16,115,487.30 21,568,885.70October 15, 2021. . . . . . . . . . . . . . . . . . . . . . . . . . . . . 25,921.70 15,856,316.53 21,194,087.40November 15, 2021 . . . . . . . . . . . . . . . . . . . . . . . . . . . 16,503.01 15,601,065.95 20,825,455.91December 15, 2021 . . . . . . . . . . . . . . . . . . . . . . . . . . . 7,746.63 15,349,678.38 20,462,892.99January 15, 2022 . . . . . . . . . . . . . . . . . . . . . . . . . . . . . 0.00 15,102,097.45 20,106,301.93February 15, 2022 . . . . . . . . . . . . . . . . . . . . . . . . . . . . 0.00 14,858,267.60 19,755,587.52March 15, 2022 . . . . . . . . . . . . . . . . . . . . . . . . . . . . . . 0.00 14,618,134.07 19,410,656.07April 15, 2022 . . . . . . . . . . . . . . . . . . . . . . . . . . . . . . 0.00 14,381,642.85 19,071,415.32May 15, 2022 . . . . . . . . . . . . . . . . . . . . . . . . . . . . . . . 0.00 14,148,740.73 18,737,774.46June 15, 2022 . . . . . . . . . . . . . . . . . . . . . . . . . . . . . . . 0.00 13,919,375.26 18,409,644.11July 15, 2022 . . . . . . . . . . . . . . . . . . . . . . . . . . . . . . . 0.00 13,693,494.71 18,086,936.27August 15, 2022 . . . . . . . . . . . . . . . . . . . . . . . . . . . . . 0.00 13,471,048.12 17,769,564.33September 15, 2022 . . . . . . . . . . . . . . . . . . . . . . . . . . . 0.00 13,251,985.24 17,457,443.03October 15, 2022. . . . . . . . . . . . . . . . . . . . . . . . . . . . . 0.00 13,036,256.53 17,150,488.43November 15, 2022 . . . . . . . . . . . . . . . . . . . . . . . . . . . 0.00 12,823,813.19 16,848,617.93
B-2
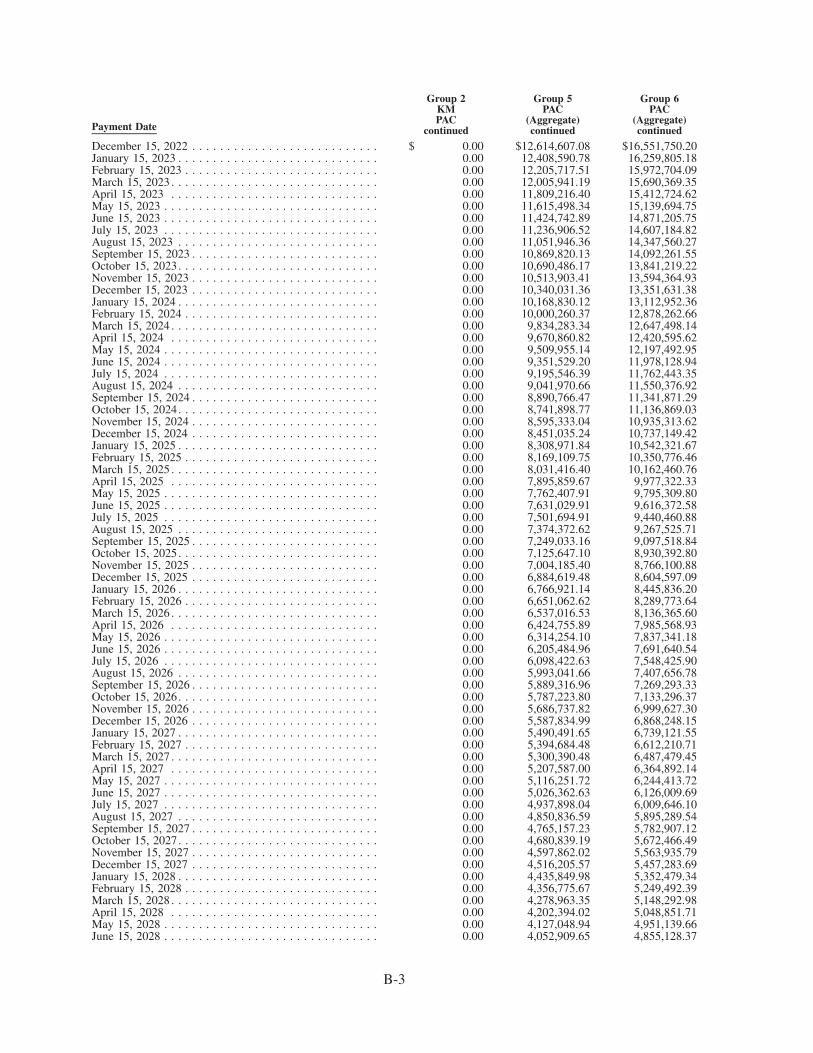
Payment Date
Group 2KMPAC
continued
Group 5PAC
(Aggregate)continued
Group 6PAC
(Aggregate)continued
December 15, 2022 . . . . . . . . . . . . . . . . . . . . . . . . . . . $ 0.00 $12,614,607.08 $16,551,750.20January 15, 2023 . . . . . . . . . . . . . . . . . . . . . . . . . . . . . 0.00 12,408,590.78 16,259,805.18February 15, 2023 . . . . . . . . . . . . . . . . . . . . . . . . . . . . 0.00 12,205,717.51 15,972,704.09March 15, 2023 . . . . . . . . . . . . . . . . . . . . . . . . . . . . . . 0.00 12,005,941.19 15,690,369.35April 15, 2023 . . . . . . . . . . . . . . . . . . . . . . . . . . . . . . 0.00 11,809,216.40 15,412,724.62May 15, 2023 . . . . . . . . . . . . . . . . . . . . . . . . . . . . . . . 0.00 11,615,498.34 15,139,694.75June 15, 2023 . . . . . . . . . . . . . . . . . . . . . . . . . . . . . . . 0.00 11,424,742.89 14,871,205.75July 15, 2023 . . . . . . . . . . . . . . . . . . . . . . . . . . . . . . . 0.00 11,236,906.52 14,607,184.82August 15, 2023 . . . . . . . . . . . . . . . . . . . . . . . . . . . . . 0.00 11,051,946.36 14,347,560.27September 15, 2023 . . . . . . . . . . . . . . . . . . . . . . . . . . . 0.00 10,869,820.13 14,092,261.55October 15, 2023. . . . . . . . . . . . . . . . . . . . . . . . . . . . . 0.00 10,690,486.17 13,841,219.22November 15, 2023 . . . . . . . . . . . . . . . . . . . . . . . . . . . 0.00 10,513,903.41 13,594,364.93December 15, 2023 . . . . . . . . . . . . . . . . . . . . . . . . . . . 0.00 10,340,031.36 13,351,631.38January 15, 2024 . . . . . . . . . . . . . . . . . . . . . . . . . . . . . 0.00 10,168,830.12 13,112,952.36February 15, 2024 . . . . . . . . . . . . . . . . . . . . . . . . . . . . 0.00 10,000,260.37 12,878,262.66March 15, 2024 . . . . . . . . . . . . . . . . . . . . . . . . . . . . . . 0.00 9,834,283.34 12,647,498.14April 15, 2024 . . . . . . . . . . . . . . . . . . . . . . . . . . . . . . 0.00 9,670,860.82 12,420,595.62May 15, 2024 . . . . . . . . . . . . . . . . . . . . . . . . . . . . . . . 0.00 9,509,955.14 12,197,492.95June 15, 2024 . . . . . . . . . . . . . . . . . . . . . . . . . . . . . . . 0.00 9,351,529.20 11,978,128.94July 15, 2024 . . . . . . . . . . . . . . . . . . . . . . . . . . . . . . . 0.00 9,195,546.39 11,762,443.35August 15, 2024 . . . . . . . . . . . . . . . . . . . . . . . . . . . . . 0.00 9,041,970.66 11,550,376.92September 15, 2024 . . . . . . . . . . . . . . . . . . . . . . . . . . . 0.00 8,890,766.47 11,341,871.29October 15, 2024. . . . . . . . . . . . . . . . . . . . . . . . . . . . . 0.00 8,741,898.77 11,136,869.03November 15, 2024 . . . . . . . . . . . . . . . . . . . . . . . . . . . 0.00 8,595,333.04 10,935,313.62December 15, 2024 . . . . . . . . . . . . . . . . . . . . . . . . . . . 0.00 8,451,035.24 10,737,149.42January 15, 2025 . . . . . . . . . . . . . . . . . . . . . . . . . . . . . 0.00 8,308,971.84 10,542,321.67February 15, 2025 . . . . . . . . . . . . . . . . . . . . . . . . . . . . 0.00 8,169,109.75 10,350,776.46March 15, 2025 . . . . . . . . . . . . . . . . . . . . . . . . . . . . . . 0.00 8,031,416.40 10,162,460.76April 15, 2025 . . . . . . . . . . . . . . . . . . . . . . . . . . . . . . 0.00 7,895,859.67 9,977,322.33May 15, 2025 . . . . . . . . . . . . . . . . . . . . . . . . . . . . . . . 0.00 7,762,407.91 9,795,309.80June 15, 2025 . . . . . . . . . . . . . . . . . . . . . . . . . . . . . . . 0.00 7,631,029.91 9,616,372.58July 15, 2025 . . . . . . . . . . . . . . . . . . . . . . . . . . . . . . . 0.00 7,501,694.91 9,440,460.88August 15, 2025 . . . . . . . . . . . . . . . . . . . . . . . . . . . . . 0.00 7,374,372.62 9,267,525.71September 15, 2025 . . . . . . . . . . . . . . . . . . . . . . . . . . . 0.00 7,249,033.16 9,097,518.84October 15, 2025. . . . . . . . . . . . . . . . . . . . . . . . . . . . . 0.00 7,125,647.10 8,930,392.80November 15, 2025 . . . . . . . . . . . . . . . . . . . . . . . . . . . 0.00 7,004,185.40 8,766,100.88December 15, 2025 . . . . . . . . . . . . . . . . . . . . . . . . . . . 0.00 6,884,619.48 8,604,597.09January 15, 2026 . . . . . . . . . . . . . . . . . . . . . . . . . . . . . 0.00 6,766,921.14 8,445,836.20February 15, 2026 . . . . . . . . . . . . . . . . . . . . . . . . . . . . 0.00 6,651,062.62 8,289,773.64March 15, 2026 . . . . . . . . . . . . . . . . . . . . . . . . . . . . . . 0.00 6,537,016.53 8,136,365.60April 15, 2026 . . . . . . . . . . . . . . . . . . . . . . . . . . . . . . 0.00 6,424,755.89 7,985,568.93May 15, 2026 . . . . . . . . . . . . . . . . . . . . . . . . . . . . . . . 0.00 6,314,254.10 7,837,341.18June 15, 2026 . . . . . . . . . . . . . . . . . . . . . . . . . . . . . . . 0.00 6,205,484.96 7,691,640.54July 15, 2026 . . . . . . . . . . . . . . . . . . . . . . . . . . . . . . . 0.00 6,098,422.63 7,548,425.90August 15, 2026 . . . . . . . . . . . . . . . . . . . . . . . . . . . . . 0.00 5,993,041.66 7,407,656.78September 15, 2026 . . . . . . . . . . . . . . . . . . . . . . . . . . . 0.00 5,889,316.96 7,269,293.33October 15, 2026. . . . . . . . . . . . . . . . . . . . . . . . . . . . . 0.00 5,787,223.80 7,133,296.37November 15, 2026 . . . . . . . . . . . . . . . . . . . . . . . . . . . 0.00 5,686,737.82 6,999,627.30December 15, 2026 . . . . . . . . . . . . . . . . . . . . . . . . . . . 0.00 5,587,834.99 6,868,248.15January 15, 2027 . . . . . . . . . . . . . . . . . . . . . . . . . . . . . 0.00 5,490,491.65 6,739,121.55February 15, 2027 . . . . . . . . . . . . . . . . . . . . . . . . . . . . 0.00 5,394,684.48 6,612,210.71March 15, 2027 . . . . . . . . . . . . . . . . . . . . . . . . . . . . . . 0.00 5,300,390.48 6,487,479.45April 15, 2027 . . . . . . . . . . . . . . . . . . . . . . . . . . . . . . 0.00 5,207,587.00 6,364,892.14May 15, 2027 . . . . . . . . . . . . . . . . . . . . . . . . . . . . . . . 0.00 5,116,251.72 6,244,413.72June 15, 2027 . . . . . . . . . . . . . . . . . . . . . . . . . . . . . . . 0.00 5,026,362.63 6,126,009.69July 15, 2027 . . . . . . . . . . . . . . . . . . . . . . . . . . . . . . . 0.00 4,937,898.04 6,009,646.10August 15, 2027 . . . . . . . . . . . . . . . . . . . . . . . . . . . . . 0.00 4,850,836.59 5,895,289.54September 15, 2027 . . . . . . . . . . . . . . . . . . . . . . . . . . . 0.00 4,765,157.23 5,782,907.12October 15, 2027. . . . . . . . . . . . . . . . . . . . . . . . . . . . . 0.00 4,680,839.19 5,672,466.49November 15, 2027 . . . . . . . . . . . . . . . . . . . . . . . . . . . 0.00 4,597,862.02 5,563,935.79December 15, 2027 . . . . . . . . . . . . . . . . . . . . . . . . . . . 0.00 4,516,205.57 5,457,283.69January 15, 2028 . . . . . . . . . . . . . . . . . . . . . . . . . . . . . 0.00 4,435,849.98 5,352,479.34February 15, 2028 . . . . . . . . . . . . . . . . . . . . . . . . . . . . 0.00 4,356,775.67 5,249,492.39March 15, 2028 . . . . . . . . . . . . . . . . . . . . . . . . . . . . . . 0.00 4,278,963.35 5,148,292.98April 15, 2028 . . . . . . . . . . . . . . . . . . . . . . . . . . . . . . 0.00 4,202,394.02 5,048,851.71May 15, 2028 . . . . . . . . . . . . . . . . . . . . . . . . . . . . . . . 0.00 4,127,048.94 4,951,139.66June 15, 2028 . . . . . . . . . . . . . . . . . . . . . . . . . . . . . . . 0.00 4,052,909.65 4,855,128.37
B-3
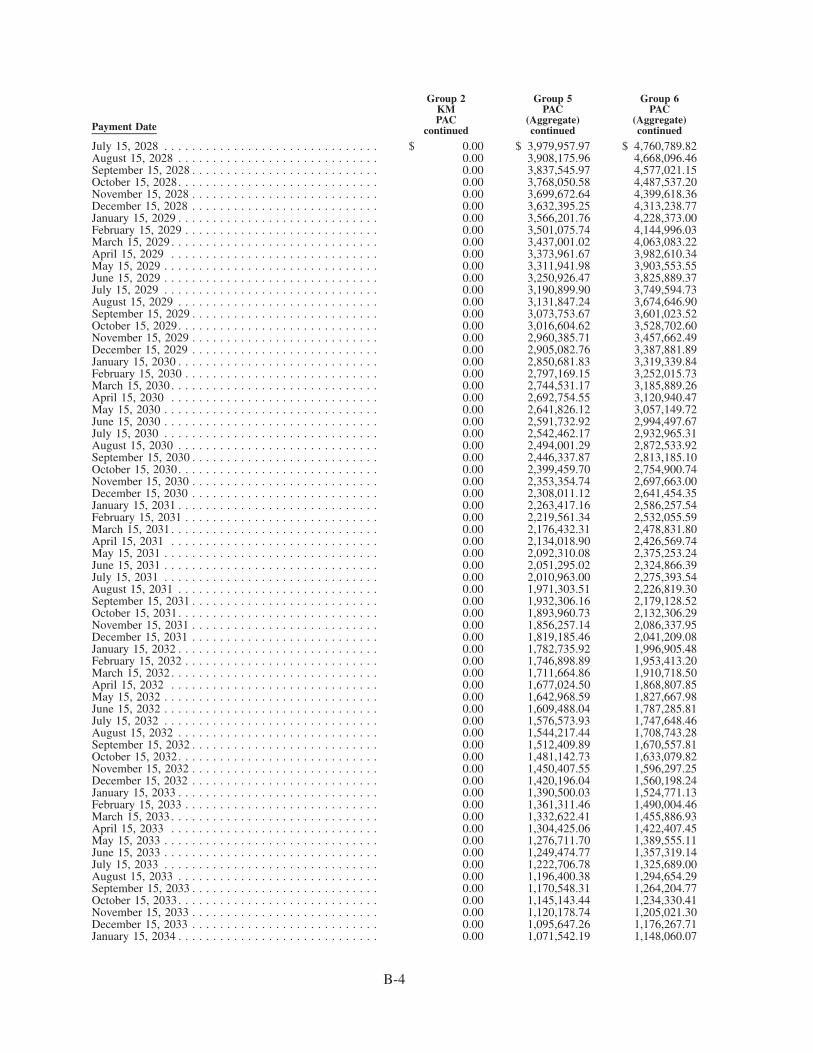
Payment Date
Group 2KMPAC
continued
Group 5PAC
(Aggregate)continued
Group 6PAC
(Aggregate)continued
July 15, 2028 . . . . . . . . . . . . . . . . . . . . . . . . . . . . . . . $ 0.00 $ 3,979,957.97 $ 4,760,789.82August 15, 2028 . . . . . . . . . . . . . . . . . . . . . . . . . . . . . 0.00 3,908,175.96 4,668,096.46September 15, 2028 . . . . . . . . . . . . . . . . . . . . . . . . . . . 0.00 3,837,545.97 4,577,021.15October 15, 2028. . . . . . . . . . . . . . . . . . . . . . . . . . . . . 0.00 3,768,050.58 4,487,537.20November 15, 2028 . . . . . . . . . . . . . . . . . . . . . . . . . . . 0.00 3,699,672.64 4,399,618.36December 15, 2028 . . . . . . . . . . . . . . . . . . . . . . . . . . . 0.00 3,632,395.25 4,313,238.77January 15, 2029 . . . . . . . . . . . . . . . . . . . . . . . . . . . . . 0.00 3,566,201.76 4,228,373.00February 15, 2029 . . . . . . . . . . . . . . . . . . . . . . . . . . . . 0.00 3,501,075.74 4,144,996.03March 15, 2029 . . . . . . . . . . . . . . . . . . . . . . . . . . . . . . 0.00 3,437,001.02 4,063,083.22April 15, 2029 . . . . . . . . . . . . . . . . . . . . . . . . . . . . . . 0.00 3,373,961.67 3,982,610.34May 15, 2029 . . . . . . . . . . . . . . . . . . . . . . . . . . . . . . . 0.00 3,311,941.98 3,903,553.55June 15, 2029 . . . . . . . . . . . . . . . . . . . . . . . . . . . . . . . 0.00 3,250,926.47 3,825,889.37July 15, 2029 . . . . . . . . . . . . . . . . . . . . . . . . . . . . . . . 0.00 3,190,899.90 3,749,594.73August 15, 2029 . . . . . . . . . . . . . . . . . . . . . . . . . . . . . 0.00 3,131,847.24 3,674,646.90September 15, 2029 . . . . . . . . . . . . . . . . . . . . . . . . . . . 0.00 3,073,753.67 3,601,023.52October 15, 2029. . . . . . . . . . . . . . . . . . . . . . . . . . . . . 0.00 3,016,604.62 3,528,702.60November 15, 2029 . . . . . . . . . . . . . . . . . . . . . . . . . . . 0.00 2,960,385.71 3,457,662.49December 15, 2029 . . . . . . . . . . . . . . . . . . . . . . . . . . . 0.00 2,905,082.76 3,387,881.89January 15, 2030 . . . . . . . . . . . . . . . . . . . . . . . . . . . . . 0.00 2,850,681.83 3,319,339.84February 15, 2030 . . . . . . . . . . . . . . . . . . . . . . . . . . . . 0.00 2,797,169.15 3,252,015.73March 15, 2030 . . . . . . . . . . . . . . . . . . . . . . . . . . . . . . 0.00 2,744,531.17 3,185,889.26April 15, 2030 . . . . . . . . . . . . . . . . . . . . . . . . . . . . . . 0.00 2,692,754.55 3,120,940.47May 15, 2030 . . . . . . . . . . . . . . . . . . . . . . . . . . . . . . . 0.00 2,641,826.12 3,057,149.72June 15, 2030 . . . . . . . . . . . . . . . . . . . . . . . . . . . . . . . 0.00 2,591,732.92 2,994,497.67July 15, 2030 . . . . . . . . . . . . . . . . . . . . . . . . . . . . . . . 0.00 2,542,462.17 2,932,965.31August 15, 2030 . . . . . . . . . . . . . . . . . . . . . . . . . . . . . 0.00 2,494,001.29 2,872,533.92September 15, 2030 . . . . . . . . . . . . . . . . . . . . . . . . . . . 0.00 2,446,337.87 2,813,185.10October 15, 2030. . . . . . . . . . . . . . . . . . . . . . . . . . . . . 0.00 2,399,459.70 2,754,900.74November 15, 2030 . . . . . . . . . . . . . . . . . . . . . . . . . . . 0.00 2,353,354.74 2,697,663.00December 15, 2030 . . . . . . . . . . . . . . . . . . . . . . . . . . . 0.00 2,308,011.12 2,641,454.35January 15, 2031 . . . . . . . . . . . . . . . . . . . . . . . . . . . . . 0.00 2,263,417.16 2,586,257.54February 15, 2031 . . . . . . . . . . . . . . . . . . . . . . . . . . . . 0.00 2,219,561.34 2,532,055.59March 15, 2031 . . . . . . . . . . . . . . . . . . . . . . . . . . . . . . 0.00 2,176,432.31 2,478,831.80April 15, 2031 . . . . . . . . . . . . . . . . . . . . . . . . . . . . . . 0.00 2,134,018.90 2,426,569.74May 15, 2031 . . . . . . . . . . . . . . . . . . . . . . . . . . . . . . . 0.00 2,092,310.08 2,375,253.24June 15, 2031 . . . . . . . . . . . . . . . . . . . . . . . . . . . . . . . 0.00 2,051,295.02 2,324,866.39July 15, 2031 . . . . . . . . . . . . . . . . . . . . . . . . . . . . . . . 0.00 2,010,963.00 2,275,393.54August 15, 2031 . . . . . . . . . . . . . . . . . . . . . . . . . . . . . 0.00 1,971,303.51 2,226,819.30September 15, 2031 . . . . . . . . . . . . . . . . . . . . . . . . . . . 0.00 1,932,306.16 2,179,128.52October 15, 2031. . . . . . . . . . . . . . . . . . . . . . . . . . . . . 0.00 1,893,960.73 2,132,306.29November 15, 2031 . . . . . . . . . . . . . . . . . . . . . . . . . . . 0.00 1,856,257.14 2,086,337.95December 15, 2031 . . . . . . . . . . . . . . . . . . . . . . . . . . . 0.00 1,819,185.46 2,041,209.08January 15, 2032 . . . . . . . . . . . . . . . . . . . . . . . . . . . . . 0.00 1,782,735.92 1,996,905.48February 15, 2032 . . . . . . . . . . . . . . . . . . . . . . . . . . . . 0.00 1,746,898.89 1,953,413.20March 15, 2032 . . . . . . . . . . . . . . . . . . . . . . . . . . . . . . 0.00 1,711,664.86 1,910,718.50April 15, 2032 . . . . . . . . . . . . . . . . . . . . . . . . . . . . . . 0.00 1,677,024.50 1,868,807.85May 15, 2032 . . . . . . . . . . . . . . . . . . . . . . . . . . . . . . . 0.00 1,642,968.59 1,827,667.98June 15, 2032 . . . . . . . . . . . . . . . . . . . . . . . . . . . . . . . 0.00 1,609,488.04 1,787,285.81July 15, 2032 . . . . . . . . . . . . . . . . . . . . . . . . . . . . . . . 0.00 1,576,573.93 1,747,648.46August 15, 2032 . . . . . . . . . . . . . . . . . . . . . . . . . . . . . 0.00 1,544,217.44 1,708,743.28September 15, 2032 . . . . . . . . . . . . . . . . . . . . . . . . . . . 0.00 1,512,409.89 1,670,557.81October 15, 2032. . . . . . . . . . . . . . . . . . . . . . . . . . . . . 0.00 1,481,142.73 1,633,079.82November 15, 2032 . . . . . . . . . . . . . . . . . . . . . . . . . . . 0.00 1,450,407.55 1,596,297.25December 15, 2032 . . . . . . . . . . . . . . . . . . . . . . . . . . . 0.00 1,420,196.04 1,560,198.24January 15, 2033 . . . . . . . . . . . . . . . . . . . . . . . . . . . . . 0.00 1,390,500.03 1,524,771.13February 15, 2033 . . . . . . . . . . . . . . . . . . . . . . . . . . . . 0.00 1,361,311.46 1,490,004.46March 15, 2033 . . . . . . . . . . . . . . . . . . . . . . . . . . . . . . 0.00 1,332,622.41 1,455,886.93April 15, 2033 . . . . . . . . . . . . . . . . . . . . . . . . . . . . . . 0.00 1,304,425.06 1,422,407.45May 15, 2033 . . . . . . . . . . . . . . . . . . . . . . . . . . . . . . . 0.00 1,276,711.70 1,389,555.11June 15, 2033 . . . . . . . . . . . . . . . . . . . . . . . . . . . . . . . 0.00 1,249,474.77 1,357,319.14July 15, 2033 . . . . . . . . . . . . . . . . . . . . . . . . . . . . . . . 0.00 1,222,706.78 1,325,689.00August 15, 2033 . . . . . . . . . . . . . . . . . . . . . . . . . . . . . 0.00 1,196,400.38 1,294,654.29September 15, 2033 . . . . . . . . . . . . . . . . . . . . . . . . . . . 0.00 1,170,548.31 1,264,204.77October 15, 2033. . . . . . . . . . . . . . . . . . . . . . . . . . . . . 0.00 1,145,143.44 1,234,330.41November 15, 2033 . . . . . . . . . . . . . . . . . . . . . . . . . . . 0.00 1,120,178.74 1,205,021.30December 15, 2033 . . . . . . . . . . . . . . . . . . . . . . . . . . . 0.00 1,095,647.26 1,176,267.71January 15, 2034 . . . . . . . . . . . . . . . . . . . . . . . . . . . . . 0.00 1,071,542.19 1,148,060.07
B-4
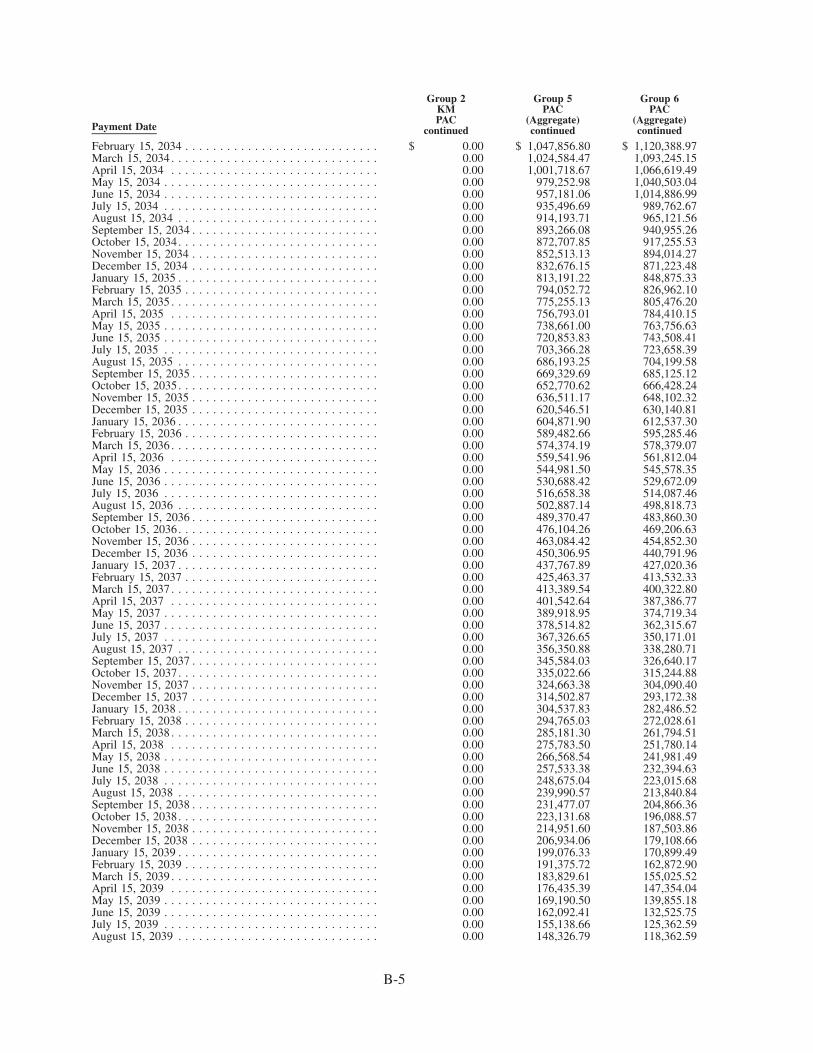
Payment Date
Group 2KMPAC
continued
Group 5PAC
(Aggregate)continued
Group 6PAC
(Aggregate)continued
February 15, 2034 . . . . . . . . . . . . . . . . . . . . . . . . . . . . $ 0.00 $ 1,047,856.80 $ 1,120,388.97March 15, 2034 . . . . . . . . . . . . . . . . . . . . . . . . . . . . . . 0.00 1,024,584.47 1,093,245.15April 15, 2034 . . . . . . . . . . . . . . . . . . . . . . . . . . . . . . 0.00 1,001,718.67 1,066,619.49May 15, 2034 . . . . . . . . . . . . . . . . . . . . . . . . . . . . . . . 0.00 979,252.98 1,040,503.04June 15, 2034 . . . . . . . . . . . . . . . . . . . . . . . . . . . . . . . 0.00 957,181.06 1,014,886.99July 15, 2034 . . . . . . . . . . . . . . . . . . . . . . . . . . . . . . . 0.00 935,496.69 989,762.67August 15, 2034 . . . . . . . . . . . . . . . . . . . . . . . . . . . . . 0.00 914,193.71 965,121.56September 15, 2034 . . . . . . . . . . . . . . . . . . . . . . . . . . . 0.00 893,266.08 940,955.26October 15, 2034. . . . . . . . . . . . . . . . . . . . . . . . . . . . . 0.00 872,707.85 917,255.53November 15, 2034 . . . . . . . . . . . . . . . . . . . . . . . . . . . 0.00 852,513.13 894,014.27December 15, 2034 . . . . . . . . . . . . . . . . . . . . . . . . . . . 0.00 832,676.15 871,223.48January 15, 2035 . . . . . . . . . . . . . . . . . . . . . . . . . . . . . 0.00 813,191.22 848,875.33February 15, 2035 . . . . . . . . . . . . . . . . . . . . . . . . . . . . 0.00 794,052.72 826,962.10March 15, 2035 . . . . . . . . . . . . . . . . . . . . . . . . . . . . . . 0.00 775,255.13 805,476.20April 15, 2035 . . . . . . . . . . . . . . . . . . . . . . . . . . . . . . 0.00 756,793.01 784,410.15May 15, 2035 . . . . . . . . . . . . . . . . . . . . . . . . . . . . . . . 0.00 738,661.00 763,756.63June 15, 2035 . . . . . . . . . . . . . . . . . . . . . . . . . . . . . . . 0.00 720,853.83 743,508.41July 15, 2035 . . . . . . . . . . . . . . . . . . . . . . . . . . . . . . . 0.00 703,366.28 723,658.39August 15, 2035 . . . . . . . . . . . . . . . . . . . . . . . . . . . . . 0.00 686,193.25 704,199.58September 15, 2035 . . . . . . . . . . . . . . . . . . . . . . . . . . . 0.00 669,329.69 685,125.12October 15, 2035. . . . . . . . . . . . . . . . . . . . . . . . . . . . . 0.00 652,770.62 666,428.24November 15, 2035 . . . . . . . . . . . . . . . . . . . . . . . . . . . 0.00 636,511.17 648,102.32December 15, 2035 . . . . . . . . . . . . . . . . . . . . . . . . . . . 0.00 620,546.51 630,140.81January 15, 2036 . . . . . . . . . . . . . . . . . . . . . . . . . . . . . 0.00 604,871.90 612,537.30February 15, 2036 . . . . . . . . . . . . . . . . . . . . . . . . . . . . 0.00 589,482.66 595,285.46March 15, 2036 . . . . . . . . . . . . . . . . . . . . . . . . . . . . . . 0.00 574,374.19 578,379.07April 15, 2036 . . . . . . . . . . . . . . . . . . . . . . . . . . . . . . 0.00 559,541.96 561,812.04May 15, 2036 . . . . . . . . . . . . . . . . . . . . . . . . . . . . . . . 0.00 544,981.50 545,578.35June 15, 2036 . . . . . . . . . . . . . . . . . . . . . . . . . . . . . . . 0.00 530,688.42 529,672.09July 15, 2036 . . . . . . . . . . . . . . . . . . . . . . . . . . . . . . . 0.00 516,658.38 514,087.46August 15, 2036 . . . . . . . . . . . . . . . . . . . . . . . . . . . . . 0.00 502,887.14 498,818.73September 15, 2036 . . . . . . . . . . . . . . . . . . . . . . . . . . . 0.00 489,370.47 483,860.30October 15, 2036. . . . . . . . . . . . . . . . . . . . . . . . . . . . . 0.00 476,104.26 469,206.63November 15, 2036 . . . . . . . . . . . . . . . . . . . . . . . . . . . 0.00 463,084.42 454,852.30December 15, 2036 . . . . . . . . . . . . . . . . . . . . . . . . . . . 0.00 450,306.95 440,791.96January 15, 2037 . . . . . . . . . . . . . . . . . . . . . . . . . . . . . 0.00 437,767.89 427,020.36February 15, 2037 . . . . . . . . . . . . . . . . . . . . . . . . . . . . 0.00 425,463.37 413,532.33March 15, 2037 . . . . . . . . . . . . . . . . . . . . . . . . . . . . . . 0.00 413,389.54 400,322.80April 15, 2037 . . . . . . . . . . . . . . . . . . . . . . . . . . . . . . 0.00 401,542.64 387,386.77May 15, 2037 . . . . . . . . . . . . . . . . . . . . . . . . . . . . . . . 0.00 389,918.95 374,719.34June 15, 2037 . . . . . . . . . . . . . . . . . . . . . . . . . . . . . . . 0.00 378,514.82 362,315.67July 15, 2037 . . . . . . . . . . . . . . . . . . . . . . . . . . . . . . . 0.00 367,326.65 350,171.01August 15, 2037 . . . . . . . . . . . . . . . . . . . . . . . . . . . . . 0.00 356,350.88 338,280.71September 15, 2037 . . . . . . . . . . . . . . . . . . . . . . . . . . . 0.00 345,584.03 326,640.17October 15, 2037. . . . . . . . . . . . . . . . . . . . . . . . . . . . . 0.00 335,022.66 315,244.88November 15, 2037 . . . . . . . . . . . . . . . . . . . . . . . . . . . 0.00 324,663.38 304,090.40December 15, 2037 . . . . . . . . . . . . . . . . . . . . . . . . . . . 0.00 314,502.87 293,172.38January 15, 2038 . . . . . . . . . . . . . . . . . . . . . . . . . . . . . 0.00 304,537.83 282,486.52February 15, 2038 . . . . . . . . . . . . . . . . . . . . . . . . . . . . 0.00 294,765.03 272,028.61March 15, 2038 . . . . . . . . . . . . . . . . . . . . . . . . . . . . . . 0.00 285,181.30 261,794.51April 15, 2038 . . . . . . . . . . . . . . . . . . . . . . . . . . . . . . 0.00 275,783.50 251,780.14May 15, 2038 . . . . . . . . . . . . . . . . . . . . . . . . . . . . . . . 0.00 266,568.54 241,981.49June 15, 2038 . . . . . . . . . . . . . . . . . . . . . . . . . . . . . . . 0.00 257,533.38 232,394.63July 15, 2038 . . . . . . . . . . . . . . . . . . . . . . . . . . . . . . . 0.00 248,675.04 223,015.68August 15, 2038 . . . . . . . . . . . . . . . . . . . . . . . . . . . . . 0.00 239,990.57 213,840.84September 15, 2038 . . . . . . . . . . . . . . . . . . . . . . . . . . . 0.00 231,477.07 204,866.36October 15, 2038. . . . . . . . . . . . . . . . . . . . . . . . . . . . . 0.00 223,131.68 196,088.57November 15, 2038 . . . . . . . . . . . . . . . . . . . . . . . . . . . 0.00 214,951.60 187,503.86December 15, 2038 . . . . . . . . . . . . . . . . . . . . . . . . . . . 0.00 206,934.06 179,108.66January 15, 2039 . . . . . . . . . . . . . . . . . . . . . . . . . . . . . 0.00 199,076.33 170,899.49February 15, 2039 . . . . . . . . . . . . . . . . . . . . . . . . . . . . 0.00 191,375.72 162,872.90March 15, 2039 . . . . . . . . . . . . . . . . . . . . . . . . . . . . . . 0.00 183,829.61 155,025.52April 15, 2039 . . . . . . . . . . . . . . . . . . . . . . . . . . . . . . 0.00 176,435.39 147,354.04May 15, 2039 . . . . . . . . . . . . . . . . . . . . . . . . . . . . . . . 0.00 169,190.50 139,855.18June 15, 2039 . . . . . . . . . . . . . . . . . . . . . . . . . . . . . . . 0.00 162,092.41 132,525.75July 15, 2039 . . . . . . . . . . . . . . . . . . . . . . . . . . . . . . . 0.00 155,138.66 125,362.59August 15, 2039 . . . . . . . . . . . . . . . . . . . . . . . . . . . . . 0.00 148,326.79 118,362.59
B-5
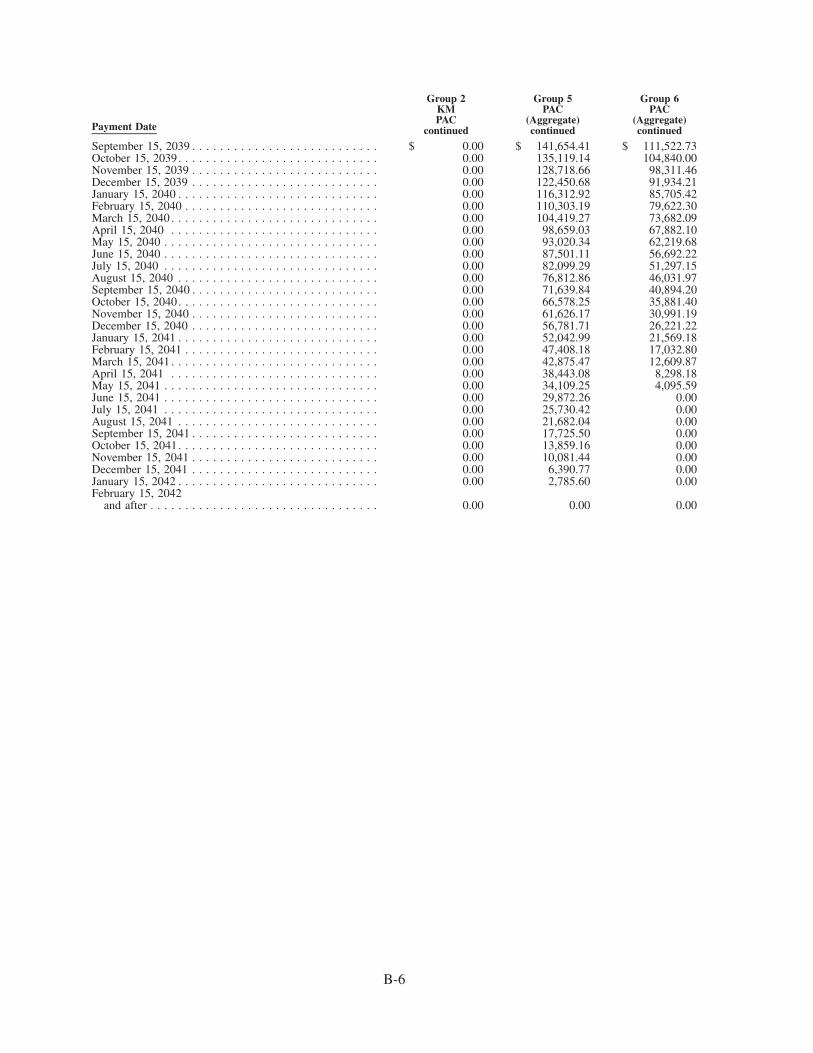
Payment Date
Group 2KMPAC
continued
Group 5PAC
(Aggregate)continued
Group 6PAC
(Aggregate)continued
September 15, 2039 . . . . . . . . . . . . . . . . . . . . . . . . . . . $ 0.00 $ 141,654.41 $ 111,522.73October 15, 2039. . . . . . . . . . . . . . . . . . . . . . . . . . . . . 0.00 135,119.14 104,840.00November 15, 2039 . . . . . . . . . . . . . . . . . . . . . . . . . . . 0.00 128,718.66 98,311.46December 15, 2039 . . . . . . . . . . . . . . . . . . . . . . . . . . . 0.00 122,450.68 91,934.21January 15, 2040 . . . . . . . . . . . . . . . . . . . . . . . . . . . . . 0.00 116,312.92 85,705.42February 15, 2040 . . . . . . . . . . . . . . . . . . . . . . . . . . . . 0.00 110,303.19 79,622.30March 15, 2040 . . . . . . . . . . . . . . . . . . . . . . . . . . . . . . 0.00 104,419.27 73,682.09April 15, 2040 . . . . . . . . . . . . . . . . . . . . . . . . . . . . . . 0.00 98,659.03 67,882.10May 15, 2040 . . . . . . . . . . . . . . . . . . . . . . . . . . . . . . . 0.00 93,020.34 62,219.68June 15, 2040 . . . . . . . . . . . . . . . . . . . . . . . . . . . . . . . 0.00 87,501.11 56,692.22July 15, 2040 . . . . . . . . . . . . . . . . . . . . . . . . . . . . . . . 0.00 82,099.29 51,297.15August 15, 2040 . . . . . . . . . . . . . . . . . . . . . . . . . . . . . 0.00 76,812.86 46,031.97September 15, 2040 . . . . . . . . . . . . . . . . . . . . . . . . . . . 0.00 71,639.84 40,894.20October 15, 2040. . . . . . . . . . . . . . . . . . . . . . . . . . . . . 0.00 66,578.25 35,881.40November 15, 2040 . . . . . . . . . . . . . . . . . . . . . . . . . . . 0.00 61,626.17 30,991.19December 15, 2040 . . . . . . . . . . . . . . . . . . . . . . . . . . . 0.00 56,781.71 26,221.22January 15, 2041 . . . . . . . . . . . . . . . . . . . . . . . . . . . . . 0.00 52,042.99 21,569.18February 15, 2041 . . . . . . . . . . . . . . . . . . . . . . . . . . . . 0.00 47,408.18 17,032.80March 15, 2041 . . . . . . . . . . . . . . . . . . . . . . . . . . . . . . 0.00 42,875.47 12,609.87April 15, 2041 . . . . . . . . . . . . . . . . . . . . . . . . . . . . . . 0.00 38,443.08 8,298.18May 15, 2041 . . . . . . . . . . . . . . . . . . . . . . . . . . . . . . . 0.00 34,109.25 4,095.59June 15, 2041 . . . . . . . . . . . . . . . . . . . . . . . . . . . . . . . 0.00 29,872.26 0.00July 15, 2041 . . . . . . . . . . . . . . . . . . . . . . . . . . . . . . . 0.00 25,730.42 0.00August 15, 2041 . . . . . . . . . . . . . . . . . . . . . . . . . . . . . 0.00 21,682.04 0.00September 15, 2041 . . . . . . . . . . . . . . . . . . . . . . . . . . . 0.00 17,725.50 0.00October 15, 2041. . . . . . . . . . . . . . . . . . . . . . . . . . . . . 0.00 13,859.16 0.00November 15, 2041 . . . . . . . . . . . . . . . . . . . . . . . . . . . 0.00 10,081.44 0.00December 15, 2041 . . . . . . . . . . . . . . . . . . . . . . . . . . . 0.00 6,390.77 0.00January 15, 2042 . . . . . . . . . . . . . . . . . . . . . . . . . . . . . 0.00 2,785.60 0.00February 15, 2042
and after . . . . . . . . . . . . . . . . . . . . . . . . . . . . . . . . . 0.00 0.00 0.00
B-6
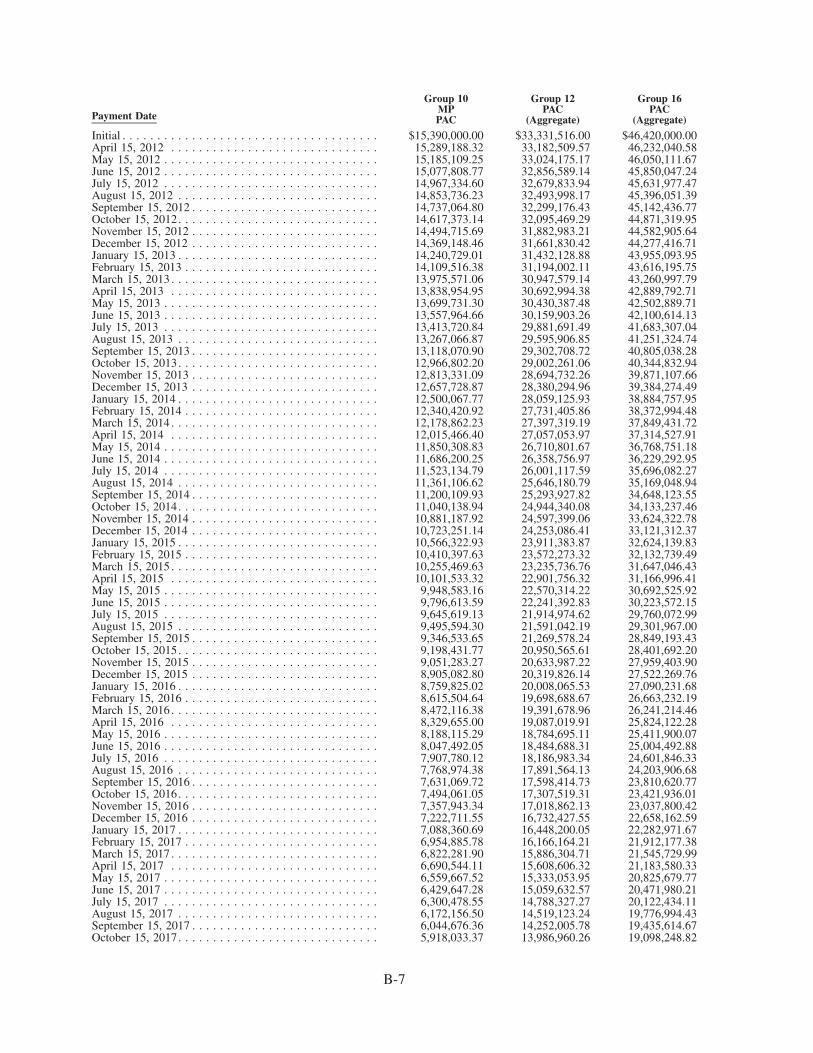
Payment Date
Group 10MPPAC
Group 12PAC
(Aggregate)
Group 16PAC
(Aggregate)
Initial . . . . . . . . . . . . . . . . . . . . . . . . . . . . . . . . . . . . . $15,390,000.00 $33,331,516.00 $46,420,000.00April 15, 2012 . . . . . . . . . . . . . . . . . . . . . . . . . . . . . . 15,289,188.32 33,182,509.57 46,232,040.58May 15, 2012 . . . . . . . . . . . . . . . . . . . . . . . . . . . . . . . 15,185,109.25 33,024,175.17 46,050,111.67June 15, 2012 . . . . . . . . . . . . . . . . . . . . . . . . . . . . . . . 15,077,808.77 32,856,589.14 45,850,047.24July 15, 2012 . . . . . . . . . . . . . . . . . . . . . . . . . . . . . . . 14,967,334.60 32,679,833.94 45,631,977.47August 15, 2012 . . . . . . . . . . . . . . . . . . . . . . . . . . . . . 14,853,736.23 32,493,998.17 45,396,051.39September 15, 2012 . . . . . . . . . . . . . . . . . . . . . . . . . . . 14,737,064.80 32,299,176.43 45,142,436.77October 15, 2012. . . . . . . . . . . . . . . . . . . . . . . . . . . . . 14,617,373.14 32,095,469.29 44,871,319.95November 15, 2012 . . . . . . . . . . . . . . . . . . . . . . . . . . . 14,494,715.69 31,882,983.21 44,582,905.64December 15, 2012 . . . . . . . . . . . . . . . . . . . . . . . . . . . 14,369,148.46 31,661,830.42 44,277,416.71January 15, 2013 . . . . . . . . . . . . . . . . . . . . . . . . . . . . . 14,240,729.01 31,432,128.88 43,955,093.95February 15, 2013 . . . . . . . . . . . . . . . . . . . . . . . . . . . . 14,109,516.38 31,194,002.11 43,616,195.75March 15, 2013 . . . . . . . . . . . . . . . . . . . . . . . . . . . . . . 13,975,571.06 30,947,579.14 43,260,997.79April 15, 2013 . . . . . . . . . . . . . . . . . . . . . . . . . . . . . . 13,838,954.95 30,692,994.38 42,889,792.71May 15, 2013 . . . . . . . . . . . . . . . . . . . . . . . . . . . . . . . 13,699,731.30 30,430,387.48 42,502,889.71June 15, 2013 . . . . . . . . . . . . . . . . . . . . . . . . . . . . . . . 13,557,964.66 30,159,903.26 42,100,614.13July 15, 2013 . . . . . . . . . . . . . . . . . . . . . . . . . . . . . . . 13,413,720.84 29,881,691.49 41,683,307.04August 15, 2013 . . . . . . . . . . . . . . . . . . . . . . . . . . . . . 13,267,066.87 29,595,906.85 41,251,324.74September 15, 2013 . . . . . . . . . . . . . . . . . . . . . . . . . . . 13,118,070.90 29,302,708.72 40,805,038.28October 15, 2013. . . . . . . . . . . . . . . . . . . . . . . . . . . . . 12,966,802.20 29,002,261.06 40,344,832.94November 15, 2013 . . . . . . . . . . . . . . . . . . . . . . . . . . . 12,813,331.09 28,694,732.26 39,871,107.66December 15, 2013 . . . . . . . . . . . . . . . . . . . . . . . . . . . 12,657,728.87 28,380,294.96 39,384,274.49January 15, 2014 . . . . . . . . . . . . . . . . . . . . . . . . . . . . . 12,500,067.77 28,059,125.93 38,884,757.95February 15, 2014 . . . . . . . . . . . . . . . . . . . . . . . . . . . . 12,340,420.92 27,731,405.86 38,372,994.48March 15, 2014 . . . . . . . . . . . . . . . . . . . . . . . . . . . . . . 12,178,862.23 27,397,319.19 37,849,431.72April 15, 2014 . . . . . . . . . . . . . . . . . . . . . . . . . . . . . . 12,015,466.40 27,057,053.97 37,314,527.91May 15, 2014 . . . . . . . . . . . . . . . . . . . . . . . . . . . . . . . 11,850,308.83 26,710,801.67 36,768,751.18June 15, 2014 . . . . . . . . . . . . . . . . . . . . . . . . . . . . . . . 11,686,200.25 26,358,756.97 36,229,292.95July 15, 2014 . . . . . . . . . . . . . . . . . . . . . . . . . . . . . . . 11,523,134.79 26,001,117.59 35,696,082.27August 15, 2014 . . . . . . . . . . . . . . . . . . . . . . . . . . . . . 11,361,106.62 25,646,180.79 35,169,048.94September 15, 2014 . . . . . . . . . . . . . . . . . . . . . . . . . . . 11,200,109.93 25,293,927.82 34,648,123.55October 15, 2014. . . . . . . . . . . . . . . . . . . . . . . . . . . . . 11,040,138.94 24,944,340.08 34,133,237.46November 15, 2014 . . . . . . . . . . . . . . . . . . . . . . . . . . . 10,881,187.92 24,597,399.06 33,624,322.78December 15, 2014 . . . . . . . . . . . . . . . . . . . . . . . . . . . 10,723,251.14 24,253,086.41 33,121,312.37January 15, 2015 . . . . . . . . . . . . . . . . . . . . . . . . . . . . . 10,566,322.93 23,911,383.87 32,624,139.83February 15, 2015 . . . . . . . . . . . . . . . . . . . . . . . . . . . . 10,410,397.63 23,572,273.32 32,132,739.49March 15, 2015 . . . . . . . . . . . . . . . . . . . . . . . . . . . . . . 10,255,469.63 23,235,736.76 31,647,046.43April 15, 2015 . . . . . . . . . . . . . . . . . . . . . . . . . . . . . . 10,101,533.32 22,901,756.32 31,166,996.41May 15, 2015 . . . . . . . . . . . . . . . . . . . . . . . . . . . . . . . 9,948,583.16 22,570,314.22 30,692,525.92June 15, 2015 . . . . . . . . . . . . . . . . . . . . . . . . . . . . . . . 9,796,613.59 22,241,392.83 30,223,572.15July 15, 2015 . . . . . . . . . . . . . . . . . . . . . . . . . . . . . . . 9,645,619.13 21,914,974.62 29,760,072.99August 15, 2015 . . . . . . . . . . . . . . . . . . . . . . . . . . . . . 9,495,594.30 21,591,042.19 29,301,967.00September 15, 2015 . . . . . . . . . . . . . . . . . . . . . . . . . . . 9,346,533.65 21,269,578.24 28,849,193.43October 15, 2015. . . . . . . . . . . . . . . . . . . . . . . . . . . . . 9,198,431.77 20,950,565.61 28,401,692.20November 15, 2015 . . . . . . . . . . . . . . . . . . . . . . . . . . . 9,051,283.27 20,633,987.22 27,959,403.90December 15, 2015 . . . . . . . . . . . . . . . . . . . . . . . . . . . 8,905,082.80 20,319,826.14 27,522,269.76January 15, 2016 . . . . . . . . . . . . . . . . . . . . . . . . . . . . . 8,759,825.02 20,008,065.53 27,090,231.68February 15, 2016 . . . . . . . . . . . . . . . . . . . . . . . . . . . . 8,615,504.64 19,698,688.67 26,663,232.19March 15, 2016 . . . . . . . . . . . . . . . . . . . . . . . . . . . . . . 8,472,116.38 19,391,678.96 26,241,214.46April 15, 2016 . . . . . . . . . . . . . . . . . . . . . . . . . . . . . . 8,329,655.00 19,087,019.91 25,824,122.28May 15, 2016 . . . . . . . . . . . . . . . . . . . . . . . . . . . . . . . 8,188,115.29 18,784,695.11 25,411,900.07June 15, 2016 . . . . . . . . . . . . . . . . . . . . . . . . . . . . . . . 8,047,492.05 18,484,688.31 25,004,492.88July 15, 2016 . . . . . . . . . . . . . . . . . . . . . . . . . . . . . . . 7,907,780.12 18,186,983.34 24,601,846.33August 15, 2016 . . . . . . . . . . . . . . . . . . . . . . . . . . . . . 7,768,974.38 17,891,564.13 24,203,906.68September 15, 2016 . . . . . . . . . . . . . . . . . . . . . . . . . . . 7,631,069.72 17,598,414.73 23,810,620.77October 15, 2016. . . . . . . . . . . . . . . . . . . . . . . . . . . . . 7,494,061.05 17,307,519.31 23,421,936.01November 15, 2016 . . . . . . . . . . . . . . . . . . . . . . . . . . . 7,357,943.34 17,018,862.13 23,037,800.42December 15, 2016 . . . . . . . . . . . . . . . . . . . . . . . . . . . 7,222,711.55 16,732,427.55 22,658,162.59January 15, 2017 . . . . . . . . . . . . . . . . . . . . . . . . . . . . . 7,088,360.69 16,448,200.05 22,282,971.67February 15, 2017 . . . . . . . . . . . . . . . . . . . . . . . . . . . . 6,954,885.78 16,166,164.21 21,912,177.38March 15, 2017 . . . . . . . . . . . . . . . . . . . . . . . . . . . . . . 6,822,281.90 15,886,304.71 21,545,729.99April 15, 2017 . . . . . . . . . . . . . . . . . . . . . . . . . . . . . . 6,690,544.11 15,608,606.32 21,183,580.33May 15, 2017 . . . . . . . . . . . . . . . . . . . . . . . . . . . . . . . 6,559,667.52 15,333,053.95 20,825,679.77June 15, 2017 . . . . . . . . . . . . . . . . . . . . . . . . . . . . . . . 6,429,647.28 15,059,632.57 20,471,980.21July 15, 2017 . . . . . . . . . . . . . . . . . . . . . . . . . . . . . . . 6,300,478.55 14,788,327.27 20,122,434.11August 15, 2017 . . . . . . . . . . . . . . . . . . . . . . . . . . . . . 6,172,156.50 14,519,123.24 19,776,994.43September 15, 2017 . . . . . . . . . . . . . . . . . . . . . . . . . . . 6,044,676.36 14,252,005.78 19,435,614.67October 15, 2017. . . . . . . . . . . . . . . . . . . . . . . . . . . . . 5,918,033.37 13,986,960.26 19,098,248.82
B-7
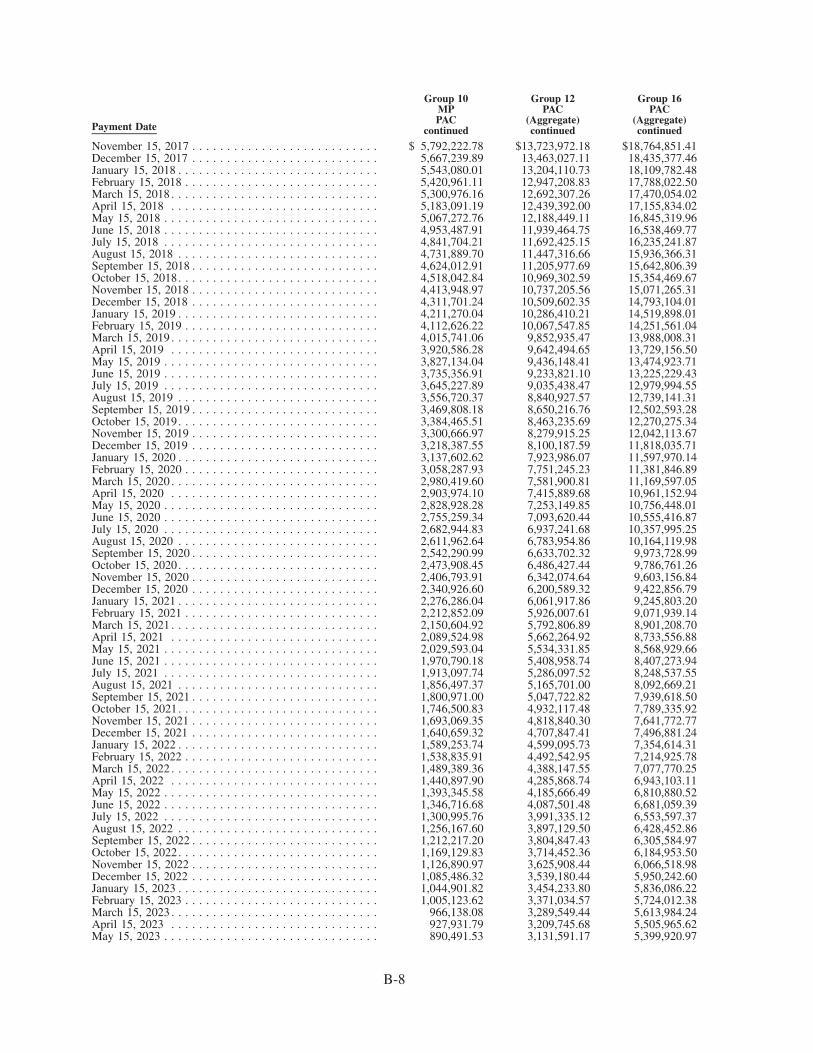
Payment Date
Group 10MPPAC
continued
Group 12PAC
(Aggregate)continued
Group 16PAC
(Aggregate)continued
November 15, 2017 . . . . . . . . . . . . . . . . . . . . . . . . . . . $ 5,792,222.78 $13,723,972.18 $18,764,851.41December 15, 2017 . . . . . . . . . . . . . . . . . . . . . . . . . . . 5,667,239.89 13,463,027.11 18,435,377.46January 15, 2018 . . . . . . . . . . . . . . . . . . . . . . . . . . . . . 5,543,080.01 13,204,110.73 18,109,782.48February 15, 2018 . . . . . . . . . . . . . . . . . . . . . . . . . . . . 5,420,961.11 12,947,208.83 17,788,022.50March 15, 2018 . . . . . . . . . . . . . . . . . . . . . . . . . . . . . . 5,300,976.16 12,692,307.26 17,470,054.02April 15, 2018 . . . . . . . . . . . . . . . . . . . . . . . . . . . . . . 5,183,091.19 12,439,392.00 17,155,834.02May 15, 2018 . . . . . . . . . . . . . . . . . . . . . . . . . . . . . . . 5,067,272.76 12,188,449.11 16,845,319.96June 15, 2018 . . . . . . . . . . . . . . . . . . . . . . . . . . . . . . . 4,953,487.91 11,939,464.75 16,538,469.77July 15, 2018 . . . . . . . . . . . . . . . . . . . . . . . . . . . . . . . 4,841,704.21 11,692,425.15 16,235,241.87August 15, 2018 . . . . . . . . . . . . . . . . . . . . . . . . . . . . . 4,731,889.70 11,447,316.66 15,936,366.31September 15, 2018 . . . . . . . . . . . . . . . . . . . . . . . . . . . 4,624,012.91 11,205,977.69 15,642,806.39October 15, 2018. . . . . . . . . . . . . . . . . . . . . . . . . . . . . 4,518,042.84 10,969,302.59 15,354,469.67November 15, 2018 . . . . . . . . . . . . . . . . . . . . . . . . . . . 4,413,948.97 10,737,205.56 15,071,265.31December 15, 2018 . . . . . . . . . . . . . . . . . . . . . . . . . . . 4,311,701.24 10,509,602.35 14,793,104.01January 15, 2019 . . . . . . . . . . . . . . . . . . . . . . . . . . . . . 4,211,270.04 10,286,410.21 14,519,898.01February 15, 2019 . . . . . . . . . . . . . . . . . . . . . . . . . . . . 4,112,626.22 10,067,547.85 14,251,561.04March 15, 2019 . . . . . . . . . . . . . . . . . . . . . . . . . . . . . . 4,015,741.06 9,852,935.47 13,988,008.31April 15, 2019 . . . . . . . . . . . . . . . . . . . . . . . . . . . . . . 3,920,586.28 9,642,494.65 13,729,156.50May 15, 2019 . . . . . . . . . . . . . . . . . . . . . . . . . . . . . . . 3,827,134.04 9,436,148.41 13,474,923.71June 15, 2019 . . . . . . . . . . . . . . . . . . . . . . . . . . . . . . . 3,735,356.91 9,233,821.10 13,225,229.43July 15, 2019 . . . . . . . . . . . . . . . . . . . . . . . . . . . . . . . 3,645,227.89 9,035,438.47 12,979,994.55August 15, 2019 . . . . . . . . . . . . . . . . . . . . . . . . . . . . . 3,556,720.37 8,840,927.57 12,739,141.31September 15, 2019 . . . . . . . . . . . . . . . . . . . . . . . . . . . 3,469,808.18 8,650,216.76 12,502,593.28October 15, 2019. . . . . . . . . . . . . . . . . . . . . . . . . . . . . 3,384,465.51 8,463,235.69 12,270,275.34November 15, 2019 . . . . . . . . . . . . . . . . . . . . . . . . . . . 3,300,666.97 8,279,915.25 12,042,113.67December 15, 2019 . . . . . . . . . . . . . . . . . . . . . . . . . . . 3,218,387.55 8,100,187.59 11,818,035.71January 15, 2020 . . . . . . . . . . . . . . . . . . . . . . . . . . . . . 3,137,602.62 7,923,986.07 11,597,970.14February 15, 2020 . . . . . . . . . . . . . . . . . . . . . . . . . . . . 3,058,287.93 7,751,245.23 11,381,846.89March 15, 2020 . . . . . . . . . . . . . . . . . . . . . . . . . . . . . . 2,980,419.60 7,581,900.81 11,169,597.05April 15, 2020 . . . . . . . . . . . . . . . . . . . . . . . . . . . . . . 2,903,974.10 7,415,889.68 10,961,152.94May 15, 2020 . . . . . . . . . . . . . . . . . . . . . . . . . . . . . . . 2,828,928.28 7,253,149.85 10,756,448.01June 15, 2020 . . . . . . . . . . . . . . . . . . . . . . . . . . . . . . . 2,755,259.34 7,093,620.44 10,555,416.87July 15, 2020 . . . . . . . . . . . . . . . . . . . . . . . . . . . . . . . 2,682,944.83 6,937,241.68 10,357,995.25August 15, 2020 . . . . . . . . . . . . . . . . . . . . . . . . . . . . . 2,611,962.64 6,783,954.86 10,164,119.98September 15, 2020 . . . . . . . . . . . . . . . . . . . . . . . . . . . 2,542,290.99 6,633,702.32 9,973,728.99October 15, 2020. . . . . . . . . . . . . . . . . . . . . . . . . . . . . 2,473,908.45 6,486,427.44 9,786,761.26November 15, 2020 . . . . . . . . . . . . . . . . . . . . . . . . . . . 2,406,793.91 6,342,074.64 9,603,156.84December 15, 2020 . . . . . . . . . . . . . . . . . . . . . . . . . . . 2,340,926.60 6,200,589.32 9,422,856.79January 15, 2021 . . . . . . . . . . . . . . . . . . . . . . . . . . . . . 2,276,286.04 6,061,917.86 9,245,803.20February 15, 2021 . . . . . . . . . . . . . . . . . . . . . . . . . . . . 2,212,852.09 5,926,007.61 9,071,939.14March 15, 2021 . . . . . . . . . . . . . . . . . . . . . . . . . . . . . . 2,150,604.92 5,792,806.89 8,901,208.70April 15, 2021 . . . . . . . . . . . . . . . . . . . . . . . . . . . . . . 2,089,524.98 5,662,264.92 8,733,556.88May 15, 2021 . . . . . . . . . . . . . . . . . . . . . . . . . . . . . . . 2,029,593.04 5,534,331.85 8,568,929.66June 15, 2021 . . . . . . . . . . . . . . . . . . . . . . . . . . . . . . . 1,970,790.18 5,408,958.74 8,407,273.94July 15, 2021 . . . . . . . . . . . . . . . . . . . . . . . . . . . . . . . 1,913,097.74 5,286,097.52 8,248,537.55August 15, 2021 . . . . . . . . . . . . . . . . . . . . . . . . . . . . . 1,856,497.37 5,165,701.00 8,092,669.21September 15, 2021 . . . . . . . . . . . . . . . . . . . . . . . . . . . 1,800,971.00 5,047,722.82 7,939,618.50October 15, 2021. . . . . . . . . . . . . . . . . . . . . . . . . . . . . 1,746,500.83 4,932,117.48 7,789,335.92November 15, 2021 . . . . . . . . . . . . . . . . . . . . . . . . . . . 1,693,069.35 4,818,840.30 7,641,772.77December 15, 2021 . . . . . . . . . . . . . . . . . . . . . . . . . . . 1,640,659.32 4,707,847.41 7,496,881.24January 15, 2022 . . . . . . . . . . . . . . . . . . . . . . . . . . . . . 1,589,253.74 4,599,095.73 7,354,614.31February 15, 2022 . . . . . . . . . . . . . . . . . . . . . . . . . . . . 1,538,835.91 4,492,542.95 7,214,925.78March 15, 2022 . . . . . . . . . . . . . . . . . . . . . . . . . . . . . . 1,489,389.36 4,388,147.55 7,077,770.25April 15, 2022 . . . . . . . . . . . . . . . . . . . . . . . . . . . . . . 1,440,897.90 4,285,868.74 6,943,103.11May 15, 2022 . . . . . . . . . . . . . . . . . . . . . . . . . . . . . . . 1,393,345.58 4,185,666.49 6,810,880.52June 15, 2022 . . . . . . . . . . . . . . . . . . . . . . . . . . . . . . . 1,346,716.68 4,087,501.48 6,681,059.39July 15, 2022 . . . . . . . . . . . . . . . . . . . . . . . . . . . . . . . 1,300,995.76 3,991,335.12 6,553,597.37August 15, 2022 . . . . . . . . . . . . . . . . . . . . . . . . . . . . . 1,256,167.60 3,897,129.50 6,428,452.86September 15, 2022 . . . . . . . . . . . . . . . . . . . . . . . . . . . 1,212,217.20 3,804,847.43 6,305,584.97October 15, 2022. . . . . . . . . . . . . . . . . . . . . . . . . . . . . 1,169,129.83 3,714,452.36 6,184,953.50November 15, 2022 . . . . . . . . . . . . . . . . . . . . . . . . . . . 1,126,890.97 3,625,908.44 6,066,518.98December 15, 2022 . . . . . . . . . . . . . . . . . . . . . . . . . . . 1,085,486.32 3,539,180.44 5,950,242.60January 15, 2023 . . . . . . . . . . . . . . . . . . . . . . . . . . . . . 1,044,901.82 3,454,233.80 5,836,086.22February 15, 2023 . . . . . . . . . . . . . . . . . . . . . . . . . . . . 1,005,123.62 3,371,034.57 5,724,012.38March 15, 2023 . . . . . . . . . . . . . . . . . . . . . . . . . . . . . . 966,138.08 3,289,549.44 5,613,984.24April 15, 2023 . . . . . . . . . . . . . . . . . . . . . . . . . . . . . . 927,931.79 3,209,745.68 5,505,965.62May 15, 2023 . . . . . . . . . . . . . . . . . . . . . . . . . . . . . . . 890,491.53 3,131,591.17 5,399,920.97
B-8
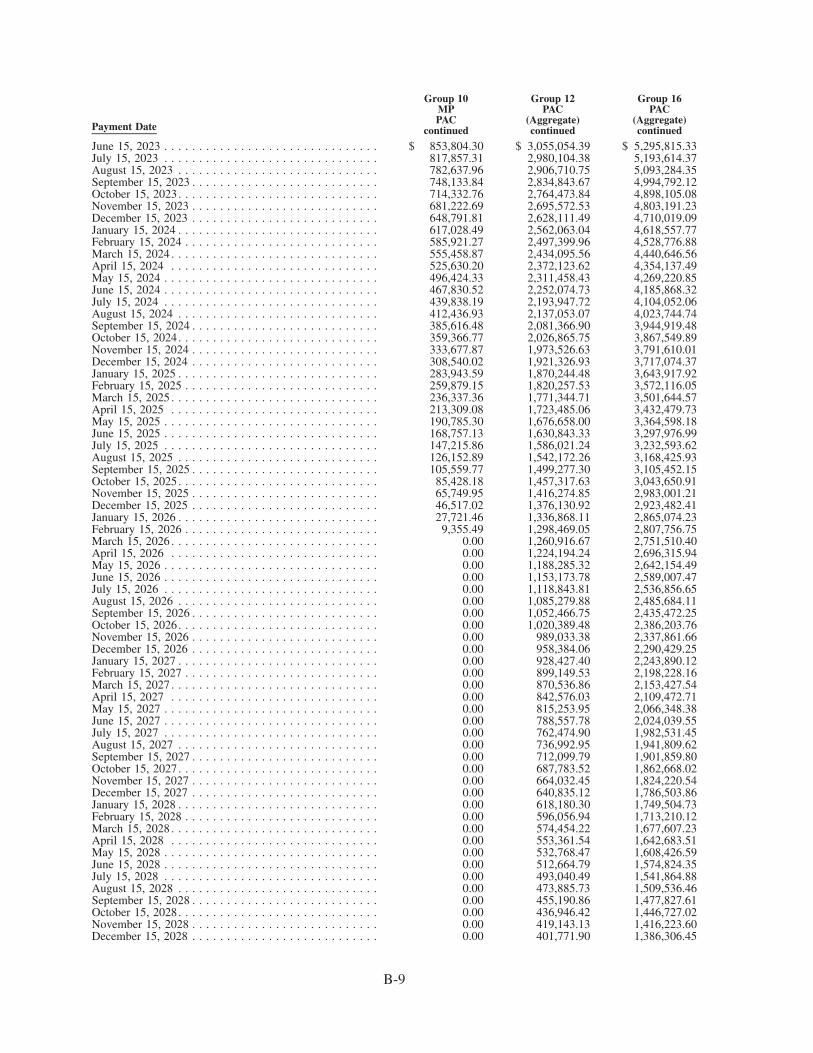
Payment Date
Group 10MPPAC
continued
Group 12PAC
(Aggregate)continued
Group 16PAC
(Aggregate)continued
June 15, 2023 . . . . . . . . . . . . . . . . . . . . . . . . . . . . . . . $ 853,804.30 $ 3,055,054.39 $ 5,295,815.33July 15, 2023 . . . . . . . . . . . . . . . . . . . . . . . . . . . . . . . 817,857.31 2,980,104.38 5,193,614.37August 15, 2023 . . . . . . . . . . . . . . . . . . . . . . . . . . . . . 782,637.96 2,906,710.75 5,093,284.35September 15, 2023 . . . . . . . . . . . . . . . . . . . . . . . . . . . 748,133.84 2,834,843.67 4,994,792.12October 15, 2023. . . . . . . . . . . . . . . . . . . . . . . . . . . . . 714,332.76 2,764,473.84 4,898,105.08November 15, 2023 . . . . . . . . . . . . . . . . . . . . . . . . . . . 681,222.69 2,695,572.53 4,803,191.23December 15, 2023 . . . . . . . . . . . . . . . . . . . . . . . . . . . 648,791.81 2,628,111.49 4,710,019.09January 15, 2024 . . . . . . . . . . . . . . . . . . . . . . . . . . . . . 617,028.49 2,562,063.04 4,618,557.77February 15, 2024 . . . . . . . . . . . . . . . . . . . . . . . . . . . . 585,921.27 2,497,399.96 4,528,776.88March 15, 2024 . . . . . . . . . . . . . . . . . . . . . . . . . . . . . . 555,458.87 2,434,095.56 4,440,646.56April 15, 2024 . . . . . . . . . . . . . . . . . . . . . . . . . . . . . . 525,630.20 2,372,123.62 4,354,137.49May 15, 2024 . . . . . . . . . . . . . . . . . . . . . . . . . . . . . . . 496,424.33 2,311,458.43 4,269,220.85June 15, 2024 . . . . . . . . . . . . . . . . . . . . . . . . . . . . . . . 467,830.52 2,252,074.73 4,185,868.32July 15, 2024 . . . . . . . . . . . . . . . . . . . . . . . . . . . . . . . 439,838.19 2,193,947.72 4,104,052.06August 15, 2024 . . . . . . . . . . . . . . . . . . . . . . . . . . . . . 412,436.93 2,137,053.07 4,023,744.74September 15, 2024 . . . . . . . . . . . . . . . . . . . . . . . . . . . 385,616.48 2,081,366.90 3,944,919.48October 15, 2024. . . . . . . . . . . . . . . . . . . . . . . . . . . . . 359,366.77 2,026,865.75 3,867,549.89November 15, 2024 . . . . . . . . . . . . . . . . . . . . . . . . . . . 333,677.87 1,973,526.63 3,791,610.01December 15, 2024 . . . . . . . . . . . . . . . . . . . . . . . . . . . 308,540.02 1,921,326.93 3,717,074.37January 15, 2025 . . . . . . . . . . . . . . . . . . . . . . . . . . . . . 283,943.59 1,870,244.48 3,643,917.92February 15, 2025 . . . . . . . . . . . . . . . . . . . . . . . . . . . . 259,879.15 1,820,257.53 3,572,116.05March 15, 2025 . . . . . . . . . . . . . . . . . . . . . . . . . . . . . . 236,337.36 1,771,344.71 3,501,644.57April 15, 2025 . . . . . . . . . . . . . . . . . . . . . . . . . . . . . . 213,309.08 1,723,485.06 3,432,479.73May 15, 2025 . . . . . . . . . . . . . . . . . . . . . . . . . . . . . . . 190,785.30 1,676,658.00 3,364,598.18June 15, 2025 . . . . . . . . . . . . . . . . . . . . . . . . . . . . . . . 168,757.13 1,630,843.33 3,297,976.99July 15, 2025 . . . . . . . . . . . . . . . . . . . . . . . . . . . . . . . 147,215.86 1,586,021.24 3,232,593.62August 15, 2025 . . . . . . . . . . . . . . . . . . . . . . . . . . . . . 126,152.89 1,542,172.26 3,168,425.93September 15, 2025 . . . . . . . . . . . . . . . . . . . . . . . . . . . 105,559.77 1,499,277.30 3,105,452.15October 15, 2025. . . . . . . . . . . . . . . . . . . . . . . . . . . . . 85,428.18 1,457,317.63 3,043,650.91November 15, 2025 . . . . . . . . . . . . . . . . . . . . . . . . . . . 65,749.95 1,416,274.85 2,983,001.21December 15, 2025 . . . . . . . . . . . . . . . . . . . . . . . . . . . 46,517.02 1,376,130.92 2,923,482.41January 15, 2026 . . . . . . . . . . . . . . . . . . . . . . . . . . . . . 27,721.46 1,336,868.11 2,865,074.23February 15, 2026 . . . . . . . . . . . . . . . . . . . . . . . . . . . . 9,355.49 1,298,469.05 2,807,756.75March 15, 2026 . . . . . . . . . . . . . . . . . . . . . . . . . . . . . . 0.00 1,260,916.67 2,751,510.40April 15, 2026 . . . . . . . . . . . . . . . . . . . . . . . . . . . . . . 0.00 1,224,194.24 2,696,315.94May 15, 2026 . . . . . . . . . . . . . . . . . . . . . . . . . . . . . . . 0.00 1,188,285.32 2,642,154.49June 15, 2026 . . . . . . . . . . . . . . . . . . . . . . . . . . . . . . . 0.00 1,153,173.78 2,589,007.47July 15, 2026 . . . . . . . . . . . . . . . . . . . . . . . . . . . . . . . 0.00 1,118,843.81 2,536,856.65August 15, 2026 . . . . . . . . . . . . . . . . . . . . . . . . . . . . . 0.00 1,085,279.88 2,485,684.11September 15, 2026 . . . . . . . . . . . . . . . . . . . . . . . . . . . 0.00 1,052,466.75 2,435,472.25October 15, 2026. . . . . . . . . . . . . . . . . . . . . . . . . . . . . 0.00 1,020,389.48 2,386,203.76November 15, 2026 . . . . . . . . . . . . . . . . . . . . . . . . . . . 0.00 989,033.38 2,337,861.66December 15, 2026 . . . . . . . . . . . . . . . . . . . . . . . . . . . 0.00 958,384.06 2,290,429.25January 15, 2027 . . . . . . . . . . . . . . . . . . . . . . . . . . . . . 0.00 928,427.40 2,243,890.12February 15, 2027 . . . . . . . . . . . . . . . . . . . . . . . . . . . . 0.00 899,149.53 2,198,228.16March 15, 2027 . . . . . . . . . . . . . . . . . . . . . . . . . . . . . . 0.00 870,536.86 2,153,427.54April 15, 2027 . . . . . . . . . . . . . . . . . . . . . . . . . . . . . . 0.00 842,576.03 2,109,472.71May 15, 2027 . . . . . . . . . . . . . . . . . . . . . . . . . . . . . . . 0.00 815,253.95 2,066,348.38June 15, 2027 . . . . . . . . . . . . . . . . . . . . . . . . . . . . . . . 0.00 788,557.78 2,024,039.55July 15, 2027 . . . . . . . . . . . . . . . . . . . . . . . . . . . . . . . 0.00 762,474.90 1,982,531.45August 15, 2027 . . . . . . . . . . . . . . . . . . . . . . . . . . . . . 0.00 736,992.95 1,941,809.62September 15, 2027 . . . . . . . . . . . . . . . . . . . . . . . . . . . 0.00 712,099.79 1,901,859.80October 15, 2027. . . . . . . . . . . . . . . . . . . . . . . . . . . . . 0.00 687,783.52 1,862,668.02November 15, 2027 . . . . . . . . . . . . . . . . . . . . . . . . . . . 0.00 664,032.45 1,824,220.54December 15, 2027 . . . . . . . . . . . . . . . . . . . . . . . . . . . 0.00 640,835.12 1,786,503.86January 15, 2028 . . . . . . . . . . . . . . . . . . . . . . . . . . . . . 0.00 618,180.30 1,749,504.73February 15, 2028 . . . . . . . . . . . . . . . . . . . . . . . . . . . . 0.00 596,056.94 1,713,210.12March 15, 2028 . . . . . . . . . . . . . . . . . . . . . . . . . . . . . . 0.00 574,454.22 1,677,607.23April 15, 2028 . . . . . . . . . . . . . . . . . . . . . . . . . . . . . . 0.00 553,361.54 1,642,683.51May 15, 2028 . . . . . . . . . . . . . . . . . . . . . . . . . . . . . . . 0.00 532,768.47 1,608,426.59June 15, 2028 . . . . . . . . . . . . . . . . . . . . . . . . . . . . . . . 0.00 512,664.79 1,574,824.35July 15, 2028 . . . . . . . . . . . . . . . . . . . . . . . . . . . . . . . 0.00 493,040.49 1,541,864.88August 15, 2028 . . . . . . . . . . . . . . . . . . . . . . . . . . . . . 0.00 473,885.73 1,509,536.46September 15, 2028 . . . . . . . . . . . . . . . . . . . . . . . . . . . 0.00 455,190.86 1,477,827.61October 15, 2028. . . . . . . . . . . . . . . . . . . . . . . . . . . . . 0.00 436,946.42 1,446,727.02November 15, 2028 . . . . . . . . . . . . . . . . . . . . . . . . . . . 0.00 419,143.13 1,416,223.60December 15, 2028 . . . . . . . . . . . . . . . . . . . . . . . . . . . 0.00 401,771.90 1,386,306.45
B-9
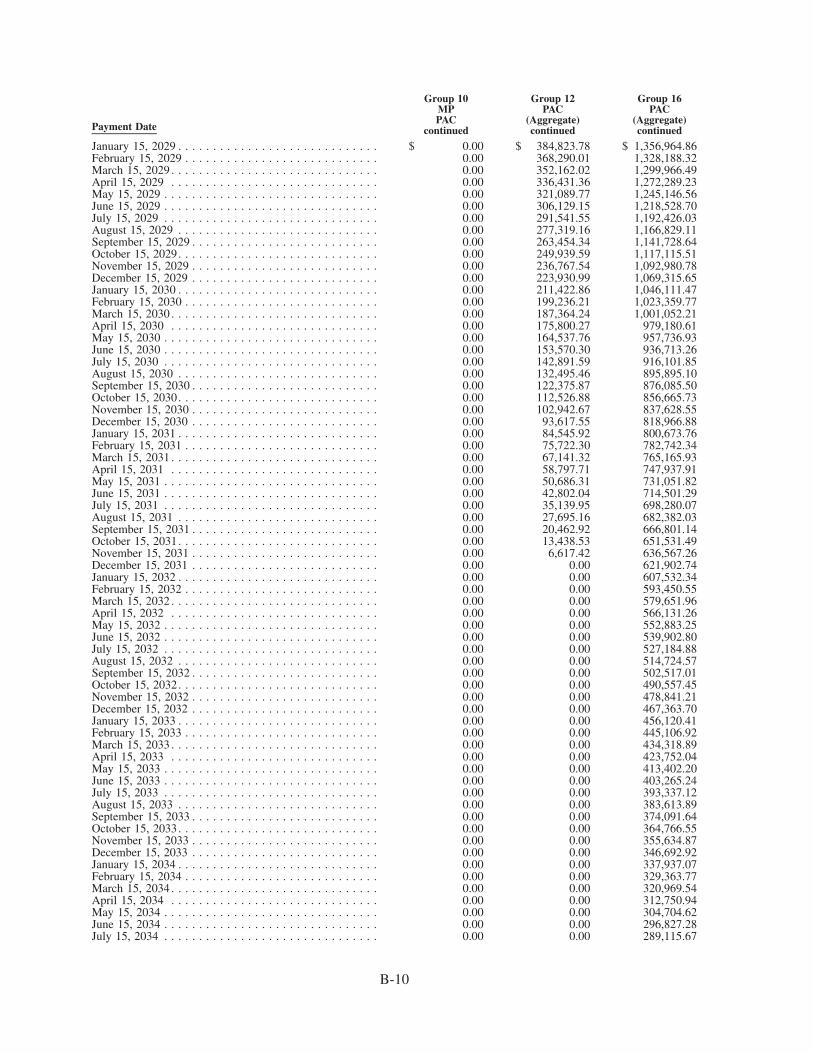
Payment Date
Group 10MPPAC
continued
Group 12PAC
(Aggregate)continued
Group 16PAC
(Aggregate)continued
January 15, 2029 . . . . . . . . . . . . . . . . . . . . . . . . . . . . . $ 0.00 $ 384,823.78 $ 1,356,964.86February 15, 2029 . . . . . . . . . . . . . . . . . . . . . . . . . . . . 0.00 368,290.01 1,328,188.32March 15, 2029 . . . . . . . . . . . . . . . . . . . . . . . . . . . . . . 0.00 352,162.02 1,299,966.49April 15, 2029 . . . . . . . . . . . . . . . . . . . . . . . . . . . . . . 0.00 336,431.36 1,272,289.23May 15, 2029 . . . . . . . . . . . . . . . . . . . . . . . . . . . . . . . 0.00 321,089.77 1,245,146.56June 15, 2029 . . . . . . . . . . . . . . . . . . . . . . . . . . . . . . . 0.00 306,129.15 1,218,528.70July 15, 2029 . . . . . . . . . . . . . . . . . . . . . . . . . . . . . . . 0.00 291,541.55 1,192,426.03August 15, 2029 . . . . . . . . . . . . . . . . . . . . . . . . . . . . . 0.00 277,319.16 1,166,829.11September 15, 2029 . . . . . . . . . . . . . . . . . . . . . . . . . . . 0.00 263,454.34 1,141,728.64October 15, 2029. . . . . . . . . . . . . . . . . . . . . . . . . . . . . 0.00 249,939.59 1,117,115.51November 15, 2029 . . . . . . . . . . . . . . . . . . . . . . . . . . . 0.00 236,767.54 1,092,980.78December 15, 2029 . . . . . . . . . . . . . . . . . . . . . . . . . . . 0.00 223,930.99 1,069,315.65January 15, 2030 . . . . . . . . . . . . . . . . . . . . . . . . . . . . . 0.00 211,422.86 1,046,111.47February 15, 2030 . . . . . . . . . . . . . . . . . . . . . . . . . . . . 0.00 199,236.21 1,023,359.77March 15, 2030 . . . . . . . . . . . . . . . . . . . . . . . . . . . . . . 0.00 187,364.24 1,001,052.21April 15, 2030 . . . . . . . . . . . . . . . . . . . . . . . . . . . . . . 0.00 175,800.27 979,180.61May 15, 2030 . . . . . . . . . . . . . . . . . . . . . . . . . . . . . . . 0.00 164,537.76 957,736.93June 15, 2030 . . . . . . . . . . . . . . . . . . . . . . . . . . . . . . . 0.00 153,570.30 936,713.26July 15, 2030 . . . . . . . . . . . . . . . . . . . . . . . . . . . . . . . 0.00 142,891.59 916,101.85August 15, 2030 . . . . . . . . . . . . . . . . . . . . . . . . . . . . . 0.00 132,495.46 895,895.10September 15, 2030 . . . . . . . . . . . . . . . . . . . . . . . . . . . 0.00 122,375.87 876,085.50October 15, 2030. . . . . . . . . . . . . . . . . . . . . . . . . . . . . 0.00 112,526.88 856,665.73November 15, 2030 . . . . . . . . . . . . . . . . . . . . . . . . . . . 0.00 102,942.67 837,628.55December 15, 2030 . . . . . . . . . . . . . . . . . . . . . . . . . . . 0.00 93,617.55 818,966.88January 15, 2031 . . . . . . . . . . . . . . . . . . . . . . . . . . . . . 0.00 84,545.92 800,673.76February 15, 2031 . . . . . . . . . . . . . . . . . . . . . . . . . . . . 0.00 75,722.30 782,742.34March 15, 2031 . . . . . . . . . . . . . . . . . . . . . . . . . . . . . . 0.00 67,141.32 765,165.93April 15, 2031 . . . . . . . . . . . . . . . . . . . . . . . . . . . . . . 0.00 58,797.71 747,937.91May 15, 2031 . . . . . . . . . . . . . . . . . . . . . . . . . . . . . . . 0.00 50,686.31 731,051.82June 15, 2031 . . . . . . . . . . . . . . . . . . . . . . . . . . . . . . . 0.00 42,802.04 714,501.29July 15, 2031 . . . . . . . . . . . . . . . . . . . . . . . . . . . . . . . 0.00 35,139.95 698,280.07August 15, 2031 . . . . . . . . . . . . . . . . . . . . . . . . . . . . . 0.00 27,695.16 682,382.03September 15, 2031 . . . . . . . . . . . . . . . . . . . . . . . . . . . 0.00 20,462.92 666,801.14October 15, 2031. . . . . . . . . . . . . . . . . . . . . . . . . . . . . 0.00 13,438.53 651,531.49November 15, 2031 . . . . . . . . . . . . . . . . . . . . . . . . . . . 0.00 6,617.42 636,567.26December 15, 2031 . . . . . . . . . . . . . . . . . . . . . . . . . . . 0.00 0.00 621,902.74January 15, 2032 . . . . . . . . . . . . . . . . . . . . . . . . . . . . . 0.00 0.00 607,532.34February 15, 2032 . . . . . . . . . . . . . . . . . . . . . . . . . . . . 0.00 0.00 593,450.55March 15, 2032 . . . . . . . . . . . . . . . . . . . . . . . . . . . . . . 0.00 0.00 579,651.96April 15, 2032 . . . . . . . . . . . . . . . . . . . . . . . . . . . . . . 0.00 0.00 566,131.26May 15, 2032 . . . . . . . . . . . . . . . . . . . . . . . . . . . . . . . 0.00 0.00 552,883.25June 15, 2032 . . . . . . . . . . . . . . . . . . . . . . . . . . . . . . . 0.00 0.00 539,902.80July 15, 2032 . . . . . . . . . . . . . . . . . . . . . . . . . . . . . . . 0.00 0.00 527,184.88August 15, 2032 . . . . . . . . . . . . . . . . . . . . . . . . . . . . . 0.00 0.00 514,724.57September 15, 2032 . . . . . . . . . . . . . . . . . . . . . . . . . . . 0.00 0.00 502,517.01October 15, 2032. . . . . . . . . . . . . . . . . . . . . . . . . . . . . 0.00 0.00 490,557.45November 15, 2032 . . . . . . . . . . . . . . . . . . . . . . . . . . . 0.00 0.00 478,841.21December 15, 2032 . . . . . . . . . . . . . . . . . . . . . . . . . . . 0.00 0.00 467,363.70January 15, 2033 . . . . . . . . . . . . . . . . . . . . . . . . . . . . . 0.00 0.00 456,120.41February 15, 2033 . . . . . . . . . . . . . . . . . . . . . . . . . . . . 0.00 0.00 445,106.92March 15, 2033 . . . . . . . . . . . . . . . . . . . . . . . . . . . . . . 0.00 0.00 434,318.89April 15, 2033 . . . . . . . . . . . . . . . . . . . . . . . . . . . . . . 0.00 0.00 423,752.04May 15, 2033 . . . . . . . . . . . . . . . . . . . . . . . . . . . . . . . 0.00 0.00 413,402.20June 15, 2033 . . . . . . . . . . . . . . . . . . . . . . . . . . . . . . . 0.00 0.00 403,265.24July 15, 2033 . . . . . . . . . . . . . . . . . . . . . . . . . . . . . . . 0.00 0.00 393,337.12August 15, 2033 . . . . . . . . . . . . . . . . . . . . . . . . . . . . . 0.00 0.00 383,613.89September 15, 2033 . . . . . . . . . . . . . . . . . . . . . . . . . . . 0.00 0.00 374,091.64October 15, 2033. . . . . . . . . . . . . . . . . . . . . . . . . . . . . 0.00 0.00 364,766.55November 15, 2033 . . . . . . . . . . . . . . . . . . . . . . . . . . . 0.00 0.00 355,634.87December 15, 2033 . . . . . . . . . . . . . . . . . . . . . . . . . . . 0.00 0.00 346,692.92January 15, 2034 . . . . . . . . . . . . . . . . . . . . . . . . . . . . . 0.00 0.00 337,937.07February 15, 2034 . . . . . . . . . . . . . . . . . . . . . . . . . . . . 0.00 0.00 329,363.77March 15, 2034 . . . . . . . . . . . . . . . . . . . . . . . . . . . . . . 0.00 0.00 320,969.54April 15, 2034 . . . . . . . . . . . . . . . . . . . . . . . . . . . . . . 0.00 0.00 312,750.94May 15, 2034 . . . . . . . . . . . . . . . . . . . . . . . . . . . . . . . 0.00 0.00 304,704.62June 15, 2034 . . . . . . . . . . . . . . . . . . . . . . . . . . . . . . . 0.00 0.00 296,827.28July 15, 2034 . . . . . . . . . . . . . . . . . . . . . . . . . . . . . . . 0.00 0.00 289,115.67
B-10
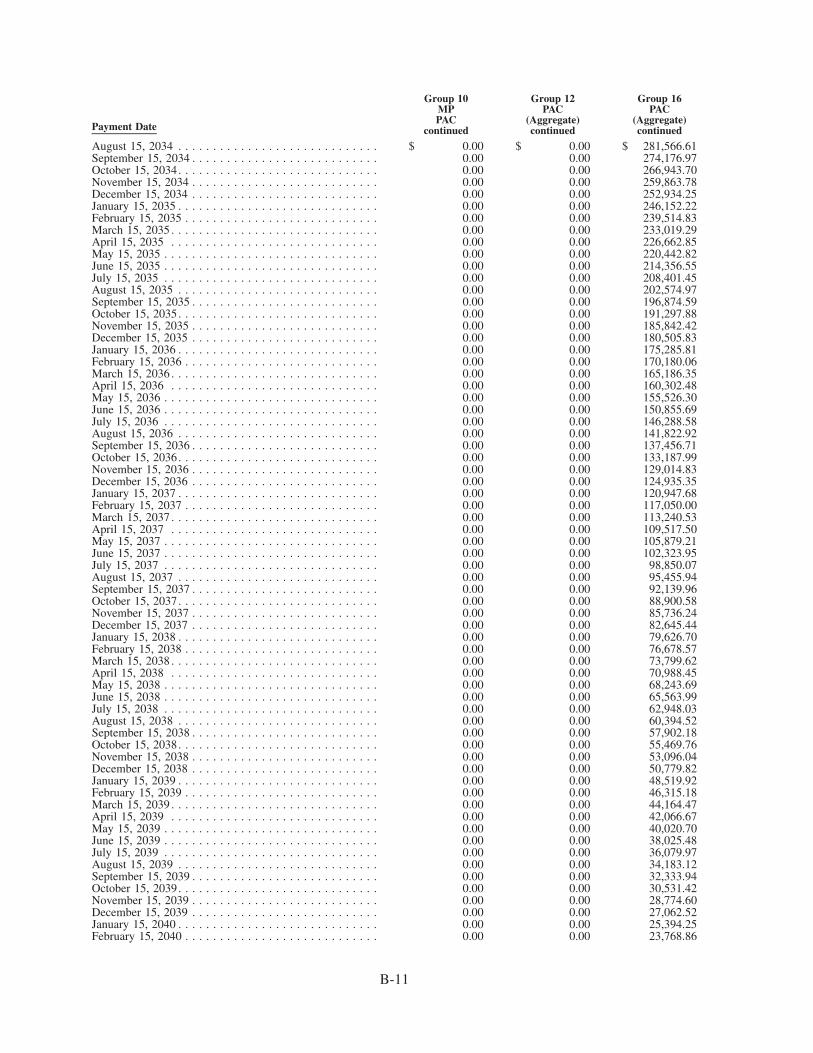
Payment Date
Group 10MPPAC
continued
Group 12PAC
(Aggregate)continued
Group 16PAC
(Aggregate)continued
August 15, 2034 . . . . . . . . . . . . . . . . . . . . . . . . . . . . . $ 0.00 $ 0.00 $ 281,566.61September 15, 2034 . . . . . . . . . . . . . . . . . . . . . . . . . . . 0.00 0.00 274,176.97October 15, 2034. . . . . . . . . . . . . . . . . . . . . . . . . . . . . 0.00 0.00 266,943.70November 15, 2034 . . . . . . . . . . . . . . . . . . . . . . . . . . . 0.00 0.00 259,863.78December 15, 2034 . . . . . . . . . . . . . . . . . . . . . . . . . . . 0.00 0.00 252,934.25January 15, 2035 . . . . . . . . . . . . . . . . . . . . . . . . . . . . . 0.00 0.00 246,152.22February 15, 2035 . . . . . . . . . . . . . . . . . . . . . . . . . . . . 0.00 0.00 239,514.83March 15, 2035 . . . . . . . . . . . . . . . . . . . . . . . . . . . . . . 0.00 0.00 233,019.29April 15, 2035 . . . . . . . . . . . . . . . . . . . . . . . . . . . . . . 0.00 0.00 226,662.85May 15, 2035 . . . . . . . . . . . . . . . . . . . . . . . . . . . . . . . 0.00 0.00 220,442.82June 15, 2035 . . . . . . . . . . . . . . . . . . . . . . . . . . . . . . . 0.00 0.00 214,356.55July 15, 2035 . . . . . . . . . . . . . . . . . . . . . . . . . . . . . . . 0.00 0.00 208,401.45August 15, 2035 . . . . . . . . . . . . . . . . . . . . . . . . . . . . . 0.00 0.00 202,574.97September 15, 2035 . . . . . . . . . . . . . . . . . . . . . . . . . . . 0.00 0.00 196,874.59October 15, 2035. . . . . . . . . . . . . . . . . . . . . . . . . . . . . 0.00 0.00 191,297.88November 15, 2035 . . . . . . . . . . . . . . . . . . . . . . . . . . . 0.00 0.00 185,842.42December 15, 2035 . . . . . . . . . . . . . . . . . . . . . . . . . . . 0.00 0.00 180,505.83January 15, 2036 . . . . . . . . . . . . . . . . . . . . . . . . . . . . . 0.00 0.00 175,285.81February 15, 2036 . . . . . . . . . . . . . . . . . . . . . . . . . . . . 0.00 0.00 170,180.06March 15, 2036 . . . . . . . . . . . . . . . . . . . . . . . . . . . . . . 0.00 0.00 165,186.35April 15, 2036 . . . . . . . . . . . . . . . . . . . . . . . . . . . . . . 0.00 0.00 160,302.48May 15, 2036 . . . . . . . . . . . . . . . . . . . . . . . . . . . . . . . 0.00 0.00 155,526.30June 15, 2036 . . . . . . . . . . . . . . . . . . . . . . . . . . . . . . . 0.00 0.00 150,855.69July 15, 2036 . . . . . . . . . . . . . . . . . . . . . . . . . . . . . . . 0.00 0.00 146,288.58August 15, 2036 . . . . . . . . . . . . . . . . . . . . . . . . . . . . . 0.00 0.00 141,822.92September 15, 2036 . . . . . . . . . . . . . . . . . . . . . . . . . . . 0.00 0.00 137,456.71October 15, 2036. . . . . . . . . . . . . . . . . . . . . . . . . . . . . 0.00 0.00 133,187.99November 15, 2036 . . . . . . . . . . . . . . . . . . . . . . . . . . . 0.00 0.00 129,014.83December 15, 2036 . . . . . . . . . . . . . . . . . . . . . . . . . . . 0.00 0.00 124,935.35January 15, 2037 . . . . . . . . . . . . . . . . . . . . . . . . . . . . . 0.00 0.00 120,947.68February 15, 2037 . . . . . . . . . . . . . . . . . . . . . . . . . . . . 0.00 0.00 117,050.00March 15, 2037 . . . . . . . . . . . . . . . . . . . . . . . . . . . . . . 0.00 0.00 113,240.53April 15, 2037 . . . . . . . . . . . . . . . . . . . . . . . . . . . . . . 0.00 0.00 109,517.50May 15, 2037 . . . . . . . . . . . . . . . . . . . . . . . . . . . . . . . 0.00 0.00 105,879.21June 15, 2037 . . . . . . . . . . . . . . . . . . . . . . . . . . . . . . . 0.00 0.00 102,323.95July 15, 2037 . . . . . . . . . . . . . . . . . . . . . . . . . . . . . . . 0.00 0.00 98,850.07August 15, 2037 . . . . . . . . . . . . . . . . . . . . . . . . . . . . . 0.00 0.00 95,455.94September 15, 2037 . . . . . . . . . . . . . . . . . . . . . . . . . . . 0.00 0.00 92,139.96October 15, 2037. . . . . . . . . . . . . . . . . . . . . . . . . . . . . 0.00 0.00 88,900.58November 15, 2037 . . . . . . . . . . . . . . . . . . . . . . . . . . . 0.00 0.00 85,736.24December 15, 2037 . . . . . . . . . . . . . . . . . . . . . . . . . . . 0.00 0.00 82,645.44January 15, 2038 . . . . . . . . . . . . . . . . . . . . . . . . . . . . . 0.00 0.00 79,626.70February 15, 2038 . . . . . . . . . . . . . . . . . . . . . . . . . . . . 0.00 0.00 76,678.57March 15, 2038 . . . . . . . . . . . . . . . . . . . . . . . . . . . . . . 0.00 0.00 73,799.62April 15, 2038 . . . . . . . . . . . . . . . . . . . . . . . . . . . . . . 0.00 0.00 70,988.45May 15, 2038 . . . . . . . . . . . . . . . . . . . . . . . . . . . . . . . 0.00 0.00 68,243.69June 15, 2038 . . . . . . . . . . . . . . . . . . . . . . . . . . . . . . . 0.00 0.00 65,563.99July 15, 2038 . . . . . . . . . . . . . . . . . . . . . . . . . . . . . . . 0.00 0.00 62,948.03August 15, 2038 . . . . . . . . . . . . . . . . . . . . . . . . . . . . . 0.00 0.00 60,394.52September 15, 2038 . . . . . . . . . . . . . . . . . . . . . . . . . . . 0.00 0.00 57,902.18October 15, 2038. . . . . . . . . . . . . . . . . . . . . . . . . . . . . 0.00 0.00 55,469.76November 15, 2038 . . . . . . . . . . . . . . . . . . . . . . . . . . . 0.00 0.00 53,096.04December 15, 2038 . . . . . . . . . . . . . . . . . . . . . . . . . . . 0.00 0.00 50,779.82January 15, 2039 . . . . . . . . . . . . . . . . . . . . . . . . . . . . . 0.00 0.00 48,519.92February 15, 2039 . . . . . . . . . . . . . . . . . . . . . . . . . . . . 0.00 0.00 46,315.18March 15, 2039 . . . . . . . . . . . . . . . . . . . . . . . . . . . . . . 0.00 0.00 44,164.47April 15, 2039 . . . . . . . . . . . . . . . . . . . . . . . . . . . . . . 0.00 0.00 42,066.67May 15, 2039 . . . . . . . . . . . . . . . . . . . . . . . . . . . . . . . 0.00 0.00 40,020.70June 15, 2039 . . . . . . . . . . . . . . . . . . . . . . . . . . . . . . . 0.00 0.00 38,025.48July 15, 2039 . . . . . . . . . . . . . . . . . . . . . . . . . . . . . . . 0.00 0.00 36,079.97August 15, 2039 . . . . . . . . . . . . . . . . . . . . . . . . . . . . . 0.00 0.00 34,183.12September 15, 2039 . . . . . . . . . . . . . . . . . . . . . . . . . . . 0.00 0.00 32,333.94October 15, 2039. . . . . . . . . . . . . . . . . . . . . . . . . . . . . 0.00 0.00 30,531.42November 15, 2039 . . . . . . . . . . . . . . . . . . . . . . . . . . . 0.00 0.00 28,774.60December 15, 2039 . . . . . . . . . . . . . . . . . . . . . . . . . . . 0.00 0.00 27,062.52January 15, 2040 . . . . . . . . . . . . . . . . . . . . . . . . . . . . . 0.00 0.00 25,394.25February 15, 2040 . . . . . . . . . . . . . . . . . . . . . . . . . . . . 0.00 0.00 23,768.86
B-11
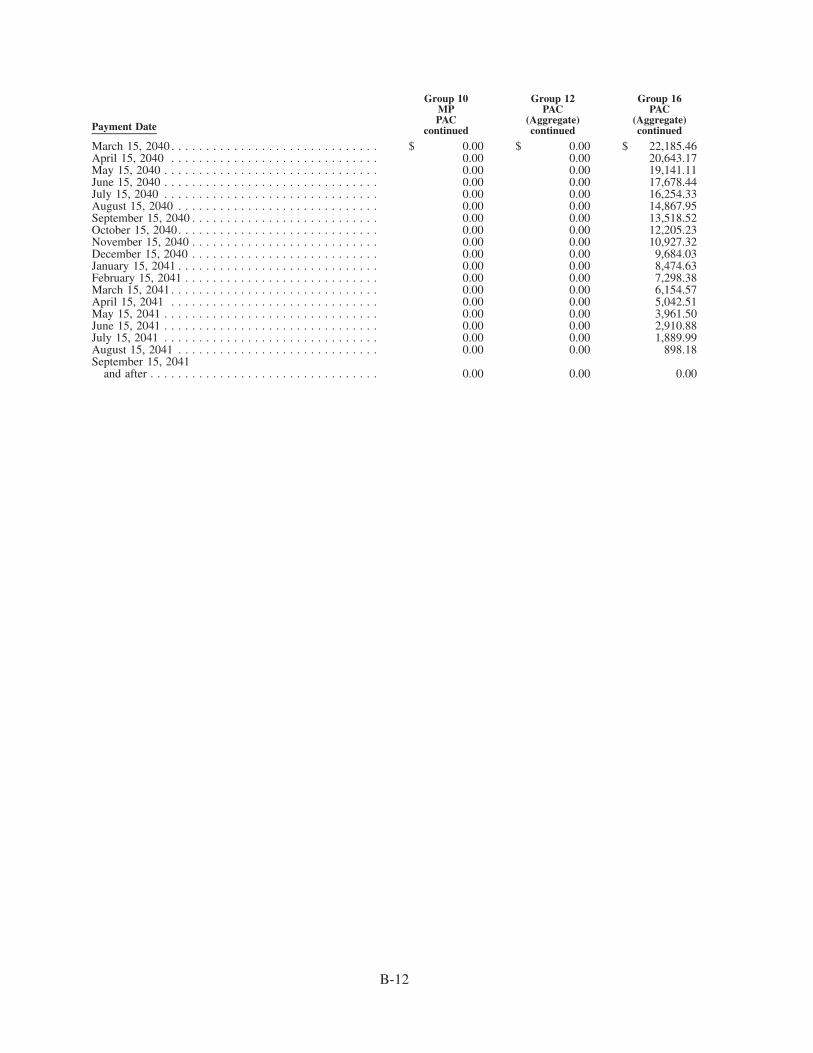
Payment Date
Group 10MPPAC
continued
Group 12PAC
(Aggregate)continued
Group 16PAC
(Aggregate)continued
March 15, 2040 . . . . . . . . . . . . . . . . . . . . . . . . . . . . . . $ 0.00 $ 0.00 $ 22,185.46April 15, 2040 . . . . . . . . . . . . . . . . . . . . . . . . . . . . . . 0.00 0.00 20,643.17May 15, 2040 . . . . . . . . . . . . . . . . . . . . . . . . . . . . . . . 0.00 0.00 19,141.11June 15, 2040 . . . . . . . . . . . . . . . . . . . . . . . . . . . . . . . 0.00 0.00 17,678.44July 15, 2040 . . . . . . . . . . . . . . . . . . . . . . . . . . . . . . . 0.00 0.00 16,254.33August 15, 2040 . . . . . . . . . . . . . . . . . . . . . . . . . . . . . 0.00 0.00 14,867.95September 15, 2040 . . . . . . . . . . . . . . . . . . . . . . . . . . . 0.00 0.00 13,518.52October 15, 2040. . . . . . . . . . . . . . . . . . . . . . . . . . . . . 0.00 0.00 12,205.23November 15, 2040 . . . . . . . . . . . . . . . . . . . . . . . . . . . 0.00 0.00 10,927.32December 15, 2040 . . . . . . . . . . . . . . . . . . . . . . . . . . . 0.00 0.00 9,684.03January 15, 2041 . . . . . . . . . . . . . . . . . . . . . . . . . . . . . 0.00 0.00 8,474.63February 15, 2041 . . . . . . . . . . . . . . . . . . . . . . . . . . . . 0.00 0.00 7,298.38March 15, 2041 . . . . . . . . . . . . . . . . . . . . . . . . . . . . . . 0.00 0.00 6,154.57April 15, 2041 . . . . . . . . . . . . . . . . . . . . . . . . . . . . . . 0.00 0.00 5,042.51May 15, 2041 . . . . . . . . . . . . . . . . . . . . . . . . . . . . . . . 0.00 0.00 3,961.50June 15, 2041 . . . . . . . . . . . . . . . . . . . . . . . . . . . . . . . 0.00 0.00 2,910.88July 15, 2041 . . . . . . . . . . . . . . . . . . . . . . . . . . . . . . . 0.00 0.00 1,889.99August 15, 2041 . . . . . . . . . . . . . . . . . . . . . . . . . . . . . 0.00 0.00 898.18September 15, 2041
and after . . . . . . . . . . . . . . . . . . . . . . . . . . . . . . . . . 0.00 0.00 0.00
B-12
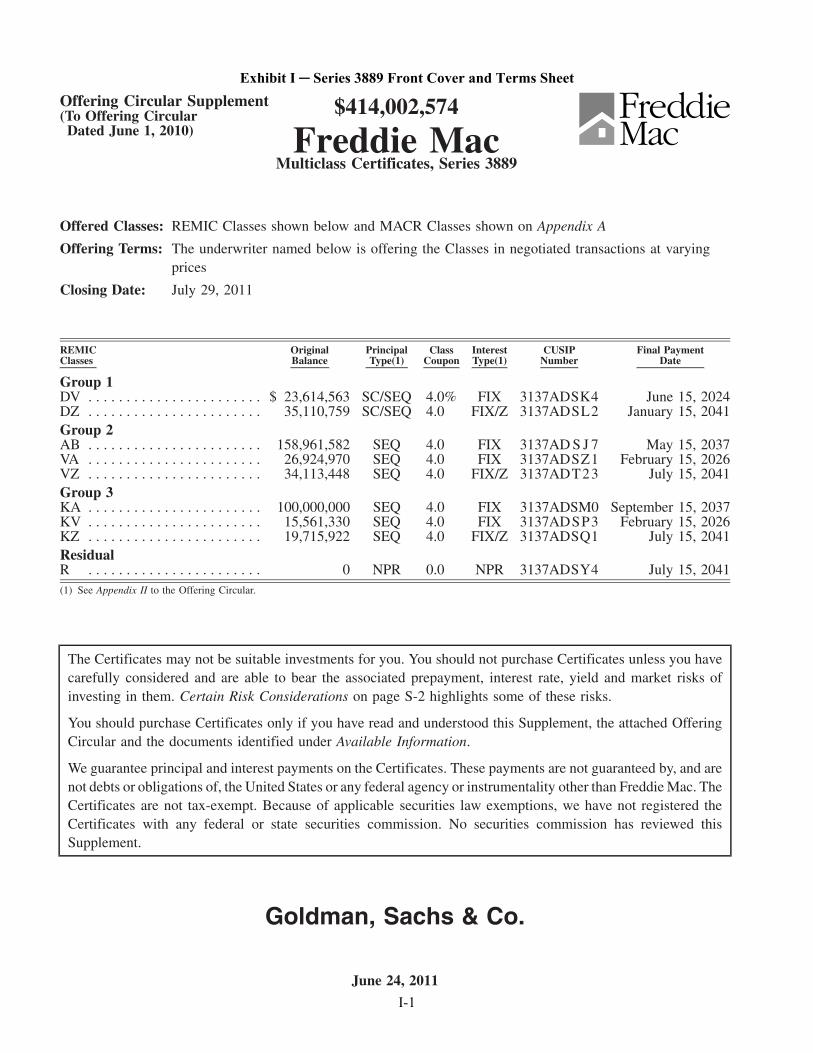
Offering Circular Supplement(To Offering Circular
Dated June 1, 2010)
$414,002,574
Freddie MacMulticlass Certificates, Series 3889
Offered Classes: REMIC Classes shown below and MACR Classes shown on Appendix A
Offering Terms: The underwriter named below is offering the Classes in negotiated transactions at varyingprices
Closing Date: July 29, 2011
REMICClasses
OriginalBalance
PrincipalType(1)
ClassCoupon
InterestType(1)
CUSIPNumber
Final PaymentDate
Group 1DV . . . . . . . . . . . . . . . . . . . . . . . $ 23,614,563 SC/SEQ 4.0% FIX 3137ADSK4 June 15, 2024DZ . . . . . . . . . . . . . . . . . . . . . . . 35,110,759 SC/SEQ 4.0 FIX/Z 3137ADSL2 January 15, 2041Group 2AB . . . . . . . . . . . . . . . . . . . . . . . 158,961,582 SEQ 4.0 FIX 3137AD S J 7 May 15, 2037VA . . . . . . . . . . . . . . . . . . . . . . . 26,924,970 SEQ 4.0 FIX 3137ADSZ1 February 15, 2026VZ . . . . . . . . . . . . . . . . . . . . . . . 34,113,448 SEQ 4.0 FIX/Z 3137ADT23 July 15, 2041Group 3KA . . . . . . . . . . . . . . . . . . . . . . . 100,000,000 SEQ 4.0 FIX 3137ADSM0 September 15, 2037KV . . . . . . . . . . . . . . . . . . . . . . . 15,561,330 SEQ 4.0 FIX 3137ADSP3 February 15, 2026KZ . . . . . . . . . . . . . . . . . . . . . . . 19,715,922 SEQ 4.0 FIX/Z 3137ADSQ1 July 15, 2041ResidualR . . . . . . . . . . . . . . . . . . . . . . . 0 NPR 0.0 NPR 3137ADSY4 July 15, 2041(1) See Appendix II to the Offering Circular.
The Certificates may not be suitable investments for you. You should not purchase Certificates unless you havecarefully considered and are able to bear the associated prepayment, interest rate, yield and market risks ofinvesting in them. Certain Risk Considerations on page S-2 highlights some of these risks.
You should purchase Certificates only if you have read and understood this Supplement, the attached OfferingCircular and the documents identified under Available Information.
We guarantee principal and interest payments on the Certificates. These payments are not guaranteed by, and arenot debts or obligations of, the United States or any federal agency or instrumentality other than Freddie Mac. TheCertificates are not tax-exempt. Because of applicable securities law exemptions, we have not registered theCertificates with any federal or state securities commission. No securities commission has reviewed thisSupplement.
Goldman, Sachs & Co.
June 24, 2011
I-1
Exhibit I ─ Series 3889 Front Cover and Terms Sheet
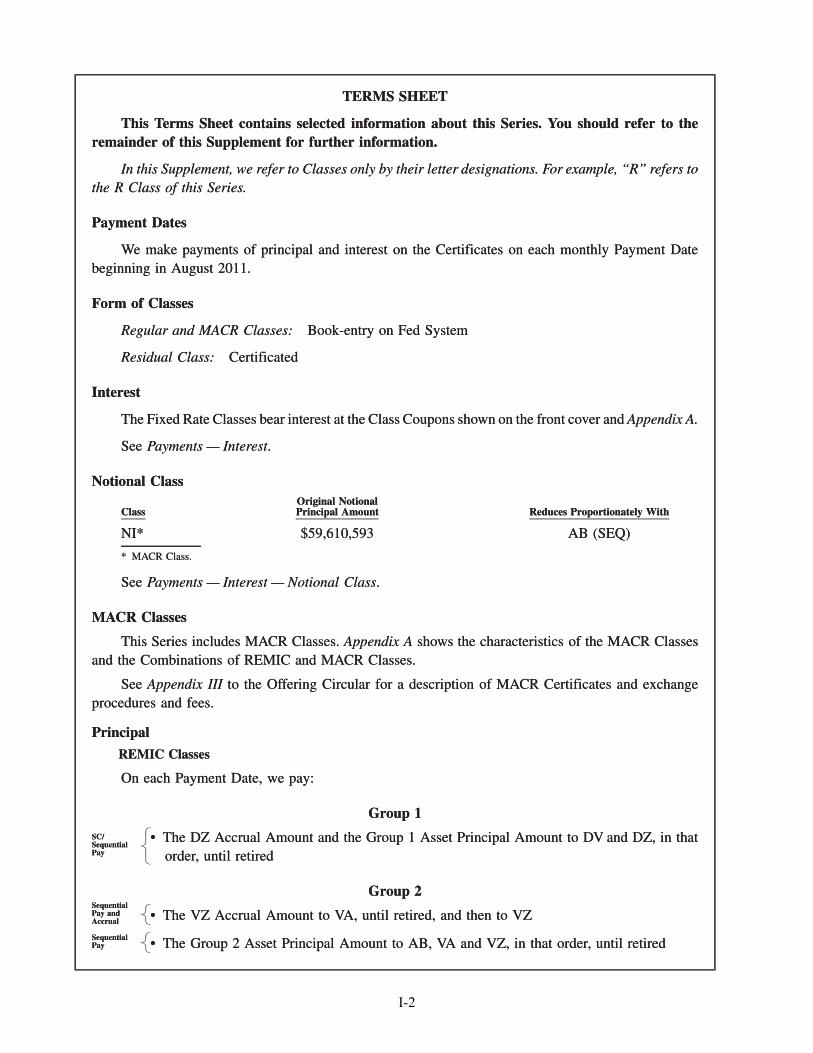
TERMS SHEET
This Terms Sheet contains selected information about this Series. You should refer to theremainder of this Supplement for further information.
In this Supplement, we refer to Classes only by their letter designations. For example, “R” refers tothe R Class of this Series.
Payment Dates
We make payments of principal and interest on the Certificates on each monthly Payment Datebeginning in August 2011.
Form of Classes
Regular and MACR Classes: Book-entry on Fed System
Residual Class: Certificated
Interest
The Fixed Rate Classes bear interest at the Class Coupons shown on the front cover and Appendix A.
See Payments — Interest.
Notional Class
ClassOriginal NotionalPrincipal Amount Reduces Proportionately With
NI* $59,610,593 AB (SEQ)
* MACR Class.
See Payments — Interest — Notional Class.
MACR Classes
This Series includes MACR Classes. Appendix A shows the characteristics of the MACR Classesand the Combinations of REMIC and MACR Classes.
See Appendix III to the Offering Circular for a description of MACR Certificates and exchangeprocedures and fees.
Principal
REMIC Classes
On each Payment Date, we pay:
Group 1
• The DZ Accrual Amount and the Group 1 Asset Principal Amount to DV and DZ, in thatorder, until retired
SC/SequentialPay
Group 2
• The VZ Accrual Amount to VA, until retired, and then to VZSequentialPay andAccrual
• The Group 2 Asset Principal Amount to AB, VA and VZ, in that order, until retiredSequentialPay
TERMS SHEET
This Terms Sheet contains selected information about this Series. You should refer to theremainder of this Supplement for further information.
In this Supplement, we refer to Classes only by their letter designations. For example, “R” refers tothe R Class of this Series.
Payment Dates
We make payments of principal and interest on the Certificates on each monthly Payment Datebeginning in August 2011.
Form of Classes
Regular and MACR Classes: Book-entry on Fed System
Residual Class: Certificated
Interest
The Fixed Rate Classes bear interest at the Class Coupons shown on the front cover and Appendix A.
See Payments — Interest.
Notional Class
ClassOriginal NotionalPrincipal Amount Reduces Proportionately With
NI* $59,610,593 AB (SEQ)
* MACR Class.
See Payments — Interest — Notional Class.
MACR Classes
This Series includes MACR Classes. Appendix A shows the characteristics of the MACR Classesand the Combinations of REMIC and MACR Classes.
See Appendix III to the Offering Circular for a description of MACR Certificates and exchangeprocedures and fees.
Principal
REMIC Classes
On each Payment Date, we pay:
Group 1
• The DZ Accrual Amount and the Group 1 Asset Principal Amount to DV and DZ, in thatorder, until retired
�����������
SC/SequentialPay
Group 2
• The VZ Accrual Amount to VA, until retired, and then to VZ�����
SequentialPay andAccrual
• The Group 2 Asset Principal Amount to AB, VA and VZ, in that order, until retired�����
SequentialPay
I-2
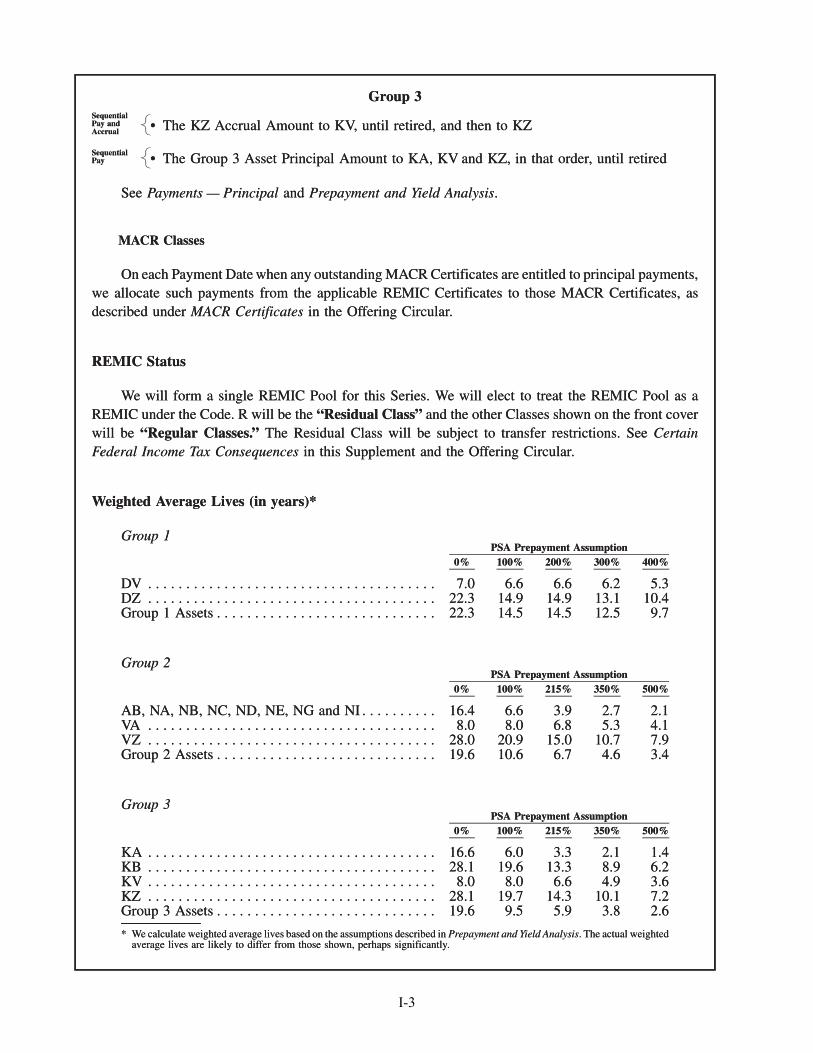
Group 3
• The KZ Accrual Amount to KV, until retired, and then to KZSequentialPay andAccrual
• The Group 3 Asset Principal Amount to KA, KV and KZ, in that order, until retiredSequentialPay
See Payments — Principal and Prepayment and Yield Analysis.
MACR Classes
On each Payment Date when any outstanding MACR Certificates are entitled to principal payments,we allocate such payments from the applicable REMIC Certificates to those MACR Certificates, asdescribed under MACR Certificates in the Offering Circular.
REMIC Status
We will form a single REMIC Pool for this Series. We will elect to treat the REMIC Pool as aREMIC under the Code. R will be the “Residual Class” and the other Classes shown on the front coverwill be “Regular Classes.” The Residual Class will be subject to transfer restrictions. See CertainFederal Income Tax Consequences in this Supplement and the Offering Circular.
Weighted Average Lives (in years)*
Group 1
0% 100% 200% 300% 400%PSA Prepayment Assumption
DV . . . . . . . . . . . . . . . . . . . . . . . . . . . . . . . . . . . . . . 7.0 6.6 6.6 6.2 5.3DZ . . . . . . . . . . . . . . . . . . . . . . . . . . . . . . . . . . . . . . 22.3 14.9 14.9 13.1 10.4Group 1 Assets . . . . . . . . . . . . . . . . . . . . . . . . . . . . . 22.3 14.5 14.5 12.5 9.7
Group 2
0% 100% 215% 350% 500%PSA Prepayment Assumption
AB, NA, NB, NC, ND, NE, NG and NI . . . . . . . . . . 16.4 6.6 3.9 2.7 2.1VA . . . . . . . . . . . . . . . . . . . . . . . . . . . . . . . . . . . . . . 8.0 8.0 6.8 5.3 4.1VZ . . . . . . . . . . . . . . . . . . . . . . . . . . . . . . . . . . . . . . 28.0 20.9 15.0 10.7 7.9Group 2 Assets . . . . . . . . . . . . . . . . . . . . . . . . . . . . . 19.6 10.6 6.7 4.6 3.4
Group 3
0% 100% 215% 350% 500%PSA Prepayment Assumption
KA . . . . . . . . . . . . . . . . . . . . . . . . . . . . . . . . . . . . . . 16.6 6.0 3.3 2.1 1.4KB . . . . . . . . . . . . . . . . . . . . . . . . . . . . . . . . . . . . . . 28.1 19.6 13.3 8.9 6.2KV . . . . . . . . . . . . . . . . . . . . . . . . . . . . . . . . . . . . . . 8.0 8.0 6.6 4.9 3.6KZ . . . . . . . . . . . . . . . . . . . . . . . . . . . . . . . . . . . . . . 28.1 19.7 14.3 10.1 7.2Group 3 Assets . . . . . . . . . . . . . . . . . . . . . . . . . . . . . 19.6 9.5 5.9 3.8 2.6
* We calculate weighted average lives based on the assumptions described in Prepayment and Yield Analysis. The actual weightedaverage lives are likely to differ from those shown, perhaps significantly.
Group 3
• The KZ Accrual Amount to KV, until retired, and then to KZ�����
SequentialPay andAccrual
• The Group 3 Asset Principal Amount to KA, KV and KZ, in that order, until retired�����
SequentialPay
See Payments — Principal and Prepayment and Yield Analysis.
MACR Classes
On each Payment Date when any outstanding MACR Certificates are entitled to principal payments,we allocate such payments from the applicable REMIC Certificates to those MACR Certificates, asdescribed under MACR Certificates in the Offering Circular.
REMIC Status
We will form a single REMIC Pool for this Series. We will elect to treat the REMIC Pool as aREMIC under the Code. R will be the “Residual Class” and the other Classes shown on the front coverwill be “Regular Classes.” The Residual Class will be subject to transfer restrictions. See CertainFederal Income Tax Consequences in this Supplement and the Offering Circular.
Weighted Average Lives (in years)*
Group 1
0% 100% 200% 300% 400%PSA Prepayment Assumption
DV . . . . . . . . . . . . . . . . . . . . . . . . . . . . . . . . . . . . . . 7.0 6.6 6.6 6.2 5.3DZ . . . . . . . . . . . . . . . . . . . . . . . . . . . . . . . . . . . . . . 22.3 14.9 14.9 13.1 10.4Group 1 Assets . . . . . . . . . . . . . . . . . . . . . . . . . . . . . 22.3 14.5 14.5 12.5 9.7
Group 2
0% 100% 215% 350% 500%PSA Prepayment Assumption
AB, NA, NB, NC, ND, NE, NG and NI . . . . . . . . . . 16.4 6.6 3.9 2.7 2.1VA . . . . . . . . . . . . . . . . . . . . . . . . . . . . . . . . . . . . . . 8.0 8.0 6.8 5.3 4.1VZ . . . . . . . . . . . . . . . . . . . . . . . . . . . . . . . . . . . . . . 28.0 20.9 15.0 10.7 7.9Group 2 Assets . . . . . . . . . . . . . . . . . . . . . . . . . . . . . 19.6 10.6 6.7 4.6 3.4
Group 3
0% 100% 215% 350% 500%PSA Prepayment Assumption
KA . . . . . . . . . . . . . . . . . . . . . . . . . . . . . . . . . . . . . . 16.6 6.0 3.3 2.1 1.4KB . . . . . . . . . . . . . . . . . . . . . . . . . . . . . . . . . . . . . . 28.1 19.6 13.3 8.9 6.2KV . . . . . . . . . . . . . . . . . . . . . . . . . . . . . . . . . . . . . . 8.0 8.0 6.6 4.9 3.6KZ . . . . . . . . . . . . . . . . . . . . . . . . . . . . . . . . . . . . . . 28.1 19.7 14.3 10.1 7.2Group 3 Assets . . . . . . . . . . . . . . . . . . . . . . . . . . . . . 19.6 9.5 5.9 3.8 2.6
* We calculate weighted average lives based on the assumptions described in Prepayment and Yield Analysis. The actual weightedaverage lives are likely to differ from those shown, perhaps significantly.
I-3
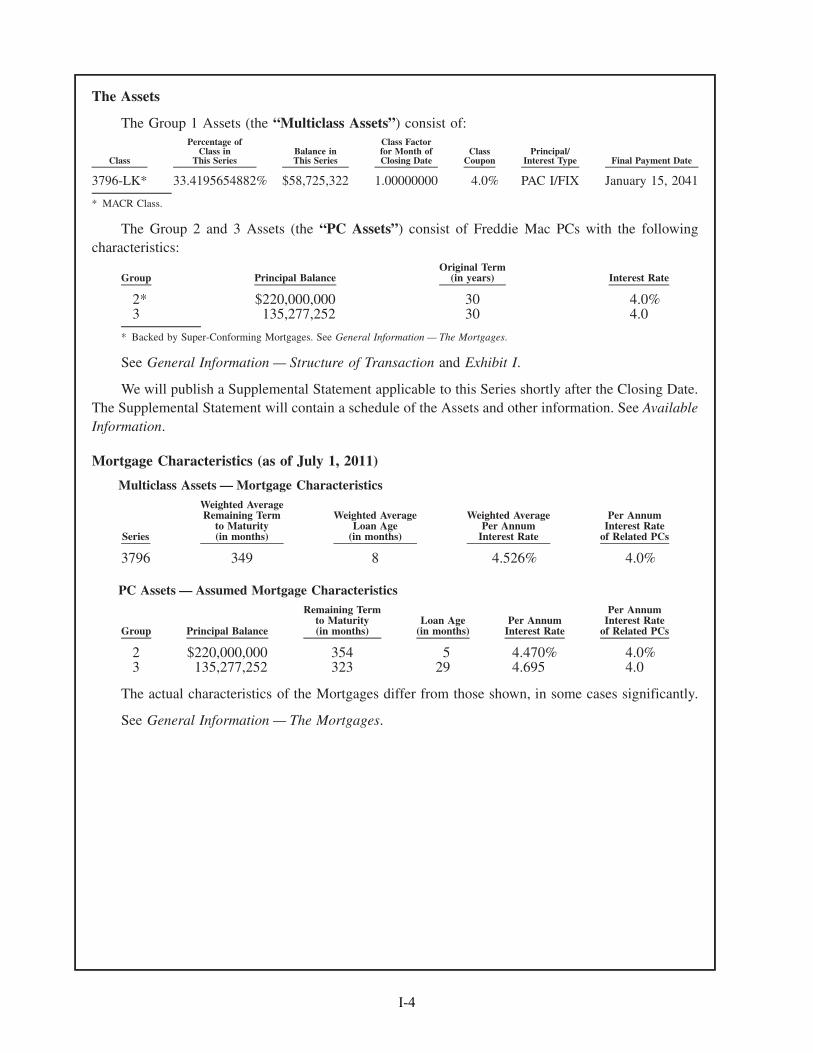
The Assets
The Group 1 Assets (the “Multiclass Assets”) consist of:
Class
Percentage ofClass in
This SeriesBalance inThis Series
Class Factorfor Month ofClosing Date
ClassCoupon
Principal/Interest Type Final Payment Date
3796-LK* 33.4195654882% $58,725,322 1.00000000 4.0% PAC I/FIX January 15, 2041
* MACR Class.
The Group 2 and 3 Assets (the “PC Assets”) consist of Freddie Mac PCs with the followingcharacteristics:
Group Principal BalanceOriginal Term
(in years) Interest Rate
2* $220,000,000 30 4.0%3 135,277,252 30 4.0
* Backed by Super-Conforming Mortgages. See General Information — The Mortgages.
See General Information — Structure of Transaction and Exhibit I.
We will publish a Supplemental Statement applicable to this Series shortly after the Closing Date.The Supplemental Statement will contain a schedule of the Assets and other information. See AvailableInformation.
Mortgage Characteristics (as of July 1, 2011)
Multiclass Assets — Mortgage Characteristics
Series
Weighted AverageRemaining Term
to Maturity(in months)
Weighted AverageLoan Age
(in months)
Weighted AveragePer Annum
Interest Rate
Per AnnumInterest Rate
of Related PCs
3796 349 8 4.526% 4.0%
PC Assets — Assumed Mortgage Characteristics
Group Principal Balance
Remaining Termto Maturity(in months)
Loan Age(in months)
Per AnnumInterest Rate
Per AnnumInterest Rate
of Related PCs
2 $220,000,000 354 5 4.470% 4.0%3 135,277,252 323 29 4.695 4.0
The actual characteristics of the Mortgages differ from those shown, in some cases significantly.
See General Information — The Mortgages.
I-4
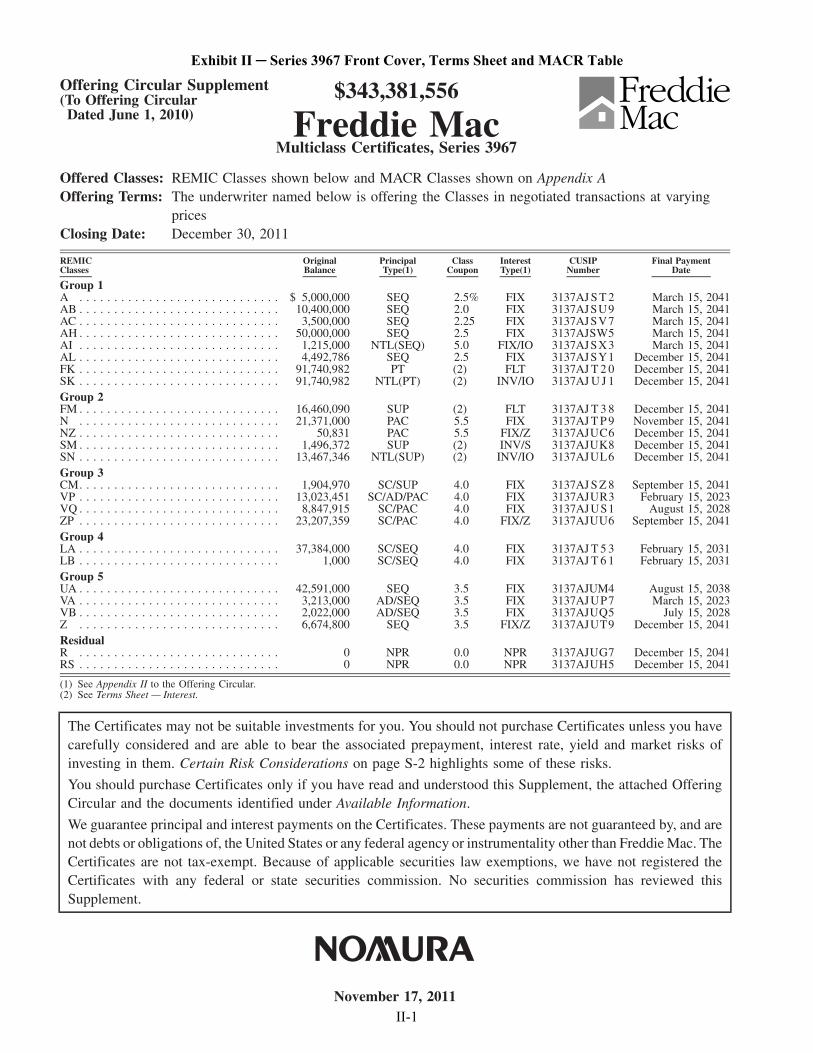
Offering Circular Supplement(To Offering Circular
Dated June 1, 2010)
$343,381,556
Freddie MacMulticlass Certificates, Series 3967
Offered Classes: REMIC Classes shown below and MACR Classes shown on Appendix AOffering Terms: The underwriter named below is offering the Classes in negotiated transactions at varying
pricesClosing Date: December 30, 2011
REMICClasses
OriginalBalance
PrincipalType(1)
ClassCoupon
InterestType(1)
CUSIPNumber
Final PaymentDate
Group 1A . . . . . . . . . . . . . . . . . . . . . . . . . . . . . $ 5,000,000 SEQ 2.5% FIX 3137AJ S T 2 March 15, 2041AB . . . . . . . . . . . . . . . . . . . . . . . . . . . . . 10,400,000 SEQ 2.0 FIX 3137AJSU9 March 15, 2041AC . . . . . . . . . . . . . . . . . . . . . . . . . . . . . 3,500,000 SEQ 2.25 FIX 3137AJSV7 March 15, 2041AH . . . . . . . . . . . . . . . . . . . . . . . . . . . . . 50,000,000 SEQ 2.5 FIX 3137AJSW5 March 15, 2041AI . . . . . . . . . . . . . . . . . . . . . . . . . . . . . 1,215,000 NTL(SEQ) 5.0 FIX/IO 3137AJSX3 March 15, 2041AL . . . . . . . . . . . . . . . . . . . . . . . . . . . . . 4,492,786 SEQ 2.5 FIX 3137AJSY1 December 15, 2041FK . . . . . . . . . . . . . . . . . . . . . . . . . . . . . 91,740,982 PT (2) FLT 3137AJ T 2 0 December 15, 2041SK . . . . . . . . . . . . . . . . . . . . . . . . . . . . . 91,740,982 NTL(PT) (2) INV/IO 3137AJ U J 1 December 15, 2041Group 2FM . . . . . . . . . . . . . . . . . . . . . . . . . . . . . 16,460,090 SUP (2) FLT 3137AJ T 3 8 December 15, 2041N . . . . . . . . . . . . . . . . . . . . . . . . . . . . . 21,371,000 PAC 5.5 FIX 3137AJ T P 9 November 15, 2041NZ . . . . . . . . . . . . . . . . . . . . . . . . . . . . . 50,831 PAC 5.5 FIX/Z 3137AJUC6 December 15, 2041SM . . . . . . . . . . . . . . . . . . . . . . . . . . . . . 1,496,372 SUP (2) INV/S 3137AJUK8 December 15, 2041SN . . . . . . . . . . . . . . . . . . . . . . . . . . . . . 13,467,346 NTL(SUP) (2) INV/IO 3137AJUL6 December 15, 2041Group 3CM. . . . . . . . . . . . . . . . . . . . . . . . . . . . . 1,904,970 SC/SUP 4.0 FIX 3137AJ S Z 8 September 15, 2041VP . . . . . . . . . . . . . . . . . . . . . . . . . . . . . 13,023,451 SC/AD/PAC 4.0 FIX 3137AJUR3 February 15, 2023VQ . . . . . . . . . . . . . . . . . . . . . . . . . . . . . 8,847,915 SC/PAC 4.0 FIX 3137AJUS1 August 15, 2028ZP . . . . . . . . . . . . . . . . . . . . . . . . . . . . . 23,207,359 SC/PAC 4.0 FIX/Z 3137AJUU6 September 15, 2041Group 4LA . . . . . . . . . . . . . . . . . . . . . . . . . . . . . 37,384,000 SC/SEQ 4.0 FIX 3137AJ T 5 3 February 15, 2031LB . . . . . . . . . . . . . . . . . . . . . . . . . . . . . 1,000 SC/SEQ 4.0 FIX 3137AJ T 6 1 February 15, 2031Group 5UA . . . . . . . . . . . . . . . . . . . . . . . . . . . . . 42,591,000 SEQ 3.5 FIX 3137AJUM4 August 15, 2038VA . . . . . . . . . . . . . . . . . . . . . . . . . . . . . 3,213,000 AD/SEQ 3.5 FIX 3137AJUP7 March 15, 2023VB . . . . . . . . . . . . . . . . . . . . . . . . . . . . . 2,022,000 AD/SEQ 3.5 FIX 3137AJUQ5 July 15, 2028Z . . . . . . . . . . . . . . . . . . . . . . . . . . . . . 6,674,800 SEQ 3.5 FIX/Z 3137AJUT9 December 15, 2041ResidualR . . . . . . . . . . . . . . . . . . . . . . . . . . . . . 0 NPR 0.0 NPR 3137AJUG7 December 15, 2041RS . . . . . . . . . . . . . . . . . . . . . . . . . . . . . 0 NPR 0.0 NPR 3137AJUH5 December 15, 2041
(1) See Appendix II to the Offering Circular.(2) See Terms Sheet — Interest.
The Certificates may not be suitable investments for you. You should not purchase Certificates unless you havecarefully considered and are able to bear the associated prepayment, interest rate, yield and market risks ofinvesting in them. Certain Risk Considerations on page S-2 highlights some of these risks.
You should purchase Certificates only if you have read and understood this Supplement, the attached OfferingCircular and the documents identified under Available Information.
We guarantee principal and interest payments on the Certificates. These payments are not guaranteed by, and arenot debts or obligations of, the United States or any federal agency or instrumentality other than Freddie Mac. TheCertificates are not tax-exempt. Because of applicable securities law exemptions, we have not registered theCertificates with any federal or state securities commission. No securities commission has reviewed thisSupplement.
November 17, 2011II-1
Exhibit II ─ Series 3967 Front Cover, Terms Sheet and MACR Table
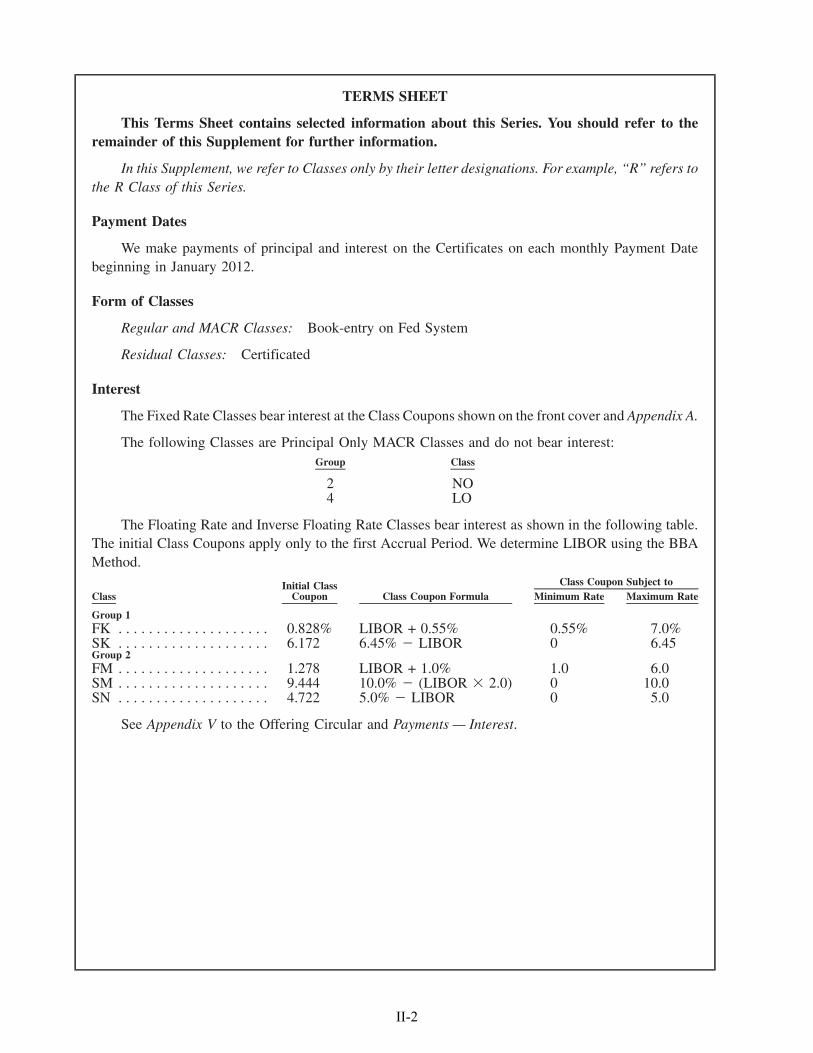
TERMS SHEET
This Terms Sheet contains selected information about this Series. You should refer to theremainder of this Supplement for further information.
In this Supplement, we refer to Classes only by their letter designations. For example, “R” refers tothe R Class of this Series.
Payment Dates
We make payments of principal and interest on the Certificates on each monthly Payment Datebeginning in January 2012.
Form of Classes
Regular and MACR Classes: Book-entry on Fed System
Residual Classes: Certificated
Interest
The Fixed Rate Classes bear interest at the Class Coupons shown on the front cover and Appendix A.
The following Classes are Principal Only MACR Classes and do not bear interest:Group Class
2 NO4 LO
The Floating Rate and Inverse Floating Rate Classes bear interest as shown in the following table.The initial Class Coupons apply only to the first Accrual Period. We determine LIBOR using the BBAMethod.
ClassInitial Class
Coupon Class Coupon Formula Minimum Rate Maximum RateClass Coupon Subject to
Group 1FK . . . . . . . . . . . . . . . . . . . . 0.828% LIBOR + 0.55% 0.55% 7.0%SK . . . . . . . . . . . . . . . . . . . . 6.172 6.45% � LIBOR 0 6.45Group 2FM . . . . . . . . . . . . . . . . . . . . 1.278 LIBOR + 1.0% 1.0 6.0SM . . . . . . . . . . . . . . . . . . . . 9.444 10.0% � (LIBOR � 2.0) 0 10.0SN . . . . . . . . . . . . . . . . . . . . 4.722 5.0% � LIBOR 0 5.0
See Appendix V to the Offering Circular and Payments — Interest.
II-2
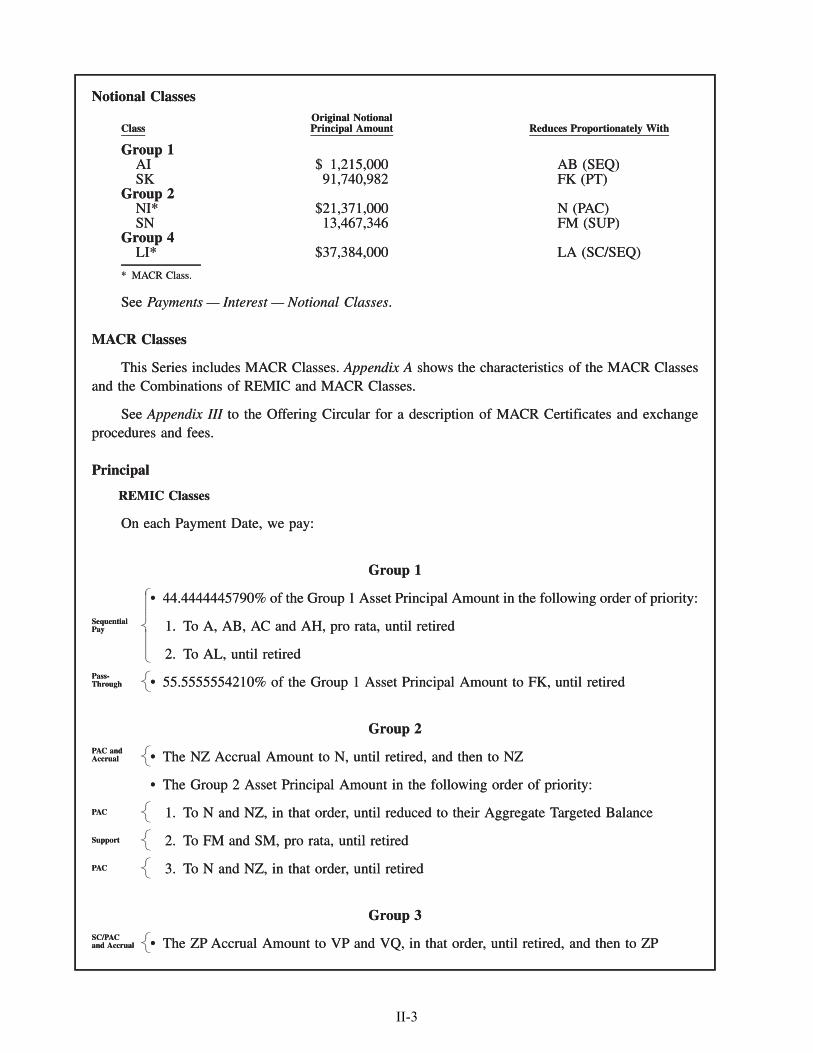
Notional Classes
ClassOriginal NotionalPrincipal Amount Reduces Proportionately With
Group 1AI $ 1,215,000 AB (SEQ)SK 91,740,982 FK (PT)
Group 2NI* $21,371,000 N (PAC)SN 13,467,346 FM (SUP)
Group 4LI* $37,384,000 LA (SC/SEQ)
* MACR Class.
See Payments — Interest — Notional Classes.
MACR Classes
This Series includes MACR Classes. Appendix A shows the characteristics of the MACR Classesand the Combinations of REMIC and MACR Classes.
See Appendix III to the Offering Circular for a description of MACR Certificates and exchangeprocedures and fees.
Principal
REMIC Classes
On each Payment Date, we pay:
Group 1
• 44.4444445790% of the Group 1 Asset Principal Amount in the following order of priority:
1. To A, AB, AC and AH, pro rata, until retired
2. To AL, until retired
SequentialPay
• 55.5555554210% of the Group 1 Asset Principal Amount to FK, until retiredPass-Through
Group 2
• The NZ Accrual Amount to N, until retired, and then to NZPAC andAccrual
• The Group 2 Asset Principal Amount in the following order of priority:
1. To N and NZ, in that order, until reduced to their Aggregate Targeted BalancePAC
2. To FM and SM, pro rata, until retiredSupport
3. To N and NZ, in that order, until retiredPAC
Group 3
• The ZP Accrual Amount to VP and VQ, in that order, until retired, and then to ZPSC/PACand Accrual
Notional Classes
ClassOriginal NotionalPrincipal Amount Reduces Proportionately With
Group 1AI $ 1,215,000 AB (SEQ)SK 91,740,982 FK (PT)
Group 2NI* $21,371,000 N (PAC)SN 13,467,346 FM (SUP)
Group 4LI* $37,384,000 LA (SC/SEQ)
* MACR Class.
See Payments — Interest — Notional Classes.
MACR Classes
This Series includes MACR Classes. Appendix A shows the characteristics of the MACR Classesand the Combinations of REMIC and MACR Classes.
See Appendix III to the Offering Circular for a description of MACR Certificates and exchangeprocedures and fees.
Principal
REMIC Classes
On each Payment Date, we pay:
Group 1
• 44.4444445790% of the Group 1 Asset Principal Amount in the following order of priority:
1. To A, AB, AC and AH, pro rata, until retired
2. To AL, until retired
�������������������������
SequentialPay
• 55.5555554210% of the Group 1 Asset Principal Amount to FK, until retired�����
Pass-Through
Group 2
• The NZ Accrual Amount to N, until retired, and then to NZ�����
PAC andAccrual
• The Group 2 Asset Principal Amount in the following order of priority:
1. To N and NZ, in that order, until reduced to their Aggregate Targeted Balance�����PAC
2. To FM and SM, pro rata, until retired�����Support
3. To N and NZ, in that order, until retired�����PAC
Group 3
• The ZP Accrual Amount to VP and VQ, in that order, until retired, and then to ZP�����
SC/PACand Accrual
II-3
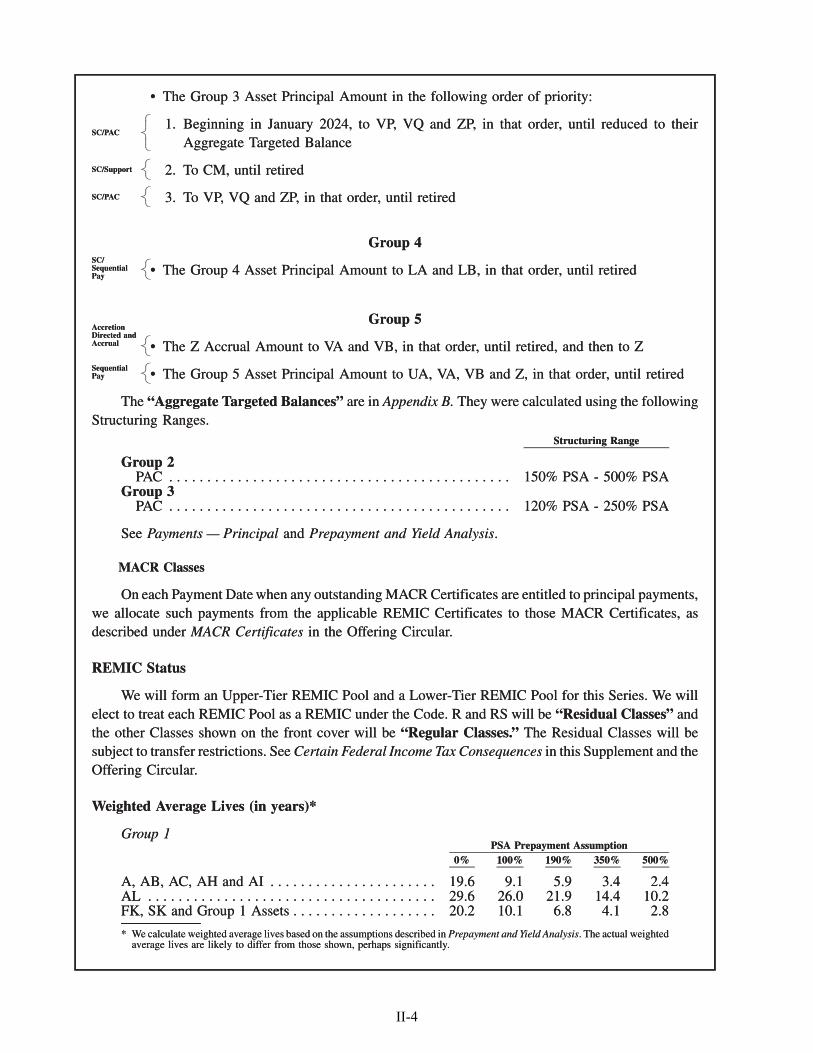
• The Group 3 Asset Principal Amount in the following order of priority:
1. Beginning in January 2024, to VP, VQ and ZP, in that order, until reduced to theirAggregate Targeted Balance
SC/PAC
2. To CM, until retiredSC/Support
3. To VP, VQ and ZP, in that order, until retiredSC/PAC
Group 4
• The Group 4 Asset Principal Amount to LA and LB, in that order, until retiredSC/SequentialPay
Group 5
• The Z Accrual Amount to VA and VB, in that order, until retired, and then to Z
AccretionDirected andAccrual
• The Group 5 Asset Principal Amount to UA, VA, VB and Z, in that order, until retiredSequentialPay
The “Aggregate Targeted Balances” are in Appendix B. They were calculated using the followingStructuring Ranges.
Structuring Range
Group 2PAC . . . . . . . . . . . . . . . . . . . . . . . . . . . . . . . . . . . . . . . . . . . . . 150% PSA - 500% PSA
Group 3PAC . . . . . . . . . . . . . . . . . . . . . . . . . . . . . . . . . . . . . . . . . . . . . 120% PSA - 250% PSA
See Payments — Principal and Prepayment and Yield Analysis.
MACR Classes
On each Payment Date when any outstanding MACR Certificates are entitled to principal payments,we allocate such payments from the applicable REMIC Certificates to those MACR Certificates, asdescribed under MACR Certificates in the Offering Circular.
REMIC Status
We will form an Upper-Tier REMIC Pool and a Lower-Tier REMIC Pool for this Series. We willelect to treat each REMIC Pool as a REMIC under the Code. R and RS will be “Residual Classes” andthe other Classes shown on the front cover will be “Regular Classes.” The Residual Classes will besubject to transfer restrictions. See Certain Federal Income Tax Consequences in this Supplement and theOffering Circular.
Weighted Average Lives (in years)*
Group 1
0% 100% 190% 350% 500%PSA Prepayment Assumption
A, AB, AC, AH and AI . . . . . . . . . . . . . . . . . . . . . . 19.6 9.1 5.9 3.4 2.4AL . . . . . . . . . . . . . . . . . . . . . . . . . . . . . . . . . . . . . . 29.6 26.0 21.9 14.4 10.2FK, SK and Group 1 Assets . . . . . . . . . . . . . . . . . . . 20.2 10.1 6.8 4.1 2.8
* We calculate weighted average lives based on the assumptions described in Prepayment and Yield Analysis. The actual weightedaverage lives are likely to differ from those shown, perhaps significantly.
• The Group 3 Asset Principal Amount in the following order of priority:
1. Beginning in January 2024, to VP, VQ and ZP, in that order, until reduced to theirAggregate Targeted Balance
�����������
SC/PAC
2. To CM, until retired�����SC/Support
3. To VP, VQ and ZP, in that order, until retired�����SC/PAC
Group 4
• The Group 4 Asset Principal Amount to LA and LB, in that order, until retired�����
SC/SequentialPay
Group 5
• The Z Accrual Amount to VA and VB, in that order, until retired, and then to Z�����
AccretionDirected andAccrual
• The Group 5 Asset Principal Amount to UA, VA, VB and Z, in that order, until retired�����
SequentialPay
The “Aggregate Targeted Balances” are in Appendix B. They were calculated using the followingStructuring Ranges.
Structuring Range
Group 2PAC . . . . . . . . . . . . . . . . . . . . . . . . . . . . . . . . . . . . . . . . . . . . . 150% PSA - 500% PSA
Group 3PAC . . . . . . . . . . . . . . . . . . . . . . . . . . . . . . . . . . . . . . . . . . . . . 120% PSA - 250% PSA
See Payments — Principal and Prepayment and Yield Analysis.
MACR Classes
On each Payment Date when any outstanding MACR Certificates are entitled to principal payments,we allocate such payments from the applicable REMIC Certificates to those MACR Certificates, asdescribed under MACR Certificates in the Offering Circular.
REMIC Status
We will form an Upper-Tier REMIC Pool and a Lower-Tier REMIC Pool for this Series. We willelect to treat each REMIC Pool as a REMIC under the Code. R and RS will be “Residual Classes” andthe other Classes shown on the front cover will be “Regular Classes.” The Residual Classes will besubject to transfer restrictions. See Certain Federal Income Tax Consequences in this Supplement and theOffering Circular.
Weighted Average Lives (in years)*
Group 1
0% 100% 190% 350% 500%PSA Prepayment Assumption
A, AB, AC, AH and AI . . . . . . . . . . . . . . . . . . . . . . 19.6 9.1 5.9 3.4 2.4AL . . . . . . . . . . . . . . . . . . . . . . . . . . . . . . . . . . . . . . 29.6 26.0 21.9 14.4 10.2FK, SK and Group 1 Assets . . . . . . . . . . . . . . . . . . . 20.2 10.1 6.8 4.1 2.8
* We calculate weighted average lives based on the assumptions described in Prepayment and Yield Analysis. The actual weightedaverage lives are likely to differ from those shown, perhaps significantly.
II-4
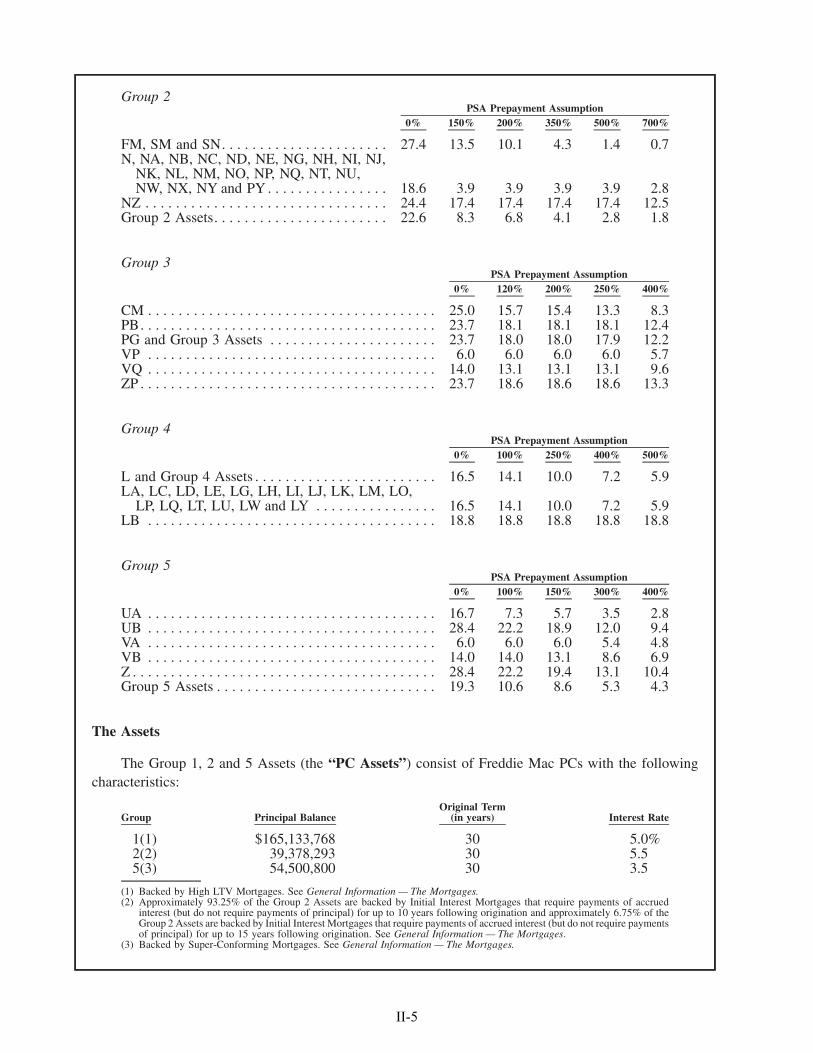
Group 2
0% 150% 200% 350% 500% 700%PSA Prepayment Assumption
FM, SM and SN. . . . . . . . . . . . . . . . . . . . . . 27.4 13.5 10.1 4.3 1.4 0.7N, NA, NB, NC, ND, NE, NG, NH, NI, NJ,
NK, NL, NM, NO, NP, NQ, NT, NU,NW, NX, NY and PY . . . . . . . . . . . . . . . . 18.6 3.9 3.9 3.9 3.9 2.8
NZ . . . . . . . . . . . . . . . . . . . . . . . . . . . . . . . . 24.4 17.4 17.4 17.4 17.4 12.5Group 2 Assets. . . . . . . . . . . . . . . . . . . . . . . 22.6 8.3 6.8 4.1 2.8 1.8
Group 3
0% 120% 200% 250% 400%PSA Prepayment Assumption
CM . . . . . . . . . . . . . . . . . . . . . . . . . . . . . . . . . . . . . . 25.0 15.7 15.4 13.3 8.3PB. . . . . . . . . . . . . . . . . . . . . . . . . . . . . . . . . . . . . . . 23.7 18.1 18.1 18.1 12.4PG and Group 3 Assets . . . . . . . . . . . . . . . . . . . . . . 23.7 18.0 18.0 17.9 12.2VP . . . . . . . . . . . . . . . . . . . . . . . . . . . . . . . . . . . . . . 6.0 6.0 6.0 6.0 5.7VQ . . . . . . . . . . . . . . . . . . . . . . . . . . . . . . . . . . . . . . 14.0 13.1 13.1 13.1 9.6ZP . . . . . . . . . . . . . . . . . . . . . . . . . . . . . . . . . . . . . . . 23.7 18.6 18.6 18.6 13.3
Group 4
0% 100% 250% 400% 500%PSA Prepayment Assumption
L and Group 4 Assets . . . . . . . . . . . . . . . . . . . . . . . . 16.5 14.1 10.0 7.2 5.9LA, LC, LD, LE, LG, LH, LI, LJ, LK, LM, LO,
LP, LQ, LT, LU, LW and LY . . . . . . . . . . . . . . . . 16.5 14.1 10.0 7.2 5.9LB . . . . . . . . . . . . . . . . . . . . . . . . . . . . . . . . . . . . . . 18.8 18.8 18.8 18.8 18.8
Group 5
0% 100% 150% 300% 400%PSA Prepayment Assumption
UA . . . . . . . . . . . . . . . . . . . . . . . . . . . . . . . . . . . . . . 16.7 7.3 5.7 3.5 2.8UB . . . . . . . . . . . . . . . . . . . . . . . . . . . . . . . . . . . . . . 28.4 22.2 18.9 12.0 9.4VA . . . . . . . . . . . . . . . . . . . . . . . . . . . . . . . . . . . . . . 6.0 6.0 6.0 5.4 4.8VB . . . . . . . . . . . . . . . . . . . . . . . . . . . . . . . . . . . . . . 14.0 14.0 13.1 8.6 6.9Z . . . . . . . . . . . . . . . . . . . . . . . . . . . . . . . . . . . . . . . . 28.4 22.2 19.4 13.1 10.4Group 5 Assets . . . . . . . . . . . . . . . . . . . . . . . . . . . . . 19.3 10.6 8.6 5.3 4.3
The Assets
The Group 1, 2 and 5 Assets (the “PC Assets”) consist of Freddie Mac PCs with the followingcharacteristics:
Group Principal BalanceOriginal Term
(in years) Interest Rate
1(1) $165,133,768 30 5.0%2(2) 39,378,293 30 5.55(3) 54,500,800 30 3.5
(1) Backed by High LTV Mortgages. See General Information — The Mortgages.(2) Approximately 93.25% of the Group 2 Assets are backed by Initial Interest Mortgages that require payments of accrued
interest (but do not require payments of principal) for up to 10 years following origination and approximately 6.75% of theGroup 2 Assets are backed by Initial Interest Mortgages that require payments of accrued interest (but do not require paymentsof principal) for up to 15 years following origination. See General Information — The Mortgages.
(3) Backed by Super-Conforming Mortgages. See General Information — The Mortgages.
II-5
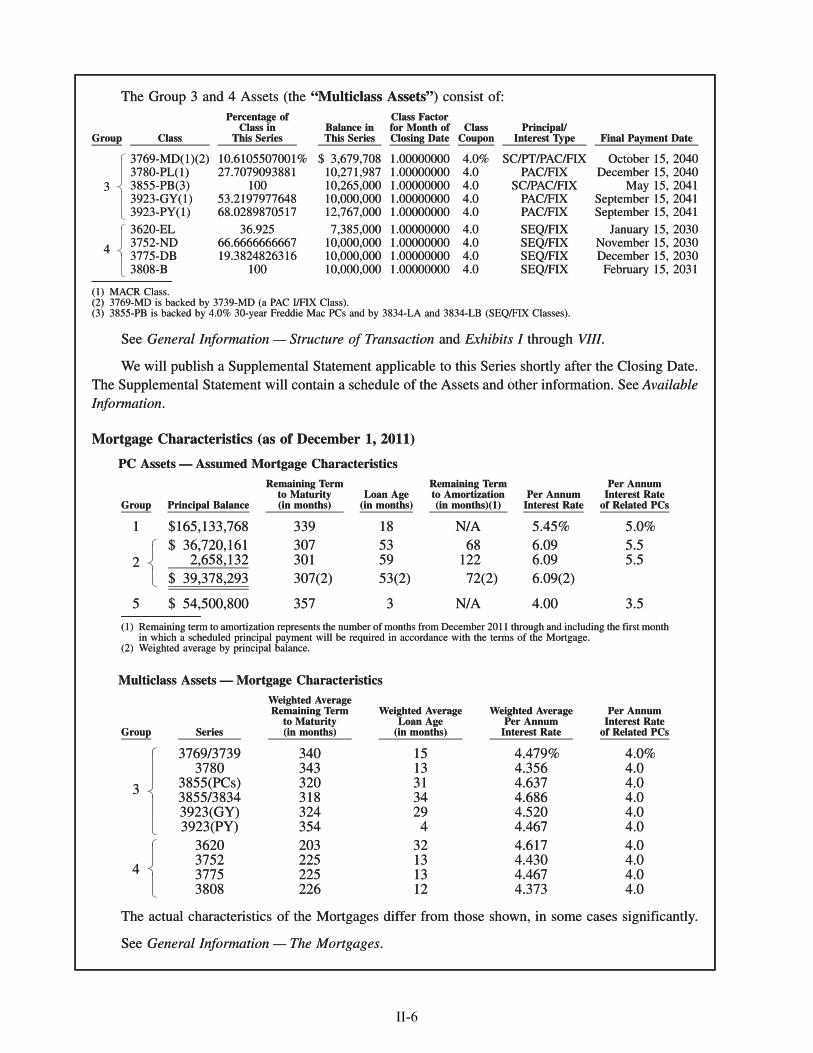
The Group 3 and 4 Assets (the “Multiclass Assets”) consist of:
Group Class
Percentage ofClass in
This SeriesBalance inThis Series
Class Factorfor Month ofClosing Date
ClassCoupon
Principal/Interest Type Final Payment Date
3
3769-MD(1)(2) 10.6105507001% $ 3,679,708 1.00000000 4.0% SC/PT/PAC/FIX October 15, 20403780-PL(1) 27.7079093881 10,271,987 1.00000000 4.0 PAC/FIX December 15, 20403855-PB(3) 100 10,265,000 1.00000000 4.0 SC/PAC/FIX May 15, 20413923-GY(1) 53.2197977648 10,000,000 1.00000000 4.0 PAC/FIX September 15, 20413923-PY(1) 68.0289870517 12,767,000 1.00000000 4.0 PAC/FIX September 15, 2041
4
3620-EL 36.925 7,385,000 1.00000000 4.0 SEQ/FIX January 15, 20303752-ND 66.6666666667 10,000,000 1.00000000 4.0 SEQ/FIX November 15, 20303775-DB 19.3824826316 10,000,000 1.00000000 4.0 SEQ/FIX December 15, 20303808-B 100 10,000,000 1.00000000 4.0 SEQ/FIX February 15, 2031
(1) MACR Class.(2) 3769-MD is backed by 3739-MD (a PAC I/FIX Class).(3) 3855-PB is backed by 4.0% 30-year Freddie Mac PCs and by 3834-LA and 3834-LB (SEQ/FIX Classes).
See General Information — Structure of Transaction and Exhibits I through VIII.
We will publish a Supplemental Statement applicable to this Series shortly after the Closing Date.The Supplemental Statement will contain a schedule of the Assets and other information. See AvailableInformation.
Mortgage Characteristics (as of December 1, 2011)
PC Assets — Assumed Mortgage Characteristics
Group Principal Balance
Remaining Termto Maturity(in months)
Loan Age(in months)
Remaining Termto Amortization(in months)(1)
Per AnnumInterest Rate
Per AnnumInterest Rate
of Related PCs
1 $165,133,768 339 18 N/A 5.45% 5.0%
2$ 36,720,161 307 53 68 6.09 5.5
2,658,132 301 59 122 6.09 5.5$ 39,378,293 307(2) 53(2) 72(2) 6.09(2)
5 $ 54,500,800 357 3 N/A 4.00 3.5
(1) Remaining term to amortization represents the number of months from December 2011 through and including the first monthin which a scheduled principal payment will be required in accordance with the terms of the Mortgage.
(2) Weighted average by principal balance.
Multiclass Assets — Mortgage Characteristics
Group Series
Weighted AverageRemaining Term
to Maturity(in months)
Weighted AverageLoan Age
(in months)
Weighted AveragePer Annum
Interest Rate
Per AnnumInterest Rate
of Related PCs
3
3769/3739 340 15 4.479% 4.0%3780 343 13 4.356 4.0
3855(PCs) 320 31 4.637 4.03855/3834 318 34 4.686 4.03923(GY) 324 29 4.520 4.03923(PY) 354 4 4.467 4.0
4
3620 203 32 4.617 4.03752 225 13 4.430 4.03775 225 13 4.467 4.03808 226 12 4.373 4.0
The actual characteristics of the Mortgages differ from those shown, in some cases significantly.
See General Information — The Mortgages.
The Group 3 and 4 Assets (the “Multiclass Assets”) consist of:
Group Class
Percentage ofClass in
This SeriesBalance inThis Series
Class Factorfor Month ofClosing Date
ClassCoupon
Principal/Interest Type Final Payment Date
3
3769-MD(1)(2) 10.6105507001% $ 3,679,708 1.00000000 4.0% SC/PT/PAC/FIX October 15, 20403780-PL(1) 27.7079093881 10,271,987 1.00000000 4.0 PAC/FIX December 15, 20403855-PB(3) 100 10,265,000 1.00000000 4.0 SC/PAC/FIX May 15, 20413923-GY(1) 53.2197977648 10,000,000 1.00000000 4.0 PAC/FIX September 15, 20413923-PY(1) 68.0289870517 12,767,000 1.00000000 4.0 PAC/FIX September 15, 2041
�������������������������
4
3620-EL 36.925 7,385,000 1.00000000 4.0 SEQ/FIX January 15, 20303752-ND 66.6666666667 10,000,000 1.00000000 4.0 SEQ/FIX November 15, 20303775-DB 19.3824826316 10,000,000 1.00000000 4.0 SEQ/FIX December 15, 20303808-B 100 10,000,000 1.00000000 4.0 SEQ/FIX February 15, 2031
���������������������
(1) MACR Class.(2) 3769-MD is backed by 3739-MD (a PAC I/FIX Class).(3) 3855-PB is backed by 4.0% 30-year Freddie Mac PCs and by 3834-LA and 3834-LB (SEQ/FIX Classes).
See General Information — Structure of Transaction and Exhibits I through VIII.
We will publish a Supplemental Statement applicable to this Series shortly after the Closing Date.The Supplemental Statement will contain a schedule of the Assets and other information. See AvailableInformation.
Mortgage Characteristics (as of December 1, 2011)
PC Assets — Assumed Mortgage Characteristics
Group Principal Balance
Remaining Termto Maturity(in months)
Loan Age(in months)
Remaining Termto Amortization(in months)(1)
Per AnnumInterest Rate
Per AnnumInterest Rate
of Related PCs
1 $165,133,768 339 18 N/A 5.45% 5.0%
2$ 36,720,161 307 53 68 6.09 5.5
2,658,132 301 59 122 6.09 5.5$ 39,378,293 307(2) 53(2) 72(2) 6.09(2)
���������������
5 $ 54,500,800 357 3 N/A 4.00 3.5
(1) Remaining term to amortization represents the number of months from December 2011 through and including the first monthin which a scheduled principal payment will be required in accordance with the terms of the Mortgage.
(2) Weighted average by principal balance.
Multiclass Assets — Mortgage Characteristics
Group Series
Weighted AverageRemaining Term
to Maturity(in months)
Weighted AverageLoan Age
(in months)
Weighted AveragePer Annum
Interest Rate
Per AnnumInterest Rate
of Related PCs
3
3769/3739 340 15 4.479% 4.0%3780 343 13 4.356 4.0
3855(PCs) 320 31 4.637 4.03855/3834 318 34 4.686 4.03923(GY) 324 29 4.520 4.03923(PY) 354 4 4.467 4.0
�����������������������������
4
3620 203 32 4.617 4.03752 225 13 4.430 4.03775 225 13 4.467 4.03808 226 12 4.373 4.0
�������������������
The actual characteristics of the Mortgages differ from those shown, in some cases significantly.
See General Information — The Mortgages.
II-6
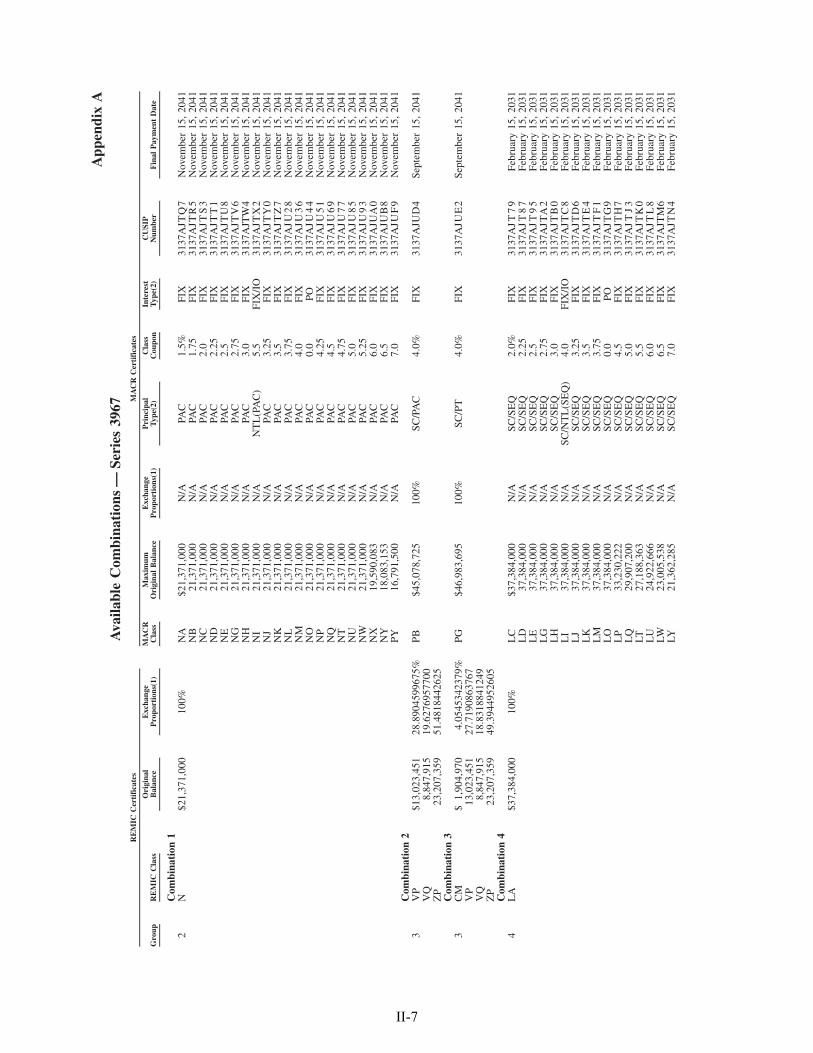
App
endi
xA
Ava
ilabl
eC
ombi
nati
ons
—Se
ries
3967
Gro
upR
EM
ICC
lass
Ori
gina
lB
alan
ceE
xcha
nge
Pro
port
ions
(1)
MA
CR
Cla
ssM
axim
umO
rigi
nal
Bal
ance
Exc
hang
eP
ropo
rtio
ns(1
)P
rinc
ipal
Typ
e(2)
Cla
ssC
oupo
nIn
tere
stT
ype(
2)C
USI
PN
umbe
rF
inal
Pay
men
tD
ate
RE
MIC
Cer
tifi
cate
sM
AC
RC
erti
fica
tes
Com
bina
tion
12
N$2
1,37
1,00
010
0%N
A$2
1,37
1,00
0N
/APA
C1.
5%FI
X31
37A
JTQ
7N
ovem
ber
15,
2041
NB
21,3
71,0
00N
/APA
C1.
75FI
X31
37A
JTR
5N
ovem
ber
15,
2041
NC
21,3
71,0
00N
/APA
C2.
0FI
X31
37A
JTS
3N
ovem
ber
15,
2041
ND
21,3
71,0
00N
/APA
C2.
25FI
X31
37A
JTT
1N
ovem
ber
15,
2041
NE
21,3
71,0
00N
/APA
C2.
5FI
X31
37A
JTU
8N
ovem
ber
15,
2041
NG
21,3
71,0
00N
/APA
C2.
75FI
X31
37A
JTV
6N
ovem
ber
15,
2041
NH
21,3
71,0
00N
/APA
C3.
0FI
X31
37A
JTW
4N
ovem
ber
15,
2041
NI
21,3
71,0
00N
/AN
TL
(PA
C)
5.5
FIX
/IO
3137
AJT
X2
Nov
embe
r15
,20
41N
J21
,371
,000
N/A
PAC
3.25
FIX
3137
AJT
Y0
Nov
embe
r15
,20
41N
K21
,371
,000
N/A
PAC
3.5
FIX
3137
AJT
Z7
Nov
embe
r15
,20
41N
L21
,371
,000
N/A
PAC
3.75
FIX
3137
AJU
28
Nov
embe
r15
,20
41N
M21
,371
,000
N/A
PAC
4.0
FIX
3137
AJU
36
Nov
embe
r15
,20
41N
O21
,371
,000
N/A
PAC
0.0
PO31
37A
JU4
4N
ovem
ber
15,
2041
NP
21,3
71,0
00N
/APA
C4.
25FI
X31
37A
JU5
1N
ovem
ber
15,
2041
NQ
21,3
71,0
00N
/APA
C4.
5FI
X31
37A
JU6
9N
ovem
ber
15,
2041
NT
21,3
71,0
00N
/APA
C4.
75FI
X31
37A
JU7
7N
ovem
ber
15,
2041
NU
21,3
71,0
00N
/APA
C5.
0FI
X31
37A
JU8
5N
ovem
ber
15,
2041
NW
21,3
71,0
00N
/APA
C5.
25FI
X31
37A
JU9
3N
ovem
ber
15,
2041
NX
19,5
90,0
83N
/APA
C6.
0FI
X31
37A
JUA
0N
ovem
ber
15,
2041
NY
18,0
83,1
53N
/APA
C6.
5FI
X31
37A
JUB
8N
ovem
ber
15,
2041
PY16
,791
,500
N/A
PAC
7.0
FIX
3137
AJU
F9
Nov
embe
r15
,20
41C
ombi
nati
on2
3V
P$1
3,02
3,45
128
.890
4599
675%
PB$4
5,07
8,72
510
0%SC
/PA
C4.
0%FI
X31
37A
JUD
4Se
ptem
ber
15,
2041
VQ
8,84
7,91
519
.627
6957
700
ZP
23,2
07,3
5951
.481
8442
625
Com
bina
tion
33
CM
$1,
904,
970
4.05
4534
2379
%PG
$46,
983,
695
100%
SC/P
T4.
0%FI
X31
37A
JUE
2Se
ptem
ber
15,
2041
VP
13,0
23,4
5127
.719
0863
767
VQ
8,84
7,91
518
.831
8841
249
ZP
23,2
07,3
5949
.394
4952
605
Com
bina
tion
44
LA
$37,
384,
000
100%
LC
$37,
384,
000
N/A
SC/S
EQ
2.0%
FIX
3137
AJT
79
Febr
uary
15,
2031
LD
37,3
84,0
00N
/ASC
/SE
Q2.
25FI
X31
37A
JT8
7Fe
brua
ry15
,20
31L
E37
,384
,000
N/A
SC/S
EQ
2.5
FIX
3137
AJT
95
Febr
uary
15,
2031
LG
37,3
84,0
00N
/ASC
/SE
Q2.
75FI
X31
37A
JTA
2Fe
brua
ry15
,20
31L
H37
,384
,000
N/A
SC/S
EQ
3.0
FIX
3137
AJT
B0
Febr
uary
15,
2031
LI
37,3
84,0
00N
/ASC
/NT
L(S
EQ
)4.
0FI
X/I
O31
37A
JTC
8Fe
brua
ry15
,20
31L
J37
,384
,000
N/A
SC/S
EQ
3.25
FIX
3137
AJT
D6
Febr
uary
15,
2031
LK
37,3
84,0
00N
/ASC
/SE
Q3.
5FI
X31
37A
JTE
4Fe
brua
ry15
,20
31L
M37
,384
,000
N/A
SC/S
EQ
3.75
FIX
3137
AJT
F1
Febr
uary
15,
2031
LO
37,3
84,0
00N
/ASC
/SE
Q0.
0PO
3137
AJT
G9
Febr
uary
15,
2031
LP
33,2
30,2
22N
/ASC
/SE
Q4.
5FI
X31
37A
JTH
7Fe
brua
ry15
,20
31L
Q29
,907
,200
N/A
SC/S
EQ
5.0
FIX
3137
AJ
TJ
3Fe
brua
ry15
,20
31LT
27,1
88,3
63N
/ASC
/SE
Q5.
5FI
X31
37A
JTK
0Fe
brua
ry15
,20
31L
U24
,922
,666
N/A
SC/S
EQ
6.0
FIX
3137
AJT
L8
Febr
uary
15,
2031
LW23
,005
,538
N/A
SC/S
EQ
6.5
FIX
3137
AJT
M6
Febr
uary
15,
2031
LY21
,362
,285
N/A
SC/S
EQ
7.0
FIX
3137
AJT
N4
Febr
uary
15,
2031
II-7
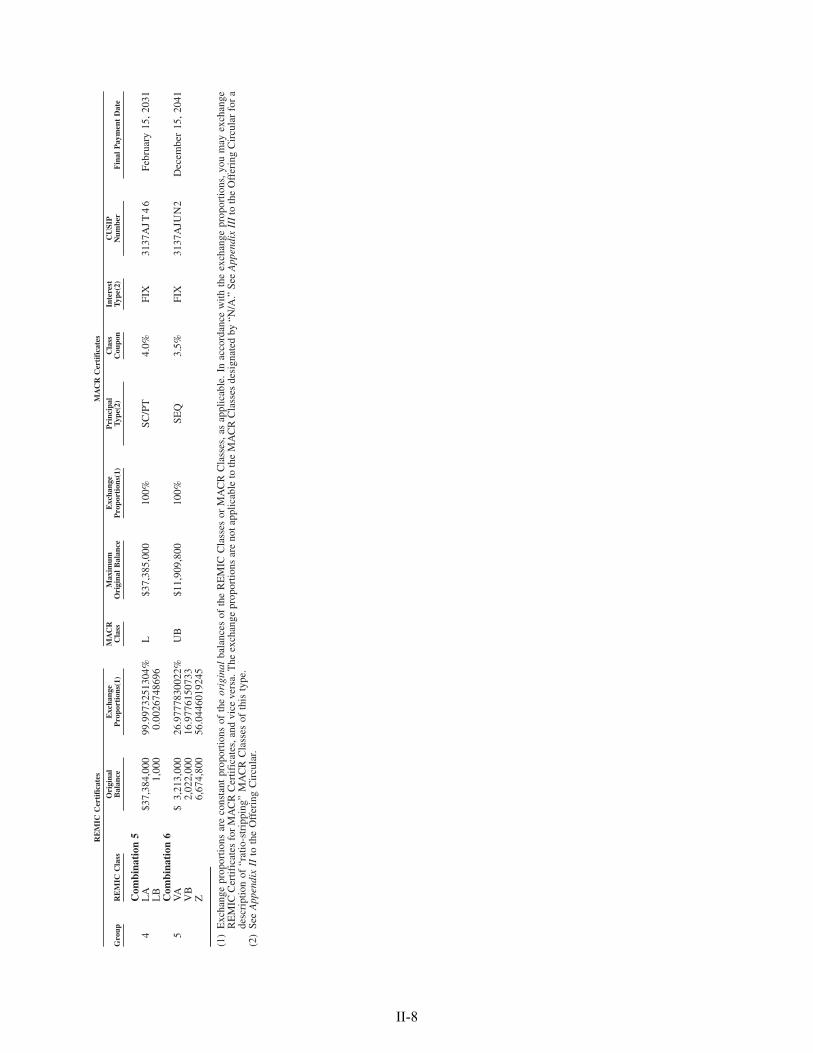
Gro
upR
EM
ICC
lass
Ori
gina
lB
alan
ceE
xcha
nge
Pro
port
ions
(1)
MA
CR
Cla
ssM
axim
umO
rigi
nal
Bal
ance
Exc
hang
eP
ropo
rtio
ns(1
)P
rinc
ipal
Typ
e(2)
Cla
ssC
oupo
nIn
tere
stT
ype(
2)C
USI
PN
umbe
rF
inal
Pay
men
tD
ate
RE
MIC
Cer
tifi
cate
sM
AC
RC
erti
fica
tes
Com
bina
tion
54
LA
$37,
384,
000
99.9
9732
5130
4%L
$37,
385,
000
100%
SC/P
T4.
0%FI
X31
37A
JT4
6Fe
brua
ry15
,20
31L
B1,
000
0.00
2674
8696
Com
bina
tion
65
VA
$3,
213,
000
26.9
7778
3002
2%U
B$1
1,90
9,80
010
0%SE
Q3.
5%FI
X31
37A
JUN
2D
ecem
ber
15,
2041
VB
2,02
2,00
016
.977
6150
733
Z6,
674,
800
56.0
4460
1924
5
(1)
Exc
hang
epr
opor
tions
are
cons
tant
prop
ortio
nsof
the
orig
inal
bala
nces
ofth
eR
EM
ICC
lass
esor
MA
CR
Cla
sses
,as
appl
icab
le.
Inac
cord
ance
with
the
exch
ange
prop
ortio
ns,y
oum
ayex
chan
geR
EM
ICC
ertif
icat
esfo
rM
AC
RC
ertif
icat
es,a
ndvi
ceve
rsa.
The
exch
ange
prop
ortio
nsar
eno
tapp
licab
leto
the
MA
CR
Cla
sses
desi
gnat
edby
“N/A
.”Se
eA
ppen
dix
III
toth
eO
ffer
ing
Cir
cula
rfo
ra
desc
ript
ion
of“r
atio
-str
ippi
ng”
MA
CR
Cla
sses
ofth
isty
pe.
(2)
See
App
endi
xII
toth
eO
ffer
ing
Cir
cula
r.
II-8
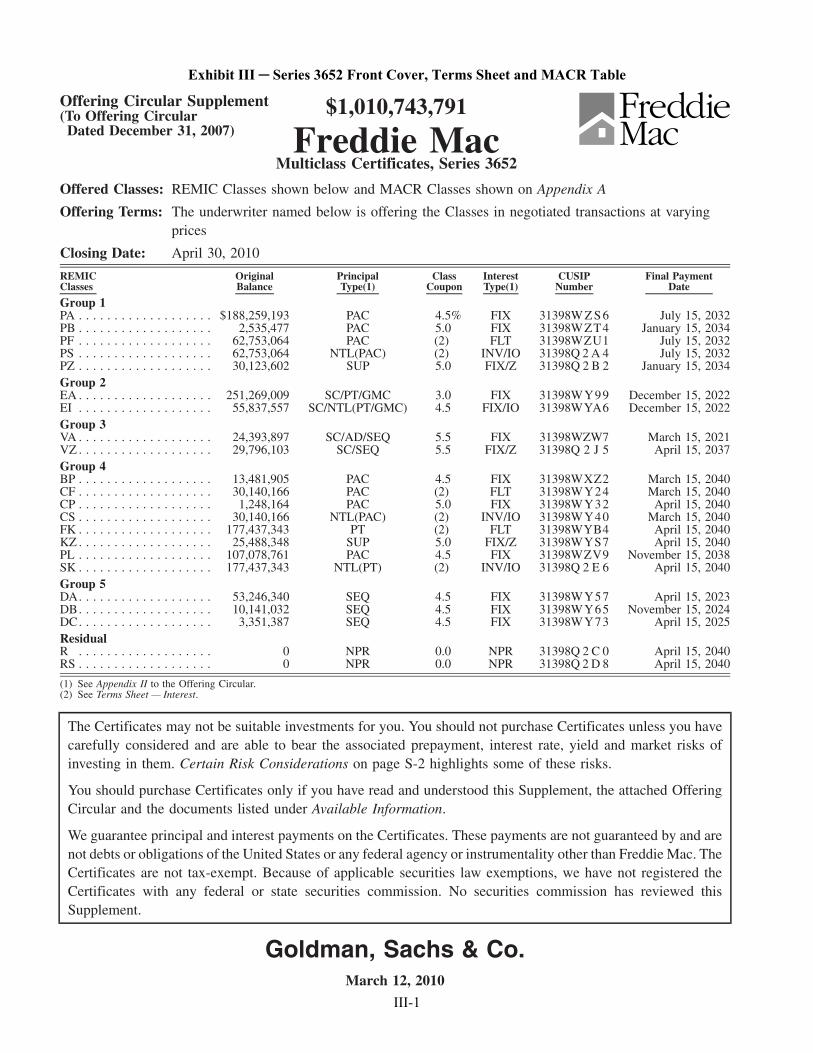
Offering Circular Supplement(To Offering Circular
Dated December 31, 2007)
$1,010,743,791
Freddie MacMulticlass Certificates, Series 3652
Offered Classes: REMIC Classes shown below and MACR Classes shown on Appendix A
Offering Terms: The underwriter named below is offering the Classes in negotiated transactions at varyingprices
Closing Date: April 30, 2010
REMICClasses
OriginalBalance
PrincipalType(1)
ClassCoupon
InterestType(1)
CUSIPNumber
Final PaymentDate
Group 1PA . . . . . . . . . . . . . . . . . . . $188,259,193 PAC 4.5% FIX 31398W Z S 6 July 15, 2032PB . . . . . . . . . . . . . . . . . . . 2,535,477 PAC 5.0 FIX 31398WZT4 January 15, 2034PF . . . . . . . . . . . . . . . . . . . 62,753,064 PAC (2) FLT 31398WZU1 July 15, 2032PS . . . . . . . . . . . . . . . . . . . 62,753,064 NTL(PAC) (2) INV/IO 31398Q 2 A 4 July 15, 2032PZ . . . . . . . . . . . . . . . . . . . 30,123,602 SUP 5.0 FIX/Z 31398Q 2 B 2 January 15, 2034Group 2EA . . . . . . . . . . . . . . . . . . . 251,269,009 SC/PT/GMC 3.0 FIX 31398WY99 December 15, 2022EI . . . . . . . . . . . . . . . . . . . 55,837,557 SC/NTL(PT/GMC) 4.5 FIX/IO 31398WYA6 December 15, 2022Group 3VA . . . . . . . . . . . . . . . . . . . 24,393,897 SC/AD/SEQ 5.5 FIX 31398WZW7 March 15, 2021VZ . . . . . . . . . . . . . . . . . . . 29,796,103 SC/SEQ 5.5 FIX/Z 31398Q 2 J 5 April 15, 2037Group 4BP . . . . . . . . . . . . . . . . . . . 13,481,905 PAC 4.5 FIX 31398WXZ2 March 15, 2040CF . . . . . . . . . . . . . . . . . . . 30,140,166 PAC (2) FLT 31398WY24 March 15, 2040CP . . . . . . . . . . . . . . . . . . . 1,248,164 PAC 5.0 FIX 31398WY32 April 15, 2040CS . . . . . . . . . . . . . . . . . . . 30,140,166 NTL(PAC) (2) INV/IO 31398WY40 March 15, 2040FK . . . . . . . . . . . . . . . . . . . 177,437,343 PT (2) FLT 31398WYB4 April 15, 2040KZ . . . . . . . . . . . . . . . . . . . 25,488,348 SUP 5.0 FIX/Z 31398WYS7 April 15, 2040PL . . . . . . . . . . . . . . . . . . . 107,078,761 PAC 4.5 FIX 31398WZV9 November 15, 2038SK . . . . . . . . . . . . . . . . . . . 177,437,343 NTL(PT) (2) INV/IO 31398Q 2 E 6 April 15, 2040Group 5DA. . . . . . . . . . . . . . . . . . . 53,246,340 SEQ 4.5 FIX 31398WY57 April 15, 2023DB. . . . . . . . . . . . . . . . . . . 10,141,032 SEQ 4.5 FIX 31398WY65 November 15, 2024DC. . . . . . . . . . . . . . . . . . . 3,351,387 SEQ 4.5 FIX 31398WY73 April 15, 2025ResidualR . . . . . . . . . . . . . . . . . . . 0 NPR 0.0 NPR 31398Q 2 C 0 April 15, 2040RS . . . . . . . . . . . . . . . . . . . 0 NPR 0.0 NPR 31398Q 2 D 8 April 15, 2040
(1) See Appendix II to the Offering Circular.(2) See Terms Sheet — Interest.
The Certificates may not be suitable investments for you. You should not purchase Certificates unless you havecarefully considered and are able to bear the associated prepayment, interest rate, yield and market risks ofinvesting in them. Certain Risk Considerations on page S-2 highlights some of these risks.
You should purchase Certificates only if you have read and understood this Supplement, the attached OfferingCircular and the documents listed under Available Information.
We guarantee principal and interest payments on the Certificates. These payments are not guaranteed by and arenot debts or obligations of the United States or any federal agency or instrumentality other than Freddie Mac. TheCertificates are not tax-exempt. Because of applicable securities law exemptions, we have not registered theCertificates with any federal or state securities commission. No securities commission has reviewed thisSupplement.
Goldman, Sachs & Co.March 12, 2010
III-1
Exhibit III ─ Series 3652 Front Cover, Terms Sheet and MACR Table
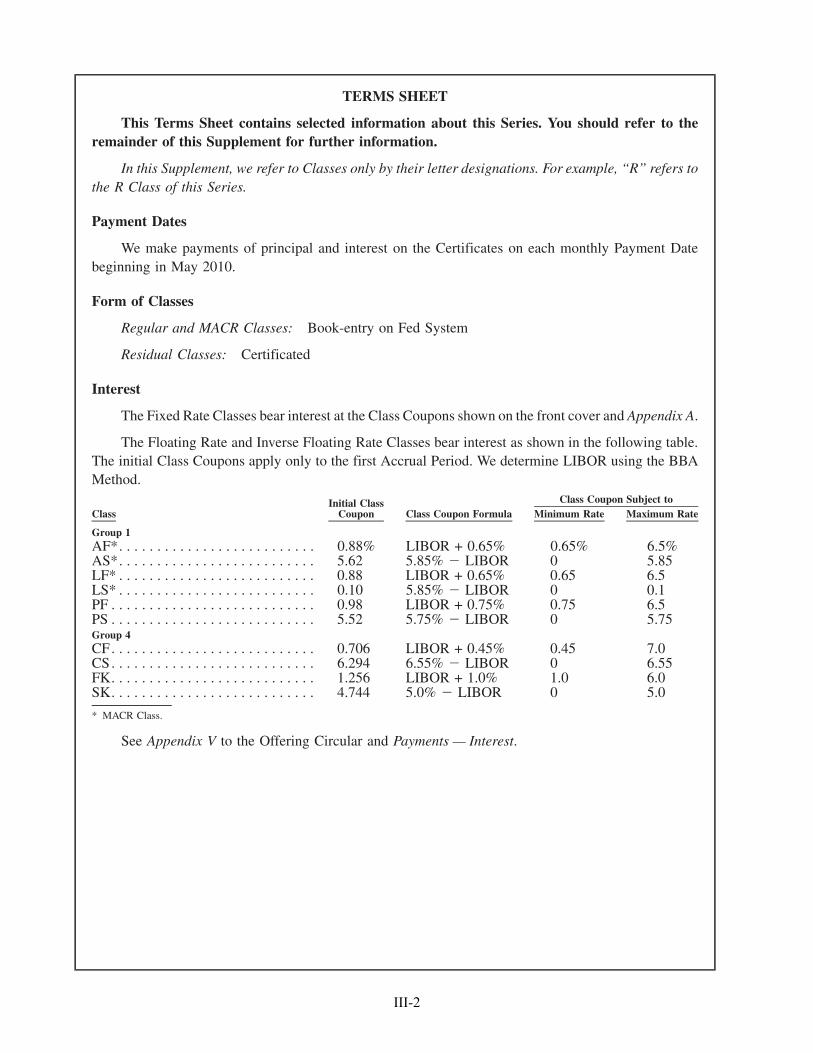
TERMS SHEET
This Terms Sheet contains selected information about this Series. You should refer to theremainder of this Supplement for further information.
In this Supplement, we refer to Classes only by their letter designations. For example, “R” refers tothe R Class of this Series.
Payment Dates
We make payments of principal and interest on the Certificates on each monthly Payment Datebeginning in May 2010.
Form of Classes
Regular and MACR Classes: Book-entry on Fed System
Residual Classes: Certificated
Interest
The Fixed Rate Classes bear interest at the Class Coupons shown on the front cover and Appendix A.
The Floating Rate and Inverse Floating Rate Classes bear interest as shown in the following table.The initial Class Coupons apply only to the first Accrual Period. We determine LIBOR using the BBAMethod.
ClassInitial Class
Coupon Class Coupon Formula Minimum Rate Maximum RateClass Coupon Subject to
Group 1AF*. . . . . . . . . . . . . . . . . . . . . . . . . . 0.88% LIBOR + 0.65% 0.65% 6.5%AS*. . . . . . . . . . . . . . . . . . . . . . . . . . 5.62 5.85% � LIBOR 0 5.85LF* . . . . . . . . . . . . . . . . . . . . . . . . . . 0.88 LIBOR + 0.65% 0.65 6.5LS* . . . . . . . . . . . . . . . . . . . . . . . . . . 0.10 5.85% � LIBOR 0 0.1PF . . . . . . . . . . . . . . . . . . . . . . . . . . . 0.98 LIBOR + 0.75% 0.75 6.5PS . . . . . . . . . . . . . . . . . . . . . . . . . . . 5.52 5.75% � LIBOR 0 5.75Group 4CF. . . . . . . . . . . . . . . . . . . . . . . . . . . 0.706 LIBOR + 0.45% 0.45 7.0CS. . . . . . . . . . . . . . . . . . . . . . . . . . . 6.294 6.55% � LIBOR 0 6.55FK. . . . . . . . . . . . . . . . . . . . . . . . . . . 1.256 LIBOR + 1.0% 1.0 6.0SK. . . . . . . . . . . . . . . . . . . . . . . . . . . 4.744 5.0% � LIBOR 0 5.0
* MACR Class.
See Appendix V to the Offering Circular and Payments — Interest.
III-2
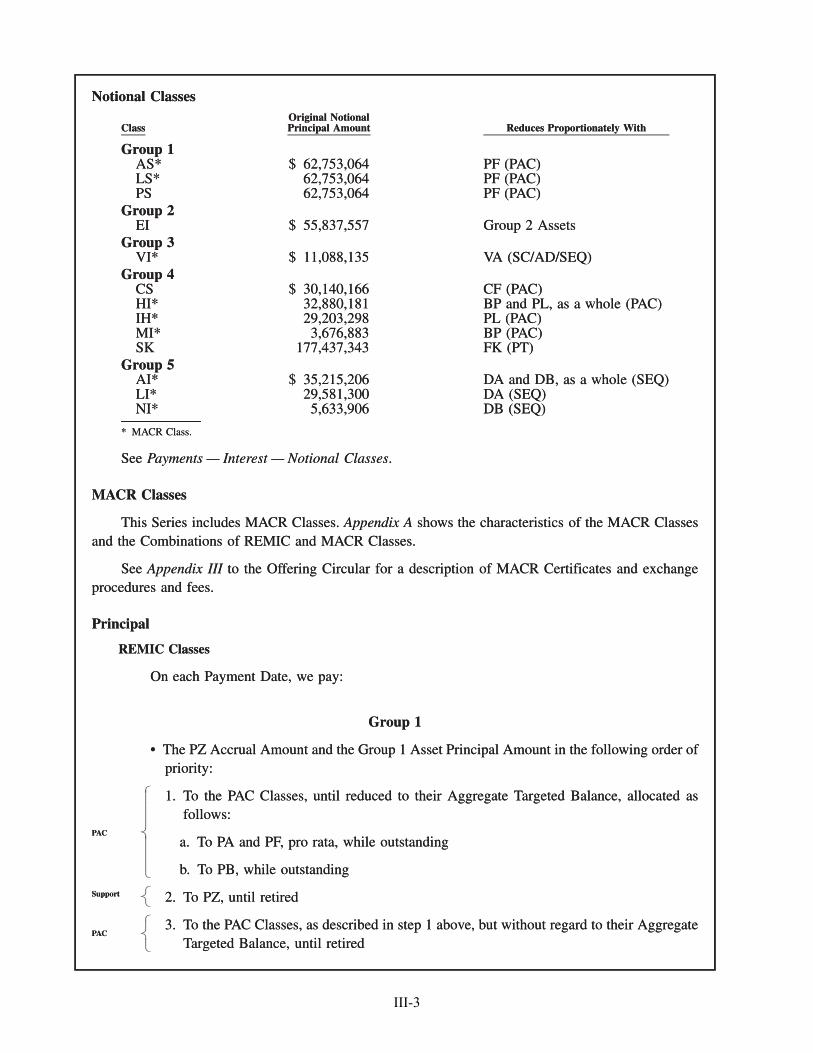
Notional Classes
ClassOriginal NotionalPrincipal Amount Reduces Proportionately With
Group 1AS* $ 62,753,064 PF (PAC)LS* 62,753,064 PF (PAC)PS 62,753,064 PF (PAC)
Group 2EI $ 55,837,557 Group 2 Assets
Group 3VI* $ 11,088,135 VA (SC/AD/SEQ)
Group 4CS $ 30,140,166 CF (PAC)HI* 32,880,181 BP and PL, as a whole (PAC)IH* 29,203,298 PL (PAC)MI* 3,676,883 BP (PAC)SK 177,437,343 FK (PT)
Group 5AI* $ 35,215,206 DA and DB, as a whole (SEQ)LI* 29,581,300 DA (SEQ)NI* 5,633,906 DB (SEQ)
* MACR Class.
See Payments — Interest — Notional Classes.
MACR Classes
This Series includes MACR Classes. Appendix A shows the characteristics of the MACR Classesand the Combinations of REMIC and MACR Classes.
See Appendix III to the Offering Circular for a description of MACR Certificates and exchangeprocedures and fees.
Principal
REMIC Classes
On each Payment Date, we pay:
Group 1
• The PZ Accrual Amount and the Group 1 Asset Principal Amount in the following order ofpriority:
1. To the PAC Classes, until reduced to their Aggregate Targeted Balance, allocated asfollows:
a. To PA and PF, pro rata, while outstanding
b. To PB, while outstanding
PAC
2. To PZ, until retiredSupport
3. To the PAC Classes, as described in step 1 above, but without regard to their AggregateTargeted Balance, until retired
PAC
Notional Classes
ClassOriginal NotionalPrincipal Amount Reduces Proportionately With
Group 1AS* $ 62,753,064 PF (PAC)LS* 62,753,064 PF (PAC)PS 62,753,064 PF (PAC)
Group 2EI $ 55,837,557 Group 2 Assets
Group 3VI* $ 11,088,135 VA (SC/AD/SEQ)
Group 4CS $ 30,140,166 CF (PAC)HI* 32,880,181 BP and PL, as a whole (PAC)IH* 29,203,298 PL (PAC)MI* 3,676,883 BP (PAC)SK 177,437,343 FK (PT)
Group 5AI* $ 35,215,206 DA and DB, as a whole (SEQ)LI* 29,581,300 DA (SEQ)NI* 5,633,906 DB (SEQ)
* MACR Class.
See Payments — Interest — Notional Classes.
MACR Classes
This Series includes MACR Classes. Appendix A shows the characteristics of the MACR Classesand the Combinations of REMIC and MACR Classes.
See Appendix III to the Offering Circular for a description of MACR Certificates and exchangeprocedures and fees.
Principal
REMIC Classes
On each Payment Date, we pay:
Group 1
• The PZ Accrual Amount and the Group 1 Asset Principal Amount in the following order ofpriority:
1. To the PAC Classes, until reduced to their Aggregate Targeted Balance, allocated asfollows:
a. To PA and PF, pro rata, while outstanding
b. To PB, while outstanding
�������������������������������
PAC
2. To PZ, until retired�����
Support
3. To the PAC Classes, as described in step 1 above, but without regard to their AggregateTargeted Balance, until retired
�����������
PAC
III-3
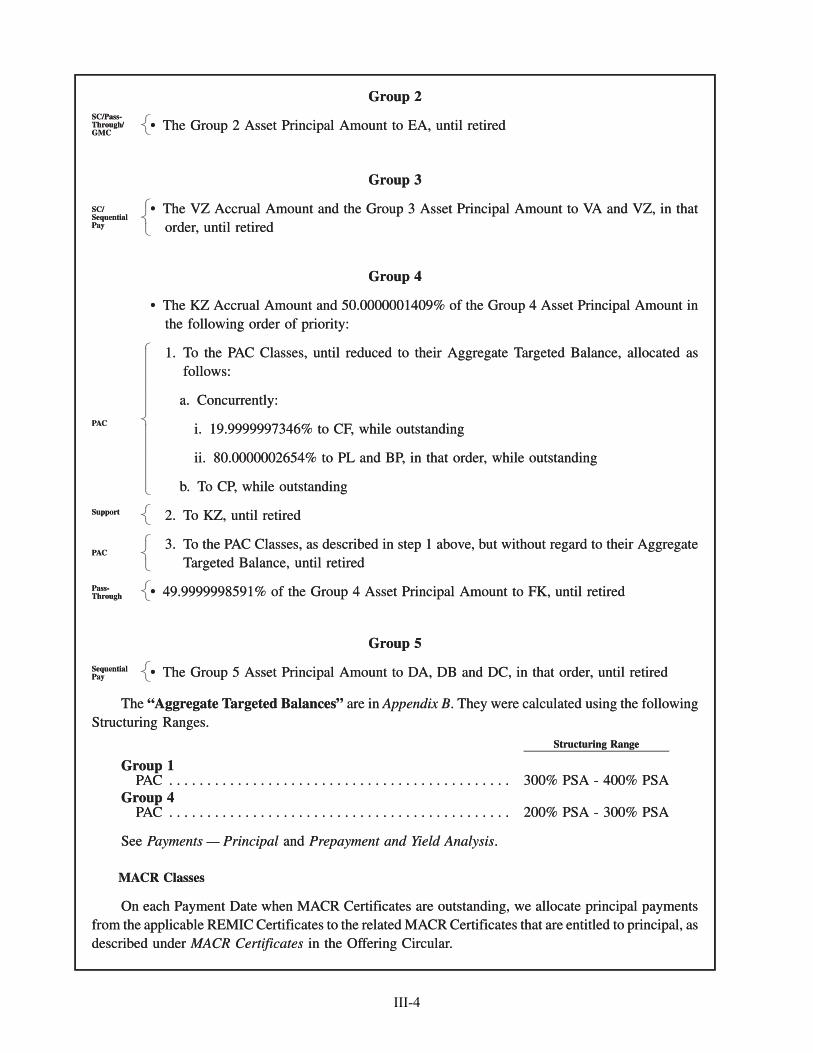
Group 2
• The Group 2 Asset Principal Amount to EA, until retiredSC/Pass-Through/GMC
Group 3
• The VZ Accrual Amount and the Group 3 Asset Principal Amount to VA and VZ, in thatorder, until retired
SC/SequentialPay
Group 4
• The KZ Accrual Amount and 50.0000001409% of the Group 4 Asset Principal Amount inthe following order of priority:
1. To the PAC Classes, until reduced to their Aggregate Targeted Balance, allocated asfollows:
a. Concurrently:
i. 19.9999997346% to CF, while outstanding
ii. 80.0000002654% to PL and BP, in that order, while outstanding
b. To CP, while outstanding
PAC
2. To KZ, until retiredSupport
3. To the PAC Classes, as described in step 1 above, but without regard to their AggregateTargeted Balance, until retired
PAC
• 49.9999998591% of the Group 4 Asset Principal Amount to FK, until retiredPass-Through
Group 5
• The Group 5 Asset Principal Amount to DA, DB and DC, in that order, until retiredSequentialPay
The “Aggregate Targeted Balances” are in Appendix B. They were calculated using the followingStructuring Ranges.
Structuring Range
Group 1PAC . . . . . . . . . . . . . . . . . . . . . . . . . . . . . . . . . . . . . . . . . . . . . 300% PSA - 400% PSA
Group 4PAC . . . . . . . . . . . . . . . . . . . . . . . . . . . . . . . . . . . . . . . . . . . . . 200% PSA - 300% PSA
See Payments — Principal and Prepayment and Yield Analysis.
MACR Classes
On each Payment Date when MACR Certificates are outstanding, we allocate principal paymentsfrom the applicable REMIC Certificates to the related MACR Certificates that are entitled to principal, asdescribed under MACR Certificates in the Offering Circular.
Group 2
• The Group 2 Asset Principal Amount to EA, until retired�����
SC/Pass-Through/GMC
Group 3
• The VZ Accrual Amount and the Group 3 Asset Principal Amount to VA and VZ, in thatorder, until retired
�����������
SC/SequentialPay
Group 4
• The KZ Accrual Amount and 50.0000001409% of the Group 4 Asset Principal Amount inthe following order of priority:
1. To the PAC Classes, until reduced to their Aggregate Targeted Balance, allocated asfollows:
a. Concurrently:
i. 19.9999997346% to CF, while outstanding
ii. 80.0000002654% to PL and BP, in that order, while outstanding
b. To CP, while outstanding
���������������������������������������������������
PAC
2. To KZ, until retired�����
Support
3. To the PAC Classes, as described in step 1 above, but without regard to their AggregateTargeted Balance, until retired
�����������
PAC
• 49.9999998591% of the Group 4 Asset Principal Amount to FK, until retired�����
Pass-Through
Group 5
• The Group 5 Asset Principal Amount to DA, DB and DC, in that order, until retired�����
SequentialPay
The “Aggregate Targeted Balances” are in Appendix B. They were calculated using the followingStructuring Ranges.
Structuring Range
Group 1PAC . . . . . . . . . . . . . . . . . . . . . . . . . . . . . . . . . . . . . . . . . . . . . 300% PSA - 400% PSA
Group 4PAC . . . . . . . . . . . . . . . . . . . . . . . . . . . . . . . . . . . . . . . . . . . . . 200% PSA - 300% PSA
See Payments — Principal and Prepayment and Yield Analysis.
MACR Classes
On each Payment Date when MACR Certificates are outstanding, we allocate principal paymentsfrom the applicable REMIC Certificates to the related MACR Certificates that are entitled to principal, asdescribed under MACR Certificates in the Offering Circular.
III-4
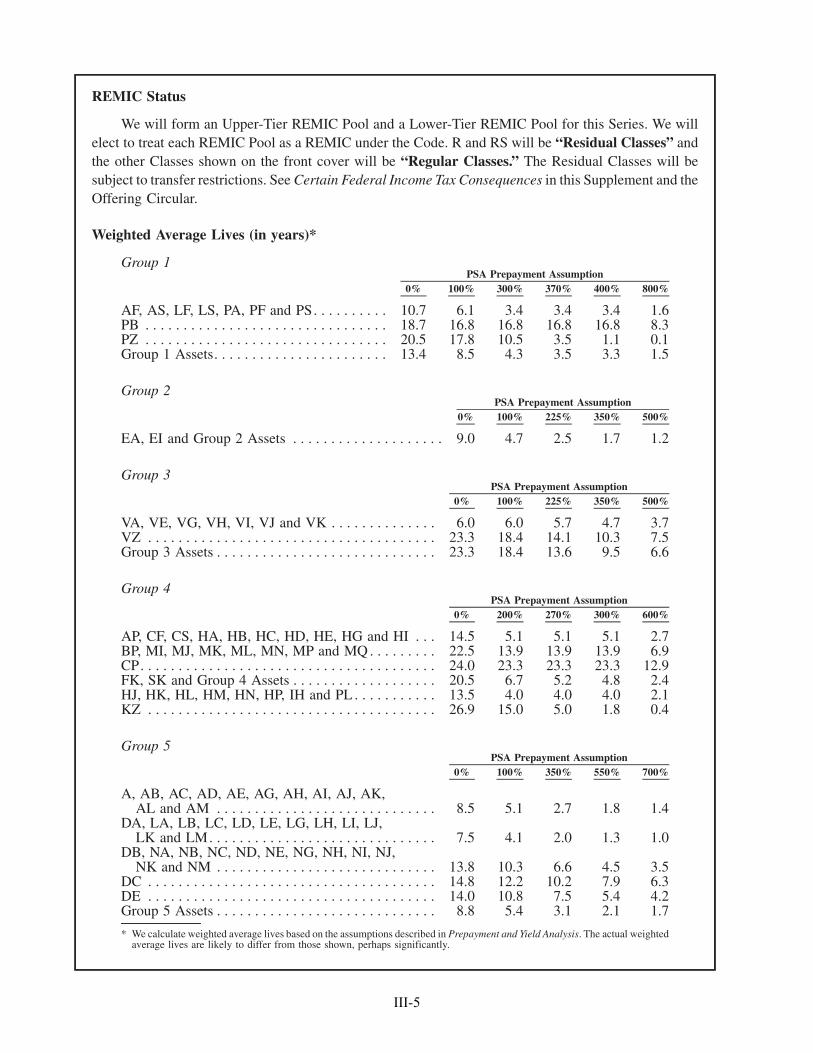
REMIC Status
We will form an Upper-Tier REMIC Pool and a Lower-Tier REMIC Pool for this Series. We willelect to treat each REMIC Pool as a REMIC under the Code. R and RS will be “Residual Classes” andthe other Classes shown on the front cover will be “Regular Classes.” The Residual Classes will besubject to transfer restrictions. See Certain Federal Income Tax Consequences in this Supplement and theOffering Circular.
Weighted Average Lives (in years)*
Group 1
0% 100% 300% 370% 400% 800%PSA Prepayment Assumption
AF, AS, LF, LS, PA, PF and PS. . . . . . . . . . 10.7 6.1 3.4 3.4 3.4 1.6PB . . . . . . . . . . . . . . . . . . . . . . . . . . . . . . . . 18.7 16.8 16.8 16.8 16.8 8.3PZ . . . . . . . . . . . . . . . . . . . . . . . . . . . . . . . . 20.5 17.8 10.5 3.5 1.1 0.1Group 1 Assets. . . . . . . . . . . . . . . . . . . . . . . 13.4 8.5 4.3 3.5 3.3 1.5
Group 2
0% 100% 225% 350% 500%PSA Prepayment Assumption
EA, EI and Group 2 Assets . . . . . . . . . . . . . . . . . . . . 9.0 4.7 2.5 1.7 1.2
Group 3
0% 100% 225% 350% 500%PSA Prepayment Assumption
VA, VE, VG, VH, VI, VJ and VK . . . . . . . . . . . . . . 6.0 6.0 5.7 4.7 3.7VZ . . . . . . . . . . . . . . . . . . . . . . . . . . . . . . . . . . . . . . 23.3 18.4 14.1 10.3 7.5Group 3 Assets . . . . . . . . . . . . . . . . . . . . . . . . . . . . . 23.3 18.4 13.6 9.5 6.6
Group 4
0% 200% 270% 300% 600%PSA Prepayment Assumption
AP, CF, CS, HA, HB, HC, HD, HE, HG and HI . . . 14.5 5.1 5.1 5.1 2.7BP, MI, MJ, MK, ML, MN, MP and MQ . . . . . . . . . 22.5 13.9 13.9 13.9 6.9CP. . . . . . . . . . . . . . . . . . . . . . . . . . . . . . . . . . . . . . . 24.0 23.3 23.3 23.3 12.9FK, SK and Group 4 Assets . . . . . . . . . . . . . . . . . . . 20.5 6.7 5.2 4.8 2.4HJ, HK, HL, HM, HN, HP, IH and PL . . . . . . . . . . . 13.5 4.0 4.0 4.0 2.1KZ . . . . . . . . . . . . . . . . . . . . . . . . . . . . . . . . . . . . . . 26.9 15.0 5.0 1.8 0.4
Group 5
0% 100% 350% 550% 700%PSA Prepayment Assumption
A, AB, AC, AD, AE, AG, AH, AI, AJ, AK,AL and AM . . . . . . . . . . . . . . . . . . . . . . . . . . . . . 8.5 5.1 2.7 1.8 1.4
DA, LA, LB, LC, LD, LE, LG, LH, LI, LJ,LK and LM. . . . . . . . . . . . . . . . . . . . . . . . . . . . . . 7.5 4.1 2.0 1.3 1.0
DB, NA, NB, NC, ND, NE, NG, NH, NI, NJ,NK and NM . . . . . . . . . . . . . . . . . . . . . . . . . . . . . 13.8 10.3 6.6 4.5 3.5
DC . . . . . . . . . . . . . . . . . . . . . . . . . . . . . . . . . . . . . . 14.8 12.2 10.2 7.9 6.3DE . . . . . . . . . . . . . . . . . . . . . . . . . . . . . . . . . . . . . . 14.0 10.8 7.5 5.4 4.2Group 5 Assets . . . . . . . . . . . . . . . . . . . . . . . . . . . . . 8.8 5.4 3.1 2.1 1.7
* We calculate weighted average lives based on the assumptions described in Prepayment and Yield Analysis. The actual weightedaverage lives are likely to differ from those shown, perhaps significantly.
III-5
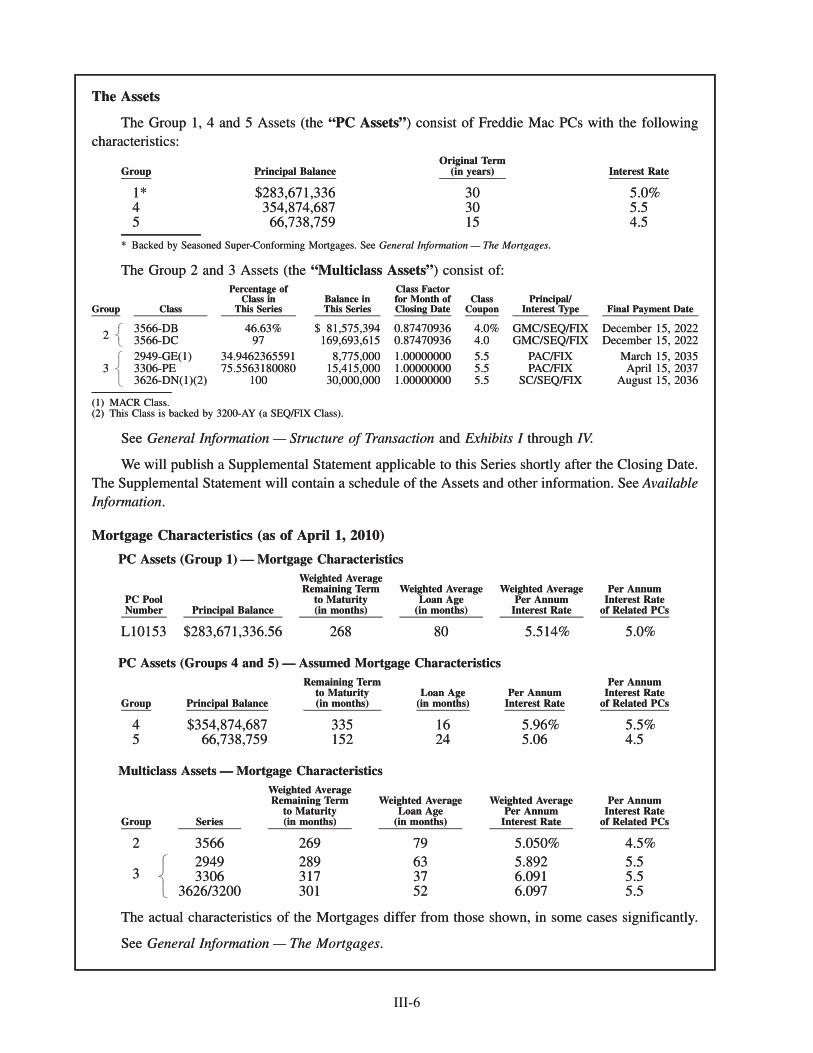
The Assets
The Group 1, 4 and 5 Assets (the “PC Assets”) consist of Freddie Mac PCs with the followingcharacteristics:
Group Principal BalanceOriginal Term
(in years) Interest Rate
1* $283,671,336 30 5.0%4 354,874,687 30 5.55 66,738,759 15 4.5
* Backed by Seasoned Super-Conforming Mortgages. See General Information — The Mortgages.
The Group 2 and 3 Assets (the “Multiclass Assets”) consist of:
Group Class
Percentage ofClass in
This SeriesBalance inThis Series
Class Factorfor Month ofClosing Date
ClassCoupon
Principal/Interest Type Final Payment Date
23566-DB 46.63% $ 81,575,394 0.87470936 4.0% GMC/SEQ/FIX December 15, 20223566-DC 97 169,693,615 0.87470936 4.0 GMC/SEQ/FIX December 15, 2022
32949-GE(1) 34.9462365591 8,775,000 1.00000000 5.5 PAC/FIX March 15, 20353306-PE 75.5563180080 15,415,000 1.00000000 5.5 PAC/FIX April 15, 20373626-DN(1)(2) 100 30,000,000 1.00000000 5.5 SC/SEQ/FIX August 15, 2036
(1) MACR Class.(2) This Class is backed by 3200-AY (a SEQ/FIX Class).
See General Information — Structure of Transaction and Exhibits I through IV.
We will publish a Supplemental Statement applicable to this Series shortly after the Closing Date.The Supplemental Statement will contain a schedule of the Assets and other information. See AvailableInformation.
Mortgage Characteristics (as of April 1, 2010)
PC Assets (Group 1) — Mortgage Characteristics
PC PoolNumber Principal Balance
Weighted AverageRemaining Term
to Maturity(in months)
Weighted AverageLoan Age
(in months)
Weighted AveragePer Annum
Interest Rate
Per AnnumInterest Rate
of Related PCs
L10153 $283,671,336.56 268 80 5.514% 5.0%
PC Assets (Groups 4 and 5) — Assumed Mortgage Characteristics
Group Principal Balance
Remaining Termto Maturity(in months)
Loan Age(in months)
Per AnnumInterest Rate
Per AnnumInterest Rate
of Related PCs
4 $354,874,687 335 16 5.96% 5.5%5 66,738,759 152 24 5.06 4.5
Multiclass Assets — Mortgage Characteristics
Group Series
Weighted AverageRemaining Term
to Maturity(in months)
Weighted AverageLoan Age
(in months)
Weighted AveragePer Annum
Interest Rate
Per AnnumInterest Rate
of Related PCs
2 3566 269 79 5.050% 4.5%
32949 289 63 5.892 5.53306 317 37 6.091 5.5
3626/3200 301 52 6.097 5.5
The actual characteristics of the Mortgages differ from those shown, in some cases significantly.
See General Information — The Mortgages.
The Assets
The Group 1, 4 and 5 Assets (the “PC Assets”) consist of Freddie Mac PCs with the followingcharacteristics:
Group Principal BalanceOriginal Term
(in years) Interest Rate
1* $283,671,336 30 5.0%4 354,874,687 30 5.55 66,738,759 15 4.5
* Backed by Seasoned Super-Conforming Mortgages. See General Information — The Mortgages.
The Group 2 and 3 Assets (the “Multiclass Assets”) consist of:
Group Class
Percentage ofClass in
This SeriesBalance inThis Series
Class Factorfor Month ofClosing Date
ClassCoupon
Principal/Interest Type Final Payment Date
23566-DB 46.63% $ 81,575,394 0.87470936 4.0% GMC/SEQ/FIX December 15, 20223566-DC 97 169,693,615 0.87470936 4.0 GMC/SEQ/FIX December 15, 2022
���������
32949-GE(1) 34.9462365591 8,775,000 1.00000000 5.5 PAC/FIX March 15, 20353306-PE 75.5563180080 15,415,000 1.00000000 5.5 PAC/FIX April 15, 20373626-DN(1)(2) 100 30,000,000 1.00000000 5.5 SC/SEQ/FIX August 15, 2036
�������������
(1) MACR Class.(2) This Class is backed by 3200-AY (a SEQ/FIX Class).
See General Information — Structure of Transaction and Exhibits I through IV.
We will publish a Supplemental Statement applicable to this Series shortly after the Closing Date.The Supplemental Statement will contain a schedule of the Assets and other information. See AvailableInformation.
Mortgage Characteristics (as of April 1, 2010)
PC Assets (Group 1) — Mortgage Characteristics
PC PoolNumber Principal Balance
Weighted AverageRemaining Term
to Maturity(in months)
Weighted AverageLoan Age
(in months)
Weighted AveragePer Annum
Interest Rate
Per AnnumInterest Rate
of Related PCs
L10153 $283,671,336.56 268 80 5.514% 5.0%
PC Assets (Groups 4 and 5) — Assumed Mortgage Characteristics
Group Principal Balance
Remaining Termto Maturity(in months)
Loan Age(in months)
Per AnnumInterest Rate
Per AnnumInterest Rate
of Related PCs
4 $354,874,687 335 16 5.96% 5.5%5 66,738,759 152 24 5.06 4.5
Multiclass Assets — Mortgage Characteristics
Group Series
Weighted AverageRemaining Term
to Maturity(in months)
Weighted AverageLoan Age
(in months)
Weighted AveragePer Annum
Interest Rate
Per AnnumInterest Rate
of Related PCs
2 3566 269 79 5.050% 4.5%
32949 289 63 5.892 5.53306 317 37 6.091 5.5
3626/3200 301 52 6.097 5.5
�������������
The actual characteristics of the Mortgages differ from those shown, in some cases significantly.
See General Information — The Mortgages.
III-6
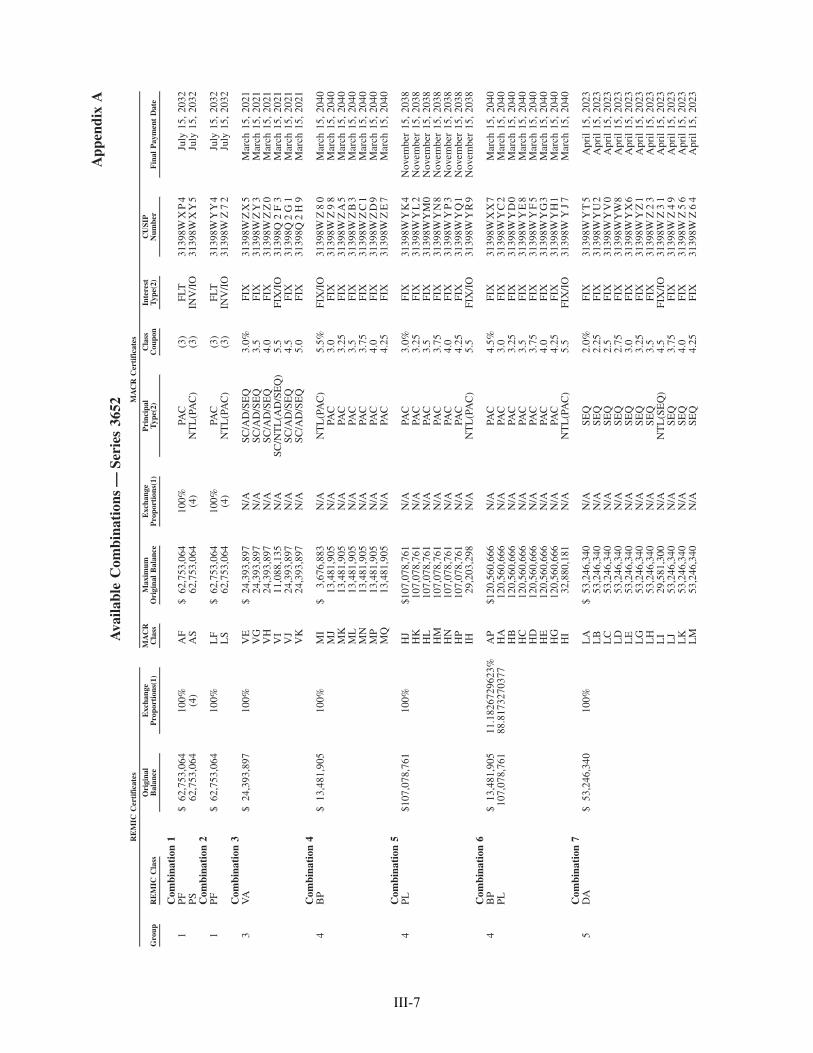
App
endi
xA
Ava
ilabl
eC
ombi
nati
ons
—Se
ries
3652
Gro
upR
EM
ICC
lass
Ori
gina
lB
alan
ceE
xcha
nge
Pro
port
ions
(1)
MA
CR
Cla
ssM
axim
umO
rigi
nal
Bal
ance
Exc
hang
eP
ropo
rtio
ns(1
)P
rinc
ipal
Typ
e(2)
Cla
ssC
oupo
nIn
tere
stT
ype(
2)C
USI
PN
umbe
rF
inal
Pay
men
tD
ate
RE
MIC
Cer
tifi
cate
sM
AC
RC
erti
fica
tes
Com
bina
tion
11
PF$
62,7
53,0
6410
0%A
F$
62,7
53,0
6410
0%PA
C(3
)FL
T31
398W
XP
4Ju
ly15
,20
32PS
62,7
53,0
64(4
)A
S62
,753
,064
(4)
NT
L(P
AC
)(3
)IN
V/I
O31
398W
XY
5Ju
ly15
,20
32C
ombi
nati
on2
1PF
$62
,753
,064
100%
LF
$62
,753
,064
100%
PAC
(3)
FLT
3139
8WY
Y4
July
15,
2032
LS
62,7
53,0
64(4
)N
TL
(PA
C)
(3)
INV
/IO
3139
8WZ
72
July
15,
2032
Com
bina
tion
33
VA
$24
,393
,897
100%
VE
$24
,393
,897
N/A
SC/A
D/S
EQ
3.0%
FIX
3139
8WZ
X5
Mar
ch15
,20
21V
G24
,393
,897
N/A
SC/A
D/S
EQ
3.5
FIX
3139
8WZ
Y3
Mar
ch15
,20
21V
H24
,393
,897
N/A
SC/A
D/S
EQ
4.0
FIX
3139
8WZ
Z0
Mar
ch15
,20
21V
I11
,088
,135
N/A
SC/N
TL
(AD
/SE
Q)
5.5
FIX
/IO
3139
8Q2
F3
Mar
ch15
,20
21V
J24
,393
,897
N/A
SC/A
D/S
EQ
4.5
FIX
3139
8Q2
G1
Mar
ch15
,20
21V
K24
,393
,897
N/A
SC/A
D/S
EQ
5.0
FIX
3139
8Q2
H9
Mar
ch15
,20
21C
ombi
nati
on4
4B
P$
13,4
81,9
0510
0%M
I$
3,67
6,88
3N
/AN
TL
(PA
C)
5.5%
FIX
/IO
3139
8WZ
80
Mar
ch15
,20
40M
J13
,481
,905
N/A
PAC
3.0
FIX
3139
8WZ
98
Mar
ch15
,20
40M
K13
,481
,905
N/A
PAC
3.25
FIX
3139
8WZ
A5
Mar
ch15
,20
40M
L13
,481
,905
N/A
PAC
3.5
FIX
3139
8WZ
B3
Mar
ch15
,20
40M
N13
,481
,905
N/A
PAC
3.75
FIX
3139
8WZ
C1
Mar
ch15
,20
40M
P13
,481
,905
N/A
PAC
4.0
FIX
3139
8WZ
D9
Mar
ch15
,20
40M
Q13
,481
,905
N/A
PAC
4.25
FIX
3139
8WZ
E7
Mar
ch15
,20
40C
ombi
nati
on5
4PL
$107
,078
,761
100%
HJ
$107
,078
,761
N/A
PAC
3.0%
FIX
3139
8WY
K4
Nov
embe
r15
,20
38H
K10
7,07
8,76
1N
/APA
C3.
25FI
X31
398W
YL
2N
ovem
ber
15,
2038
HL
107,
078,
761
N/A
PAC
3.5
FIX
3139
8WY
M0
Nov
embe
r15
,20
38H
M10
7,07
8,76
1N
/APA
C3.
75FI
X31
398W
YN
8N
ovem
ber
15,
2038
HN
107,
078,
761
N/A
PAC
4.0
FIX
3139
8WY
P3
Nov
embe
r15
,20
38H
P10
7,07
8,76
1N
/APA
C4.
25FI
X31
398W
YQ
1N
ovem
ber
15,
2038
IH29
,203
,298
N/A
NT
L(P
AC
)5.
5FI
X/I
O31
398W
YR
9N
ovem
ber
15,
2038
Com
bina
tion
64
BP
$13
,481
,905
11.1
8267
2962
3%A
P$1
20,5
60,6
66N
/APA
C4.
5%FI
X31
398W
XX
7M
arch
15,
2040
PL10
7,07
8,76
188
.817
3270
377
HA
120,
560,
666
N/A
PAC
3.0
FIX
3139
8WY
C2
Mar
ch15
,20
40H
B12
0,56
0,66
6N
/APA
C3.
25FI
X31
398W
YD
0M
arch
15,
2040
HC
120,
560,
666
N/A
PAC
3.5
FIX
3139
8WY
E8
Mar
ch15
,20
40H
D12
0,56
0,66
6N
/APA
C3.
75FI
X31
398W
YF
5M
arch
15,
2040
HE
120,
560,
666
N/A
PAC
4.0
FIX
3139
8WY
G3
Mar
ch15
,20
40H
G12
0,56
0,66
6N
/APA
C4.
25FI
X31
398W
YH
1M
arch
15,
2040
HI
32,8
80,1
81N
/AN
TL
(PA
C)
5.5
FIX
/IO
3139
8WY
J7
Mar
ch15
,20
40C
ombi
nati
on7
5D
A$
53,2
46,3
4010
0%L
A$
53,2
46,3
40N
/ASE
Q2.
0%FI
X31
398W
YT
5A
pril
15,
2023
LB
53,2
46,3
40N
/ASE
Q2.
25FI
X31
398W
YU
2A
pril
15,
2023
LC
53,2
46,3
40N
/ASE
Q2.
5FI
X31
398W
YV
0A
pril
15,
2023
LD
53,2
46,3
40N
/ASE
Q2.
75FI
X31
398W
YW
8A
pril
15,
2023
LE
53,2
46,3
40N
/ASE
Q3.
0FI
X31
398W
YX
6A
pril
15,
2023
LG
53,2
46,3
40N
/ASE
Q3.
25FI
X31
398W
YZ
1A
pril
15,
2023
LH
53,2
46,3
40N
/ASE
Q3.
5FI
X31
398W
Z2
3A
pril
15,
2023
LI
29,5
81,3
00N
/AN
TL
(SE
Q)
4.5
FIX
/IO
3139
8WZ
31
Apr
il15
,20
23L
J53
,246
,340
N/A
SEQ
3.75
FIX
3139
8WZ
49
Apr
il15
,20
23L
K53
,246
,340
N/A
SEQ
4.0
FIX
3139
8WZ
56
Apr
il15
,20
23L
M53
,246
,340
N/A
SEQ
4.25
FIX
3139
8WZ
64
Apr
il15
,20
23
III-7
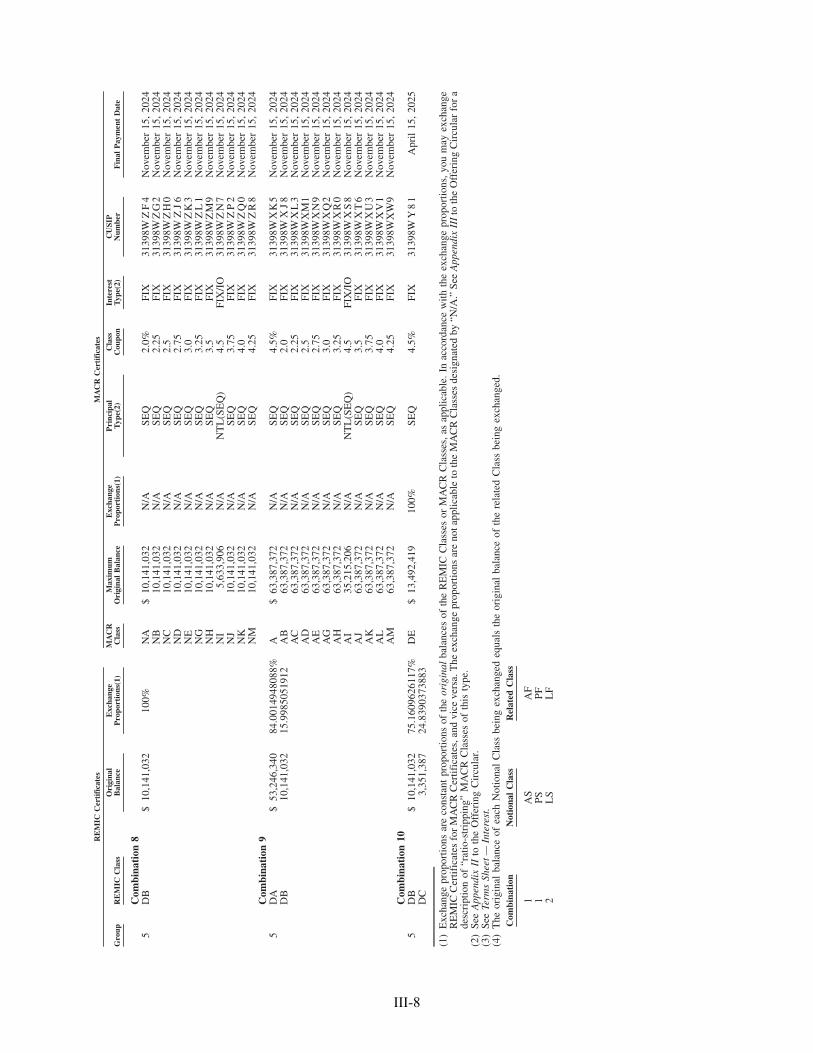
Gro
upR
EM
ICC
lass
Ori
gina
lB
alan
ceE
xcha
nge
Pro
port
ions
(1)
MA
CR
Cla
ssM
axim
umO
rigi
nal
Bal
ance
Exc
hang
eP
ropo
rtio
ns(1
)P
rinc
ipal
Typ
e(2)
Cla
ssC
oupo
nIn
tere
stT
ype(
2)C
USI
PN
umbe
rF
inal
Pay
men
tD
ate
RE
MIC
Cer
tifi
cate
sM
AC
RC
erti
fica
tes
Com
bina
tion
85
DB
$10
,141
,032
100%
NA
$10
,141
,032
N/A
SEQ
2.0%
FIX
3139
8WZ
F4
Nov
embe
r15
,20
24N
B10
,141
,032
N/A
SEQ
2.25
FIX
3139
8WZ
G2
Nov
embe
r15
,20
24N
C10
,141
,032
N/A
SEQ
2.5
FIX
3139
8WZ
H0
Nov
embe
r15
,20
24N
D10
,141
,032
N/A
SEQ
2.75
FIX
3139
8WZ
J6
Nov
embe
r15
,20
24N
E10
,141
,032
N/A
SEQ
3.0
FIX
3139
8WZ
K3
Nov
embe
r15
,20
24N
G10
,141
,032
N/A
SEQ
3.25
FIX
3139
8WZ
L1
Nov
embe
r15
,20
24N
H10
,141
,032
N/A
SEQ
3.5
FIX
3139
8WZ
M9
Nov
embe
r15
,20
24N
I5,
633,
906
N/A
NT
L(S
EQ
)4.
5FI
X/I
O31
398W
ZN
7N
ovem
ber
15,
2024
NJ
10,1
41,0
32N
/ASE
Q3.
75FI
X31
398W
ZP
2N
ovem
ber
15,
2024
NK
10,1
41,0
32N
/ASE
Q4.
0FI
X31
398W
ZQ
0N
ovem
ber
15,
2024
NM
10,1
41,0
32N
/ASE
Q4.
25FI
X31
398W
ZR
8N
ovem
ber
15,
2024
Com
bina
tion
95
DA
$53
,246
,340
84.0
0149
4808
8%A
$63
,387
,372
N/A
SEQ
4.5%
FIX
3139
8WX
K5
Nov
embe
r15
,20
24D
B10
,141
,032
15.9
9850
5191
2A
B63
,387
,372
N/A
SEQ
2.0
FIX
3139
8WX
J8
Nov
embe
r15
,20
24A
C63
,387
,372
N/A
SEQ
2.25
FIX
3139
8WX
L3
Nov
embe
r15
,20
24A
D63
,387
,372
N/A
SEQ
2.5
FIX
3139
8WX
M1
Nov
embe
r15
,20
24A
E63
,387
,372
N/A
SEQ
2.75
FIX
3139
8WX
N9
Nov
embe
r15
,20
24A
G63
,387
,372
N/A
SEQ
3.0
FIX
3139
8WX
Q2
Nov
embe
r15
,20
24A
H63
,387
,372
N/A
SEQ
3.25
FIX
3139
8WX
R0
Nov
embe
r15
,20
24A
I35
,215
,206
N/A
NT
L(S
EQ
)4.
5FI
X/I
O31
398W
XS
8N
ovem
ber
15,
2024
AJ
63,3
87,3
72N
/ASE
Q3.
5FI
X31
398W
XT
6N
ovem
ber
15,
2024
AK
63,3
87,3
72N
/ASE
Q3.
75FI
X31
398W
XU
3N
ovem
ber
15,
2024
AL
63,3
87,3
72N
/ASE
Q4.
0FI
X31
398W
XV
1N
ovem
ber
15,
2024
AM
63,3
87,3
72N
/ASE
Q4.
25FI
X31
398W
XW
9N
ovem
ber
15,
2024
Com
bina
tion
105
DB
$10
,141
,032
75.1
6096
2611
7%D
E$
13,4
92,4
1910
0%SE
Q4.
5%FI
X31
398W
Y8
1A
pril
15,
2025
DC
3,35
1,38
724
.839
0373
883
(1)
Exc
hang
epr
opor
tions
are
cons
tant
prop
ortio
nsof
the
orig
inal
bala
nces
ofth
eR
EM
ICC
lass
esor
MA
CR
Cla
sses
,as
appl
icab
le.
Inac
cord
ance
with
the
exch
ange
prop
ortio
ns,y
oum
ayex
chan
geR
EM
ICC
ertif
icat
esfo
rM
AC
RC
ertif
icat
es,a
ndvi
ceve
rsa.
The
exch
ange
prop
ortio
nsar
eno
tapp
licab
leto
the
MA
CR
Cla
sses
desi
gnat
edby
“N/A
.”Se
eA
ppen
dix
III
toth
eO
ffer
ing
Cir
cula
rfo
ra
desc
ript
ion
of“r
atio
-str
ippi
ng”
MA
CR
Cla
sses
ofth
isty
pe.
(2)
See
App
endi
xII
toth
eO
ffer
ing
Cir
cula
r.(3
)Se
eTe
rms
Shee
t—In
tere
st.
(4)
The
orig
inal
bala
nce
ofea
chN
otio
nal
Cla
ssbe
ing
exch
ange
deq
uals
the
orig
inal
bala
nce
ofth
ere
late
dC
lass
bein
gex
chan
ged.
Com
bina
tion
Not
iona
lC
lass
Rel
ated
Cla
ss
1A
SA
F1
PSPF
2L
SL
F
III-8
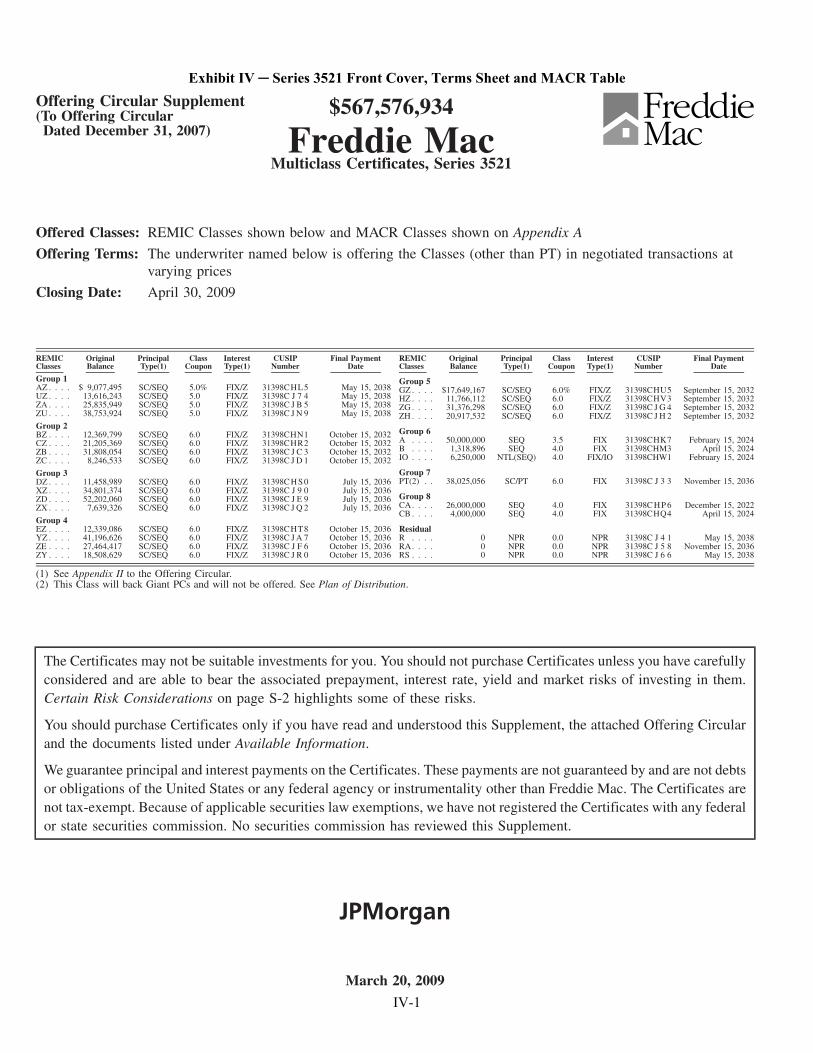
Offering Circular Supplement(To Offering Circular
Dated December 31, 2007)
$567,576,934
Freddie MacMulticlass Certificates, Series 3521
Offered Classes: REMIC Classes shown below and MACR Classes shown on Appendix A
Offering Terms: The underwriter named below is offering the Classes (other than PT) in negotiated transactions atvarying prices
Closing Date: April 30, 2009
REMICClasses
OriginalBalance
PrincipalType(1)
ClassCoupon
InterestType(1)
CUSIPNumber
Final PaymentDate
Group 1AZ . . . . $ 9,077,495 SC/SEQ 5.0% FIX/Z 31398CHL5 May 15, 2038UZ . . . . 13,616,243 SC/SEQ 5.0 FIX/Z 31398C J 7 4 May 15, 2038ZA . . . . 25,835,949 SC/SEQ 5.0 FIX/Z 31398C J B 5 May 15, 2038ZU . . . . 38,753,924 SC/SEQ 5.0 FIX/Z 31398C J N 9 May 15, 2038
Group 2BZ . . . . 12,369,799 SC/SEQ 6.0 FIX/Z 31398CHN1 October 15, 2032CZ . . . . 21,205,369 SC/SEQ 6.0 FIX/Z 31398CHR2 October 15, 2032ZB . . . . 31,808,054 SC/SEQ 6.0 FIX/Z 31398C J C 3 October 15, 2032ZC . . . . 8,246,533 SC/SEQ 6.0 FIX/Z 31398C J D 1 October 15, 2032
Group 3DZ . . . . 11,458,989 SC/SEQ 6.0 FIX/Z 31398C H S0 July 15, 2036XZ . . . . 34,801,374 SC/SEQ 6.0 FIX/Z 31398C J 9 0 July 15, 2036ZD . . . . 52,202,060 SC/SEQ 6.0 FIX/Z 31398C J E 9 July 15, 2036ZX . . . . 7,639,326 SC/SEQ 6.0 FIX/Z 31398C J Q 2 July 15, 2036
Group 4EZ . . . . 12,339,086 SC/SEQ 6.0 FIX/Z 31398CHT8 October 15, 2036YZ . . . . 41,196,626 SC/SEQ 6.0 FIX/Z 31398C J A 7 October 15, 2036ZE . . . . 27,464,417 SC/SEQ 6.0 FIX/Z 31398C J F 6 October 15, 2036ZY . . . . 18,508,629 SC/SEQ 6.0 FIX/Z 31398C J R 0 October 15, 2036
REMICClasses
OriginalBalance
PrincipalType(1)
ClassCoupon
InterestType(1)
CUSIPNumber
Final PaymentDate
Group 5GZ . . . . $17,649,167 SC/SEQ 6.0% FIX/Z 31398CHU5 September 15, 2032HZ . . . . 11,766,112 SC/SEQ 6.0 FIX/Z 31398CHV3 September 15, 2032ZG . . . . 31,376,298 SC/SEQ 6.0 FIX/Z 31398C J G 4 September 15, 2032ZH . . . . 20,917,532 SC/SEQ 6.0 FIX/Z 31398C J H 2 September 15, 2032
Group 6A . . . . 50,000,000 SEQ 3.5 FIX 31398CHK7 February 15, 2024B . . . . 1,318,896 SEQ 4.0 FIX 31398CHM3 April 15, 2024IO . . . . 6,250,000 NTL(SEQ) 4.0 FIX/IO 31398CHW1 February 15, 2024
Group 7PT(2) . . 38,025,056 SC/PT 6.0 FIX 31398C J 3 3 November 15, 2036
Group 8CA. . . . 26,000,000 SEQ 4.0 FIX 31398C HP 6 December 15, 2022CB . . . . 4,000,000 SEQ 4.0 FIX 31398CHQ4 April 15, 2024
ResidualR . . . . 0 NPR 0.0 NPR 31398C J 4 1 May 15, 2038RA. . . . 0 NPR 0.0 NPR 31398C J 5 8 November 15, 2036RS . . . . 0 NPR 0.0 NPR 31398C J 6 6 May 15, 2038
(1) See Appendix II to the Offering Circular.(2) This Class will back Giant PCs and will not be offered. See Plan of Distribution.
The Certificates may not be suitable investments for you. You should not purchase Certificates unless you have carefullyconsidered and are able to bear the associated prepayment, interest rate, yield and market risks of investing in them.Certain Risk Considerations on page S-2 highlights some of these risks.
You should purchase Certificates only if you have read and understood this Supplement, the attached Offering Circularand the documents listed under Available Information.
We guarantee principal and interest payments on the Certificates. These payments are not guaranteed by and are not debtsor obligations of the United States or any federal agency or instrumentality other than Freddie Mac. The Certificates arenot tax-exempt. Because of applicable securities law exemptions, we have not registered the Certificates with any federalor state securities commission. No securities commission has reviewed this Supplement.
JPMorgan
March 20, 2009
IV-1
Exhibit IV ─ Series 3521 Front Cover, Terms Sheet and MACR Table
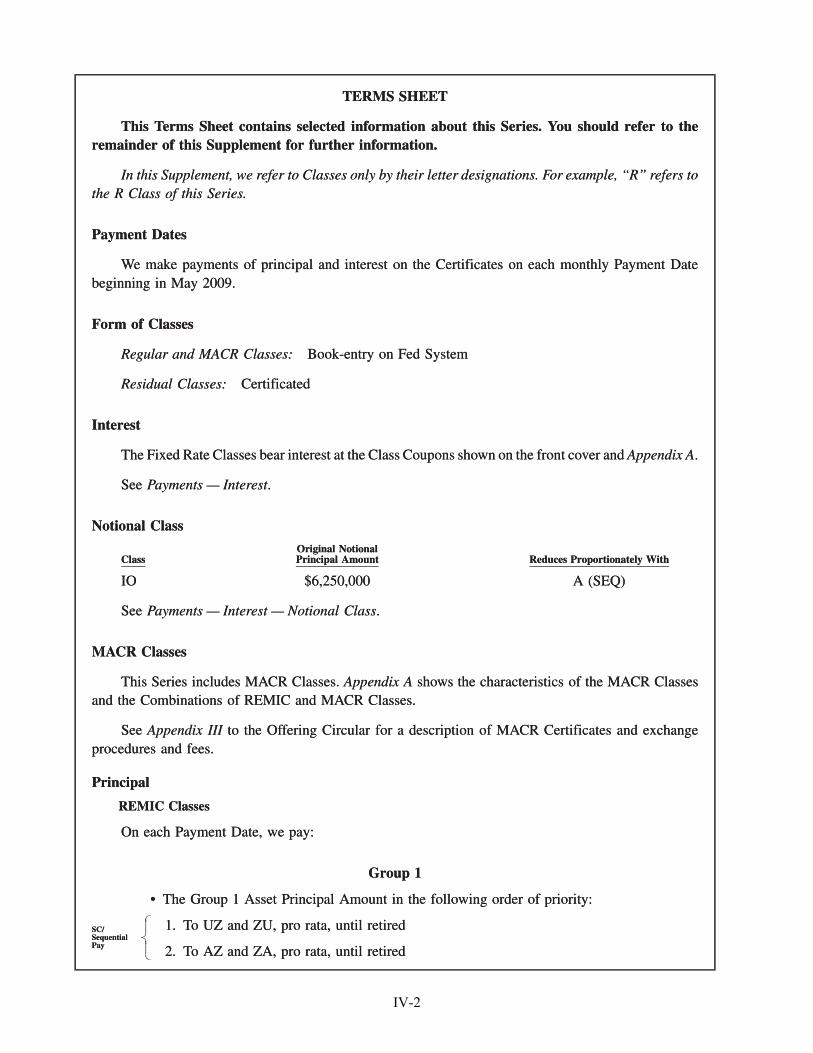
TERMS SHEET
This Terms Sheet contains selected information about this Series. You should refer to theremainder of this Supplement for further information.
In this Supplement, we refer to Classes only by their letter designations. For example, “R” refers tothe R Class of this Series.
Payment Dates
We make payments of principal and interest on the Certificates on each monthly Payment Datebeginning in May 2009.
Form of Classes
Regular and MACR Classes: Book-entry on Fed System
Residual Classes: Certificated
Interest
The Fixed Rate Classes bear interest at the Class Coupons shown on the front cover and Appendix A.
See Payments — Interest.
Notional Class
ClassOriginal NotionalPrincipal Amount Reduces Proportionately With
IO $6,250,000 A (SEQ)
See Payments — Interest — Notional Class.
MACR Classes
This Series includes MACR Classes. Appendix A shows the characteristics of the MACR Classesand the Combinations of REMIC and MACR Classes.
See Appendix III to the Offering Circular for a description of MACR Certificates and exchangeprocedures and fees.
Principal
REMIC Classes
On each Payment Date, we pay:
Group 1
• The Group 1 Asset Principal Amount in the following order of priority:
1. To UZ and ZU, pro rata, until retired
2. To AZ and ZA, pro rata, until retired
SC/SequentialPay
TERMS SHEET
This Terms Sheet contains selected information about this Series. You should refer to theremainder of this Supplement for further information.
In this Supplement, we refer to Classes only by their letter designations. For example, “R” refers tothe R Class of this Series.
Payment Dates
We make payments of principal and interest on the Certificates on each monthly Payment Datebeginning in May 2009.
Form of Classes
Regular and MACR Classes: Book-entry on Fed System
Residual Classes: Certificated
Interest
The Fixed Rate Classes bear interest at the Class Coupons shown on the front cover and Appendix A.
See Payments — Interest.
Notional Class
ClassOriginal NotionalPrincipal Amount Reduces Proportionately With
IO $6,250,000 A (SEQ)
See Payments — Interest — Notional Class.
MACR Classes
This Series includes MACR Classes. Appendix A shows the characteristics of the MACR Classesand the Combinations of REMIC and MACR Classes.
See Appendix III to the Offering Circular for a description of MACR Certificates and exchangeprocedures and fees.
Principal
REMIC Classes
On each Payment Date, we pay:
Group 1
• The Group 1 Asset Principal Amount in the following order of priority:
1. To UZ and ZU, pro rata, until retired
2. To AZ and ZA, pro rata, until retired
���������������
SC/SequentialPay
IV-2
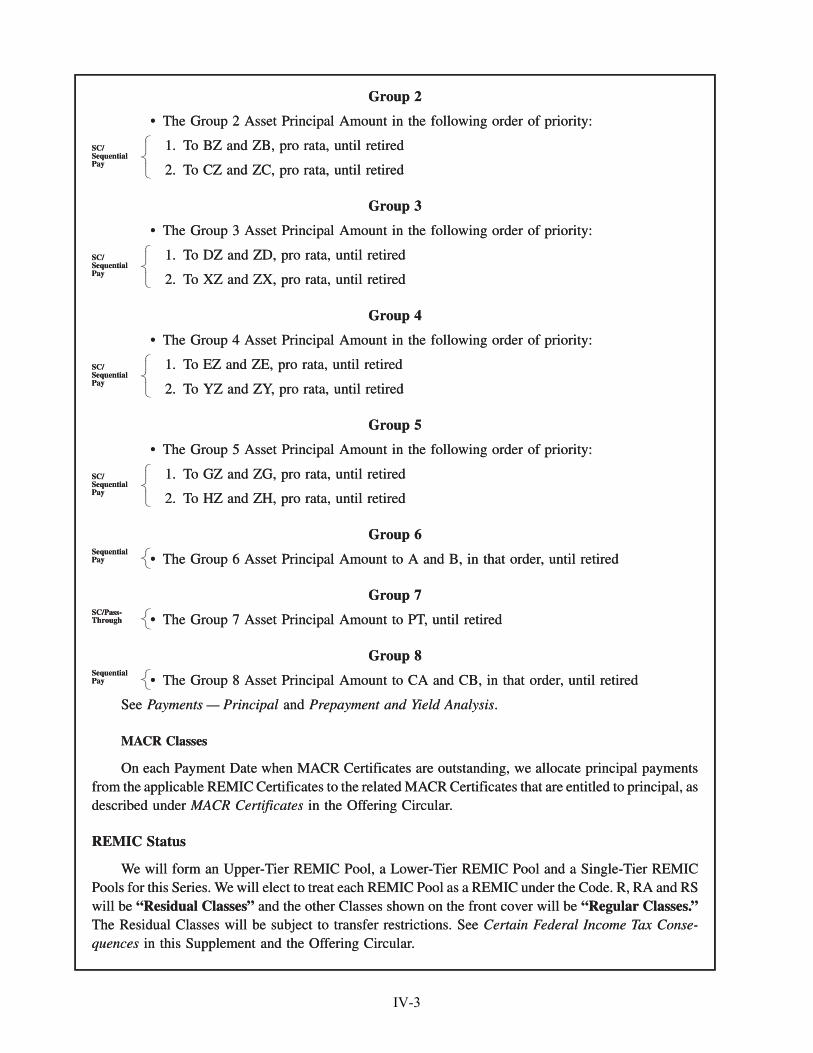
Group 2
• The Group 2 Asset Principal Amount in the following order of priority:
1. To BZ and ZB, pro rata, until retired
2. To CZ and ZC, pro rata, until retired
SC/SequentialPay
Group 3
• The Group 3 Asset Principal Amount in the following order of priority:
1. To DZ and ZD, pro rata, until retired
2. To XZ and ZX, pro rata, until retired
SC/SequentialPay
Group 4
• The Group 4 Asset Principal Amount in the following order of priority:
1. To EZ and ZE, pro rata, until retired
2. To YZ and ZY, pro rata, until retired
SC/SequentialPay
Group 5
• The Group 5 Asset Principal Amount in the following order of priority:
1. To GZ and ZG, pro rata, until retired
2. To HZ and ZH, pro rata, until retired
SC/SequentialPay
Group 6
• The Group 6 Asset Principal Amount to A and B, in that order, until retiredSequentialPay
Group 7
• The Group 7 Asset Principal Amount to PT, until retiredSC/Pass-Through
Group 8
• The Group 8 Asset Principal Amount to CA and CB, in that order, until retiredSequentialPay
See Payments — Principal and Prepayment and Yield Analysis.
MACR Classes
On each Payment Date when MACR Certificates are outstanding, we allocate principal paymentsfrom the applicable REMIC Certificates to the related MACR Certificates that are entitled to principal, asdescribed under MACR Certificates in the Offering Circular.
REMIC Status
We will form an Upper-Tier REMIC Pool, a Lower-Tier REMIC Pool and a Single-Tier REMICPools for this Series. We will elect to treat each REMIC Pool as a REMIC under the Code. R, RA and RSwill be “Residual Classes” and the other Classes shown on the front cover will be “Regular Classes.”The Residual Classes will be subject to transfer restrictions. See Certain Federal Income Tax Conse-quences in this Supplement and the Offering Circular.
Group 2
• The Group 2 Asset Principal Amount in the following order of priority:
1. To BZ and ZB, pro rata, until retired
2. To CZ and ZC, pro rata, until retired
�������������
SC/SequentialPay
Group 3
• The Group 3 Asset Principal Amount in the following order of priority:
1. To DZ and ZD, pro rata, until retired
2. To XZ and ZX, pro rata, until retired
�������������
SC/SequentialPay
Group 4
• The Group 4 Asset Principal Amount in the following order of priority:
1. To EZ and ZE, pro rata, until retired
2. To YZ and ZY, pro rata, until retired
�������������
SC/SequentialPay
Group 5
• The Group 5 Asset Principal Amount in the following order of priority:
1. To GZ and ZG, pro rata, until retired
2. To HZ and ZH, pro rata, until retired
�������������
SC/SequentialPay
Group 6
• The Group 6 Asset Principal Amount to A and B, in that order, until retired�����
SequentialPay
Group 7
• The Group 7 Asset Principal Amount to PT, until retired�����
SC/Pass-Through
Group 8
• The Group 8 Asset Principal Amount to CA and CB, in that order, until retired�����
SequentialPay
See Payments — Principal and Prepayment and Yield Analysis.
MACR Classes
On each Payment Date when MACR Certificates are outstanding, we allocate principal paymentsfrom the applicable REMIC Certificates to the related MACR Certificates that are entitled to principal, asdescribed under MACR Certificates in the Offering Circular.
REMIC Status
We will form an Upper-Tier REMIC Pool, a Lower-Tier REMIC Pool and a Single-Tier REMICPools for this Series. We will elect to treat each REMIC Pool as a REMIC under the Code. R, RA and RSwill be “Residual Classes” and the other Classes shown on the front cover will be “Regular Classes.”The Residual Classes will be subject to transfer restrictions. See Certain Federal Income Tax Conse-quences in this Supplement and the Offering Circular.
IV-3
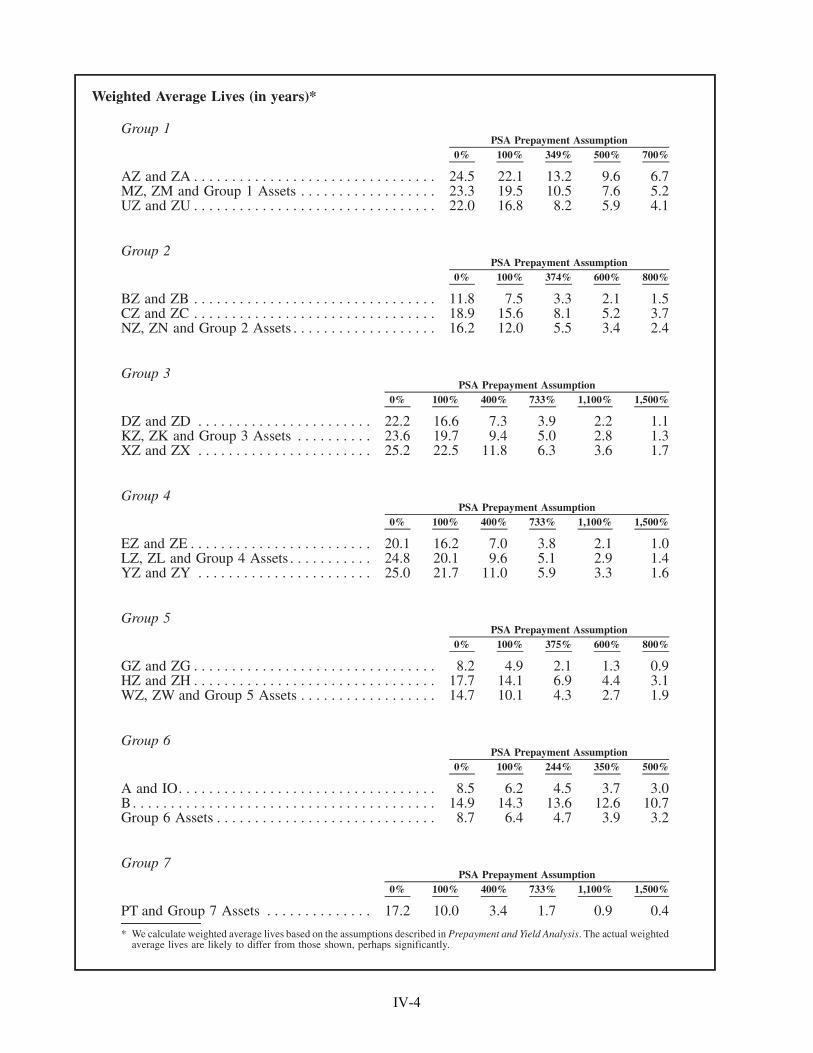
Weighted Average Lives (in years)*
Group 1
0% 100% 349% 500% 700%PSA Prepayment Assumption
AZ and ZA . . . . . . . . . . . . . . . . . . . . . . . . . . . . . . . . 24.5 22.1 13.2 9.6 6.7MZ, ZM and Group 1 Assets . . . . . . . . . . . . . . . . . . 23.3 19.5 10.5 7.6 5.2UZ and ZU . . . . . . . . . . . . . . . . . . . . . . . . . . . . . . . . 22.0 16.8 8.2 5.9 4.1
Group 2
0% 100% 374% 600% 800%PSA Prepayment Assumption
BZ and ZB . . . . . . . . . . . . . . . . . . . . . . . . . . . . . . . . 11.8 7.5 3.3 2.1 1.5CZ and ZC . . . . . . . . . . . . . . . . . . . . . . . . . . . . . . . . 18.9 15.6 8.1 5.2 3.7NZ, ZN and Group 2 Assets . . . . . . . . . . . . . . . . . . . 16.2 12.0 5.5 3.4 2.4
Group 3
0% 100% 400% 733% 1,100% 1,500%PSA Prepayment Assumption
DZ and ZD . . . . . . . . . . . . . . . . . . . . . . . 22.2 16.6 7.3 3.9 2.2 1.1KZ, ZK and Group 3 Assets . . . . . . . . . . 23.6 19.7 9.4 5.0 2.8 1.3XZ and ZX . . . . . . . . . . . . . . . . . . . . . . . 25.2 22.5 11.8 6.3 3.6 1.7
Group 4
0% 100% 400% 733% 1,100% 1,500%PSA Prepayment Assumption
EZ and ZE . . . . . . . . . . . . . . . . . . . . . . . . 20.1 16.2 7.0 3.8 2.1 1.0LZ, ZL and Group 4 Assets . . . . . . . . . . . 24.8 20.1 9.6 5.1 2.9 1.4YZ and ZY . . . . . . . . . . . . . . . . . . . . . . . 25.0 21.7 11.0 5.9 3.3 1.6
Group 5
0% 100% 375% 600% 800%PSA Prepayment Assumption
GZ and ZG . . . . . . . . . . . . . . . . . . . . . . . . . . . . . . . . 8.2 4.9 2.1 1.3 0.9HZ and ZH . . . . . . . . . . . . . . . . . . . . . . . . . . . . . . . . 17.7 14.1 6.9 4.4 3.1WZ, ZW and Group 5 Assets . . . . . . . . . . . . . . . . . . 14.7 10.1 4.3 2.7 1.9
Group 6
0% 100% 244% 350% 500%PSA Prepayment Assumption
A and IO. . . . . . . . . . . . . . . . . . . . . . . . . . . . . . . . . . 8.5 6.2 4.5 3.7 3.0B . . . . . . . . . . . . . . . . . . . . . . . . . . . . . . . . . . . . . . . . 14.9 14.3 13.6 12.6 10.7Group 6 Assets . . . . . . . . . . . . . . . . . . . . . . . . . . . . . 8.7 6.4 4.7 3.9 3.2
Group 7
0% 100% 400% 733% 1,100% 1,500%PSA Prepayment Assumption
PT and Group 7 Assets . . . . . . . . . . . . . . 17.2 10.0 3.4 1.7 0.9 0.4
* We calculate weighted average lives based on the assumptions described in Prepayment and Yield Analysis. The actual weightedaverage lives are likely to differ from those shown, perhaps significantly.
IV-4
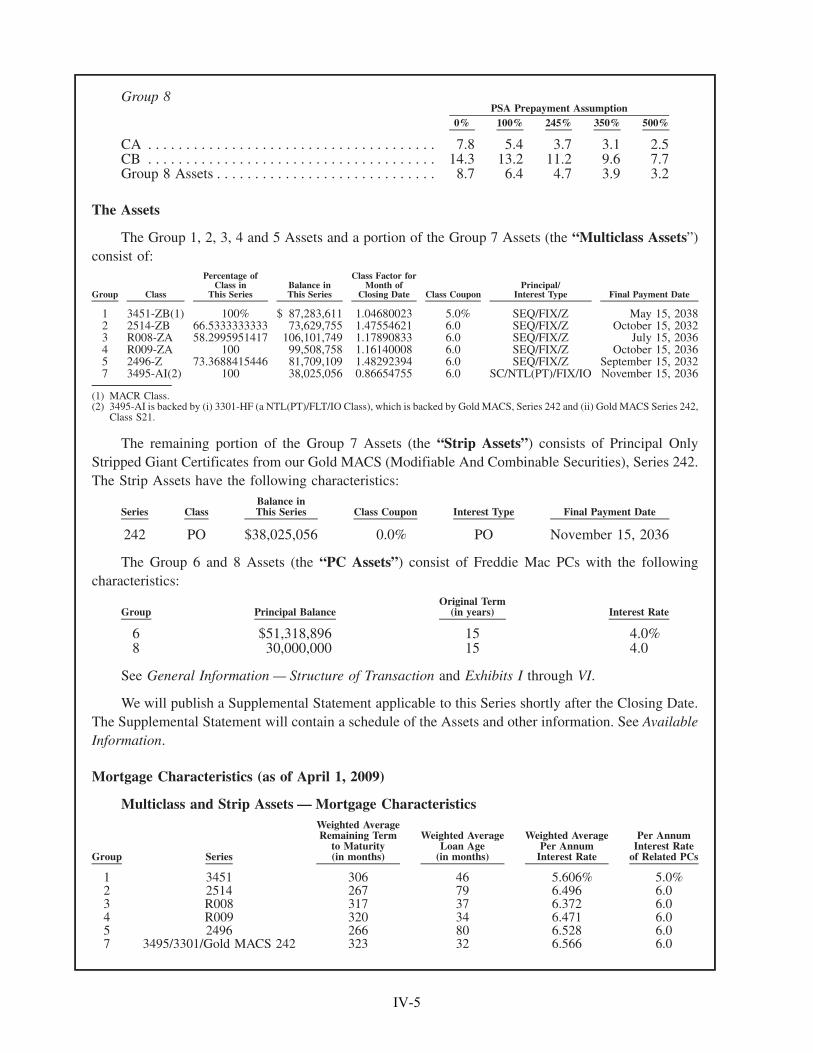
Group 8
0% 100% 245% 350% 500%PSA Prepayment Assumption
CA . . . . . . . . . . . . . . . . . . . . . . . . . . . . . . . . . . . . . . 7.8 5.4 3.7 3.1 2.5CB . . . . . . . . . . . . . . . . . . . . . . . . . . . . . . . . . . . . . . 14.3 13.2 11.2 9.6 7.7Group 8 Assets . . . . . . . . . . . . . . . . . . . . . . . . . . . . . 8.7 6.4 4.7 3.9 3.2
The Assets
The Group 1, 2, 3, 4 and 5 Assets and a portion of the Group 7 Assets (the “Multiclass Assets”)consist of:
Group Class
Percentage ofClass in
This SeriesBalance inThis Series
Class Factor forMonth of
Closing Date Class CouponPrincipal/
Interest Type Final Payment Date
1 3451-ZB(1) 100% $ 87,283,611 1.04680023 5.0% SEQ/FIX/Z May 15, 20382 2514-ZB 66.5333333333 73,629,755 1.47554621 6.0 SEQ/FIX/Z October 15, 20323 R008-ZA 58.2995951417 106,101,749 1.17890833 6.0 SEQ/FIX/Z July 15, 20364 R009-ZA 100 99,508,758 1.16140008 6.0 SEQ/FIX/Z October 15, 20365 2496-Z 73.3688415446 81,709,109 1.48292394 6.0 SEQ/FIX/Z September 15, 20327 3495-AI(2) 100 38,025,056 0.86654755 6.0 SC/NTL(PT)/FIX/IO November 15, 2036
(1) MACR Class.(2) 3495-AI is backed by (i) 3301-HF (a NTL(PT)/FLT/IO Class), which is backed by Gold MACS, Series 242 and (ii) Gold MACS Series 242,
Class S21.
The remaining portion of the Group 7 Assets (the “Strip Assets”) consists of Principal OnlyStripped Giant Certificates from our Gold MACS (Modifiable And Combinable Securities), Series 242.The Strip Assets have the following characteristics:
Series ClassBalance inThis Series Class Coupon Interest Type Final Payment Date
242 PO $38,025,056 0.0% PO November 15, 2036
The Group 6 and 8 Assets (the “PC Assets”) consist of Freddie Mac PCs with the followingcharacteristics:
Group Principal BalanceOriginal Term
(in years) Interest Rate
6 $51,318,896 15 4.0%8 30,000,000 15 4.0
See General Information — Structure of Transaction and Exhibits I through VI.
We will publish a Supplemental Statement applicable to this Series shortly after the Closing Date.The Supplemental Statement will contain a schedule of the Assets and other information. See AvailableInformation.
Mortgage Characteristics (as of April 1, 2009)
Multiclass and Strip Assets — Mortgage Characteristics
Group Series
Weighted AverageRemaining Term
to Maturity(in months)
Weighted AverageLoan Age
(in months)
Weighted AveragePer Annum
Interest Rate
Per AnnumInterest Rate
of Related PCs
1 3451 306 46 5.606% 5.0%2 2514 267 79 6.496 6.03 R008 317 37 6.372 6.04 R009 320 34 6.471 6.05 2496 266 80 6.528 6.07 3495/3301/Gold MACS 242 323 32 6.566 6.0
IV-5
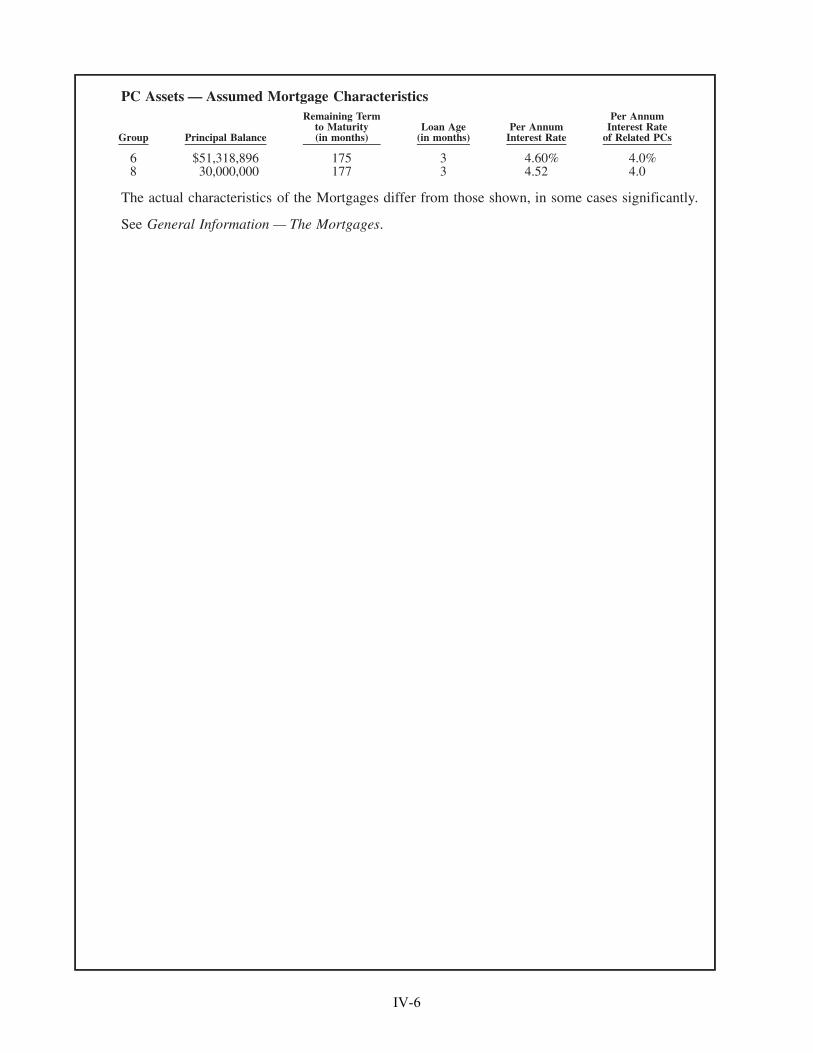
PC Assets — Assumed Mortgage Characteristics
Group Principal Balance
Remaining Termto Maturity(in months)
Loan Age(in months)
Per AnnumInterest Rate
Per AnnumInterest Rate
of Related PCs
6 $51,318,896 175 3 4.60% 4.0%8 30,000,000 177 3 4.52 4.0
The actual characteristics of the Mortgages differ from those shown, in some cases significantly.
See General Information — The Mortgages.
IV-6
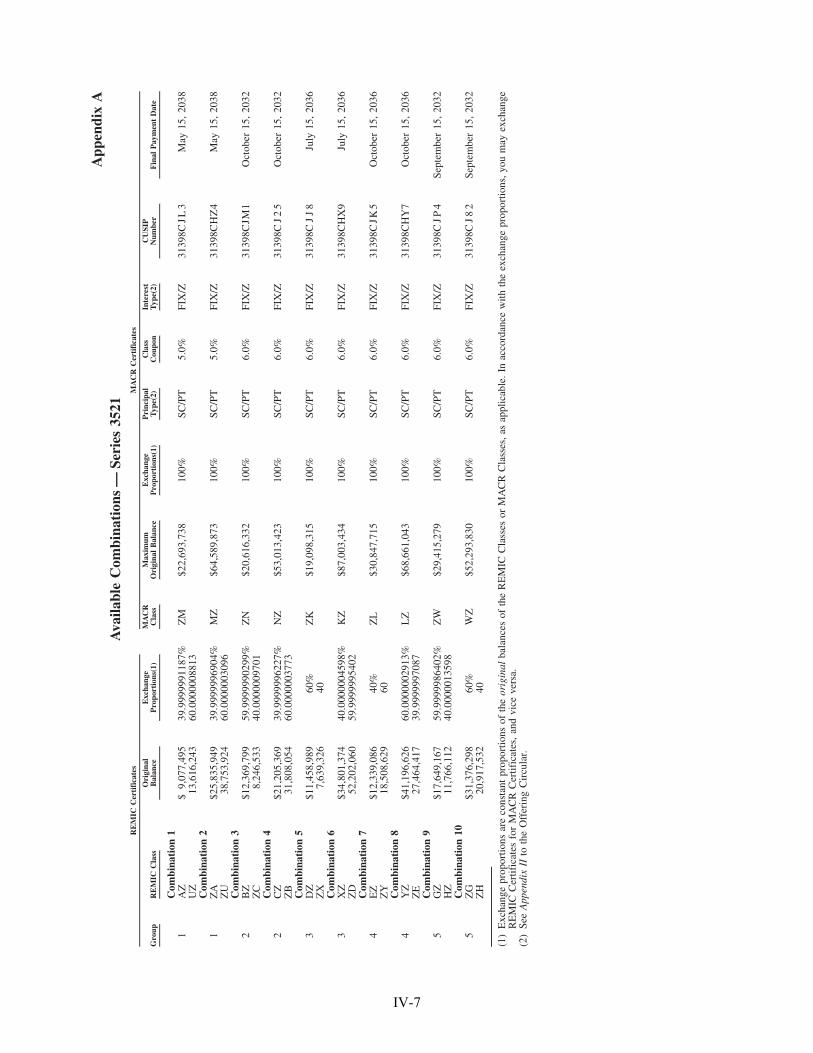
App
endi
xA
Ava
ilabl
eC
ombi
nati
ons
—Se
ries
3521
Gro
upR
EM
ICC
lass
Ori
gina
lB
alan
ceE
xcha
nge
Pro
port
ions
(1)
MA
CR
Cla
ssM
axim
umO
rigi
nal
Bal
ance
Exc
hang
eP
ropo
rtio
ns(1
)P
rinc
ipal
Typ
e(2)
Cla
ssC
oupo
nIn
tere
stT
ype(
2)C
USI
PN
umbe
rF
inal
Pay
men
tD
ate
RE
MIC
Cer
tifi
cate
sM
AC
RC
erti
fica
tes
Com
bina
tion
11
AZ
$9,
077,
495
39.9
9999
9118
7%Z
M$2
2,69
3,73
810
0%SC
/PT
5.0%
FIX
/Z31
398C
JL3
May
15,
2038
UZ
13,6
16,2
4360
.000
0008
813
Com
bina
tion
21
ZA
$25,
835,
949
39.9
9999
9690
4%M
Z$6
4,58
9,87
310
0%SC
/PT
5.0%
FIX
/Z31
398C
HZ
4M
ay15
,20
38Z
U38
,753
,924
60.0
0000
0309
6C
ombi
nati
on3
2B
Z$1
2,36
9,79
959
.999
9990
299%
ZN
$20,
616,
332
100%
SC/P
T6.
0%FI
X/Z
3139
8CJM
1O
ctob
er15
,20
32Z
C8,
246,
533
40.0
0000
0970
1C
ombi
nati
on4
2C
Z$2
1,20
5,36
939
.999
9996
227%
NZ
$53,
013,
423
100%
SC/P
T6.
0%FI
X/Z
3139
8CJ
25
Oct
ober
15,
2032
ZB
31,8
08,0
5460
.000
0003
773
Com
bina
tion
53
DZ
$11,
458,
989
60%
ZK
$19,
098,
315
100%
SC/P
T6.
0%FI
X/Z
3139
8CJ
J8
July
15,
2036
ZX
7,63
9,32
640
Com
bina
tion
63
XZ
$34,
801,
374
40.0
0000
0459
8%K
Z$8
7,00
3,43
410
0%SC
/PT
6.0%
FIX
/Z31
398C
HX
9Ju
ly15
,20
36Z
D52
,202
,060
59.9
9999
9540
2C
ombi
nati
on7
4E
Z$1
2,33
9,08
640
%Z
L$3
0,84
7,71
510
0%SC
/PT
6.0%
FIX
/Z31
398C
JK5
Oct
ober
15,
2036
ZY
18,5
08,6
2960
Com
bina
tion
84
YZ
$41,
196,
626
60.0
0000
0291
3%L
Z$6
8,66
1,04
310
0%SC
/PT
6.0%
FIX
/Z31
398C
HY
7O
ctob
er15
,20
36Z
E27
,464
,417
39.9
9999
9708
7C
ombi
nati
on9
5G
Z$1
7,64
9,16
759
.999
9986
402%
ZW
$29,
415,
279
100%
SC/P
T6.
0%FI
X/Z
3139
8CJP
4Se
ptem
ber
15,
2032
HZ
11,7
66,1
1240
.000
0013
598
Com
bina
tion
105
ZG
$31,
376,
298
60%
WZ
$52,
293,
830
100%
SC/P
T6.
0%FI
X/Z
3139
8CJ
82
Sept
embe
r15
,20
32Z
H20
,917
,532
40
(1)
Exc
hang
epr
opor
tions
are
cons
tant
prop
ortio
nsof
the
orig
inal
bala
nces
ofth
eR
EM
ICC
lass
esor
MA
CR
Cla
sses
,as
appl
icab
le.
Inac
cord
ance
with
the
exch
ange
prop
ortio
ns,y
oum
ayex
chan
geR
EM
ICC
ertif
icat
esfo
rM
AC
RC
ertif
icat
es,
and
vice
vers
a.(2
)Se
eA
ppen
dix
IIto
the
Off
erin
gC
ircu
lar.
IV-7
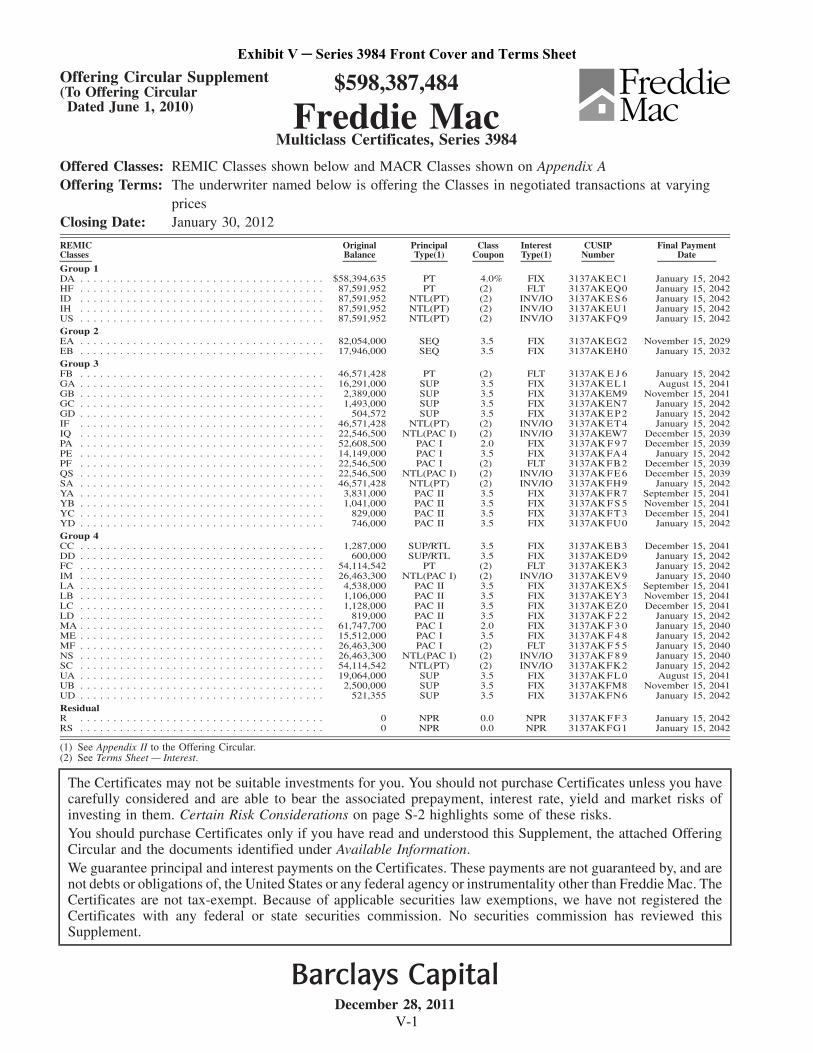
Offering Circular Supplement(To Offering Circular
Dated June 1, 2010)
$598,387,484
Freddie MacMulticlass Certificates, Series 3984
Offered Classes: REMIC Classes shown below and MACR Classes shown on Appendix AOffering Terms: The underwriter named below is offering the Classes in negotiated transactions at varying
pricesClosing Date: January 30, 2012
REMICClasses
OriginalBalance
PrincipalType(1)
ClassCoupon
InterestType(1)
CUSIPNumber
Final PaymentDate
Group 1DA . . . . . . . . . . . . . . . . . . . . . . . . . . . . . . . . . . . . . $58,394,635 PT 4.0% FIX 3137AKEC1 January 15, 2042HF . . . . . . . . . . . . . . . . . . . . . . . . . . . . . . . . . . . . . 87,591,952 PT (2) FLT 3137AKEQ0 January 15, 2042ID . . . . . . . . . . . . . . . . . . . . . . . . . . . . . . . . . . . . . 87,591,952 NTL(PT) (2) INV/IO 3137AK E S 6 January 15, 2042IH . . . . . . . . . . . . . . . . . . . . . . . . . . . . . . . . . . . . . 87,591,952 NTL(PT) (2) INV/IO 3137AKEU1 January 15, 2042US . . . . . . . . . . . . . . . . . . . . . . . . . . . . . . . . . . . . . 87,591,952 NTL(PT) (2) INV/IO 3137AKFQ9 January 15, 2042Group 2EA . . . . . . . . . . . . . . . . . . . . . . . . . . . . . . . . . . . . . 82,054,000 SEQ 3.5 FIX 3137AKEG2 November 15, 2029EB . . . . . . . . . . . . . . . . . . . . . . . . . . . . . . . . . . . . . 17,946,000 SEQ 3.5 FIX 3137AKEH0 January 15, 2032Group 3FB . . . . . . . . . . . . . . . . . . . . . . . . . . . . . . . . . . . . . 46,571,428 PT (2) FLT 3137AK E J 6 January 15, 2042GA . . . . . . . . . . . . . . . . . . . . . . . . . . . . . . . . . . . . . 16,291,000 SUP 3.5 FIX 3137AKEL1 August 15, 2041GB . . . . . . . . . . . . . . . . . . . . . . . . . . . . . . . . . . . . . 2,389,000 SUP 3.5 FIX 3137AKEM9 November 15, 2041GC . . . . . . . . . . . . . . . . . . . . . . . . . . . . . . . . . . . . . 1,493,000 SUP 3.5 FIX 3137AKEN7 January 15, 2042GD . . . . . . . . . . . . . . . . . . . . . . . . . . . . . . . . . . . . . 504,572 SUP 3.5 FIX 3137AK E P 2 January 15, 2042IF . . . . . . . . . . . . . . . . . . . . . . . . . . . . . . . . . . . . . 46,571,428 NTL(PT) (2) INV/IO 3137AKET4 January 15, 2042IQ . . . . . . . . . . . . . . . . . . . . . . . . . . . . . . . . . . . . . 22,546,500 NTL(PAC I) (2) INV/IO 3137AKEW7 December 15, 2039PA . . . . . . . . . . . . . . . . . . . . . . . . . . . . . . . . . . . . . 52,608,500 PAC I 2.0 FIX 3137AK F 9 7 December 15, 2039PE . . . . . . . . . . . . . . . . . . . . . . . . . . . . . . . . . . . . . 14,149,000 PAC I 3.5 FIX 3137AKFA4 January 15, 2042PF . . . . . . . . . . . . . . . . . . . . . . . . . . . . . . . . . . . . . 22,546,500 PAC I (2) FLT 3137AKFB2 December 15, 2039QS . . . . . . . . . . . . . . . . . . . . . . . . . . . . . . . . . . . . . 22,546,500 NTL(PAC I) (2) INV/IO 3137AK FE 6 December 15, 2039SA . . . . . . . . . . . . . . . . . . . . . . . . . . . . . . . . . . . . . 46,571,428 NTL(PT) (2) INV/IO 3137AKFH9 January 15, 2042YA . . . . . . . . . . . . . . . . . . . . . . . . . . . . . . . . . . . . . 3,831,000 PAC II 3.5 FIX 3137AKFR7 September 15, 2041YB . . . . . . . . . . . . . . . . . . . . . . . . . . . . . . . . . . . . . 1,041,000 PAC II 3.5 FIX 3137AK F S 5 November 15, 2041YC . . . . . . . . . . . . . . . . . . . . . . . . . . . . . . . . . . . . . 829,000 PAC II 3.5 FIX 3137AK FT 3 December 15, 2041YD . . . . . . . . . . . . . . . . . . . . . . . . . . . . . . . . . . . . . 746,000 PAC II 3.5 FIX 3137AKFU0 January 15, 2042Group 4CC . . . . . . . . . . . . . . . . . . . . . . . . . . . . . . . . . . . . . 1,287,000 SUP/RTL 3.5 FIX 3137AKEB3 December 15, 2041DD . . . . . . . . . . . . . . . . . . . . . . . . . . . . . . . . . . . . . 600,000 SUP/RTL 3.5 FIX 3137AKED9 January 15, 2042FC . . . . . . . . . . . . . . . . . . . . . . . . . . . . . . . . . . . . . 54,114,542 PT (2) FLT 3137AKEK3 January 15, 2042IM . . . . . . . . . . . . . . . . . . . . . . . . . . . . . . . . . . . . . 26,463,300 NTL(PAC I) (2) INV/IO 3137AKEV9 January 15, 2040LA . . . . . . . . . . . . . . . . . . . . . . . . . . . . . . . . . . . . . 4,538,000 PAC II 3.5 FIX 3137AKEX5 September 15, 2041LB . . . . . . . . . . . . . . . . . . . . . . . . . . . . . . . . . . . . . 1,106,000 PAC II 3.5 FIX 3137AKEY3 November 15, 2041LC . . . . . . . . . . . . . . . . . . . . . . . . . . . . . . . . . . . . . 1,128,000 PAC II 3.5 FIX 3137AKEZ0 December 15, 2041LD . . . . . . . . . . . . . . . . . . . . . . . . . . . . . . . . . . . . . 819,000 PAC II 3.5 FIX 3137AK F 2 2 January 15, 2042MA . . . . . . . . . . . . . . . . . . . . . . . . . . . . . . . . . . . . . 61,747,700 PAC I 2.0 FIX 3137AK F 3 0 January 15, 2040ME . . . . . . . . . . . . . . . . . . . . . . . . . . . . . . . . . . . . . 15,512,000 PAC I 3.5 FIX 3137AK F 4 8 January 15, 2042MF . . . . . . . . . . . . . . . . . . . . . . . . . . . . . . . . . . . . . 26,463,300 PAC I (2) FLT 3137AK F 5 5 January 15, 2040NS . . . . . . . . . . . . . . . . . . . . . . . . . . . . . . . . . . . . . 26,463,300 NTL(PAC I) (2) INV/IO 3137AK F 8 9 January 15, 2040SC . . . . . . . . . . . . . . . . . . . . . . . . . . . . . . . . . . . . . 54,114,542 NTL(PT) (2) INV/IO 3137AKFK2 January 15, 2042UA . . . . . . . . . . . . . . . . . . . . . . . . . . . . . . . . . . . . . 19,064,000 SUP 3.5 FIX 3137AK FL 0 August 15, 2041UB . . . . . . . . . . . . . . . . . . . . . . . . . . . . . . . . . . . . . 2,500,000 SUP 3.5 FIX 3137AKFM8 November 15, 2041UD . . . . . . . . . . . . . . . . . . . . . . . . . . . . . . . . . . . . . 521,355 SUP 3.5 FIX 3137AKFN6 January 15, 2042ResidualR . . . . . . . . . . . . . . . . . . . . . . . . . . . . . . . . . . . . . 0 NPR 0.0 NPR 3137AK F F 3 January 15, 2042RS . . . . . . . . . . . . . . . . . . . . . . . . . . . . . . . . . . . . . 0 NPR 0.0 NPR 3137AKFG1 January 15, 2042
(1) See Appendix II to the Offering Circular.(2) See Terms Sheet — Interest.
The Certificates may not be suitable investments for you. You should not purchase Certificates unless you havecarefully considered and are able to bear the associated prepayment, interest rate, yield and market risks ofinvesting in them. Certain Risk Considerations on page S-2 highlights some of these risks.You should purchase Certificates only if you have read and understood this Supplement, the attached OfferingCircular and the documents identified under Available Information.We guarantee principal and interest payments on the Certificates. These payments are not guaranteed by, and arenot debts or obligations of, the United States or any federal agency or instrumentality other than Freddie Mac. TheCertificates are not tax-exempt. Because of applicable securities law exemptions, we have not registered theCertificates with any federal or state securities commission. No securities commission has reviewed thisSupplement.
Barclays CapitalDecember 28, 2011
V-1
Exhibit V ─ Series 3984 Front Cover and Terms Sheet
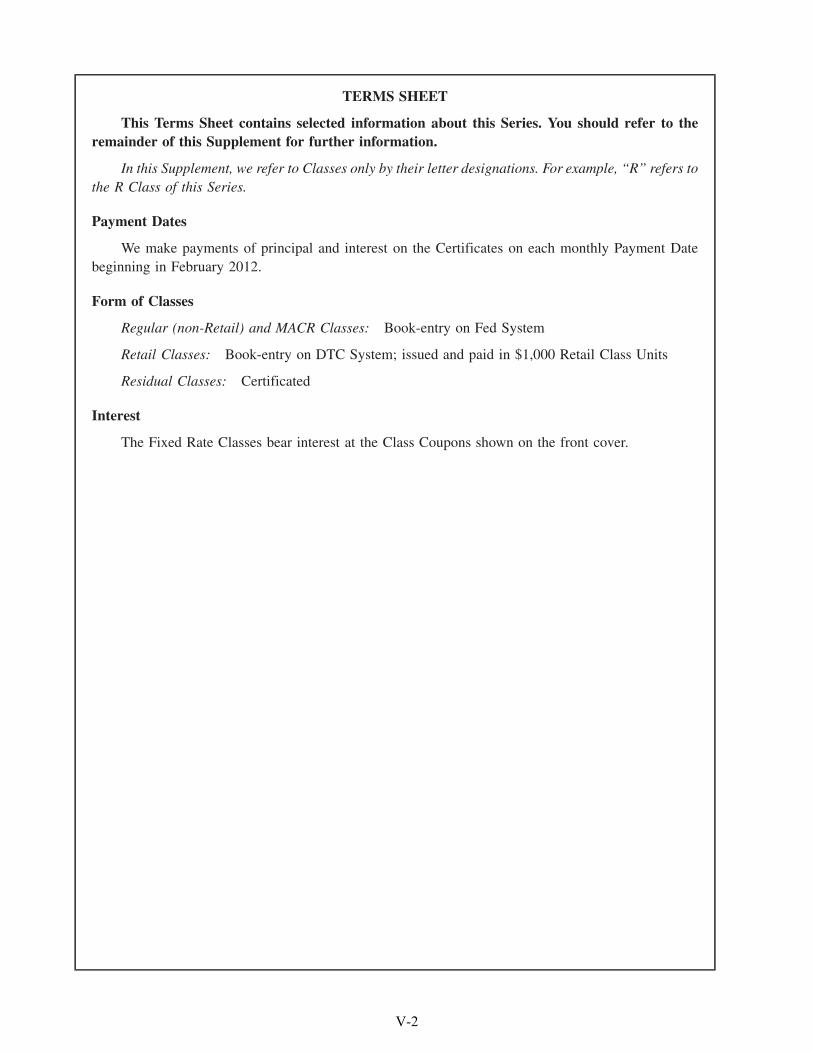
TERMS SHEET
This Terms Sheet contains selected information about this Series. You should refer to theremainder of this Supplement for further information.
In this Supplement, we refer to Classes only by their letter designations. For example, “R” refers tothe R Class of this Series.
Payment Dates
We make payments of principal and interest on the Certificates on each monthly Payment Datebeginning in February 2012.
Form of Classes
Regular (non-Retail) and MACR Classes: Book-entry on Fed System
Retail Classes: Book-entry on DTC System; issued and paid in $1,000 Retail Class Units
Residual Classes: Certificated
Interest
The Fixed Rate Classes bear interest at the Class Coupons shown on the front cover.
V-2
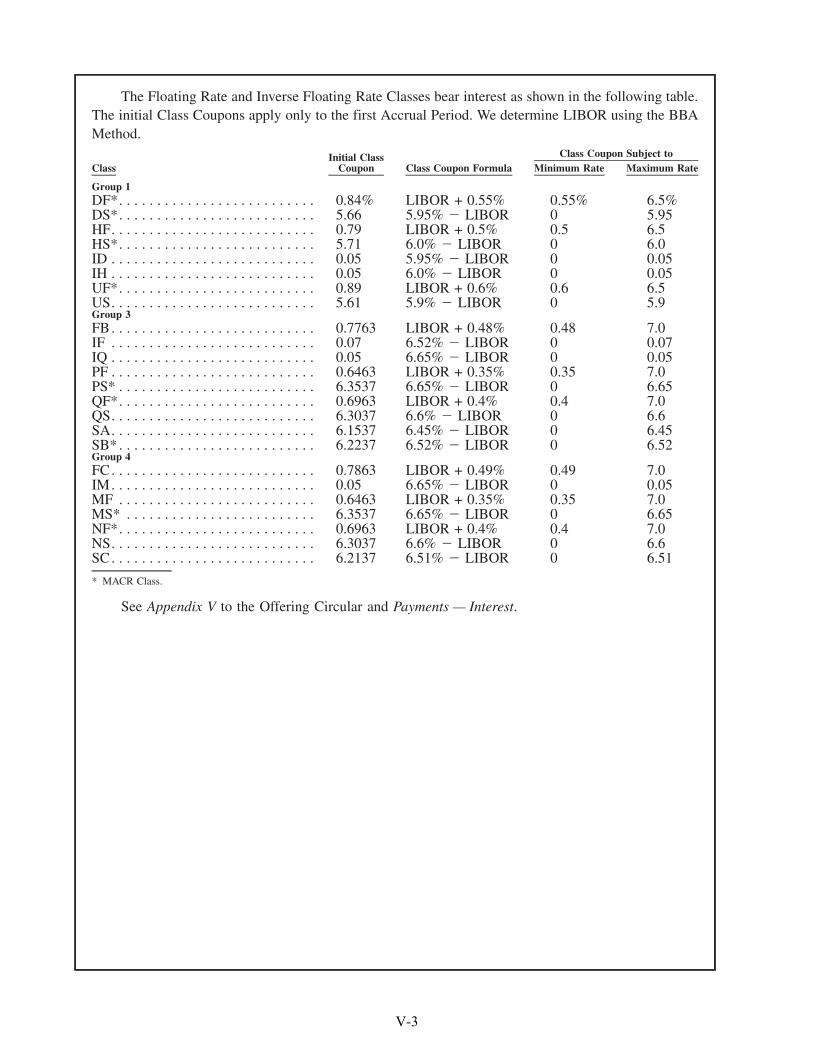
The Floating Rate and Inverse Floating Rate Classes bear interest as shown in the following table.The initial Class Coupons apply only to the first Accrual Period. We determine LIBOR using the BBAMethod.
ClassInitial Class
Coupon Class Coupon Formula Minimum Rate Maximum RateClass Coupon Subject to
Group 1DF*. . . . . . . . . . . . . . . . . . . . . . . . . . 0.84% LIBOR + 0.55% 0.55% 6.5%DS*. . . . . . . . . . . . . . . . . . . . . . . . . . 5.66 5.95% � LIBOR 0 5.95HF. . . . . . . . . . . . . . . . . . . . . . . . . . . 0.79 LIBOR + 0.5% 0.5 6.5HS*. . . . . . . . . . . . . . . . . . . . . . . . . . 5.71 6.0% � LIBOR 0 6.0ID . . . . . . . . . . . . . . . . . . . . . . . . . . . 0.05 5.95% � LIBOR 0 0.05IH . . . . . . . . . . . . . . . . . . . . . . . . . . . 0.05 6.0% � LIBOR 0 0.05UF*. . . . . . . . . . . . . . . . . . . . . . . . . . 0.89 LIBOR + 0.6% 0.6 6.5US. . . . . . . . . . . . . . . . . . . . . . . . . . . 5.61 5.9% � LIBOR 0 5.9Group 3FB. . . . . . . . . . . . . . . . . . . . . . . . . . . 0.7763 LIBOR + 0.48% 0.48 7.0IF . . . . . . . . . . . . . . . . . . . . . . . . . . . 0.07 6.52% � LIBOR 0 0.07IQ . . . . . . . . . . . . . . . . . . . . . . . . . . . 0.05 6.65% � LIBOR 0 0.05PF . . . . . . . . . . . . . . . . . . . . . . . . . . . 0.6463 LIBOR + 0.35% 0.35 7.0PS* . . . . . . . . . . . . . . . . . . . . . . . . . . 6.3537 6.65% � LIBOR 0 6.65QF*. . . . . . . . . . . . . . . . . . . . . . . . . . 0.6963 LIBOR + 0.4% 0.4 7.0QS. . . . . . . . . . . . . . . . . . . . . . . . . . . 6.3037 6.6% � LIBOR 0 6.6SA. . . . . . . . . . . . . . . . . . . . . . . . . . . 6.1537 6.45% � LIBOR 0 6.45SB* . . . . . . . . . . . . . . . . . . . . . . . . . . 6.2237 6.52% � LIBOR 0 6.52Group 4FC. . . . . . . . . . . . . . . . . . . . . . . . . . . 0.7863 LIBOR + 0.49% 0.49 7.0IM. . . . . . . . . . . . . . . . . . . . . . . . . . . 0.05 6.65% � LIBOR 0 0.05MF . . . . . . . . . . . . . . . . . . . . . . . . . . 0.6463 LIBOR + 0.35% 0.35 7.0MS* . . . . . . . . . . . . . . . . . . . . . . . . . 6.3537 6.65% � LIBOR 0 6.65NF*. . . . . . . . . . . . . . . . . . . . . . . . . . 0.6963 LIBOR + 0.4% 0.4 7.0NS. . . . . . . . . . . . . . . . . . . . . . . . . . . 6.3037 6.6% � LIBOR 0 6.6SC. . . . . . . . . . . . . . . . . . . . . . . . . . . 6.2137 6.51% � LIBOR 0 6.51
* MACR Class.
See Appendix V to the Offering Circular and Payments — Interest.
V-3
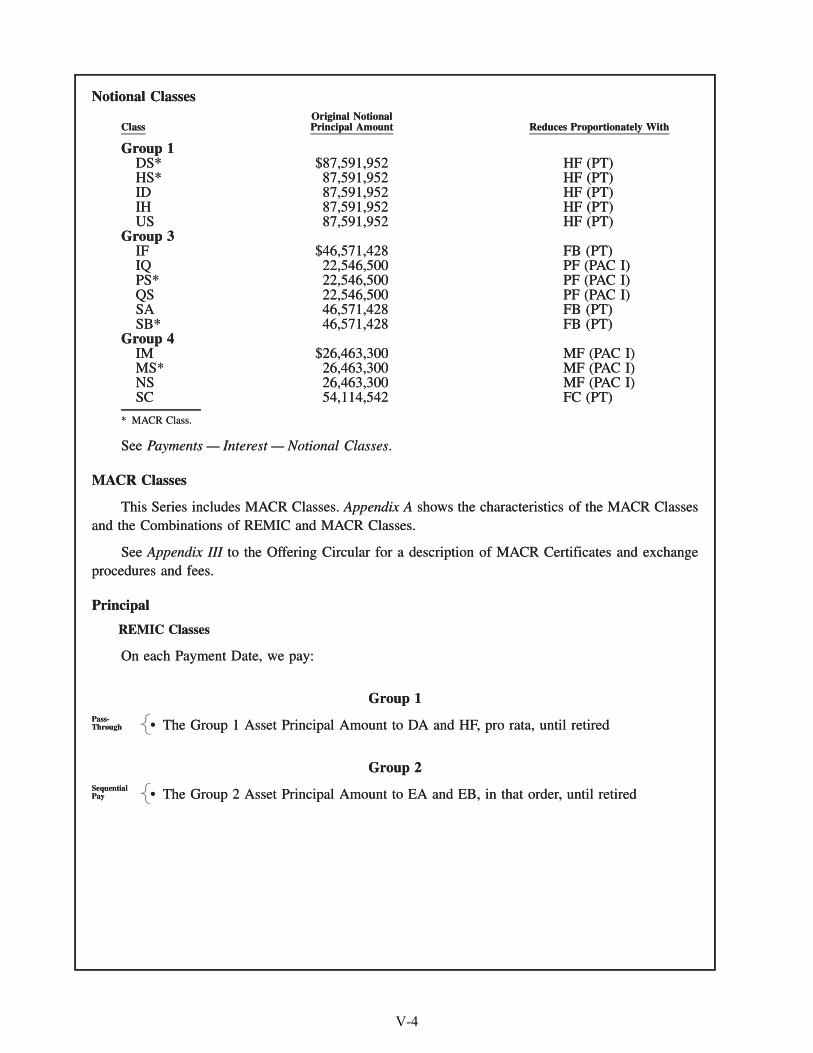
Notional Classes
ClassOriginal NotionalPrincipal Amount Reduces Proportionately With
Group 1DS* $87,591,952 HF (PT)HS* 87,591,952 HF (PT)ID 87,591,952 HF (PT)IH 87,591,952 HF (PT)US 87,591,952 HF (PT)
Group 3IF $46,571,428 FB (PT)IQ 22,546,500 PF (PAC I)PS* 22,546,500 PF (PAC I)QS 22,546,500 PF (PAC I)SA 46,571,428 FB (PT)SB* 46,571,428 FB (PT)
Group 4IM $26,463,300 MF (PAC I)MS* 26,463,300 MF (PAC I)NS 26,463,300 MF (PAC I)SC 54,114,542 FC (PT)
* MACR Class.
See Payments — Interest — Notional Classes.
MACR Classes
This Series includes MACR Classes. Appendix A shows the characteristics of the MACR Classesand the Combinations of REMIC and MACR Classes.
See Appendix III to the Offering Circular for a description of MACR Certificates and exchangeprocedures and fees.
Principal
REMIC Classes
On each Payment Date, we pay:
Group 1
• The Group 1 Asset Principal Amount to DA and HF, pro rata, until retiredPass-Through
Group 2
• The Group 2 Asset Principal Amount to EA and EB, in that order, until retiredSequentialPay
Notional Classes
ClassOriginal NotionalPrincipal Amount Reduces Proportionately With
Group 1DS* $87,591,952 HF (PT)HS* 87,591,952 HF (PT)ID 87,591,952 HF (PT)IH 87,591,952 HF (PT)US 87,591,952 HF (PT)
Group 3IF $46,571,428 FB (PT)IQ 22,546,500 PF (PAC I)PS* 22,546,500 PF (PAC I)QS 22,546,500 PF (PAC I)SA 46,571,428 FB (PT)SB* 46,571,428 FB (PT)
Group 4IM $26,463,300 MF (PAC I)MS* 26,463,300 MF (PAC I)NS 26,463,300 MF (PAC I)SC 54,114,542 FC (PT)
* MACR Class.
See Payments — Interest — Notional Classes.
MACR Classes
This Series includes MACR Classes. Appendix A shows the characteristics of the MACR Classesand the Combinations of REMIC and MACR Classes.
See Appendix III to the Offering Circular for a description of MACR Certificates and exchangeprocedures and fees.
Principal
REMIC Classes
On each Payment Date, we pay:
Group 1
• The Group 1 Asset Principal Amount to DA and HF, pro rata, until retired�����
Pass-Through
Group 2
• The Group 2 Asset Principal Amount to EA and EB, in that order, until retired�����
SequentialPay
V-4
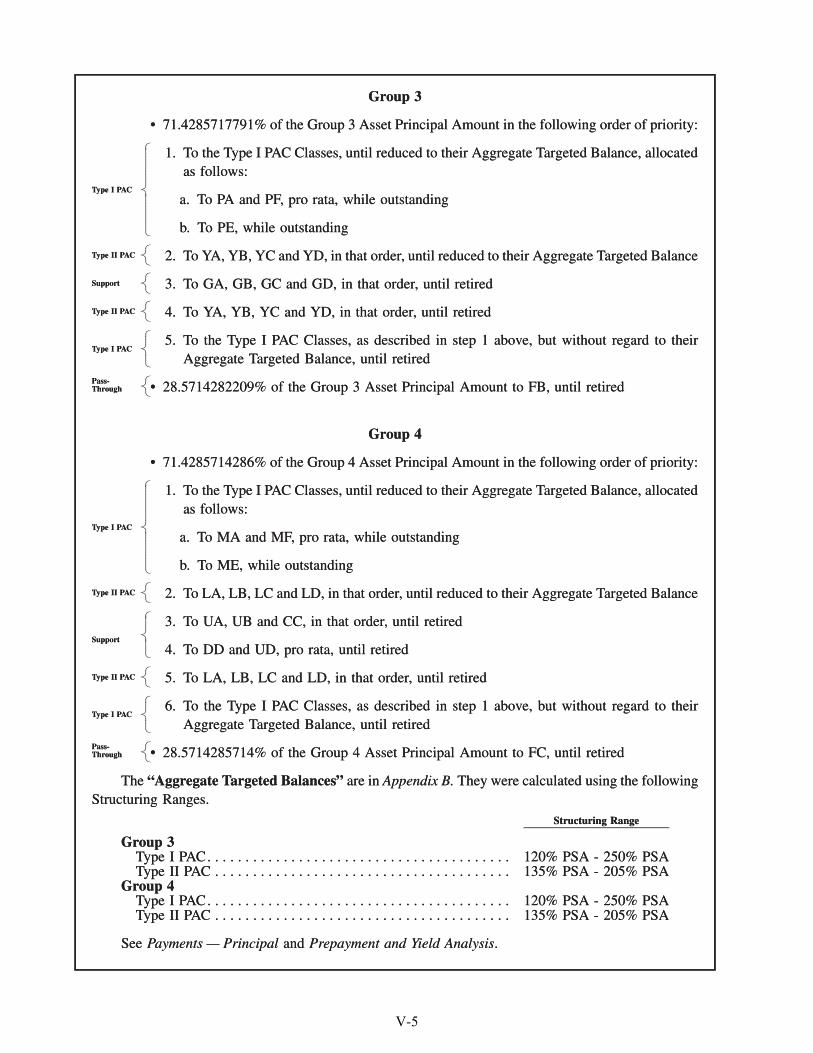
Group 3
• 71.4285717791% of the Group 3 Asset Principal Amount in the following order of priority:
1. To the Type I PAC Classes, until reduced to their Aggregate Targeted Balance, allocatedas follows:
a. To PA and PF, pro rata, while outstanding
b. To PE, while outstanding
Type I PAC
2. To YA, YB, YC and YD, in that order, until reduced to their Aggregate Targeted BalanceType II PAC
3. To GA, GB, GC and GD, in that order, until retiredSupport
4. To YA, YB, YC and YD, in that order, until retiredType II PAC
5. To the Type I PAC Classes, as described in step 1 above, but without regard to theirAggregate Targeted Balance, until retired
Type I PAC
• 28.5714282209% of the Group 3 Asset Principal Amount to FB, until retiredPass-Through
Group 4
• 71.4285714286% of the Group 4 Asset Principal Amount in the following order of priority:
1. To the Type I PAC Classes, until reduced to their Aggregate Targeted Balance, allocatedas follows:
a. To MA and MF, pro rata, while outstanding
b. To ME, while outstanding
Type I PAC
2. To LA, LB, LC and LD, in that order, until reduced to their Aggregate Targeted BalanceType II PAC
3. To UA, UB and CC, in that order, until retired
4. To DD and UD, pro rata, until retiredSupport
5. To LA, LB, LC and LD, in that order, until retiredType II PAC
6. To the Type I PAC Classes, as described in step 1 above, but without regard to theirAggregate Targeted Balance, until retired
Type I PAC
• 28.5714285714% of the Group 4 Asset Principal Amount to FC, until retiredPass-Through
The “Aggregate Targeted Balances” are in Appendix B. They were calculated using the followingStructuring Ranges.
Structuring Range
Group 3Type I PAC. . . . . . . . . . . . . . . . . . . . . . . . . . . . . . . . . . . . . . . . 120% PSA - 250% PSAType II PAC . . . . . . . . . . . . . . . . . . . . . . . . . . . . . . . . . . . . . . . 135% PSA - 205% PSA
Group 4Type I PAC. . . . . . . . . . . . . . . . . . . . . . . . . . . . . . . . . . . . . . . . 120% PSA - 250% PSAType II PAC . . . . . . . . . . . . . . . . . . . . . . . . . . . . . . . . . . . . . . . 135% PSA - 205% PSA
See Payments — Principal and Prepayment and Yield Analysis.
Group 3
• 71.4285717791% of the Group 3 Asset Principal Amount in the following order of priority:
1. To the Type I PAC Classes, until reduced to their Aggregate Targeted Balance, allocatedas follows:
a. To PA and PF, pro rata, while outstanding
b. To PE, while outstanding
�������������������������������
Type I PAC
2. To YA, YB, YC and YD, in that order, until reduced to their Aggregate Targeted Balance�����Type II PAC
3. To GA, GB, GC and GD, in that order, until retired�����Support
4. To YA, YB, YC and YD, in that order, until retired�����Type II PAC
5. To the Type I PAC Classes, as described in step 1 above, but without regard to theirAggregate Targeted Balance, until retired
�����������
Type I PAC
• 28.5714282209% of the Group 3 Asset Principal Amount to FB, until retired�����
Pass-Through
Group 4
• 71.4285714286% of the Group 4 Asset Principal Amount in the following order of priority:
1. To the Type I PAC Classes, until reduced to their Aggregate Targeted Balance, allocatedas follows:
a. To MA and MF, pro rata, while outstanding
b. To ME, while outstanding
�������������������������������
Type I PAC
2. To LA, LB, LC and LD, in that order, until reduced to their Aggregate Targeted Balance�����Type II PAC
3. To UA, UB and CC, in that order, until retired
4. To DD and UD, pro rata, until retired
���������������
Support
5. To LA, LB, LC and LD, in that order, until retired�����Type II PAC
6. To the Type I PAC Classes, as described in step 1 above, but without regard to theirAggregate Targeted Balance, until retired
�����������
Type I PAC
• 28.5714285714% of the Group 4 Asset Principal Amount to FC, until retired�����
Pass-Through
The “Aggregate Targeted Balances” are in Appendix B. They were calculated using the followingStructuring Ranges.
Structuring Range
Group 3Type I PAC. . . . . . . . . . . . . . . . . . . . . . . . . . . . . . . . . . . . . . . . 120% PSA - 250% PSAType II PAC . . . . . . . . . . . . . . . . . . . . . . . . . . . . . . . . . . . . . . . 135% PSA - 205% PSA
Group 4Type I PAC. . . . . . . . . . . . . . . . . . . . . . . . . . . . . . . . . . . . . . . . 120% PSA - 250% PSAType II PAC . . . . . . . . . . . . . . . . . . . . . . . . . . . . . . . . . . . . . . . 135% PSA - 205% PSA
See Payments — Principal and Prepayment and Yield Analysis.
V-5
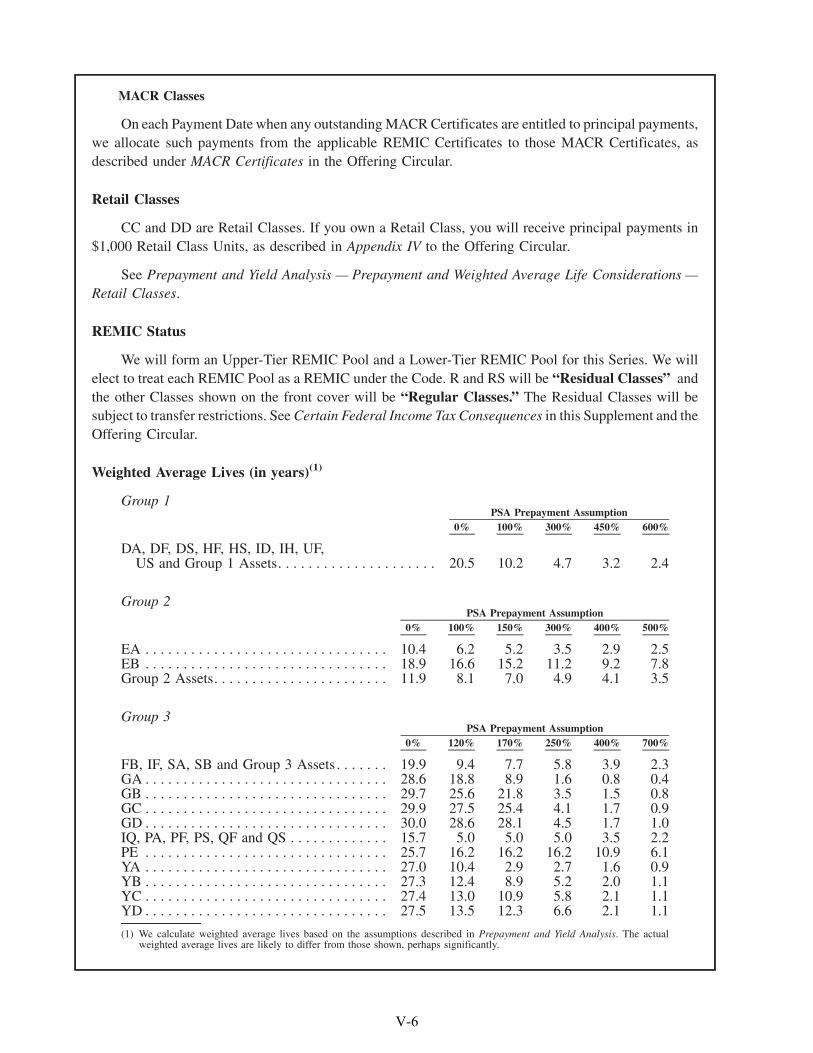
MACR Classes
On each Payment Date when any outstanding MACR Certificates are entitled to principal payments,we allocate such payments from the applicable REMIC Certificates to those MACR Certificates, asdescribed under MACR Certificates in the Offering Circular.
Retail Classes
CC and DD are Retail Classes. If you own a Retail Class, you will receive principal payments in$1,000 Retail Class Units, as described in Appendix IV to the Offering Circular.
See Prepayment and Yield Analysis — Prepayment and Weighted Average Life Considerations —Retail Classes.
REMIC Status
We will form an Upper-Tier REMIC Pool and a Lower-Tier REMIC Pool for this Series. We willelect to treat each REMIC Pool as a REMIC under the Code. R and RS will be “Residual Classes” andthe other Classes shown on the front cover will be “Regular Classes.” The Residual Classes will besubject to transfer restrictions. See Certain Federal Income Tax Consequences in this Supplement and theOffering Circular.
Weighted Average Lives (in years)(1)
Group 1
0% 100% 300% 450% 600%PSA Prepayment Assumption
DA, DF, DS, HF, HS, ID, IH, UF,US and Group 1 Assets. . . . . . . . . . . . . . . . . . . . . 20.5 10.2 4.7 3.2 2.4
Group 2
0% 100% 150% 300% 400% 500%PSA Prepayment Assumption
EA . . . . . . . . . . . . . . . . . . . . . . . . . . . . . . . . 10.4 6.2 5.2 3.5 2.9 2.5EB . . . . . . . . . . . . . . . . . . . . . . . . . . . . . . . . 18.9 16.6 15.2 11.2 9.2 7.8Group 2 Assets. . . . . . . . . . . . . . . . . . . . . . . 11.9 8.1 7.0 4.9 4.1 3.5
Group 3
0% 120% 170% 250% 400% 700%PSA Prepayment Assumption
FB, IF, SA, SB and Group 3 Assets . . . . . . . 19.9 9.4 7.7 5.8 3.9 2.3GA . . . . . . . . . . . . . . . . . . . . . . . . . . . . . . . . 28.6 18.8 8.9 1.6 0.8 0.4GB . . . . . . . . . . . . . . . . . . . . . . . . . . . . . . . . 29.7 25.6 21.8 3.5 1.5 0.8GC . . . . . . . . . . . . . . . . . . . . . . . . . . . . . . . . 29.9 27.5 25.4 4.1 1.7 0.9GD . . . . . . . . . . . . . . . . . . . . . . . . . . . . . . . . 30.0 28.6 28.1 4.5 1.7 1.0IQ, PA, PF, PS, QF and QS . . . . . . . . . . . . . 15.7 5.0 5.0 5.0 3.5 2.2PE . . . . . . . . . . . . . . . . . . . . . . . . . . . . . . . . 25.7 16.2 16.2 16.2 10.9 6.1YA . . . . . . . . . . . . . . . . . . . . . . . . . . . . . . . . 27.0 10.4 2.9 2.7 1.6 0.9YB . . . . . . . . . . . . . . . . . . . . . . . . . . . . . . . . 27.3 12.4 8.9 5.2 2.0 1.1YC . . . . . . . . . . . . . . . . . . . . . . . . . . . . . . . . 27.4 13.0 10.9 5.8 2.1 1.1YD . . . . . . . . . . . . . . . . . . . . . . . . . . . . . . . . 27.5 13.5 12.3 6.6 2.1 1.1
(1) We calculate weighted average lives based on the assumptions described in Prepayment and Yield Analysis. The actualweighted average lives are likely to differ from those shown, perhaps significantly.
V-6
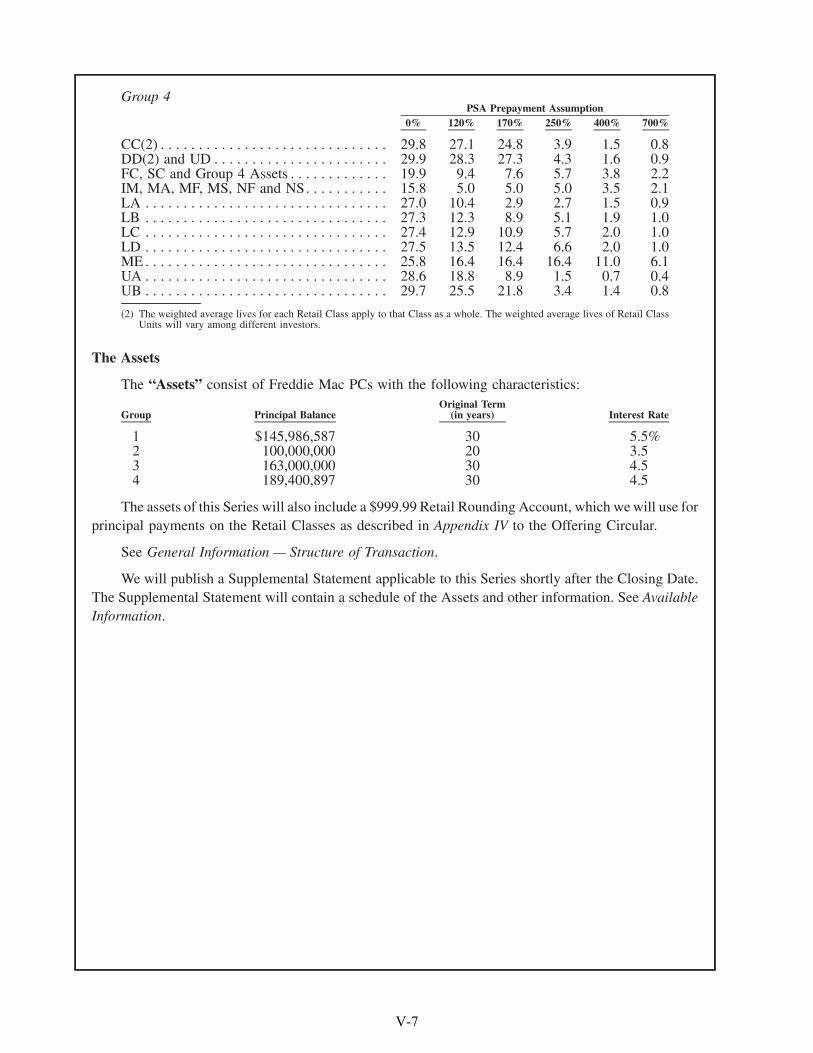
Group 4
0% 120% 170% 250% 400% 700%PSA Prepayment Assumption
CC(2) . . . . . . . . . . . . . . . . . . . . . . . . . . . . . . 29.8 27.1 24.8 3.9 1.5 0.8DD(2) and UD . . . . . . . . . . . . . . . . . . . . . . . 29.9 28.3 27.3 4.3 1.6 0.9FC, SC and Group 4 Assets . . . . . . . . . . . . . 19.9 9.4 7.6 5.7 3.8 2.2IM, MA, MF, MS, NF and NS. . . . . . . . . . . 15.8 5.0 5.0 5.0 3.5 2.1LA . . . . . . . . . . . . . . . . . . . . . . . . . . . . . . . . 27.0 10.4 2.9 2.7 1.5 0.9LB . . . . . . . . . . . . . . . . . . . . . . . . . . . . . . . . 27.3 12.3 8.9 5.1 1.9 1.0LC . . . . . . . . . . . . . . . . . . . . . . . . . . . . . . . . 27.4 12.9 10.9 5.7 2.0 1.0LD . . . . . . . . . . . . . . . . . . . . . . . . . . . . . . . . 27.5 13.5 12.4 6.6 2.0 1.0ME . . . . . . . . . . . . . . . . . . . . . . . . . . . . . . . . 25.8 16.4 16.4 16.4 11.0 6.1UA . . . . . . . . . . . . . . . . . . . . . . . . . . . . . . . . 28.6 18.8 8.9 1.5 0.7 0.4UB . . . . . . . . . . . . . . . . . . . . . . . . . . . . . . . . 29.7 25.5 21.8 3.4 1.4 0.8
(2) The weighted average lives for each Retail Class apply to that Class as a whole. The weighted average lives of Retail ClassUnits will vary among different investors.
The Assets
The “Assets” consist of Freddie Mac PCs with the following characteristics:
Group Principal BalanceOriginal Term
(in years) Interest Rate
1 $145,986,587 30 5.5%2 100,000,000 20 3.53 163,000,000 30 4.54 189,400,897 30 4.5
The assets of this Series will also include a $999.99 Retail Rounding Account, which we will use forprincipal payments on the Retail Classes as described in Appendix IV to the Offering Circular.
See General Information — Structure of Transaction.
We will publish a Supplemental Statement applicable to this Series shortly after the Closing Date.The Supplemental Statement will contain a schedule of the Assets and other information. See AvailableInformation.
V-7
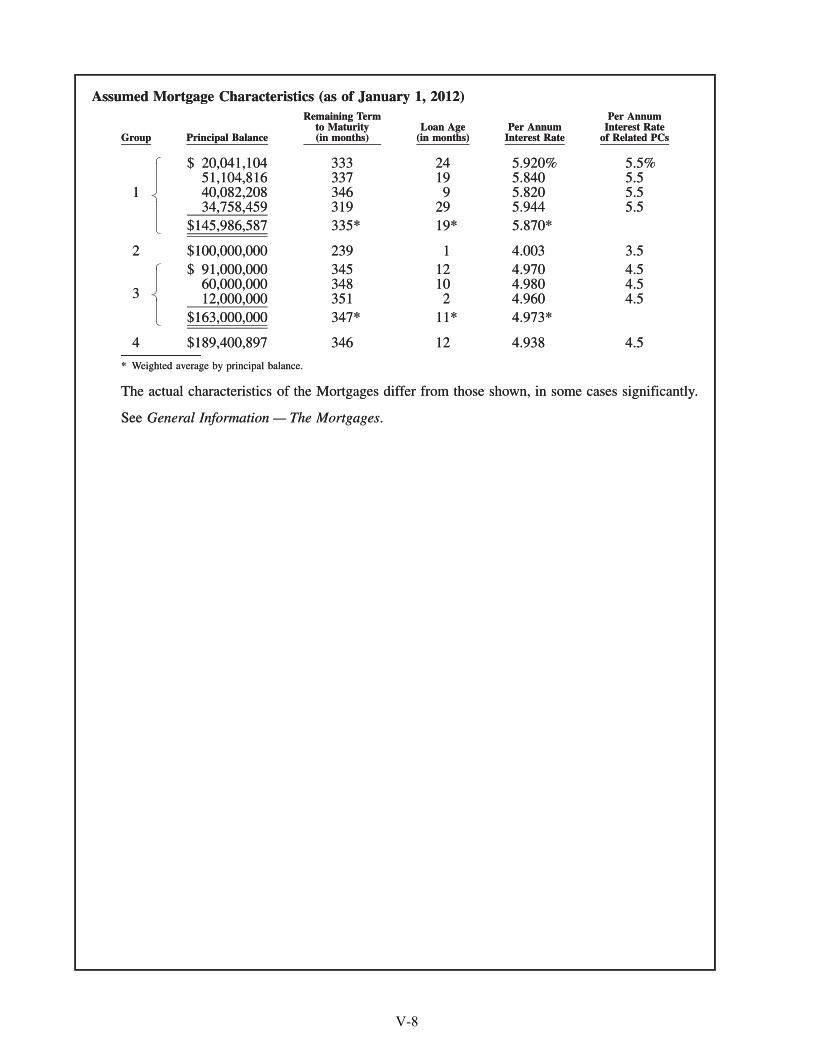
Assumed Mortgage Characteristics (as of January 1, 2012)
Group Principal Balance
Remaining Termto Maturity(in months)
Loan Age(in months)
Per AnnumInterest Rate
Per AnnumInterest Rate
of Related PCs
1
$ 20,041,104 333 24 5.920% 5.5%51,104,816 337 19 5.840 5.540,082,208 346 9 5.820 5.534,758,459 319 29 5.944 5.5
$145,986,587 335* 19* 5.870*
2 $100,000,000 239 1 4.003 3.5
3
$ 91,000,000 345 12 4.970 4.560,000,000 348 10 4.980 4.512,000,000 351 2 4.960 4.5
$163,000,000 347* 11* 4.973*
4 $189,400,897 346 12 4.938 4.5
* Weighted average by principal balance.
The actual characteristics of the Mortgages differ from those shown, in some cases significantly.
See General Information — The Mortgages.
Assumed Mortgage Characteristics (as of January 1, 2012)
Group Principal Balance
Remaining Termto Maturity(in months)
Loan Age(in months)
Per AnnumInterest Rate
Per AnnumInterest Rate
of Related PCs
1
$ 20,041,104 333 24 5.920% 5.5%51,104,816 337 19 5.840 5.540,082,208 346 9 5.820 5.534,758,459 319 29 5.944 5.5
$145,986,587 335* 19* 5.870*
�������������������������
2 $100,000,000 239 1 4.003 3.5
3
$ 91,000,000 345 12 4.970 4.560,000,000 348 10 4.980 4.512,000,000 351 2 4.960 4.5
$163,000,000 347* 11* 4.973*
���������������������
4 $189,400,897 346 12 4.938 4.5
* Weighted average by principal balance.
The actual characteristics of the Mortgages differ from those shown, in some cases significantly.
See General Information — The Mortgages.
V-8
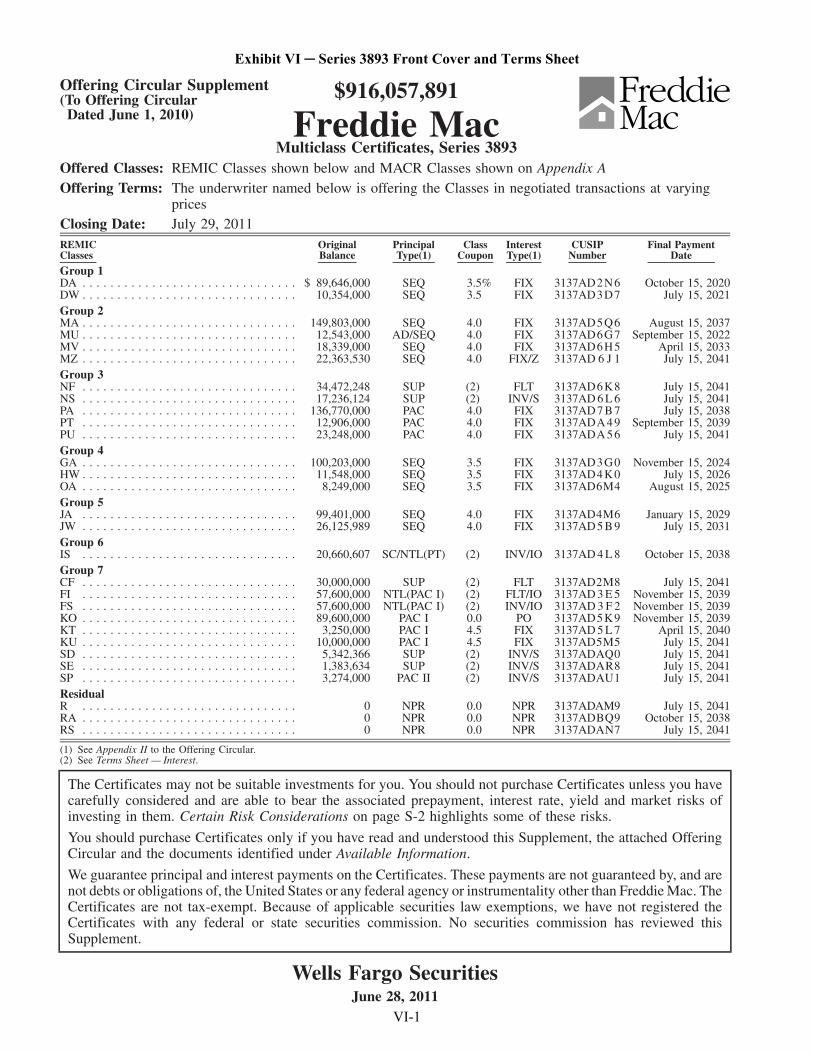
Offering Circular Supplement(To Offering Circular
Dated June 1, 2010)
$916,057,891
Freddie MacMulticlass Certificates, Series 3893
Offered Classes: REMIC Classes shown below and MACR Classes shown on Appendix AOffering Terms: The underwriter named below is offering the Classes in negotiated transactions at varying
pricesClosing Date: July 29, 2011REMICClasses
OriginalBalance
PrincipalType(1)
ClassCoupon
InterestType(1)
CUSIPNumber
Final PaymentDate
Group 1DA . . . . . . . . . . . . . . . . . . . . . . . . . . . . . . . $ 89,646,000 SEQ 3.5% FIX 3137AD2N6 October 15, 2020DW . . . . . . . . . . . . . . . . . . . . . . . . . . . . . . . 10,354,000 SEQ 3.5 FIX 3137AD3D7 July 15, 2021Group 2MA . . . . . . . . . . . . . . . . . . . . . . . . . . . . . . . 149,803,000 SEQ 4.0 FIX 3137AD5Q6 August 15, 2037MU . . . . . . . . . . . . . . . . . . . . . . . . . . . . . . . 12,543,000 AD/SEQ 4.0 FIX 3137AD6G7 September 15, 2022MV . . . . . . . . . . . . . . . . . . . . . . . . . . . . . . . 18,339,000 SEQ 4.0 FIX 3137AD6H5 April 15, 2033MZ . . . . . . . . . . . . . . . . . . . . . . . . . . . . . . . 22,363,530 SEQ 4.0 FIX/Z 3137AD 6 J 1 July 15, 2041Group 3NF . . . . . . . . . . . . . . . . . . . . . . . . . . . . . . . 34,472,248 SUP (2) FLT 3137AD6K8 July 15, 2041NS . . . . . . . . . . . . . . . . . . . . . . . . . . . . . . . 17,236,124 SUP (2) INV/S 3137AD 6 L 6 July 15, 2041PA . . . . . . . . . . . . . . . . . . . . . . . . . . . . . . . 136,770,000 PAC 4.0 FIX 3137AD 7 B 7 July 15, 2038PT . . . . . . . . . . . . . . . . . . . . . . . . . . . . . . . 12,906,000 PAC 4.0 FIX 3137ADA 49 September 15, 2039PU . . . . . . . . . . . . . . . . . . . . . . . . . . . . . . . 23,248,000 PAC 4.0 FIX 3137ADA 56 July 15, 2041Group 4GA . . . . . . . . . . . . . . . . . . . . . . . . . . . . . . . 100,203,000 SEQ 3.5 FIX 3137AD3G0 November 15, 2024HW . . . . . . . . . . . . . . . . . . . . . . . . . . . . . . . 11,548,000 SEQ 3.5 FIX 3137AD4K0 July 15, 2026OA . . . . . . . . . . . . . . . . . . . . . . . . . . . . . . . 8,249,000 SEQ 3.5 FIX 3137AD6M4 August 15, 2025Group 5JA . . . . . . . . . . . . . . . . . . . . . . . . . . . . . . . 99,401,000 SEQ 4.0 FIX 3137AD4M6 January 15, 2029JW . . . . . . . . . . . . . . . . . . . . . . . . . . . . . . . 26,125,989 SEQ 4.0 FIX 3137AD 5 B 9 July 15, 2031Group 6IS . . . . . . . . . . . . . . . . . . . . . . . . . . . . . . . 20,660,607 SC/NTL(PT) (2) INV/IO 3137AD 4 L 8 October 15, 2038Group 7CF . . . . . . . . . . . . . . . . . . . . . . . . . . . . . . . 30,000,000 SUP (2) FLT 3137AD2M8 July 15, 2041FI . . . . . . . . . . . . . . . . . . . . . . . . . . . . . . . 57,600,000 NTL(PAC I) (2) FLT/IO 3137AD 3 E 5 November 15, 2039FS . . . . . . . . . . . . . . . . . . . . . . . . . . . . . . . 57,600,000 NTL(PAC I) (2) INV/IO 3137AD 3 F 2 November 15, 2039KO . . . . . . . . . . . . . . . . . . . . . . . . . . . . . . . 89,600,000 PAC I 0.0 PO 3137AD5K9 November 15, 2039KT . . . . . . . . . . . . . . . . . . . . . . . . . . . . . . . 3,250,000 PAC I 4.5 FIX 3137AD 5 L 7 April 15, 2040KU . . . . . . . . . . . . . . . . . . . . . . . . . . . . . . . 10,000,000 PAC I 4.5 FIX 3137AD5M5 July 15, 2041SD . . . . . . . . . . . . . . . . . . . . . . . . . . . . . . . 5,342,366 SUP (2) INV/S 3137ADAQ0 July 15, 2041SE . . . . . . . . . . . . . . . . . . . . . . . . . . . . . . . 1,383,634 SUP (2) INV/S 3137ADAR8 July 15, 2041SP . . . . . . . . . . . . . . . . . . . . . . . . . . . . . . . 3,274,000 PAC II (2) INV/S 3137ADAU1 July 15, 2041ResidualR . . . . . . . . . . . . . . . . . . . . . . . . . . . . . . . 0 NPR 0.0 NPR 3137ADAM9 July 15, 2041RA . . . . . . . . . . . . . . . . . . . . . . . . . . . . . . . 0 NPR 0.0 NPR 3137ADBQ9 October 15, 2038RS . . . . . . . . . . . . . . . . . . . . . . . . . . . . . . . 0 NPR 0.0 NPR 3137ADAN7 July 15, 2041
(1) See Appendix II to the Offering Circular.(2) See Terms Sheet — Interest.
The Certificates may not be suitable investments for you. You should not purchase Certificates unless you havecarefully considered and are able to bear the associated prepayment, interest rate, yield and market risks ofinvesting in them. Certain Risk Considerations on page S-2 highlights some of these risks.
You should purchase Certificates only if you have read and understood this Supplement, the attached OfferingCircular and the documents identified under Available Information.
We guarantee principal and interest payments on the Certificates. These payments are not guaranteed by, and arenot debts or obligations of, the United States or any federal agency or instrumentality other than Freddie Mac. TheCertificates are not tax-exempt. Because of applicable securities law exemptions, we have not registered theCertificates with any federal or state securities commission. No securities commission has reviewed thisSupplement.
Wells Fargo SecuritiesJune 28, 2011
VI-1
Exhibit VI ─ Series 3893 Front Cover and Terms Sheet
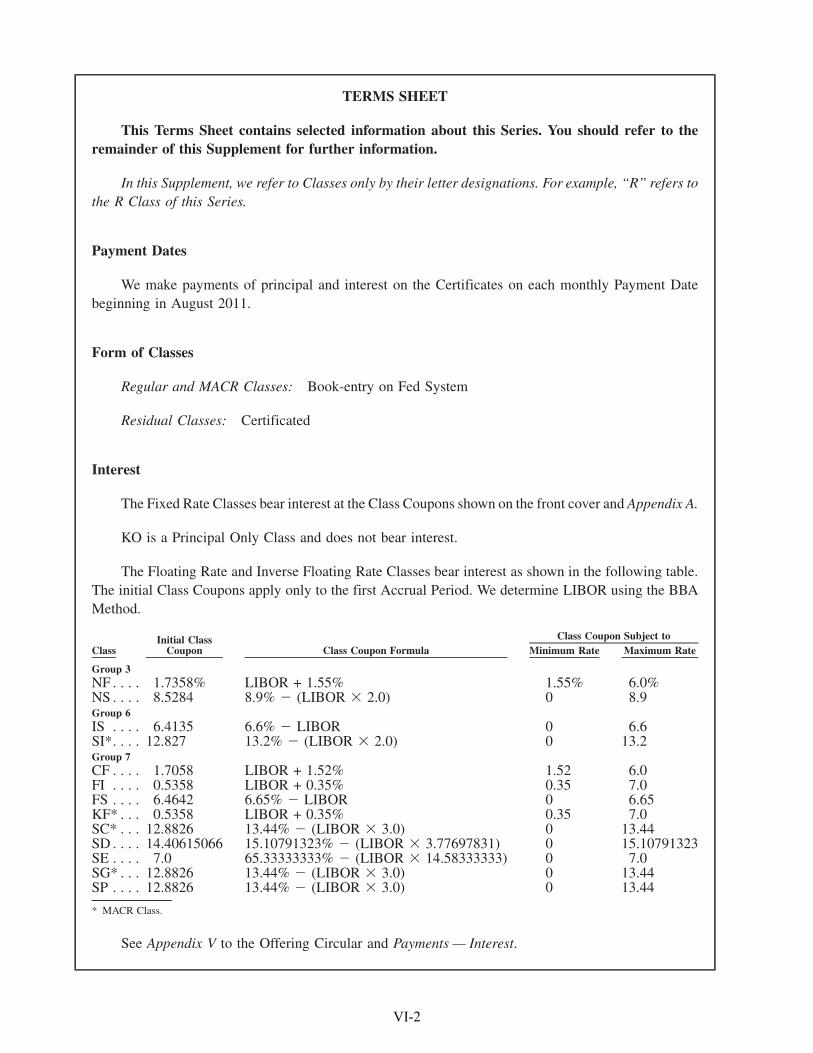
TERMS SHEET
This Terms Sheet contains selected information about this Series. You should refer to theremainder of this Supplement for further information.
In this Supplement, we refer to Classes only by their letter designations. For example, “R” refers tothe R Class of this Series.
Payment Dates
We make payments of principal and interest on the Certificates on each monthly Payment Datebeginning in August 2011.
Form of Classes
Regular and MACR Classes: Book-entry on Fed System
Residual Classes: Certificated
Interest
The Fixed Rate Classes bear interest at the Class Coupons shown on the front cover and Appendix A.
KO is a Principal Only Class and does not bear interest.
The Floating Rate and Inverse Floating Rate Classes bear interest as shown in the following table.The initial Class Coupons apply only to the first Accrual Period. We determine LIBOR using the BBAMethod.
ClassInitial Class
Coupon Class Coupon Formula Minimum Rate Maximum RateClass Coupon Subject to
Group 3NF . . . . 1.7358% LIBOR + 1.55% 1.55% 6.0%NS . . . . 8.5284 8.9% � (LIBOR � 2.0) 0 8.9Group 6IS . . . . 6.4135 6.6% � LIBOR 0 6.6SI*. . . . 12.827 13.2% � (LIBOR � 2.0) 0 13.2Group 7CF . . . . 1.7058 LIBOR + 1.52% 1.52 6.0FI . . . . 0.5358 LIBOR + 0.35% 0.35 7.0FS . . . . 6.4642 6.65% � LIBOR 0 6.65KF* . . . 0.5358 LIBOR + 0.35% 0.35 7.0SC* . . . 12.8826 13.44% � (LIBOR � 3.0) 0 13.44SD . . . . 14.40615066 15.10791323% � (LIBOR � 3.77697831) 0 15.10791323SE . . . . 7.0 65.33333333% � (LIBOR � 14.58333333) 0 7.0SG* . . . 12.8826 13.44% � (LIBOR � 3.0) 0 13.44SP . . . . 12.8826 13.44% � (LIBOR � 3.0) 0 13.44
* MACR Class.
See Appendix V to the Offering Circular and Payments — Interest.
VI-2
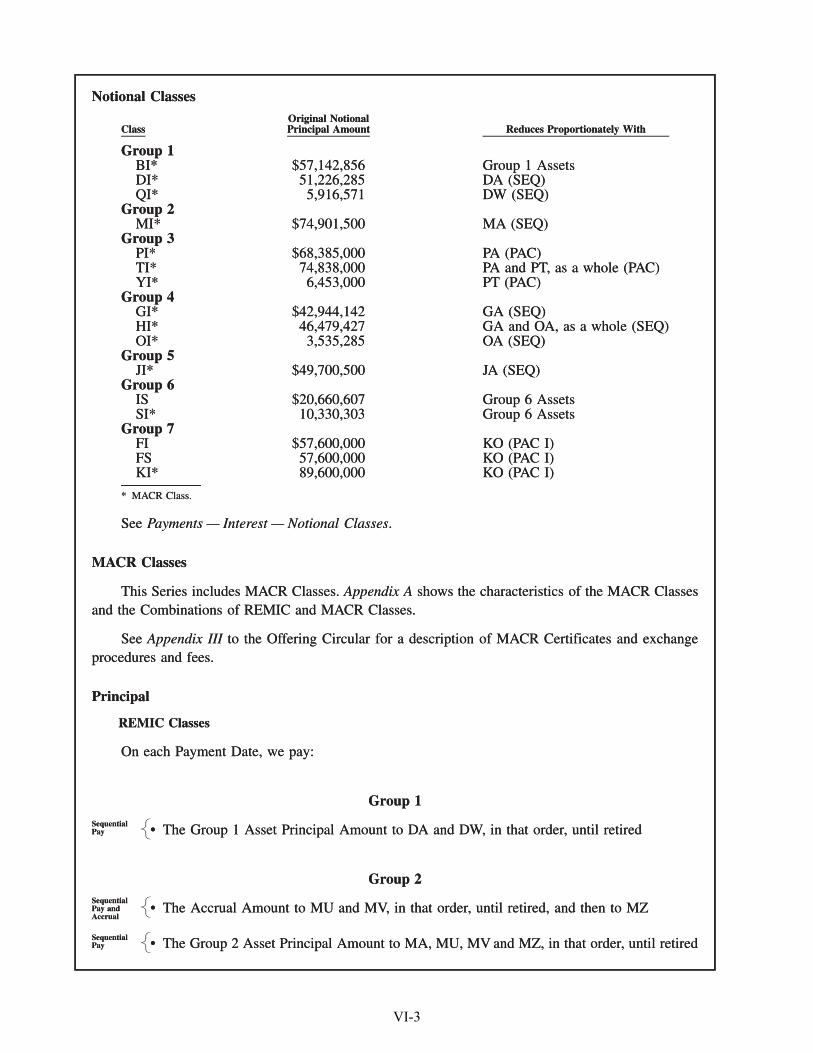
Notional Classes
ClassOriginal NotionalPrincipal Amount Reduces Proportionately With
Group 1BI* $57,142,856 Group 1 AssetsDI* 51,226,285 DA (SEQ)QI* 5,916,571 DW (SEQ)
Group 2MI* $74,901,500 MA (SEQ)
Group 3PI* $68,385,000 PA (PAC)TI* 74,838,000 PA and PT, as a whole (PAC)YI* 6,453,000 PT (PAC)
Group 4GI* $42,944,142 GA (SEQ)HI* 46,479,427 GA and OA, as a whole (SEQ)OI* 3,535,285 OA (SEQ)
Group 5JI* $49,700,500 JA (SEQ)
Group 6IS $20,660,607 Group 6 AssetsSI* 10,330,303 Group 6 Assets
Group 7FI $57,600,000 KO (PAC I)FS 57,600,000 KO (PAC I)KI* 89,600,000 KO (PAC I)
* MACR Class.
See Payments — Interest — Notional Classes.
MACR Classes
This Series includes MACR Classes. Appendix A shows the characteristics of the MACR Classesand the Combinations of REMIC and MACR Classes.
See Appendix III to the Offering Circular for a description of MACR Certificates and exchangeprocedures and fees.
Principal
REMIC Classes
On each Payment Date, we pay:
Group 1
• The Group 1 Asset Principal Amount to DA and DW, in that order, until retiredSequentialPay
Group 2
• The Accrual Amount to MU and MV, in that order, until retired, and then to MZSequentialPay andAccrual
• The Group 2 Asset Principal Amount to MA, MU, MV and MZ, in that order, until retiredSequentialPay
Notional Classes
ClassOriginal NotionalPrincipal Amount Reduces Proportionately With
Group 1BI* $57,142,856 Group 1 AssetsDI* 51,226,285 DA (SEQ)QI* 5,916,571 DW (SEQ)
Group 2MI* $74,901,500 MA (SEQ)
Group 3PI* $68,385,000 PA (PAC)TI* 74,838,000 PA and PT, as a whole (PAC)YI* 6,453,000 PT (PAC)
Group 4GI* $42,944,142 GA (SEQ)HI* 46,479,427 GA and OA, as a whole (SEQ)OI* 3,535,285 OA (SEQ)
Group 5JI* $49,700,500 JA (SEQ)
Group 6IS $20,660,607 Group 6 AssetsSI* 10,330,303 Group 6 Assets
Group 7FI $57,600,000 KO (PAC I)FS 57,600,000 KO (PAC I)KI* 89,600,000 KO (PAC I)
* MACR Class.
See Payments — Interest — Notional Classes.
MACR Classes
This Series includes MACR Classes. Appendix A shows the characteristics of the MACR Classesand the Combinations of REMIC and MACR Classes.
See Appendix III to the Offering Circular for a description of MACR Certificates and exchangeprocedures and fees.
Principal
REMIC Classes
On each Payment Date, we pay:
Group 1
• The Group 1 Asset Principal Amount to DA and DW, in that order, until retired�����
SequentialPay
Group 2
• The Accrual Amount to MU and MV, in that order, until retired, and then to MZ�����
SequentialPay andAccrual
• The Group 2 Asset Principal Amount to MA, MU, MV and MZ, in that order, until retired�����
SequentialPay
VI-3
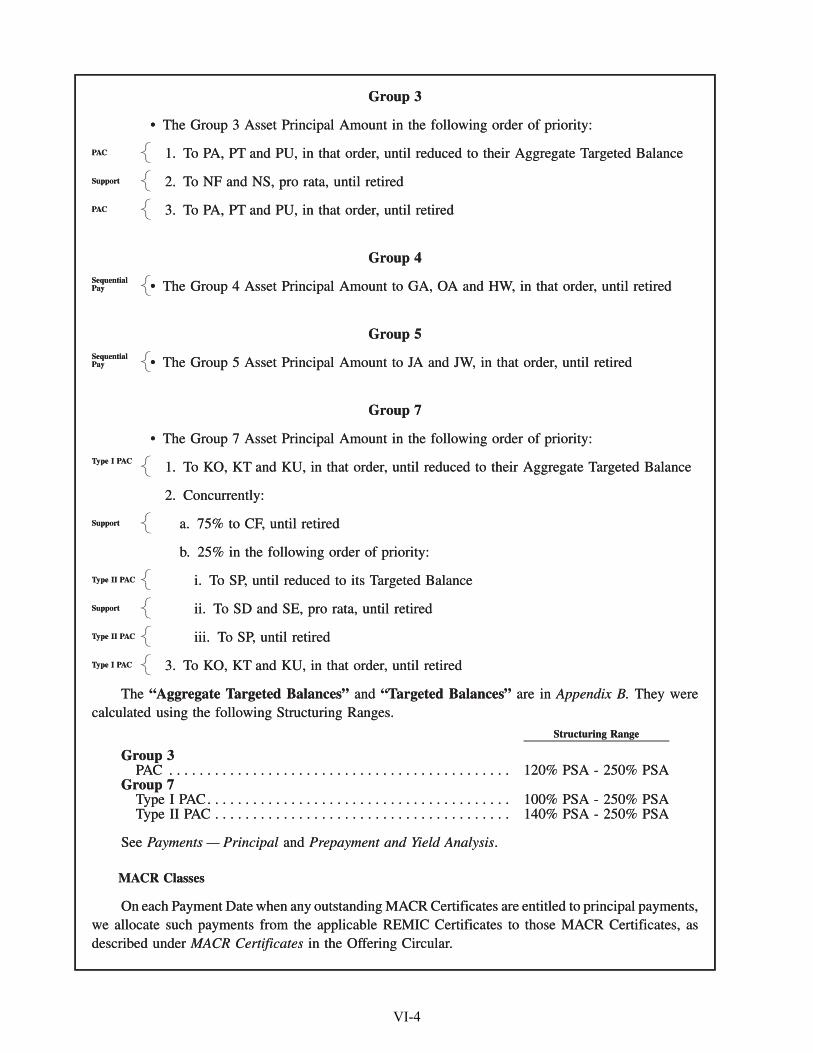
Group 3
• The Group 3 Asset Principal Amount in the following order of priority:
1. To PA, PT and PU, in that order, until reduced to their Aggregate Targeted BalancePAC
2. To NF and NS, pro rata, until retiredSupport
3. To PA, PT and PU, in that order, until retiredPAC
Group 4
• The Group 4 Asset Principal Amount to GA, OA and HW, in that order, until retiredSequentialPay
Group 5
• The Group 5 Asset Principal Amount to JA and JW, in that order, until retiredSequentialPay
Group 7
• The Group 7 Asset Principal Amount in the following order of priority:
1. To KO, KT and KU, in that order, until reduced to their Aggregate Targeted BalanceType I PAC
2. Concurrently:
a. 75% to CF, until retiredSupport
b. 25% in the following order of priority:
i. To SP, until reduced to its Targeted BalanceType II PAC
ii. To SD and SE, pro rata, until retiredSupport
iii. To SP, until retiredType II PAC
3. To KO, KT and KU, in that order, until retiredType I PAC
The “Aggregate Targeted Balances” and “Targeted Balances” are in Appendix B. They werecalculated using the following Structuring Ranges.
Structuring Range
Group 3PAC . . . . . . . . . . . . . . . . . . . . . . . . . . . . . . . . . . . . . . . . . . . . . 120% PSA - 250% PSA
Group 7Type I PAC. . . . . . . . . . . . . . . . . . . . . . . . . . . . . . . . . . . . . . . . 100% PSA - 250% PSAType II PAC . . . . . . . . . . . . . . . . . . . . . . . . . . . . . . . . . . . . . . . 140% PSA - 250% PSA
See Payments — Principal and Prepayment and Yield Analysis.
MACR Classes
On each Payment Date when any outstanding MACR Certificates are entitled to principal payments,we allocate such payments from the applicable REMIC Certificates to those MACR Certificates, asdescribed under MACR Certificates in the Offering Circular.
Group 3
• The Group 3 Asset Principal Amount in the following order of priority:
1. To PA, PT and PU, in that order, until reduced to their Aggregate Targeted Balance�����PAC
2. To NF and NS, pro rata, until retired�����Support
3. To PA, PT and PU, in that order, until retired�����PAC
Group 4
• The Group 4 Asset Principal Amount to GA, OA and HW, in that order, until retired�����
SequentialPay
Group 5
• The Group 5 Asset Principal Amount to JA and JW, in that order, until retired�����
SequentialPay
Group 7
• The Group 7 Asset Principal Amount in the following order of priority:
1. To KO, KT and KU, in that order, until reduced to their Aggregate Targeted Balance�����
Type I PAC
2. Concurrently:
a. 75% to CF, until retired�����Support
b. 25% in the following order of priority:
i. To SP, until reduced to its Targeted Balance�����Type II PAC
ii. To SD and SE, pro rata, until retired�����Support
iii. To SP, until retired�����Type II PAC
3. To KO, KT and KU, in that order, until retired�����Type I PAC
The “Aggregate Targeted Balances” and “Targeted Balances” are in Appendix B. They werecalculated using the following Structuring Ranges.
Structuring Range
Group 3PAC . . . . . . . . . . . . . . . . . . . . . . . . . . . . . . . . . . . . . . . . . . . . . 120% PSA - 250% PSA
Group 7Type I PAC. . . . . . . . . . . . . . . . . . . . . . . . . . . . . . . . . . . . . . . . 100% PSA - 250% PSAType II PAC . . . . . . . . . . . . . . . . . . . . . . . . . . . . . . . . . . . . . . . 140% PSA - 250% PSA
See Payments — Principal and Prepayment and Yield Analysis.
MACR Classes
On each Payment Date when any outstanding MACR Certificates are entitled to principal payments,we allocate such payments from the applicable REMIC Certificates to those MACR Certificates, asdescribed under MACR Certificates in the Offering Circular.
VI-4
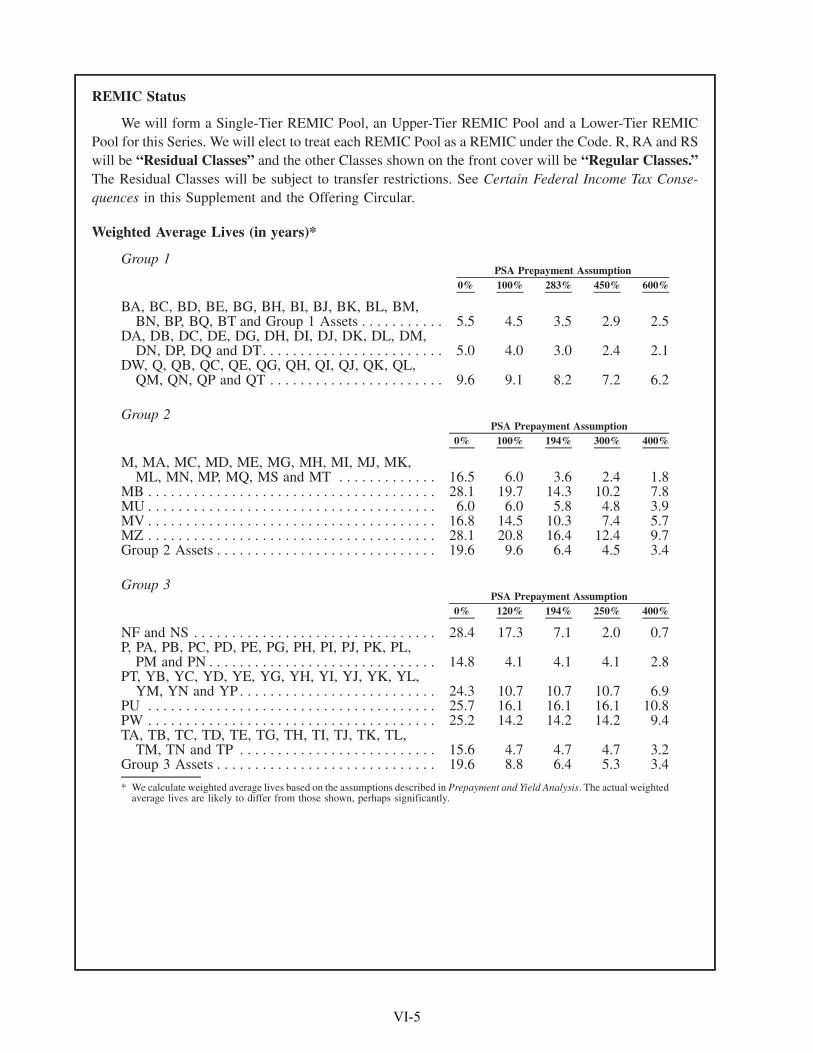
REMIC Status
We will form a Single-Tier REMIC Pool, an Upper-Tier REMIC Pool and a Lower-Tier REMICPool for this Series. We will elect to treat each REMIC Pool as a REMIC under the Code. R, RA and RSwill be “Residual Classes” and the other Classes shown on the front cover will be “Regular Classes.”The Residual Classes will be subject to transfer restrictions. See Certain Federal Income Tax Conse-quences in this Supplement and the Offering Circular.
Weighted Average Lives (in years)*
Group 1
0% 100% 283% 450% 600%PSA Prepayment Assumption
BA, BC, BD, BE, BG, BH, BI, BJ, BK, BL, BM,BN, BP, BQ, BT and Group 1 Assets . . . . . . . . . . . 5.5 4.5 3.5 2.9 2.5
DA, DB, DC, DE, DG, DH, DI, DJ, DK, DL, DM,DN, DP, DQ and DT. . . . . . . . . . . . . . . . . . . . . . . . 5.0 4.0 3.0 2.4 2.1
DW, Q, QB, QC, QE, QG, QH, QI, QJ, QK, QL,QM, QN, QP and QT . . . . . . . . . . . . . . . . . . . . . . . 9.6 9.1 8.2 7.2 6.2
Group 2
0% 100% 194% 300% 400%PSA Prepayment Assumption
M, MA, MC, MD, ME, MG, MH, MI, MJ, MK,ML, MN, MP, MQ, MS and MT . . . . . . . . . . . . . 16.5 6.0 3.6 2.4 1.8
MB . . . . . . . . . . . . . . . . . . . . . . . . . . . . . . . . . . . . . . 28.1 19.7 14.3 10.2 7.8MU . . . . . . . . . . . . . . . . . . . . . . . . . . . . . . . . . . . . . . 6.0 6.0 5.8 4.8 3.9MV . . . . . . . . . . . . . . . . . . . . . . . . . . . . . . . . . . . . . . 16.8 14.5 10.3 7.4 5.7MZ . . . . . . . . . . . . . . . . . . . . . . . . . . . . . . . . . . . . . . 28.1 20.8 16.4 12.4 9.7Group 2 Assets . . . . . . . . . . . . . . . . . . . . . . . . . . . . . 19.6 9.6 6.4 4.5 3.4
Group 3
0% 120% 194% 250% 400%PSA Prepayment Assumption
NF and NS . . . . . . . . . . . . . . . . . . . . . . . . . . . . . . . . 28.4 17.3 7.1 2.0 0.7P, PA, PB, PC, PD, PE, PG, PH, PI, PJ, PK, PL,
PM and PN . . . . . . . . . . . . . . . . . . . . . . . . . . . . . . 14.8 4.1 4.1 4.1 2.8PT, YB, YC, YD, YE, YG, YH, YI, YJ, YK, YL,
YM, YN and YP . . . . . . . . . . . . . . . . . . . . . . . . . . 24.3 10.7 10.7 10.7 6.9PU . . . . . . . . . . . . . . . . . . . . . . . . . . . . . . . . . . . . . . 25.7 16.1 16.1 16.1 10.8PW . . . . . . . . . . . . . . . . . . . . . . . . . . . . . . . . . . . . . . 25.2 14.2 14.2 14.2 9.4TA, TB, TC, TD, TE, TG, TH, TI, TJ, TK, TL,
TM, TN and TP . . . . . . . . . . . . . . . . . . . . . . . . . . 15.6 4.7 4.7 4.7 3.2Group 3 Assets . . . . . . . . . . . . . . . . . . . . . . . . . . . . . 19.6 8.8 6.4 5.3 3.4
* We calculate weighted average lives based on the assumptions described in Prepayment and Yield Analysis. The actual weightedaverage lives are likely to differ from those shown, perhaps significantly.
VI-5
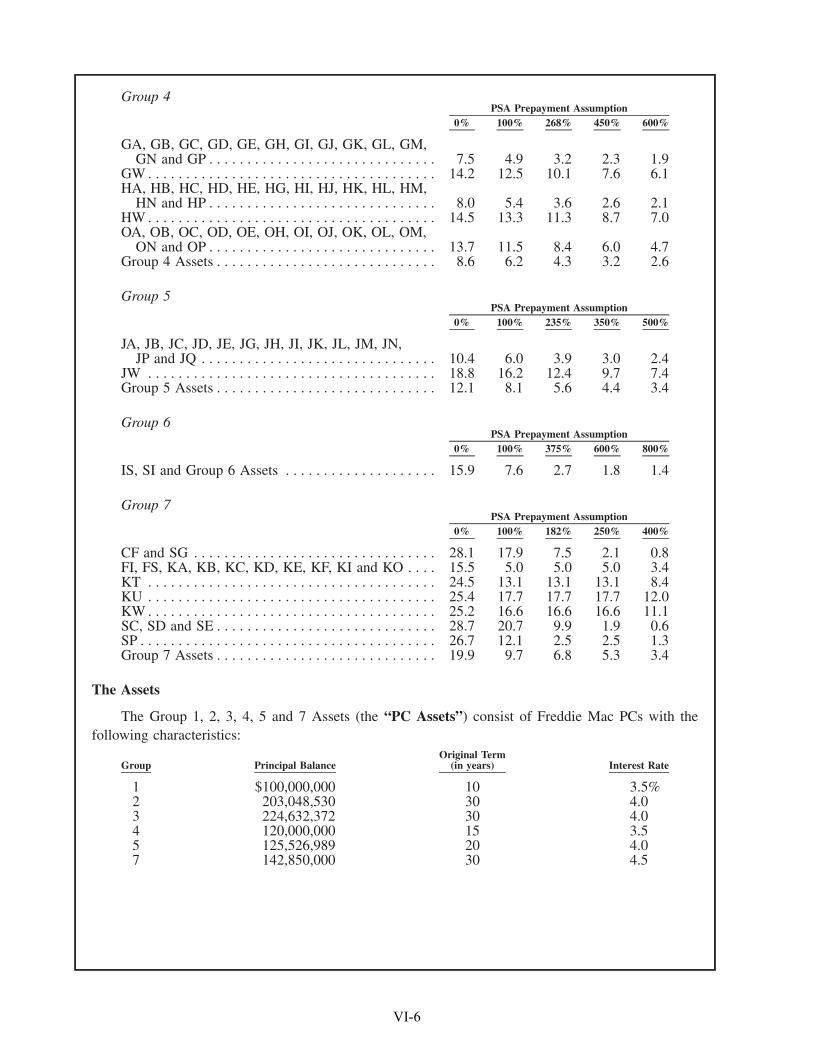
Group 4
0% 100% 268% 450% 600%PSA Prepayment Assumption
GA, GB, GC, GD, GE, GH, GI, GJ, GK, GL, GM,GN and GP . . . . . . . . . . . . . . . . . . . . . . . . . . . . . . 7.5 4.9 3.2 2.3 1.9
GW . . . . . . . . . . . . . . . . . . . . . . . . . . . . . . . . . . . . . . 14.2 12.5 10.1 7.6 6.1HA, HB, HC, HD, HE, HG, HI, HJ, HK, HL, HM,
HN and HP . . . . . . . . . . . . . . . . . . . . . . . . . . . . . . 8.0 5.4 3.6 2.6 2.1HW . . . . . . . . . . . . . . . . . . . . . . . . . . . . . . . . . . . . . . 14.5 13.3 11.3 8.7 7.0OA, OB, OC, OD, OE, OH, OI, OJ, OK, OL, OM,
ON and OP . . . . . . . . . . . . . . . . . . . . . . . . . . . . . . 13.7 11.5 8.4 6.0 4.7Group 4 Assets . . . . . . . . . . . . . . . . . . . . . . . . . . . . . 8.6 6.2 4.3 3.2 2.6
Group 5
0% 100% 235% 350% 500%PSA Prepayment Assumption
JA, JB, JC, JD, JE, JG, JH, JI, JK, JL, JM, JN,JP and JQ . . . . . . . . . . . . . . . . . . . . . . . . . . . . . . . 10.4 6.0 3.9 3.0 2.4
JW . . . . . . . . . . . . . . . . . . . . . . . . . . . . . . . . . . . . . . 18.8 16.2 12.4 9.7 7.4Group 5 Assets . . . . . . . . . . . . . . . . . . . . . . . . . . . . . 12.1 8.1 5.6 4.4 3.4
Group 6
0% 100% 375% 600% 800%PSA Prepayment Assumption
IS, SI and Group 6 Assets . . . . . . . . . . . . . . . . . . . . 15.9 7.6 2.7 1.8 1.4
Group 7
0% 100% 182% 250% 400%PSA Prepayment Assumption
CF and SG . . . . . . . . . . . . . . . . . . . . . . . . . . . . . . . . 28.1 17.9 7.5 2.1 0.8FI, FS, KA, KB, KC, KD, KE, KF, KI and KO . . . . 15.5 5.0 5.0 5.0 3.4KT . . . . . . . . . . . . . . . . . . . . . . . . . . . . . . . . . . . . . . 24.5 13.1 13.1 13.1 8.4KU . . . . . . . . . . . . . . . . . . . . . . . . . . . . . . . . . . . . . . 25.4 17.7 17.7 17.7 12.0KW . . . . . . . . . . . . . . . . . . . . . . . . . . . . . . . . . . . . . . 25.2 16.6 16.6 16.6 11.1SC, SD and SE . . . . . . . . . . . . . . . . . . . . . . . . . . . . . 28.7 20.7 9.9 1.9 0.6SP . . . . . . . . . . . . . . . . . . . . . . . . . . . . . . . . . . . . . . . 26.7 12.1 2.5 2.5 1.3Group 7 Assets . . . . . . . . . . . . . . . . . . . . . . . . . . . . . 19.9 9.7 6.8 5.3 3.4
The Assets
The Group 1, 2, 3, 4, 5 and 7 Assets (the “PC Assets”) consist of Freddie Mac PCs with thefollowing characteristics:
Group Principal BalanceOriginal Term
(in years) Interest Rate
1 $100,000,000 10 3.5%2 203,048,530 30 4.03 224,632,372 30 4.04 120,000,000 15 3.55 125,526,989 20 4.07 142,850,000 30 4.5
VI-6
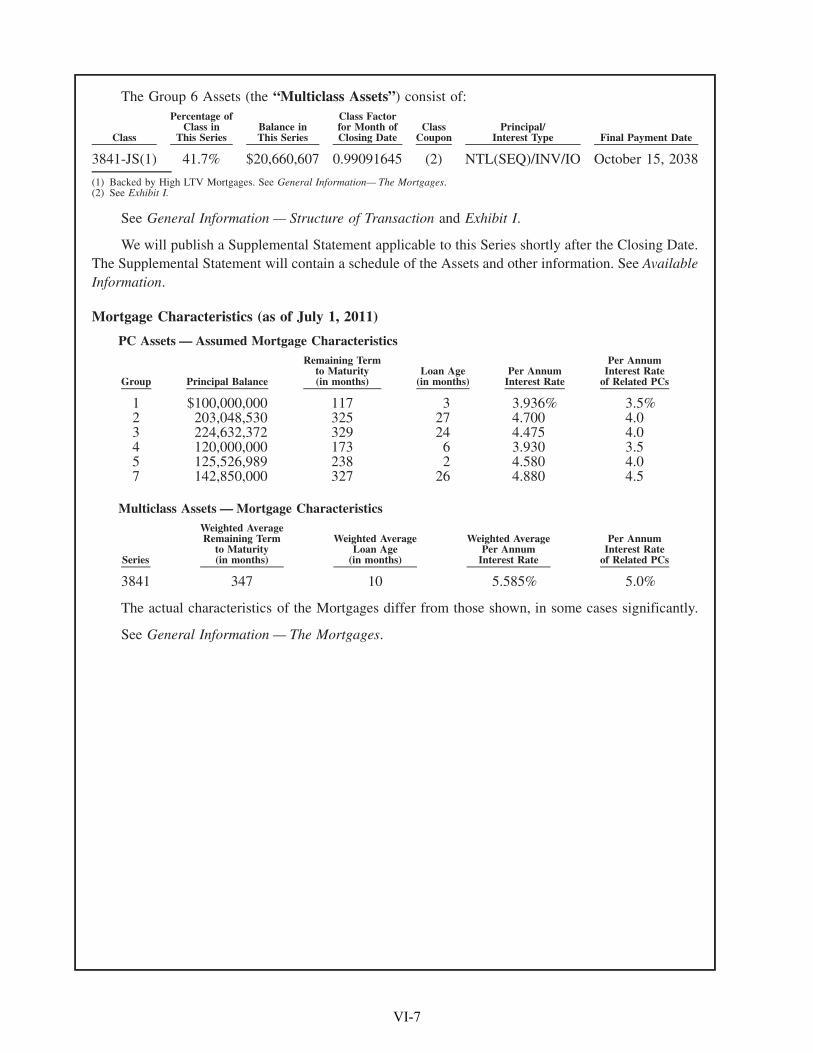
The Group 6 Assets (the “Multiclass Assets”) consist of:
Class
Percentage ofClass in
This SeriesBalance inThis Series
Class Factorfor Month ofClosing Date
ClassCoupon
Principal/Interest Type Final Payment Date
3841-JS(1) 41.7% $20,660,607 0.99091645 (2) NTL(SEQ)/INV/IO October 15, 2038
(1) Backed by High LTV Mortgages. See General Information— The Mortgages.(2) See Exhibit I.
See General Information — Structure of Transaction and Exhibit I.
We will publish a Supplemental Statement applicable to this Series shortly after the Closing Date.The Supplemental Statement will contain a schedule of the Assets and other information. See AvailableInformation.
Mortgage Characteristics (as of July 1, 2011)
PC Assets — Assumed Mortgage Characteristics
Group Principal Balance
Remaining Termto Maturity(in months)
Loan Age(in months)
Per AnnumInterest Rate
Per AnnumInterest Rate
of Related PCs
1 $100,000,000 117 3 3.936% 3.5%2 203,048,530 325 27 4.700 4.03 224,632,372 329 24 4.475 4.04 120,000,000 173 6 3.930 3.55 125,526,989 238 2 4.580 4.07 142,850,000 327 26 4.880 4.5
Multiclass Assets — Mortgage Characteristics
Series
Weighted AverageRemaining Term
to Maturity(in months)
Weighted AverageLoan Age
(in months)
Weighted AveragePer Annum
Interest Rate
Per AnnumInterest Rate
of Related PCs
3841 347 10 5.585% 5.0%
The actual characteristics of the Mortgages differ from those shown, in some cases significantly.
See General Information — The Mortgages.
VI-7
If you intend to purchase Certificates, you shouldrely only on the information in this Supplementand the Offering Circular, including the informa-tion in the Incorporated Documents. We have notauthorized anyone to provide you with differentinformation.
This Supplement, the Offering Circular and theIncorporated Documents may not be correct aftertheir dates.
We are not offering the Certificates in any juris-diction that prohibits their offer.
TABLE OF CONTENTSDescription Page
Offering Circular SupplementCertain Risk Considerations . . . . . . . . . . . . . . . . . . . . . . . . . . . . S-2Terms Sheet . . . . . . . . . . . . . . . . . . . . . . . . . . . . . . . . . . . . . . S-3Available Information . . . . . . . . . . . . . . . . . . . . . . . . . . . . . . . . S-14General Information . . . . . . . . . . . . . . . . . . . . . . . . . . . . . . . . . S-14
The Trust Agreement . . . . . . . . . . . . . . . . . . . . . . . . . . . . . S-14Form of Certificates . . . . . . . . . . . . . . . . . . . . . . . . . . . . . . S-15Denominations of Certificates . . . . . . . . . . . . . . . . . . . . . . . . S-15Structure of Transaction . . . . . . . . . . . . . . . . . . . . . . . . . . . . S-15The Mortgages . . . . . . . . . . . . . . . . . . . . . . . . . . . . . . . . . S-15
Payments . . . . . . . . . . . . . . . . . . . . . . . . . . . . . . . . . . . . . . . S-16Payment Dates; Record Dates . . . . . . . . . . . . . . . . . . . . . . . . S-16Method of Payment . . . . . . . . . . . . . . . . . . . . . . . . . . . . . . S-16Categories of Classes . . . . . . . . . . . . . . . . . . . . . . . . . . . . . S-16Interest . . . . . . . . . . . . . . . . . . . . . . . . . . . . . . . . . . . . . . S-17Principal . . . . . . . . . . . . . . . . . . . . . . . . . . . . . . . . . . . . . S-17Class Factors . . . . . . . . . . . . . . . . . . . . . . . . . . . . . . . . . . S-18Guarantees . . . . . . . . . . . . . . . . . . . . . . . . . . . . . . . . . . . S-181% Clean-up Call . . . . . . . . . . . . . . . . . . . . . . . . . . . . . . . S-19Residual Proceeds . . . . . . . . . . . . . . . . . . . . . . . . . . . . . . . S-19
Prepayment and Yield Analysis . . . . . . . . . . . . . . . . . . . . . . . . . . S-19General . . . . . . . . . . . . . . . . . . . . . . . . . . . . . . . . . . . . . S-19Prepayment and Weighted Average Life Considerations . . . . . . . . . . S-21Declining Balances Table . . . . . . . . . . . . . . . . . . . . . . . . . . . S-29Yield Tables . . . . . . . . . . . . . . . . . . . . . . . . . . . . . . . . . . . S-42
Final Payment Dates. . . . . . . . . . . . . . . . . . . . . . . . . . . . . . . . . S-45Certain Federal Income Tax Consequences . . . . . . . . . . . . . . . . . . . S-45
General . . . . . . . . . . . . . . . . . . . . . . . . . . . . . . . . . . . . . S-45Regular Classes. . . . . . . . . . . . . . . . . . . . . . . . . . . . . . . . . S-45Residual Classes . . . . . . . . . . . . . . . . . . . . . . . . . . . . . . . . S-46MACR Classes . . . . . . . . . . . . . . . . . . . . . . . . . . . . . . . . . S-47
ERISA Considerations. . . . . . . . . . . . . . . . . . . . . . . . . . . . . . . . S-47Accounting Considerations . . . . . . . . . . . . . . . . . . . . . . . . . . . . . S-47Legal Investment Considerations . . . . . . . . . . . . . . . . . . . . . . . . . S-47Plan of Distribution . . . . . . . . . . . . . . . . . . . . . . . . . . . . . . . . . S-47Legal Matters . . . . . . . . . . . . . . . . . . . . . . . . . . . . . . . . . . . . . S-48Appendix A — Available Combinations — Series 4011 . . . . . . . . . . . . A-1Appendix B — Balances Schedules . . . . . . . . . . . . . . . . . . . . . . . . B-1Exhibit I — Series 3889 Front Cover and Terms Sheet . . . . . . . . . . . . I-1Exhibit II — Series 3967 Front Cover, Terms Sheet and MACR Table . . . II-1Exhibit III — Series 3652 Front Cover, Terms Sheet and MACR Table. . . III-1Exhibit IV — Series 3521 Front Cover, Terms Sheet and MACR Table . . IV-1Exhibit V — Series 3984 Front Cover and Terms Sheet . . . . . . . . . . . . V-1Exhibit VI — Series 3893 Front Cover and Terms Sheet . . . . . . . . . . . VI-1
Offering CircularFreddie Mac . . . . . . . . . . . . . . . . . . . . . . . . . . . . . . . . . . . . . 3Additional Information . . . . . . . . . . . . . . . . . . . . . . . . . . . . . . . 6Summary . . . . . . . . . . . . . . . . . . . . . . . . . . . . . . . . . . . . . . . 8Risk Factors. . . . . . . . . . . . . . . . . . . . . . . . . . . . . . . . . . . . . . 13Application of Proceeds . . . . . . . . . . . . . . . . . . . . . . . . . . . . . . . 20Description of Certificates . . . . . . . . . . . . . . . . . . . . . . . . . . . . . 20MACR Certificates . . . . . . . . . . . . . . . . . . . . . . . . . . . . . . . . . 33Prepayment, Yield and Suitability Considerations . . . . . . . . . . . . . . . 33The Trust Agreement . . . . . . . . . . . . . . . . . . . . . . . . . . . . . . . . 40Certain Federal Income Tax Consequences . . . . . . . . . . . . . . . . . . . 44ERISA Considerations. . . . . . . . . . . . . . . . . . . . . . . . . . . . . . . . 60Accounting Considerations . . . . . . . . . . . . . . . . . . . . . . . . . . . . . 61Legal Investment Considerations . . . . . . . . . . . . . . . . . . . . . . . . . 61Plan of Distribution . . . . . . . . . . . . . . . . . . . . . . . . . . . . . . . . . 61Increase in Size . . . . . . . . . . . . . . . . . . . . . . . . . . . . . . . . . . . 62Appendix I — Index of Terms . . . . . . . . . . . . . . . . . . . . . . . . . . . I-1Appendix II — Standard Definitions and Abbreviations for Classes . . . . . II-1Appendix III — MACR Certificate Exchanges . . . . . . . . . . . . . . . . . III-1Appendix IV — Retail Class Principal Payments . . . . . . . . . . . . . . . . IV-1Appendix V — Interest Rate Indices . . . . . . . . . . . . . . . . . . . . . . . V-1
$905,431,677
Freddie Mac
Multiclass Certificates,Series 4011
J.P. Morgan
February 14, 2012
Recommended