Master thesis for the Master of Philosophy in Economics degree
Offshoring in the Norwegian industry
International Relocation of Production Processes: Industry and Firm Determinants.
Marianne Lier
January 2007
Department of Economics
University of Oslo

i
i
PREFACE
It has been an interesting and instructive process to write this thesis. The
overwhelming amount of information has made it challenging to structure the
material, and could not be done without the help from my proficient supervisor
Karen Helene Ulltveit-Moe.
I would like to thank Knut R. Skotner and Knut E. Sunde in Federations of
Norwegian Industries and Per Heum and Frode Kristiansen in Institute for Research
in Economics and Business Administration for giving me access to necessary data
and information. I truly appreciate their assistance.
I will also like to thank all the people that have supported and encouraged me
through this process. All amendments and advices have been of value.
Oslo, January 28th
Marianne Lier
ii
ii
Contents
1.0 THE DETERMINANTS FOR OFFSHORING 1
1.1 BACKGROUND: GLOBALIZATION AND REALIGNMENT OF PRODUCTION PATTERNS 1
1.2 APPROACH: THE DETERMINANTS OF OFFSHORING 4
1.2.1 Definitions and Concepts 4
1.2.1 The determinants of offshoring 5
2.0 THEORY 8
2.1 INTRODUCTION 8
2.2 FACTOR COST DIFFERENCES 9
2.2.1 Ricardian Model of Trade 9
2.2.2 Heckscher-Ohlin Model of Trade 12
2.2.2 The Product Cycle 16
2.3 COST TO DISINTEGRATE STAGES OF PRODUCTION 17
2.3.1 Service Link Costs 17
2.3.2 Transaction Costs 20
2.3.2 Some Implications 22
2.4 THE CHOICE OF ORGANIZATIONAL FORM 23
2.5 CONCLUSION 25 3.0 DATA AND SOURCES OF ERROR 27
3.1 SOURCES OF DATA 27
3.2 RESPONSE RATE, NON-RESPONSE ERROR AND OTHER SOURCES OF ERROR 28
iii
iii
4.0 DESCRIPTIVE ANALYSIS AND DISCUSSION 32
4.1 INTRODUCTION 32
4.2 SAMPLE CHARACTERISTICS 32
4.3 THE GAINS FROM DISINTEGRATING STAGES OF PRODUCTION 40
4.3.1 Reasons for offshoring 40
4.3.2 Factor Cost Savings 44
4.4.2 Access to Markets 47
4.4 THE COST OF DISINTEGRATING STAGES OF PRODUCTION 49
4.5 THE CHOICE OF ORGANIZATIONAL FORM 52
4.6 SUMMARY 55 5.0 CONCLUSION 57 6.0 REFERENCES 58 A.0 APPENDIX 60
A.1 QUESTIONNAIRE 47
iv
iv
Figures and Tables
FIGURES
1.1 DEVELOPMENT OF UN/WEIGHTED AVERAGE TARIFF, 1860-2000 2
1.2 TRANSPORTATION VERSUS COMMUNICATION COSTS 3
2.1 FRAGMENTATION 11
2.2 COST SAVINGS FROM COSTLESS FRAGMENTATION 16
2.3 PRODUCTION BLOCKS 18
2.4 CO-ORDINATION COSTS 19
4.1 LABOUR INTENSITY OVER INDUSTRIAL SECTORS 36
4.2 OFFSHORING ACTIVITY OVER REGION 38
4.3 INDUSTRIAL SECTORS OVER REGION 40
4.4 REASONS FOR OFFSHORING 41
4.5 REASONS FOR OFFSHORING OVER INDUSTRIAL SECTORS 43
4.6 WAGE COSTS FOR INDUSTRY WORKERS 2005 45
4.7 SIZE OF FIRM AND REGION 51
4.8 ORGANIZATIONAL FORM 52
4.9 SIZE OF FIRMS 54
4.10 AVERAGE CAPITAL INTENSITY 56
4.11 AVERAGE LABOUR PRODUCTIVITY 57 TABLES
1.1 BENEFITS AND COSTS TO THE FIRM OF HORIZONTAL AND VERTICAL FDI 6
4.1 COMPARISON OF OFFSHORING ACROSS INDUSTRIES 34
4.2 TOP TEN DESTINATIONS FOR OFFSHORING 38
4.3 THE R&D INTENSITY OF PRODUCTION IN THE OECD 1987-88 48
4.4 EMPLOYEES 50
v
v
SUMMARY
The aim of this thesis is to analyse the determinants that trigger Norwegian firms to
offshore and to examine how firms and industries choose to organize their vertical
activities; through in-house offshoring or outsourcing. The determinants that trigger
the Norwegian firms to offshore production may be examined by analysing the cost
trade-off associated with splitting production activities by function.
Surveying the determinants for offshoring in the Norwegian industry is important for
understanding the increasing verticality in trade, and it can be a starting point of an
analysis of the consequences offshoring will have for the Norwegian economy.
The forces of globalization are believed to have changed the nature of trade, leading
to an increasing interconnectedness of production processes where countries
specialize in stages of production and vertical trading chains are created across
boundaries. Globalization reflects the many technological and organizational
developments that have made it easier to carry out international transactions.
Furthermore the opening of the markets in China, India and Eastern Europe give
access to different factor endowments, technologies and to a huge pool of non-
agricultural labour. Technological advance in logistic processes which improve
timeliness and reduce time- and co-ordination costs, in addition to the diffusion of
information technologies, has improved the utilization of these markets.
Fragmentation of production processes allows for a more specialized use of factors
in production. Specialized production blocks can be relocated to countries which are
relatively abundant in the factor that is used relatively more of in the production
process. This enables a lower marginal cost of production. The relocation of
production processes has its costs in terms of increased trade and transportation
costs, but also due to an increased need to co-ordinate intermediate goods that
requires timeliness and efficient transportation. In addition, frictions in market due to
imperfect information may increase the costs of finding a partner to form a
relationship with, the costs of (re-) negotiating contracts, and the hold-up problem
leads to insufficient investments. This trade-off is important for gaining insight into
vi
vi
the determinants that trigger Norwegian firms to offshore production. I will use
variants of standard trade theories, such as Ricardian model of trade and
Heckscher-Ohlin to explain how benefits arises form differences in technology and
factor endowments. The costs of disintegration will be examined by reviewing Jones
and Kierzkowski’s (2000) model of co-ordination costs and transaction costs.
The organizational form is chosen to reduce the transaction costs, and the
boundaries of the firm are assumed to be determined where the costs of using the
market to allocate resources are the same as the costs of keeping the activities
internal in a firm. I will use Dunning’s OLI framework and asset specificity theories to
gain insight into the choice of organizational form.
I have used data from a survey conducted by TBL1 which examines the offshoring
activity among the companies in the Norwegian technology industry. These data are
combined with financial data from the Dun & Bradstreet database. The calculations
have been conducted by the use of SPSS 14.0 and Microsoft Office Excel.
The findings, using descriptive analysis, support that the main reason for firms to
offshore is to save costs. As the costs of unskilled labour in Norway are relatively
high, many firms relocate their activity to countries abundant in labour such as
China and countries in Eastern Europe. These areas represent also emerging
economies, where Norwegian firms see a potential market for their products. Some
firms report this as a reason for their offshoring activity, but often in combination with
the desire of saving costs.
Transaction costs are assumed to be increasing relative to the size if the firms are
small. The analysis shows that large firms do have a high share of offshoring, but so
do the smaller firms in our sample. Also the geographical relocation cost is assumed
to be higher with distance, and as smaller firms have relatively smaller volume in
their transactions than larger corporations we may expect that the fixed costs of
offshoring are relatively high for a small firm. Surprisingly, the smaller firms in our
sample have high shares of offshoring to Asian countries.
1 Teknologibedriftenes landsforening
vii
vii
Theory predicts that the choice of organizational form depends on the transaction
costs that a specific firm or industry faces, and that the relative ability to undertake
different organizational forms depend on a firm’s productivity. Most of the firms in
our sample use the market to allocate resources, and consistent with theory, these
firms are less capital intensive and have less productivity than firms that choose to
use in-house offshoring.
1
1
1.0 THE DETERMINANTS OF OFFSHORING
1.1 BACKGROUND: GLOBALIZATION AND REALIGNMENT OF PRODUCTION PATTERNS
Globalization is a complex concept, an intertwined system of processes and
structural shifts that leads national and local markets into a single global market, and
that affects how businesses and societies are organized. The term has been used
since the beginning of the 1980s, reflecting the many technological and
organizational developments that have made it easier to carry out international
transactions. As noted by Burda and Dluhosch (2002):”We are witnessing a wave of
fundamental developments which are changing ways that nations interact
economically with each other. Mega-mergers and cross-border firm linkages have
intensified trade in intermediate good. An especially impressive development has
been the rise in outsourcing, which allows firms to extend activities across national
borders and tailor manufacturing strategies to idiosyncratic attributes of local
production sites” (pg 2). In this section I will go through some of the changes that
have made it possible to relocate production processes across borders and that
facilitate trade.
The opening of the markets in China and India has been of great importance for
access to different factor endowments, technologies and to a huge pool of non-
agricultural labour2. This creates challenges for many countries in the world since the
competition increases when markets get more integrated, but also possibilities in
terms of new customers and potential cost savings, exploiting differences in
comparative advantages. Also, according to Friedman (2006), the fall of the Berlin
Wall 9th of November 1989 was one of the forces that “flattened the world”, as the
Soviet Empire now opened for democratic and free-market oriented governance and
“liberated all the captive peoples of the Soviet Empire” (pg. 51).
2 Since 1995 around 700 million workers have been added to the non-agricultural labour force, and around 1.5 billion extra workers are expected to join in during the next 30 years. See European Commission (2006), “Globalisation: Trends, Issues and Macro Implications for the EU” pg. 12See European Commission (2006), “Globalisation: Trends, Issues and Macro Implications for the EU” pg. 12
2
2
Changes in laws and (global) institutions such as World Trade Organization,
European Union and International Monetary Fund have made it easier and less
costly to accomplish transactions (i.e. commodities, labour, services or capital)
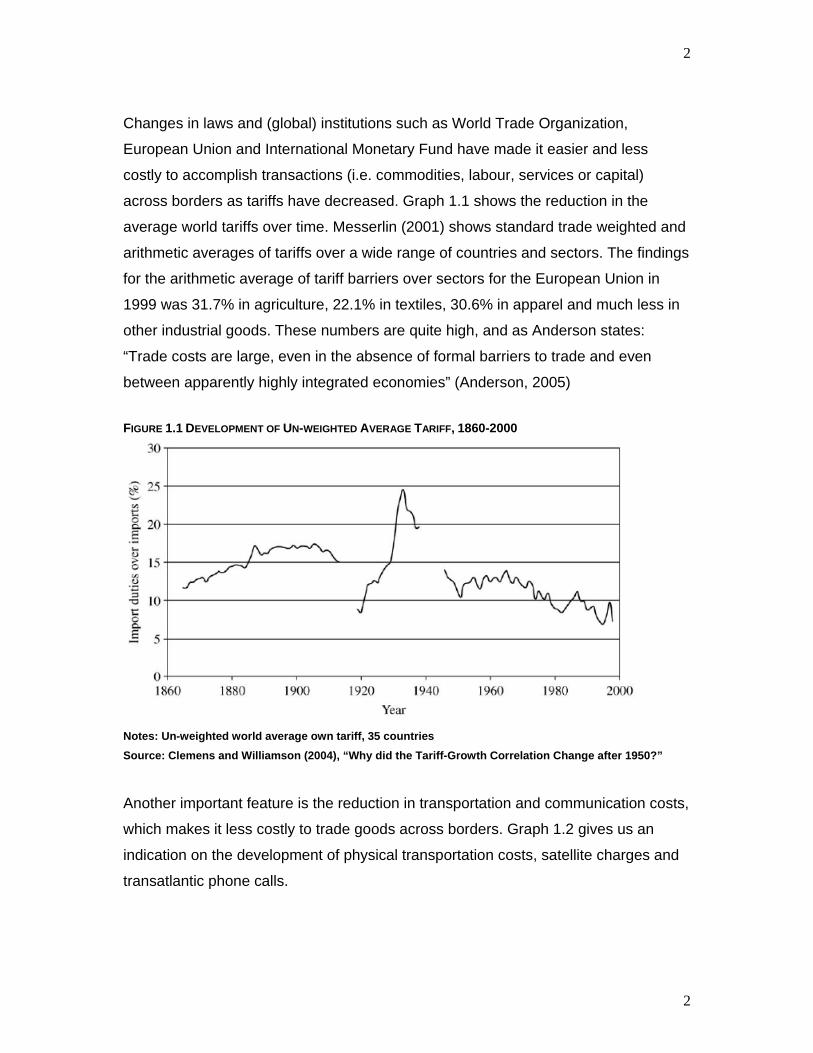
across borders as tariffs have decreased. Graph 1.1 shows the reduction in the
average world tariffs over time. Messerlin (2001) shows standard trade weighted and
arithmetic averages of tariffs over a wide range of countries and sectors. The findings
for the arithmetic average of tariff barriers over sectors for the European Union in
1999 was 31.7% in agriculture, 22.1% in textiles, 30.6% in apparel and much less in
other industrial goods. These numbers are quite high, and as Anderson states:
“Trade costs are large, even in the absence of formal barriers to trade and even
between apparently highly integrated economies” (Anderson, 2005) FIGURE 1.1 DEVELOPMENT OF UN-WEIGHTED AVERAGE TARIFF, 1860-2000
Notes: Un-weighted world average own tariff, 35 countries Source: Clemens and Williamson (2004), “Why did the Tariff-Growth Correlation Change after 1950?”
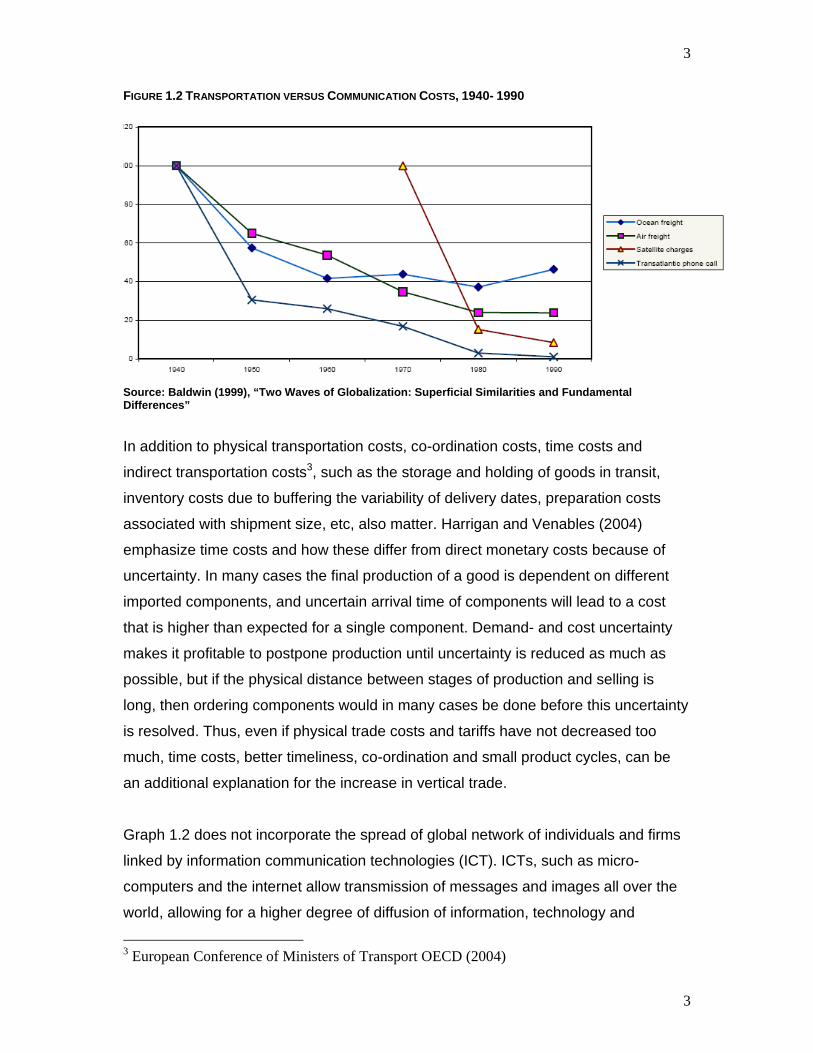
Another important feature is the reduction in transportation and communication costs,
which makes it less costly to trade goods across borders. Graph 1.2 gives us an
indication on the development of physical transportation costs, satellite charges and
transatlantic phone calls.
3
3
FIGURE 1.2 TRANSPORTATION VERSUS COMMUNICATION COSTS, 1940- 1990
Source: Baldwin (1999), “Two Waves of Globalization: Superficial Similarities and Fundamental Differences”
In addition to physical transportation costs, co-ordination costs, time costs and
indirect transportation costs3, such as the storage and holding of goods in transit,
inventory costs due to buffering the variability of delivery dates, preparation costs
associated with shipment size, etc, also matter. Harrigan and Venables (2004)
emphasize time costs and how these differ from direct monetary costs because of
uncertainty. In many cases the final production of a good is dependent on different
imported components, and uncertain arrival time of components will lead to a cost
that is higher than expected for a single component. Demand- and cost uncertainty
makes it profitable to postpone production until uncertainty is reduced as much as
possible, but if the physical distance between stages of production and selling is
long, then ordering components would in many cases be done before this uncertainty
is resolved. Thus, even if physical trade costs and tariffs have not decreased too
much, time costs, better timeliness, co-ordination and small product cycles, can be
an additional explanation for the increase in vertical trade.
Graph 1.2 does not incorporate the spread of global network of individuals and firms
linked by information communication technologies (ICT). ICTs, such as micro-
computers and the internet allow transmission of messages and images all over the
world, allowing for a higher degree of diffusion of information, technology and
3 European Conference of Ministers of Transport OECD (2004)
4
4
standards. This new technology makes distance and physical space less important
and has “fundamentally altered the scope (widening the reach of networks of social
activity and power), intensity (regularized connections), velocity (speeding up
interactions and processes), and impact (local impacts global) of transformations”.
(Blossfeld et al., 2005, pg. 4)
The forces of globalization, some outlined above, are believed to have changed the
nature of trade, leading to an increasing interconnectedness of production processes
where countries specialize in stages of production and vertical trading chains are
created across boundaries. The production of a Barbie doll describes the features of
global production quite well: “The doll is designed in Mattel’s headquarters in El
Segunda, California. Oil is refined into ethylene in Taiwan and formed into plastic
pellets that are used to produce the doll’s body. Barbie’s nylon hair is manufactured
in Japan, while the cotton cloth for her clothing originates in China. The moulds for
the doll are made in the United States, as are the paints used to decorate it, and the
cardboard used for packaging. Assembly takes place in Indonesia and Malaysia.
Finally, the dolls are quality tested in California, and marketed from there and
elsewhere around the globe”4.
1.2 APPROACH: THE DETERMINANTS OF OFFSHORING
1.2.1 Definitions and Concepts
The key idea of verticality in trade is that parts of production are placed in different
countries, and that these countries link sequentially. The approaches and definitions
to characterize these linkages and concepts are many and needs to be defined
precisely. Production in a foreign country can be commenced through arm-length
contracts with subcontractors, often called “outsourcing”, or through “in-house
offshoring” where a company makes a “Greenfield investment” 5, merge with or buy
another company. All these activities have in common that the firms production
activities become more spatially dispersed, or increasingly fragmented.
4 Tempest (1996), ”Barbie and the World Economy”, Los Angeles Times, September 22, quoted in Grossman and Rossi- Hansberg (2006) pg.1 5 Greenfield investments occur when firms invest in new physical plant and productive assets.
5
5
The concept “offshoring” includes both outsourcing and in-house offshoring, and can
be defined as “a shift from domestic to foreign suppliers of intermediate inputs and
services”, (Ekholm and Hakkala, 2005, page 3). Outsourcing6 is a transfer of one or
more functions that previously were performed in-house to an outside foreign
provider with the use of an arm-length contract. In-house offshoring is a geographical
relocation of the firm’s own activities. Thus, the difference between outsourcing and
in-house offshoring relates to how the boundaries of the firm is set and not to the
verticality of trade per se, making it possible to analyse these phenomenon using
much of the same theoretical framework. I will use the term outsourcing and in-house
offshoring when the boundaries of the firms are important.
Jones and Kierzkowski (2000) do not focus on the boundaries of the firm when they
use the term fragmentation in their treatment of verticality in trade. “Fragmentation
refers to a splitting up of a previously integrated process into two or more
components, or fragments.” (pg. 3) These fragments or production blocks,
independent on how the business is organized, can be relocated across borders.
Naturally, I will use the concepts of the authors choice when their theories are
described.
1.2.2 The determinants of offshoring
Barba Navaretti and Venables (2004) points out that: “Firms’ activities can be
concentrated in a single country or dispersed between several, and each pattern has
costs and benefits” (pg. 24). The costs of geographical dispersion depend on how the
activities of the firm are split, and the characteristics of the firms or the industry as
well as characteristics of the home and host country.
A firm may duplicate all its activities in another country, that is, split its production into
two identical parts, or it can split the production geographically by duplicating subsets
of production. This is called horizontal investments. The focus in this thesis will
6
6
mainly be on vertical investments, that is, splitting the activities by function, so that
one (or more) particular component(s) are produced in a separate foreign plant. The
firm can own this plant, or an external supplier may run it.
There are different costs and benefits associated with splitting activities by function,
and these costs reflects the determinants of offshoring, as firms face a trade-off in
their decision to offshore production and chooses the alternative that will maximize
profits or reduce costs.
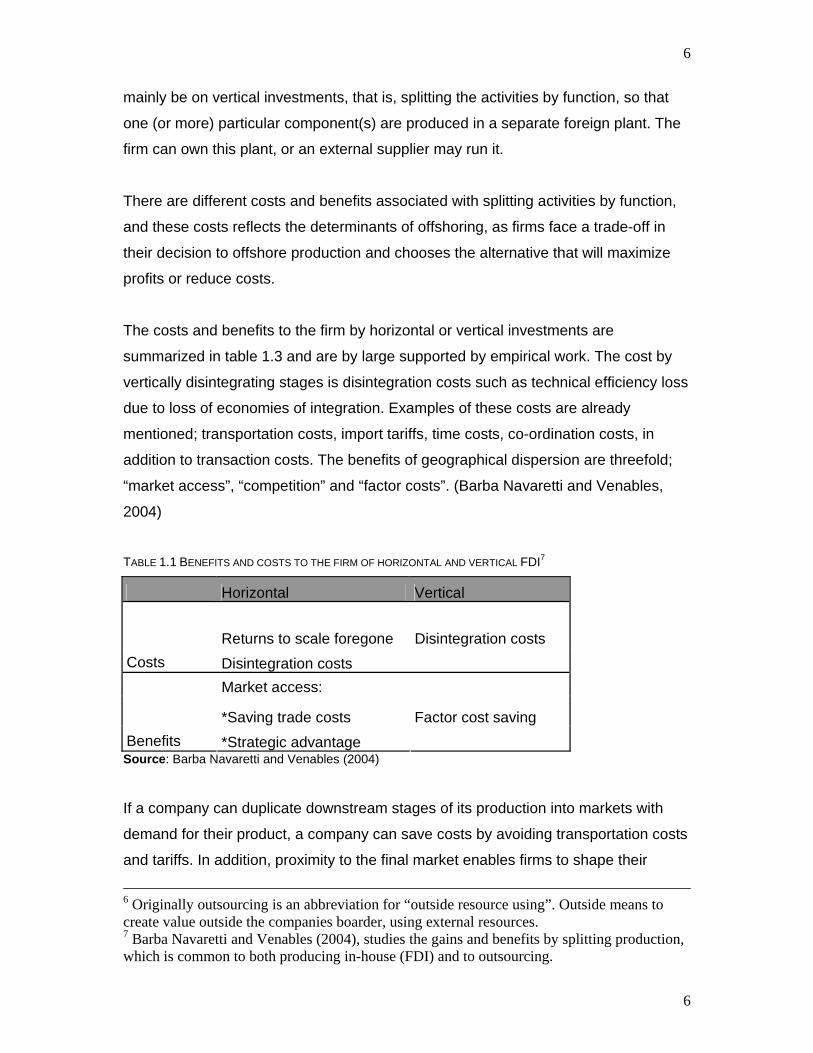
The costs and benefits to the firm by horizontal or vertical investments are
summarized in table 1.3 and are by large supported by empirical work. The cost by
vertically disintegrating stages is disintegration costs such as technical efficiency loss
due to loss of economies of integration. Examples of these costs are already
mentioned; transportation costs, import tariffs, time costs, co-ordination costs, in
addition to transaction costs. The benefits of geographical dispersion are threefold;
“market access”, “competition” and “factor costs”. (Barba Navaretti and Venables,
2004)
TABLE 1.1 BENEFITS AND COSTS TO THE FIRM OF HORIZONTAL AND VERTICAL FDI7
Horizontal Vertical
Returns to scale foregone Disintegration costs Costs Disintegration costs
Market access:
*Saving trade costs Factor cost saving Benefits *Strategic advantage Source: Barba Navaretti and Venables (2004)
If a company can duplicate downstream stages of its production into markets with
demand for their product, a company can save costs by avoiding transportation costs
and tariffs. In addition, proximity to the final market enables firms to shape their
6 Originally outsourcing is an abbreviation for “outside resource using”. Outside means to create value outside the companies boarder, using external resources. 7 Barba Navaretti and Venables (2004), studies the gains and benefits by splitting production, which is common to both producing in-house (FDI) and to outsourcing.
7
7
products to the local tastes and react quicker to changes in demand. Presence in the
local market can also be important in terms of interaction with competitors because
an investment that reduce trade costs, possible in combination with lower production
costs, will affect the marginal price and the volume sold in the market. Depending on
the competitive environment8, a lower marginal cost may reduce the sales volume
and prices of the other firms, or even lead to exit of some competitors. (Barba
Navaretti and Venables, 2004)
Differences in factor costs of primary inputs in production are probably the main
motivation for vertical investments9. Moving for example unskilled labour intensive
activities to countries where wages for unskilled workers are low or research and
development (R&D) activities to countries where the cost of scientists is low, enables
cost savings. Examples of this are the expansion of European Union’s investments in
Central- and Eastern European countries and the US investments in Mexico and
Bangalore.
These costs and gains, reflecting the determinants for offshoring, will function as
building blocks for this thesis. I will discuss the gains and costs using theory and
descriptive analysis.
8 This could be the mode of competition, such as Bertrand (price competition) or Cournot competition (competition in quantity) and market concentration. 9 Barba Navaretti and Venables (2004)
8
8
2.0 THEORY
2.1 INTRODUCTION
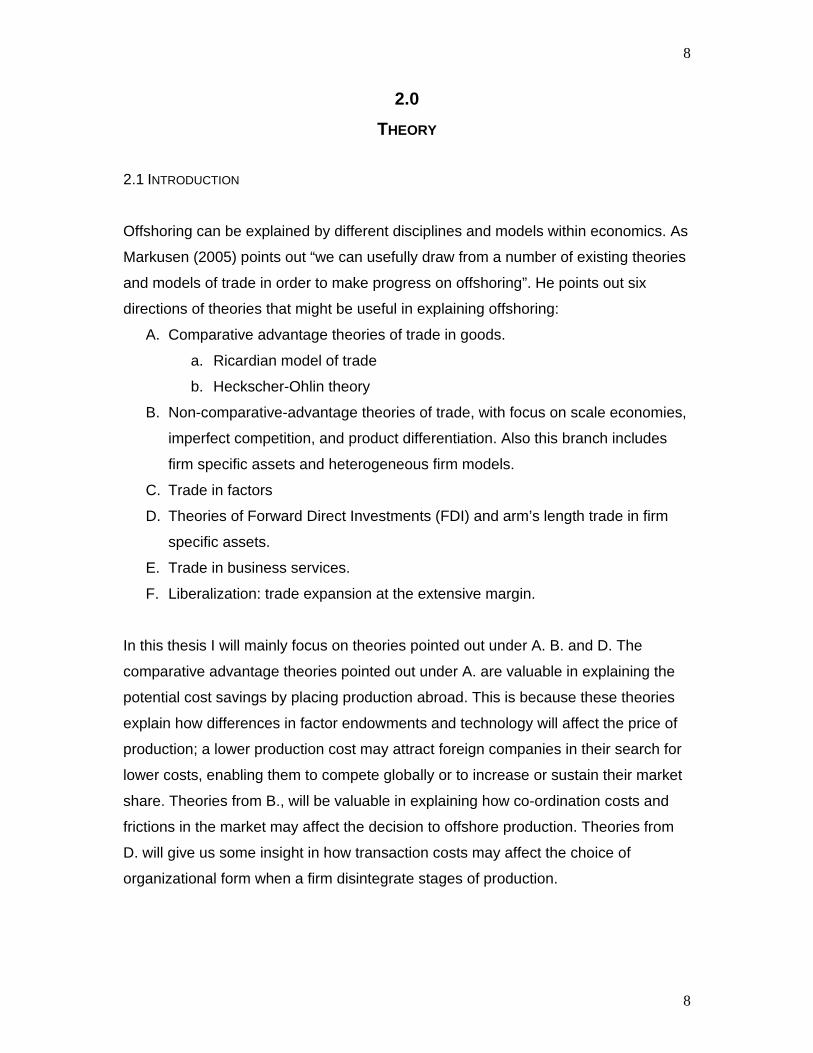
Offshoring can be explained by different disciplines and models within economics. As
Markusen (2005) points out “we can usefully draw from a number of existing theories
and models of trade in order to make progress on offshoring”. He points out six
directions of theories that might be useful in explaining offshoring:
A. Comparative advantage theories of trade in goods.
a. Ricardian model of trade
b. Heckscher-Ohlin theory
B. Non-comparative-advantage theories of trade, with focus on scale economies,
imperfect competition, and product differentiation. Also this branch includes
firm specific assets and heterogeneous firm models.
C. Trade in factors
D. Theories of Forward Direct Investments (FDI) and arm’s length trade in firm
specific assets.
E. Trade in business services.
F. Liberalization: trade expansion at the extensive margin.
In this thesis I will mainly focus on theories pointed out under A. B. and D. The
comparative advantage theories pointed out under A. are valuable in explaining the
potential cost savings by placing production abroad. This is because these theories
explain how differences in factor endowments and technology will affect the price of
production; a lower production cost may attract foreign companies in their search for
lower costs, enabling them to compete globally or to increase or sustain their market
share. Theories from B., will be valuable in explaining how co-ordination costs and
frictions in the market may affect the decision to offshore production. Theories from
D. will give us some insight in how transaction costs may affect the choice of
organizational form when a firm disintegrate stages of production.
9
9
The structure of chapter 2.0 will be as follows. In section 2.2 I will take a closer look
at the geographical factor cost differences as determinants for offshoring, using
models within standard trade theory. The models are based on the principle of
comparative advantage and describe how differences in technology and factor
endowments can affect the decision to offshore production. In section 2.3 I will take a
closer look at models that gives weight to costs arising from disintegrating stages of
production, such as geographical co-ordination costs and transaction costs. Section
2.4 is devoted to the organizational costs trade-off arising from fragmenting
production and how these costs may affect the decision to outsource or internalize.
2.2 FACTOR COST DIFFERENCES
The theory of comparative advantage is usually attributed to David Ricardo after he
systematically explained the theory in his book “The Principles of Political Economy
and Taxation”. Comparative advantage explains why it can be beneficial for two
parties to trade despite the fact that one can produce every good cheaper than the
other. This is due to the alternative cost. A country has a comparative advantage
when it can produce something to a lower alternative cost than another country. Thus
if both countries specialize in production that minimizes alternative cost, it frees up
more resources that can be used in production of the good that we are relatively
more efficient in producing. Thus, we have a more efficient use of resources and it
will be produced more of at least one of the goods. (Norman, 1993)
2.2.1 Ricardian Model of Trade
Deardorff (2001) uses the Ricardian model of trade by emphasizing the technological
differences between countries10. This difference is driving countries to specialize in
the good that they are relatively more efficient in producing.
10 Assumptions underlying the Ricardian Model of trade is homogeneous goods across firms and countries, cost of labour is homogenous within one country but heterogeneous between two countries, goods can be transported costless between countries, labour can be reallocated costless between industries within a country but cannot move between countries, labour is always fully employed, productivity differ between countries, assumed perfect competitive environments in both countries and consumers maximize utility.
10
10
A country is endowed with a fixed amount of labour which it can use to produce two
goods, X and Y. The unit labour requirements in production of each are fixed.
Assuming that the country is small and open, the country face fixed prices on the two
goods given on the world market, xp and yp . At these prices it can sell and buy at
unlimited quantities. Following the theory of comparative advantage, a country will
produce and export the good that yields the highest wages for the inhabitants, in the
following assumed to be X.
Assuming that fragmentation of X becomes possible. Good X may be produced from
scratch or by using the imported intermediate good Z. If a country chooses to import
good Z, the demand for Z will equal the demand for X, so that there is a one to one
relationship between the imported good and the production of the final good.
Opening up for trade in intermediate goods, Deardorff ends up with a standard
Ricardian model with trade in three goods: X, Y and Z.
In order to not confuse fragmentation with an improvement in technology, it is
assumed that the fragmented technology, that is production of X with use of Z,
requires more resources than producing X with the original technology. This is not
necessary but illustrates the point that there may be gains from placing production
abroad even if the technology is less productive.
Since the intermediate good Z becomes tradable, the introduction of fragmentation
also requires that world market provides a price for it, here noted by zp .Assuming that
the small country trade with “rest-of-world”, an integrated economy, the small country
will not be able to affect the prices and there prevails one single wage for labour
throughout the rest of the world. Fragmentation that does not lower the labour
requirement, since the new technology requires more resources than the original,
cannot lower the price of X. The price of X cannot raise either, since the original
technology for X still is available. Since this is true, what matters for the small country
then, is the price of Z which is dependent on the technology for producing Z in the
rest of the world.
What happens in the small open economy when we open for fragmentation?
11
11
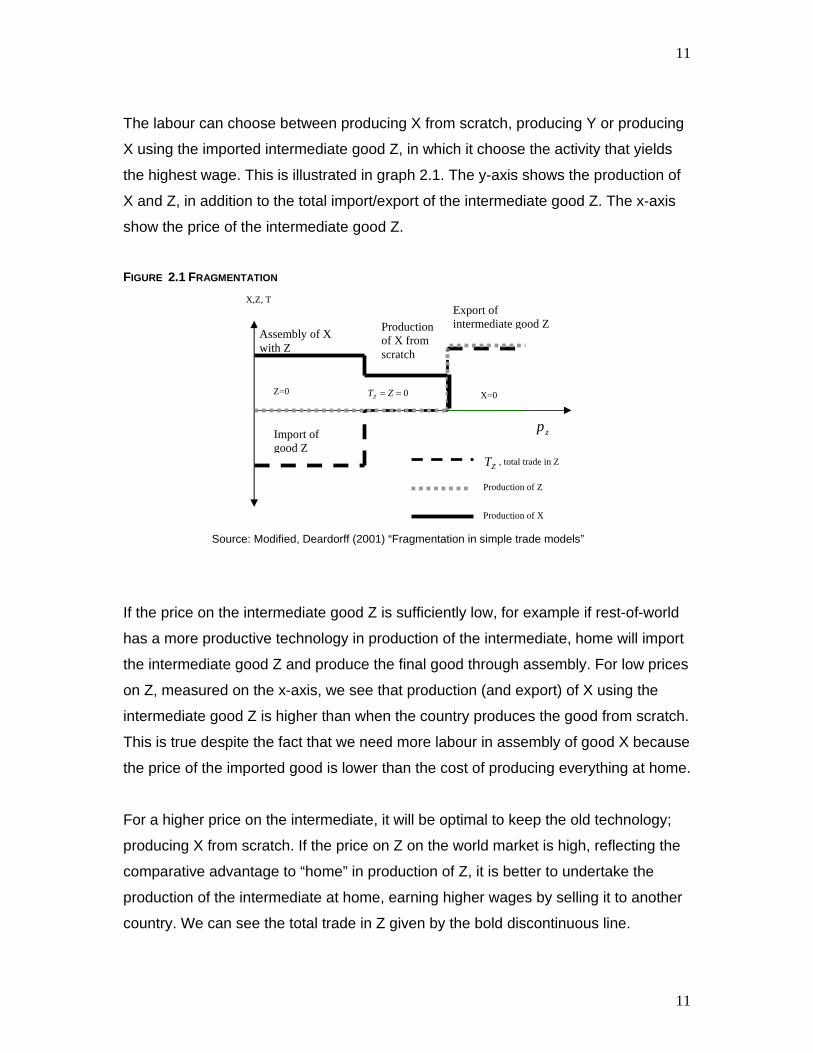
The labour can choose between producing X from scratch, producing Y or producing
X using the imported intermediate good Z, in which it choose the activity that yields
the highest wage. This is illustrated in graph 2.1. The y-axis shows the production of
X and Z, in addition to the total import/export of the intermediate good Z. The x-axis
show the price of the intermediate good Z.
FIGURE 2.1 FRAGMENTATION
Source: Modified, Deardorff (2001) “Fragmentation in simple trade models”
If the price on the intermediate good Z is sufficiently low, for example if rest-of-world
has a more productive technology in production of the intermediate, home will import
the intermediate good Z and produce the final good through assembly. For low prices
on Z, measured on the x-axis, we see that production (and export) of X using the
intermediate good Z is higher than when the country produces the good from scratch.
This is true despite the fact that we need more labour in assembly of good X because
the price of the imported good is lower than the cost of producing everything at home.
For a higher price on the intermediate, it will be optimal to keep the old technology;
producing X from scratch. If the price on Z on the world market is high, reflecting the
comparative advantage to “home” in production of Z, it is better to undertake the
production of the intermediate at home, earning higher wages by selling it to another
country. We can see the total trade in Z given by the bold discontinuous line.
X=0 0== ZTZ Z=0
Production of X
Production of Z
X,Z, T
ZT , total trade in Z
zp
Assembly of X with Z
Production of X from scratch
Export of intermediate good Z
Import of good Z
12
12
What can this simple model really tell us? The main insight is that a country (or
industry, firm) tends to specialize in whatever activity that gives the highest wages or
profits. This specialization depends on the differences in technology between
countries. Fragmentation may give a country a comparative advantage in a good that
they did not have comparative advantage in before, thus a production technology
allowing for fragmentation may give rise to new patterns of trade (following from new
patterns of comparative advantages).
2.2.2 Heckscher- Ohlin Model of Trade
In a Heckscher-Ohlin framework, trade is explained from differences in factor
endowments; differences in skill (human capital), land (natural resources of all sorts),
and labour (the number of people in a countries labour force). A country abundant in
labour11 will have a comparative advantage in production of labour intensive goods,
following from the fact that the relative prices on the abundant factor will be lower.
The greater the difference in factor intensities used in production between the
countries in question, the more we can save by placing production abroad. (Norman,
1993)
The application of Heckscher-Ohlin model of trade on offshoring is in many aspects
similar to the traditional Heckscher-Ohlin model of trade in final goods. Differences in
factor endowment determine the pattern of international trade, where a country will
export (intermediate) goods which require relatively more of the factor that a country
is abundant in. The difference between the model used in final- and intermediate
goods arise since production can be fragmented into different stages or production
blocks. These production blocks may be more specialized. A company may choose
to split production into three production blocks dependent on the intensity of skilled
used in the production process, that is, one block is unskilled labour intensive,
another may be skilled labour intensive while the last may be capital intensive. By
doing so, a company can offshore production blocks to countries abundant in that
11 It is necessary to point out that the educational level between the labour forces may be different. A country abundant in unskilled labour will have a comparative advantage in unskilled labour tasks, while a country abundant in skilled labour will have a comparative
13
13
factor that the production block use more intensively, such as offshoring unskilled
labour intensive production blocks to Asia. In the standard Heckscher-Ohlin model of
trade in final goods, this refinement of production is not possible, and it is the factor
intensity of the final good that matters for where a good is produced.
The Heckscher-Ohlin model differs from the Ricardian, outlined above, in that it
assumes that the technologies are the same across countries. Also, due to
differences in the price of factors between countries, the input composition will be
different. It is assumed that labour and capital can be re-employed costless in
another sector of production, but that they are immobile between countries. Patterns
of demand are also assumed to be similar in the countries. Furthermore, all cost of
trade, such as transportation cost and tariffs are assumed away.
Deardorff (1998) uses a variant of the standard Heckscher-Ohlin framework to
explain cost savings from fragmentation. Deardorff analyses two countries, “North”
and “South”, where North is capital abundant and South is labour abundant. This
implies that capital is relatively cheaper in North than in South. He assumes that the
fragmentation will be an insignificant part of the economy, so that fragmentation does
not change the factor prices in any of the two countries. Furthermore, he only
considers goods that are produced in one country, which in the following will be good
X.
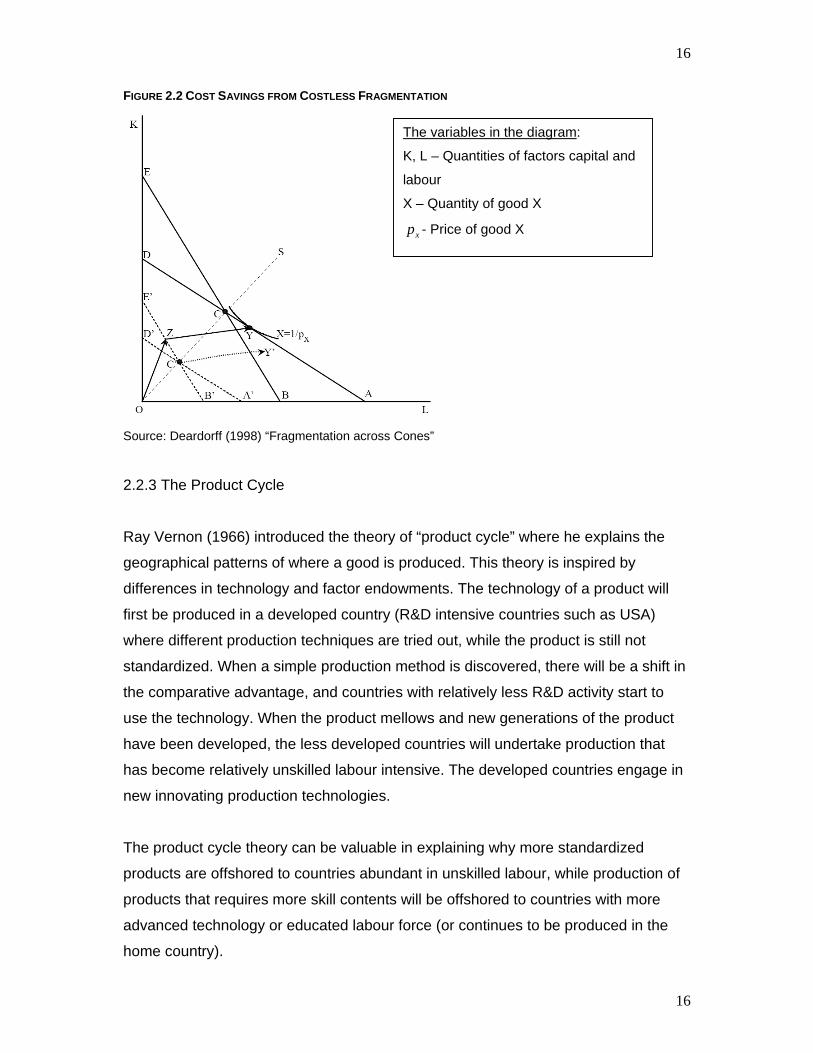
The scenario of fragmentation is illustrated in the Lerner diagram, figure 2.2, below.
The unit value isoquant arises from the production function and the given nominal
prices so that 1=Xpx or xpX 1= 12. The production function, X, determines the
shape of the isoquant giving us different combinations of factors that will make one
unit of worth.
The unit isocost lines are marked as ACD and BCE for South and North respectively,
showing the combinations of factors in the two countries worth one dollar. As South is
labour abundant, the wages here will be lower than in North, implying that North will
advantage in performing tasks requiring skilled labour. Usually the term labour intensive means that a country is abundant in unskilled labour.
14
14
have a steeper isocost curve than South. The optimal solution, that is where a good
is produced, will be where the isoquant line touches the unit isocost line.
In the diagram below, it is assumed that good X is produced by South13, as the
technology demands more labour in production than optimal in North, thus the unit
value isoquant touches the isocost line on the line AC.
Deardorff (1998) proposes two models, one model with the assumption that the
technologies used under fragmentation always use the same amount of resources as
the original seamless technology, the other where the fragmented technology uses
more resources than the original technology. I will in the following assume that the
fragmentation is costless, so that the fragmentation uses the same amount of
resources as the seamless production. This will not always be the case, but it
illustrates cost savings as a determinant for offshoring. There will also be possible to
save costs under costly fragmentation14.
Allowing for fragmentation of good X, there will now exists two different factor
combinations, one more capital intensive than the other, which together permit the
same amount of good X given by the isoquant. The same amount of good X,
produced by the isoquant xpX 1= , can now be produced using one fragment that
requires a vector of factors shown as OZ and another fragment that requires the
vector ZY. The vectors are constructed so that the factors used in seamless
production equals factors used in fragmented production15. Since this is the case, a
producer in South may as well choose the fragmented production of good X as it will
not loose or win from doing so.
If the fragment OZ represents production of a final good, South would never have
produced this good, because it would have required more capital than optimal. We
12 Here xp is the world price on good X. 13 It could have been the case that the unit isoquant line touched both North and South’s isocost line on both sides of C, in which it would be optimal for North to produce some of good X as well. 14 To see more about costless and costly fragmentation read Deardorff (1998) “Fragmentation across Cones”. 15 Measured on the X and Y axis respectively, and follows from “costless” fragmentation.
15
15
should therefore expect that the fragmented part OZ will be produced in North.
Assuming that North will produce the capital intensive fragment and South produces
the labour intensive fragment, the cost of producing X will fall and the isocost lines
shifts inward to A’C’D’ and B’C’E’ in parallel distance to ACD and BCE respectively,
both contradicts inward to the origin by the same amount and such that the arrow of
the vector OZ touches the outermost line of B’C’E’. The contradiction follows from
the fact that each country now engage in the production, rather than South engaging
in the whole process.
Point C’ on the intersection of the two isocost lines, represents the cost of producing
the fragment OZ in both North and South, thus point C will be the point where South
is indifferent of producing OZ and must therefore be the origin of the vector C’Y’. The
vector C’Y’, used in production in South, must be in equal length and direction as the
original ZY, as the fragmentation is costless.
We see that the tip of vector C’Y’ will be on the inside of the original isocost line,
meaning that we are able to save costs, even if we use the same amount of
resources as before fragmentation. The reason is that the capital abundant North has
lower prices on capital, and is able to produce the capital intensive good cheaper
than South.
This variant of the Heckscher-Ohlin model shows that fragmentation of a good leads
to cost savings because differences in factor endowments affect the cost of
production. Splitting up production into stages allows a higher degree of
specialization, which may be relocated to countries with access to cheaper factors
used more intensively in production. This allows for cost savings.
16
16
FIGURE 2.2 COST SAVINGS FROM COSTLESS FRAGMENTATION
Source: Deardorff (1998) “Fragmentation across Cones”
2.2.3 The Product Cycle
Ray Vernon (1966) introduced the theory of “product cycle” where he explains the
geographical patterns of where a good is produced. This theory is inspired by
differences in technology and factor endowments. The technology of a product will
first be produced in a developed country (R&D intensive countries such as USA)
where different production techniques are tried out, while the product is still not
standardized. When a simple production method is discovered, there will be a shift in
the comparative advantage, and countries with relatively less R&D activity start to
use the technology. When the product mellows and new generations of the product
have been developed, the less developed countries will undertake production that
has become relatively unskilled labour intensive. The developed countries engage in
new innovating production technologies.
The product cycle theory can be valuable in explaining why more standardized
products are offshored to countries abundant in unskilled labour, while production of
products that requires more skill contents will be offshored to countries with more
advanced technology or educated labour force (or continues to be produced in the
home country).
The variables in the diagram:
K, L – Quantities of factors capital and
labour
X – Quantity of good X
xp - Price of good X
17
17
2.3 COST TO DISINTEGRATE STAGES OF PRODUCTION
2.3.1 Service link costs
The models of comparative advantage outlined above assume away all costs
involved with trade and fragmentation, which is the geographical co-ordination cost.
They can not explain how increasing integration of markets, falling trade costs, better
co-ordination in transportation and technology affect the decision to offshore. These
aspects are the main elements in the model proposed by Jones and Kierzkowski
(2000), which focuses on the evolving costs that arise from linking different stages of
production.
The cost trade-off can be related to Adam Smith who highlighted the advantages of
increasing scale of production when the labour used in production are more
specialized. If a company’s output expands it can choose to separate the production
process into two (or more) production blocks where more specialized production is
undertaken. This increased specialization may lead to lower marginal costs but it also
leads to higher cost due to coordination between the production blocks.
Jones and Kierzkowski (2000) create an analytical framework where production of a
good can be fragmented into production blocks and where these production blocks
need to be co-ordinated to a fixed cost. They argue that geographical separation of
production blocks introduces the necessity of establishing service link in the form of
transportation, communication and other co-ordinating activities. They model these
costs as fixed, since “for example, the communication costs of establishing a
shipment of one thousand units may be the same as for ten thousand units”. (Jones
and Kierzkowski, 2003, pg. 5)
As production processes allow us to spatially separate production nationally or
internationally, a finer and more specialized division of labour can be used in each
stage of production. A finer degree of specialization leads to higher fixed costs but
also lower marginal costs by exploiting comparative advantage
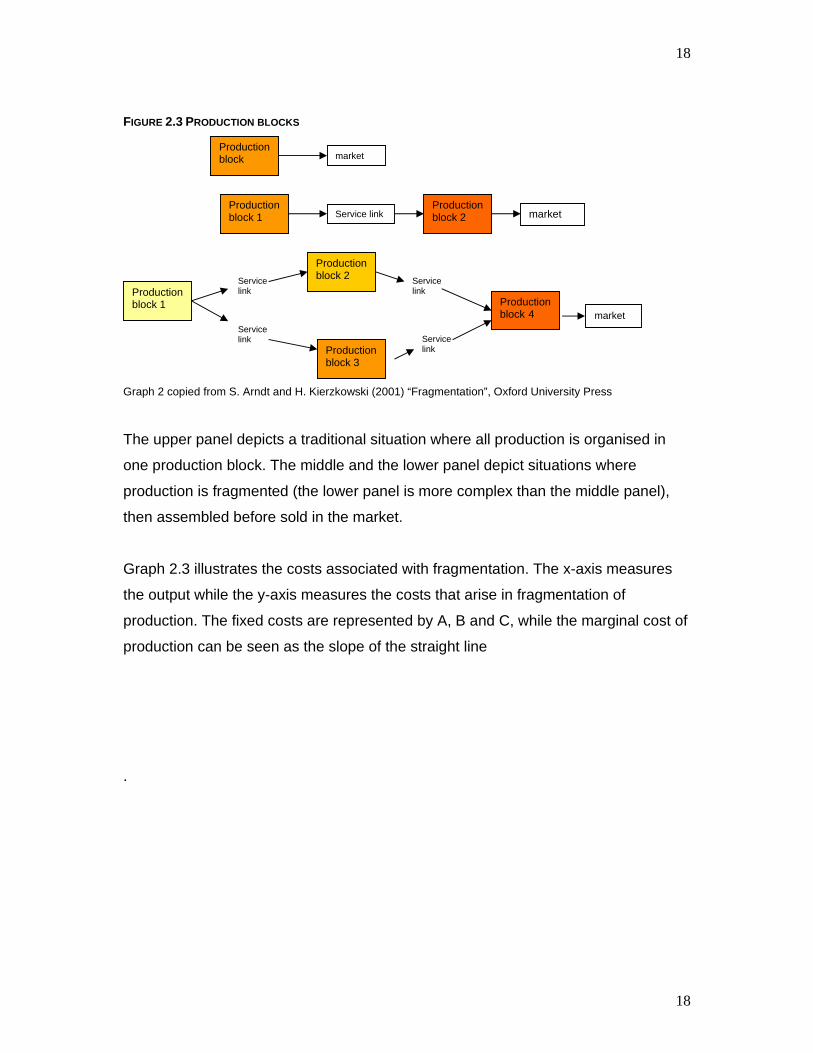
The degree of fragmentation can be simple or complex, as figure 2.3 shows.
18
18
FIGURE 2.3 PRODUCTION BLOCKS
Graph 2 copied from S. Arndt and H. Kierzkowski (2001) “Fragmentation”, Oxford University Press
The upper panel depicts a traditional situation where all production is organised in
one production block. The middle and the lower panel depict situations where
production is fragmented (the lower panel is more complex than the middle panel),
then assembled before sold in the market.
Graph 2.3 illustrates the costs associated with fragmentation. The x-axis measures
the output while the y-axis measures the costs that arise in fragmentation of
production. The fixed costs are represented by A, B and C, while the marginal cost of
production can be seen as the slope of the straight line
.
Production block market
Production block 1 Service link
Production block 2 market
Production block 1
Service link
Production block 2
Service link
Production block 3
Service link
Service link
Production block 4 market
19
19
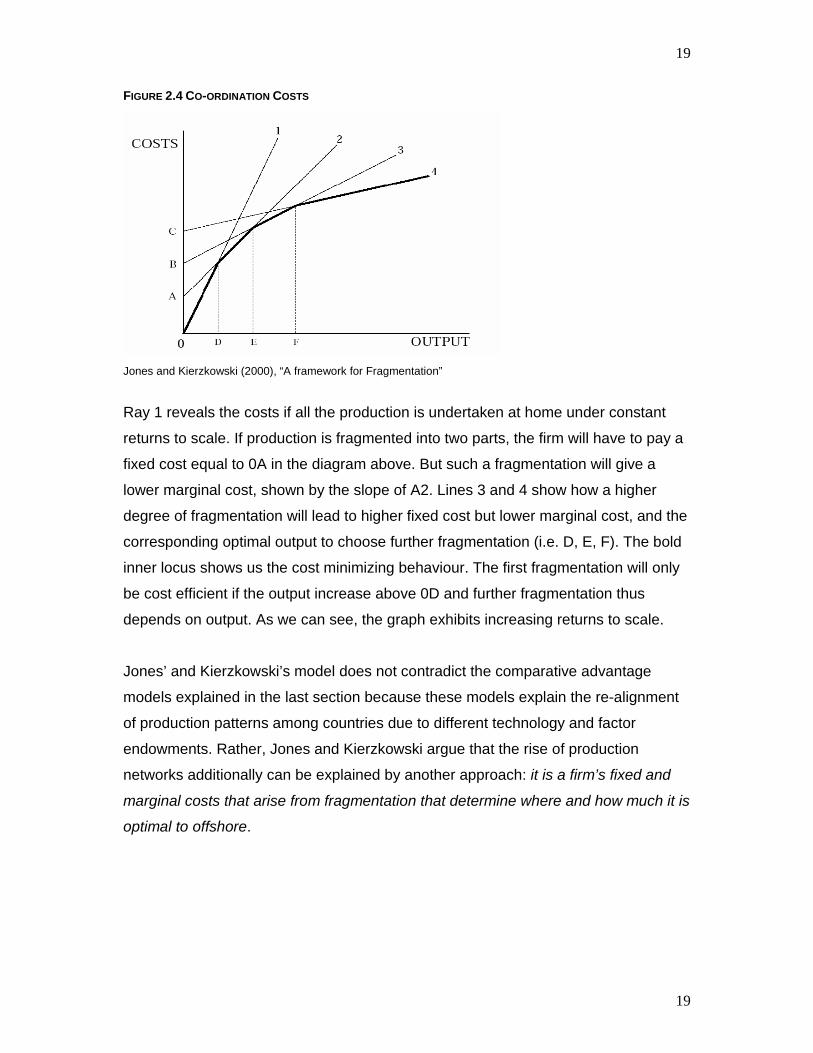
FIGURE 2.4 CO-ORDINATION COSTS
Jones and Kierzkowski (2000), “A framework for Fragmentation”
Ray 1 reveals the costs if all the production is undertaken at home under constant
returns to scale. If production is fragmented into two parts, the firm will have to pay a
fixed cost equal to 0A in the diagram above. But such a fragmentation will give a
lower marginal cost, shown by the slope of A2. Lines 3 and 4 show how a higher
degree of fragmentation will lead to higher fixed cost but lower marginal cost, and the
corresponding optimal output to choose further fragmentation (i.e. D, E, F). The bold
inner locus shows us the cost minimizing behaviour. The first fragmentation will only
be cost efficient if the output increase above 0D and further fragmentation thus
depends on output. As we can see, the graph exhibits increasing returns to scale.
Jones’ and Kierzkowski’s model does not contradict the comparative advantage
models explained in the last section because these models explain the re-alignment
of production patterns among countries due to different technology and factor
endowments. Rather, Jones and Kierzkowski argue that the rise of production
networks additionally can be explained by another approach: it is a firm’s fixed and
marginal costs that arise from fragmentation that determine where and how much it is
optimal to offshore.
20
20
2.3.2 Transaction costs
In this section I will take a look at costs that may arise when a company place
production abroad, more specifically- transaction costs. Transaction costs must be
added to other costs that arise in the planning offshoring, and may be seen as a part
of the fixed costs in the model proposed by Jones and Kierzkowski.
Transaction costs16 are costs that occur in making an economic exchange because
of uncertainty and imperfect information. The theories of transaction costs translate
these market failures into additional costs to a firm as they transacts on the market. A
firm that decide to outsource parts of production uses the market to allocate
resources to given prices. Transaction cost is thus dependent on how the firms
choose to organize its activities, and will therefore determine where the boundary of
the firm is set (i.e. whether it choose to use an external supplier or to use in-house
offshoring). (Hart, 1995)
Williamson (1985) argues that there are three main sources of transaction costs:
Search and information costs, bargaining costs and enforcement costs. Transaction
costs will be affected by five critical dimensions: frequency, uncertainty, asset
specificity, bounded rationality and opportunistic behaviour. Dahlman (1979) argues
that all transaction costs are in fact information costs since there are insufficient data
about the opportunities for trade, lack of information about preferences of economic
agents which lead to bargaining costs, and incomplete contracts that will rise the
enforcement and monitoring cost.
When a firm chooses to outsource production, it needs to settle a contract specifying
terms of trade. A contract between two parties will be incomplete when something is
left out or when something is ambiguous17. This will normally be the case since the
costs associated with writing a complete and legally enforceable contract are high,
and the limited ability to foresee all possible contingencies. This will often lead to
costly re-negotiations and bargaining of contracts in addition to increased
enforcement costs. Additionally, even if individuals and firms intend to act rationally,
16 Ronald Coase (1937) used the term “the cost of using the price mechanism”.
21
21
limitations on our ability to process information and communicate may be
circumscribing this intention. Bounded rationality is based on this, assuming that
decision makers have limits on their rationality and cognitive capabilities. These
constraints are particularly problematic when the environment ex ante and ex post is
uncertain. The uncertainty could be related to demand or costs that might change
during the period of contract or to uncertainty related to performance by the supplier
evaluated ex post. Thus, increased uncertainty around future market, demand, costs,
etc. will lead to a higher frequency of re-negotiations because limited rationality
makes it difficult to foresee all possible outcomes.
There are also costs related to finding information and the right partner to form a
relationship with, such as finding a trustworthy supplier with a lower unit cost, good
quality, timing and delivery. One central size that influences the costs of finding a
suitable partner, as pointed out by McLaren (2003) is the thickness of the market. A
rise in market thickness can be defined as any increase in the effective number of
firms in a given market. That is, the probability of an agent to find a suitable partner,
to a given length of time, with whom it will be possible to realize gains from trade.
Examples of increasing market thickness are inclusion of new economies such as
China, India and Eastern Europe, increased versatility of producers by investing in
flexible production equipment and improvements in search technology such as the
internet. If the market gets thicker, the probability of finding a partner increases and
the hold-up problem, described in the next section, may be less severe as the
likelihood of re-selling components increases. On the other hand it may also be more
difficult to keep a stable long term relationship, using an external supplier, if it is easy
to find a new partner. (MacLaren, 2003)
Nooteboom (1992) looks at the relationship between the size of the firm and
transaction costs, and finds that smaller firms often18 suffer from higher transaction
cost. One important reason is that threshold costs, as also noted by Jones and
Kierzkowski, arise regardless of size of the transaction, thus weight more heavily for
smaller firms with smaller transaction necessities, see figure 2.4. It will only be
17 See Oliver Hart (1995) 18 There may be exceptions, but as noted by Nootheboom, the effect is systematic and pervasive. See Nooteboom (1992), “Firm Size Effects on Transaction Costs” for more details.
22
22
profitable to undertake the fixed costs associated with offshoring if the volume of
production increases above a certain threshold.
Transaction costs are also assumed to increase with bounded rationality and
opportunism. A larger firm, compared to a smaller firm, often has production of scope
and/or scale, and tends to serve several markets. Thus they often have to face a
wider set of relevant contingencies and have to apply a diverse set of available
options for action. This diversification may also spread the risk as long as there is no
positive correlation between the outcomes of activities, or markets are uncorrelated.
Bigger firms, again compared to smaller firms, often have a more specialized
headquarter staff, trained to identify, gather and take in relevant information. Smaller
firms are also assumed to be more vulnerable to opportunistic behaviour since
suppliers may be in for hit-and-run, not afraid of being punished as they would have
been working with a larger firm. Furthermore, smaller firms more easily go broke
which may increase the hold-up problem since discontinuity is more likely.
2.3.3 Some Implications
The decision to outsource production is dependent on the transaction costs; extra
costs incurred by finding a suitable partner, enforcing contracts in poor legal systems,
uncertainty, etc. Poor legal systems and corruption may increase the bargaining and
enforcement costs, and the likelihood of opportunistic behaviour. Additionally, finding
a reliable and suitable partner in a foreign market may be difficult and costly due to
language and cultural differences, lack of information, reputation and the way of
performing businesses. If the market gets thicker, the probability of finding a partner
may increase and the hold-up problem may be less severe. But increased market
thickness may also lead to contracts of shorter character.
The size of a firm may also affect the transaction cost, where a smaller firm may
suffer under higher transaction costs relative to their transaction necessities and also
due to bounded rationality and opportunism.
Transaction cost is an additional cost related to offshoring and must be taken into
account in the decision to offshore.
23
23
2.4 THE CHOICE OF ORGANIZATIONAL FORM
When a firm consider moving production to new markets, does the firm prefer to keep
its activities within the firm or do they choose to rely on the market relations? A firm
faces a cost trade-off between using in-house offshoring (internalization) and relying
on market transactions. Barba Navaretti and Venables (2004) explain the trade-off as
“internalization brings on a direct cost penalty, but avoids the problems of contractual
incompleteness in dealing with outside agents”. (pg 35)
The literature on multinational companies (MNE)19 has, during the last 20 years,
basically developed around Dunning’s OLI framework. Dunning (1993) groups the
motives to undertake forward direct investment20 into three categories, Ownership,
Location and Internalization advantages (OLI).
The intuition of the theory is that if MNE’s were similar to firms that only operate in
the home market, then they would not find it profitable to enter markets abroad, due
to higher costs. Thus, since forward direct investment exists, there must be that some
companies possess some advantages that are easier to exploit through investment
abroad (Gattai, 2005).
Ownership advantages mean that firms possess some specific assets (product,
production process, know-how, etc) which the competitors do not have access to,
which is sufficient to outweigh the disadvantages they face by competing with firms
located in the foreign market. Location advantages can be related to the Heckscher-
Ohlin framework outlined above or due to gains from lowering transportation cost or
avoiding tariffs. Given that the O- and L advantages are realized, a company must
find it profitable to use these advantages it self, rather than selling the assets or the
right to use the assets to other companies. These advantages are called
19 “Multinational enterprises are firms that own a significant share (typically 50% or more) of another company (henceforth subsidiary or affiliate) operating in a foreign country.” (Barba Navaretti and Venables, 2004, pg. 2) 20 “FDI is an investment in a foreign company where the foreign investor owns at least 10% of the ordinary shares, undertaken with the objective of establishing a ‘lasting interest’ in the country, a long-term relationship and significant influence on the management of the firm” (Barba Navaretti and Venables, 2004, pg. 2)
24
24
internalization advantages. That is, the I-advantage arises if allowing another
company to use the asset would increase the probability that the value of the asset to
a MNE would diminish under the other company’s control. It is assumed that the
more the ownership- specific advantage possessed by an enterprise, the greater is
the incentive to internalize them. (Dunning, 1993).
Following Dunning (1993), the make-or-buy decision of a multinational enterprise is
usually explained in terms of costs and benefits of using the market. The penalty of
internalization is that the firm embark on doing the activity it self, not finding the
cheapest local supplier. The local supplier may have advantages in terms of
knowledge of the local conditions, such as labour skills, local demand or
administrative procedures, enabling the local supplier to have lower production costs.
The local firm may also have specialized competencies in this specific kind of
production and/or it may have plant-level economies of scale. The costs by choosing
an external supplier (i.e. using the market), as already explained, is due to the
transaction costs, imperfect information and contractual incompleteness. Furthermore
relying on the market may be highly risky due to technology transfers, moral hazard
and defection by the local firm, agent opportunism and reputation concerns21. (Barba
Navaretti and Venables, 2004)
Emerging from the friction in the market is “the hold up problem” which relates to the
choice of organizational form. Two parties that wish to enter a production
relationship, using the market allocations, will in many cases need to undertake
investments to be able to produce and assemble goods (e.g. in machinery or re-
adjustment in existing machinery, training of employees, etc.). That is, the
relationship needs investments in specific assets to gain the most of the relationship.
Relation-specific investments are typical when an input supplier has to invest in
equipment whose characteristics are specific to a particular buyer, but of little use to
other buyers in the market. Such investments determine the degree of specialization
21 See for example Gatai (2005). These issues will not be treated here but are all relevant for the decision of organizational form. For an introduction to agency costs see Barba Navaretti and Venables (2004) or for an extensive analysis see Laffont and Martimort (2002). Dissipation of intangible assets, is also relevant, but is more likely to occur if the firm choose to duplicate its activities, and is out of the scope of this thesis. For more information see Barba Navaretti and Venables (2004) pg 37-39.
25
25
of the co-operation and may increase the surplus for both firms as they improve
quality and/or increase efficiency. But in a world of incomplete contracts, both
companies know that the initial contract will be re-negotiated due to changes not
specified in the initial contract, such as changed prices on raw material, required
changes in quantity or quality, etc. Thus, the price, quantity or quality negotiated in
the initial contract may be subject to change. It is the residual control rights over the
assets that cause the problem. If the two firms are not integrated, the single firms do
not have any right to decide any modifications in the production process of the other
firm. Thus, if the initial contract is renegotiated and the supplier does not deliver the
quantity intended in initial contract, the buyer cannot interfere with the supplier assets
due to lack of residual control rights.
If the surplus of selling the final good goes to the downstream firm, and the upstream
firm only receives a per-unit price (i.e. arm-length contract) negotiated in the initial
contract, the upstream firm may find it risky to tailor their equipment to the needs of
the downstream supplier. The fear of undertaking a relation specific investment
arises because the upstream firm worries that the price in the new contract will not
cover their investment cost. If the tailored product cannot be re-sold on the market,
the upstream firm looses bargaining power in the re-contractual stage as the
downstream firm knows that the upstream firm rather will sell the goods to a lower
price than not selling them at all. This dilemma is called the hold-up problem because
each party is anxious that the other party will “hold it up” at the re-negotiation stage.
The parties would rather make investments that are non-specific because these will
increase a firm’s possibility to re-sell its input if the price given by the downstream
firm is too low after re-contracting (and its bargaining power will thus be higher)22.
Such behaviour is related to opportunistic behaviour, in that decision makers
unscrupulously seek to serve their own interest by taking advantage of their superior
knowledge, failing to disclose important information to the other party which may
affect the price of the widget. Thus, it is difficult to a priory evaluate whether the other
party is trustworthy or not. (Hart, 1995)
22 Or a downstream firm will not adjust its assembly machinery to accept a specific input. The firm will rather make investments that fit standardized intermediate goods because it is frightened that the downstream firm will demand a higher price on the intermediate good when it knows that the upstream firm is dependent on their good.
26
26
Thus, one problem of using external (market) transactions is the hold-up problem
associated with incomplete contracts. This problem leads to under-investment of
specific assets. The benefit of integration is that the firms’ incentive to make relation-
specific investments increase, and “integration is assumed to be the only way to deal
with uncertain contingencies affecting the technical relations between the MNE and
upstream producers that cannot be dealt with using arm-length contracts” (Barba
Navaretti and Venables, 2004, pg 103). This will happen since the acquiring firm gets
a higher fraction of the ex post surplus created by these specific investments. But
integration has its costs as the downstream firm looses the comparative advantage of
using a local supplier, thus may imply a higher average cost of production.
Furthermore, internalizing activities may also reduce the flexibility of changing
suppliers when the demand, cost or technology alters. (Barba Navaretti and
Venables, 2004)
We may expect that the hold-up problem is more rigorous in some industries.
Especially if the relationship requires specialized inputs which are difficult to re-sell
on the market or if the competitive environment or costs are uncertain, making
renegotiations likely. High asset specificity may increase the likelihood of the firms
integrating.
Empirical literature confirm that outsourcing is more efficient when the asymmetries
between them are not to large. As noted in Hart (1995), there has been a trend that
larger factories have been replaced by factories with smaller scale and more flexible
technologies. More flexible factories allow for less complementary assets since it
more easily can be modified to be suitable for a new trading partner, and reduce the
hold-up problem.
27
27
2.5 CONCLUSION
The decision to split the production process by function, geographically and
organizationally, has its costs and benefits. The theories of comparative advantage
explain how differences in factor endowments and technology give rise to gains from
fragmenting production. Access to cheaper labour will according to these theories
imply that production of more labour intensive, or standardized, components should
be placed in countries abundant in unskilled labour. The production cycle theory
suggests that the geographical patterns of where a product is produced will be
determined by differences in technology, but is also related to differences in factor
endowments.
The costs associated with splitting the production is related to geographical costs of
co-ordination, such as trade costs, co-ordination costs as well as transaction costs.
Furthermore a firm face a trade-off in the choice of organizationally splitting
production related to transaction costs and imperfect information.
28
28
3.0 DATA AND SOURCES OF ERROR
The availability of public data and research on the determinants of offshoring of
Norwegian industry is relatively limited23. The same is true for research on firm- and
industry level differences related to offshoring. The limited amount of public data
places restrictions on the possible exploration of data and extent of empirical
analysis.
Chapter 3.0 will explain the sources of data used (section 3.2) and the possible
causes of errors (Section 3.3).
3.1 SOURCES OF DATA
The main source of data used in this thesis is from a cross-sectional survey
conducted in 2001 by an organization representing the technology industry
(Teknologibedriftenes Landsforening, TBL) in Norway. The survey classifies the
technology industry into ten categories; Metal goods, textile, machinery, furniture,
ship equipment, ship building, electronics, information technology, foundry and
offshore. Since I have not had access to TBL’s segmented data24, I have followed the
PRODCOM coding25 which was accessible with the financial figures from the Dun
and Bradstreet database (see next paragraph). The PRODCOM coding is a common
classification system developed by the European Union for segregation of industrial
sectors. Using this classification system, I end up with twelve sectors: Textile and
textile products, furniture, metal and metal goods, machinery, electronics, offshore,
transportation, computer/IT, plastic and rubber products, telecommunication, glass
and ceramics and production of chemicals. There are less than nine responses from
five categories, and combined they represent only 6% of the total sample. Due to the
23 I know that NHO works to establish a panel data to see trends and developments in offshoring, but these data where not public as of October 2006. 24 The ship equipment industry may include firms from several sectors, such as electronics, computers, textile, machinery and metal. 25 Can be downloaded on the SSB’s webpage: http://www.ssb.no/emner/10/07/prodcom/
29
29
relatively few respondents from these categories, I combined them into one single
category named “Other”.
TBL asked all its 1,20026 members about their degree and type of offshoring,
experiences and future plans27. Examples of questions were in which countries they
have production and whether the relationship was through an arm-length contract,
production co-operation or own establishment. The respondents were also asked to
give information regarding turnover and share of turnover created abroad and
experiences they have had with quality, price and delivery. There were a total of 449
firms that completed the survey successfully.
The data from the survey is linked to accounting variables from Dun and Bradstreet’s
(D&B) database matching organisational numbers searched for in “Register authority
and source of information”28. The dataset from D&B is complementary, giving us
access to nearly 150 financial and descriptive variables for each year between 1992
and 2004. The survey was conducted in 2001. Assuming the respondents were
referring to past experiences (2000) and not their current plans (2001), I have chosen
to pair the TBL data with financial numbers from 2000.
3.2 RESPONSE RATE, NON-RESPONSE ERROR AND OTHER SOURCES OF ERROR
The goal of the survey was to investigate the extent of offshoring among the
members of TBL. In doing so, they asked all of their members to complete a
questionnaire. 449 of 1,200 firms successfully answered the survey, which account
for a response rate equal to 37.4%. It is generally difficult to say that a specific
response rate is good or bad. It is more important to ensure that the sample
answering the questionnaire is representative and reducing bias29 by carefully
evaluating the design.
26 TBL had approximately 1200 members 1st of January 2001. Source: Knut R. Skotner, Norsk Industri, Leader Industry and Politics division. 27 The questionnaire is added in the appendix. 28 Brønnøysund registeret 29 A sampling bias is the measure of the location of the sampling distribution relative to the true value.
30
30
I assume the respondents in TBL’s survey is representative, since they asked all their
members, hence no sampling error in our sample. However, there may be possible
non-response errors30 and measurement errors31 which occur due to flaws in the
design of the survey.
Non-response errors occur if the respondents do not provide answers for different
reasons such as refusal, lack of time, loss of questionnaire, inability to provide
answers, etc. If the difference between the statistics for responding units and sample
units is high, the effect of non-response on the survey estimate can be quite
significant. No matter how carefully a sample is selected, some members of the
sample do not respond to the survey questions. When the firms, that answer the
questionnaire, differ from the firms that do not answer the questionnaire, non-
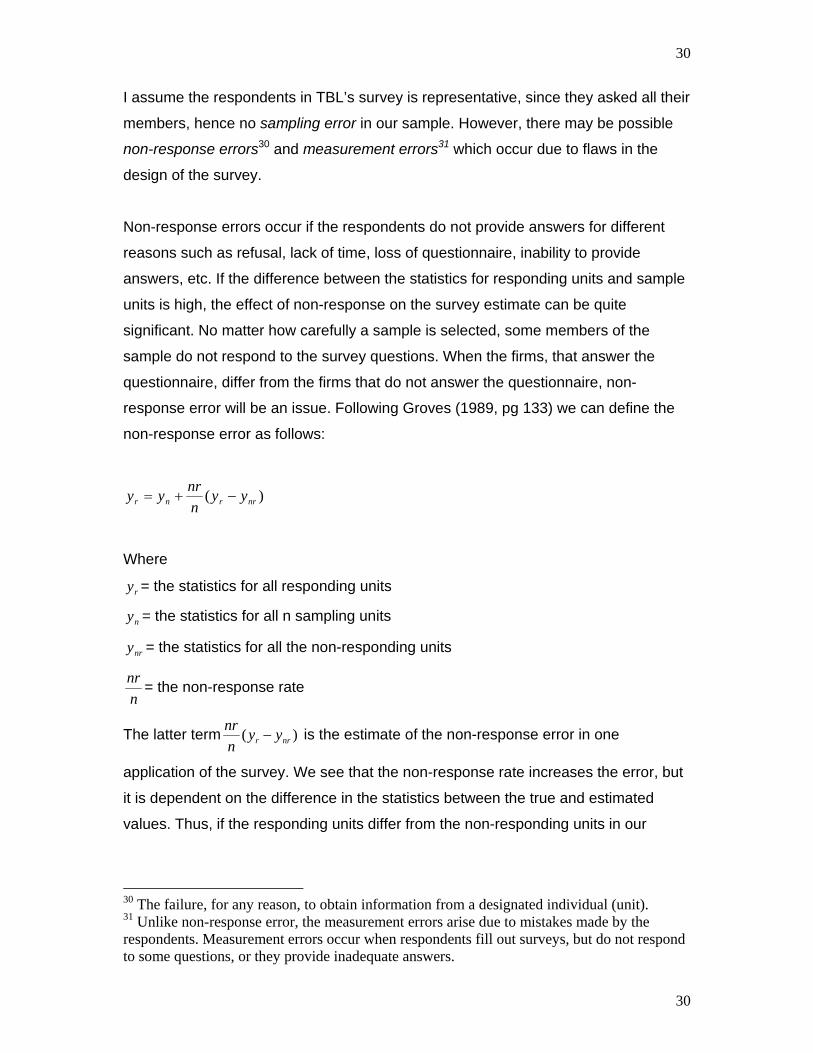
response error will be an issue. Following Groves (1989, pg 133) we can define the
non-response error as follows:
)( nrrnr yynnryy −+=
Where
ry = the statistics for all responding units
ny = the statistics for all n sampling units
nry = the statistics for all the non-responding units
nnr = the non-response rate
The latter term )( nrr yynnr
− is the estimate of the non-response error in one
application of the survey. We see that the non-response rate increases the error, but
it is dependent on the difference in the statistics between the true and estimated
values. Thus, if the responding units differ from the non-responding units in our
30 The failure, for any reason, to obtain information from a designated individual (unit). 31 Unlike non-response error, the measurement errors arise due to mistakes made by the respondents. Measurement errors occur when respondents fill out surveys, but do not respond to some questions, or they provide inadequate answers.
31
31
sample and the response rate is low, this may indicate that the statistics from our
sample will differ significantly from the true value of our population.
Firms that answer the questionnaire may provide erroneous information, increasing
the measurement errors, due to recall errors, inaccurate answers or of other
reasons32. The design of the survey is important in minimizing the probability for
these errors.
Potential sources of bias using the numbers collected from TBL are, in my opinion,
particularly connected to which firms that are inclined to answer the survey and
potentially increase the non-response error explained above. To answer the
questionnaire the survey must reach the person in the company with the relevant
knowledge and authority. In a bigger company, a number of people may have to
contribute to answer all the questions, increasing the likelihood that some people do
not have the time or the correct information to answer the survey, or that the right
person is not reached. Finding the relevant information in a smaller company may be
easier since the company is more surveyable. Another potential error is that
companies with offshoring might be more inclined to answer the questionnaire as
they deem the questions to be more relevant for them than companies without
offshoring. As noted by Heberlein and Baumgartner (1978), questionnaires are more
likely to be returned if the respondents consider them relevant.
There might also be potential sources of measurement errors due to the design of the
questionnaire. In the questionnaire from TBL, question 3 and 9 ask companies to
respond turnover moved to foreign production. However, most companies use
turnover as a measurement for sales rather than production and might have been
confused by the question. Furthermore, it may be easier to mark the completed
alternatives in question 6 than to fill in “other reasons”, possible leading to a lower
response rate of other important reasons for offshoring.
Other sources of errors may follow from loss of data. Since the data from the survey
was collected in 2001, there have been changes in ownership, mergers and
32
32
acquisitions, companies might have been liquidated or changed names. Thus, by
combining the datasets some companies have been excluded from the sample, as
matching organization numbers could not be found in all cases. Some companies
were also excluded due to errors in their financial and descriptive numbers from the
D&B database, such as reporting a negative number of employees. Not all
companies had a complete set of financial figures and descriptive set of data from the
D&B database. The loss of data may be a source of error, since the apostasy may be
unevenly distributed.
The offshoring percentage remains relatively stable combining the survey data from
TBL with the Dun and Bradstreet’s database, as can be seen from table 4.1. While
this is true, it is important that we interpret the numbers with care.
32 There could be that firms wish to overstate/understate information to make impact on politicians/ researchers
33
33
4.0
DESCRIPTIVE ANALYSIS AND DISCUSSION
4.1 INTRODUCTION
We can gain insight to the determinants of offshoring by studying the gains and costs
of relocating stages of production, and in section 2.0 I reviewed some relevant
theories that may explain the trade-off a firm is facing in the decision to offshore
production. Differences in factor costs enable firms to save costs from placing stages
of production across borders, but fragmentation has its costs due to increased co-
ordination, transaction costs and information costs. In addition, organizational form is
chosen based on the cost trade-trade off between in-house offshoring and arm-
length contracts.
In this chapter I will analyse whether these cost considerations are important for the
Norwegian industry.
In the next section I will take a look at some characteristics of the sample in the TBL
survey, such as the distribution of companies within industrial sectors, the extent of
offshoring and geographical destinations of offshoring. In section 4.3 I will examine
the potential gains from disintegrating stages of production, more specifically the
gains from differences in factor costs and potential gains from access to markets.
Section 4.4 will describe the costs of disintegrating stages of production, where I will
treat transaction costs. Section 4.5 will describe the choice of organizational form.
The chapter will end with a brief summary.
4.2 SAMPLE CHARACTERISTICS
The respondents of the survey represent companies with a turnover equivalent to
approximately 6 billion Norwegian kroner and 42,500 employees. The technology
industry represents around 40% of the value added and 40% of the employees in
Norway, and is Norway’s biggest industrial branch. The markets are characterized by
34
34
fierce competition, forcing companies to specialize using their competitive
advantages. This specialization has given some companies relatively high market
shares in some niches. Norway, being a small country with unilateral resource
foundations, is highly dependent on international trade, in terms of access to
necessary goods and foreign capital to take advantage of the natural resources33, but
also because 4.5 million inhabitants is a small home market for Norwegian
companies. This makes it difficult to mark-up international prices when the domestic
cost level increases, and have forced companies to constantly progress in
productivity. (TBL, 2001)
Table 4.1 shows the distribution of the firms in our sample over industrial sectors. I
have included the full and reduced sample34. As already noted the percentages
remain relatively stable even if firms are lost from our sample in combining the
dataset from TBL and D&B.
We see that the industrial sector metal and metal goods represents 25% of our full
sample, followed by machinery, textile and electronics with 16%, 13% and 12%
respectively. The industrial categories “other” and transportation are the smallest in
our sample, each constituting 6% of the full sample.
Looking at the extent of offshoring, 39% of the firms in our full sample, and 41% of
the reduced sample reports offshoring. These percentages are high and as explained
in section 3.3, it may be that firms with offshoring relates more to the topic and are
more inclined to respond than companies that do not relate to offshoring. While this is
true, it is no reason to believe that the extent of offshoring is low, or that it has
reduced since year 2000/2001. On the contrary, an interest rate of 4% above that of
European Union and a strong Norwegian currency in year 2002 and 200335 reduced
the competitive power of Norwegian industry against our main trade partners36.
33 Kvinge (2003) 34 As I combined the two datasets, some data were lost. This was explained in section 3.1. 35 It was down to 7.20-7.25 against Euro. 36 See Økonomiske analyser 1/2006, www.ssb.no/emner/08/05/10/oa/200601/prod-marked.pdf
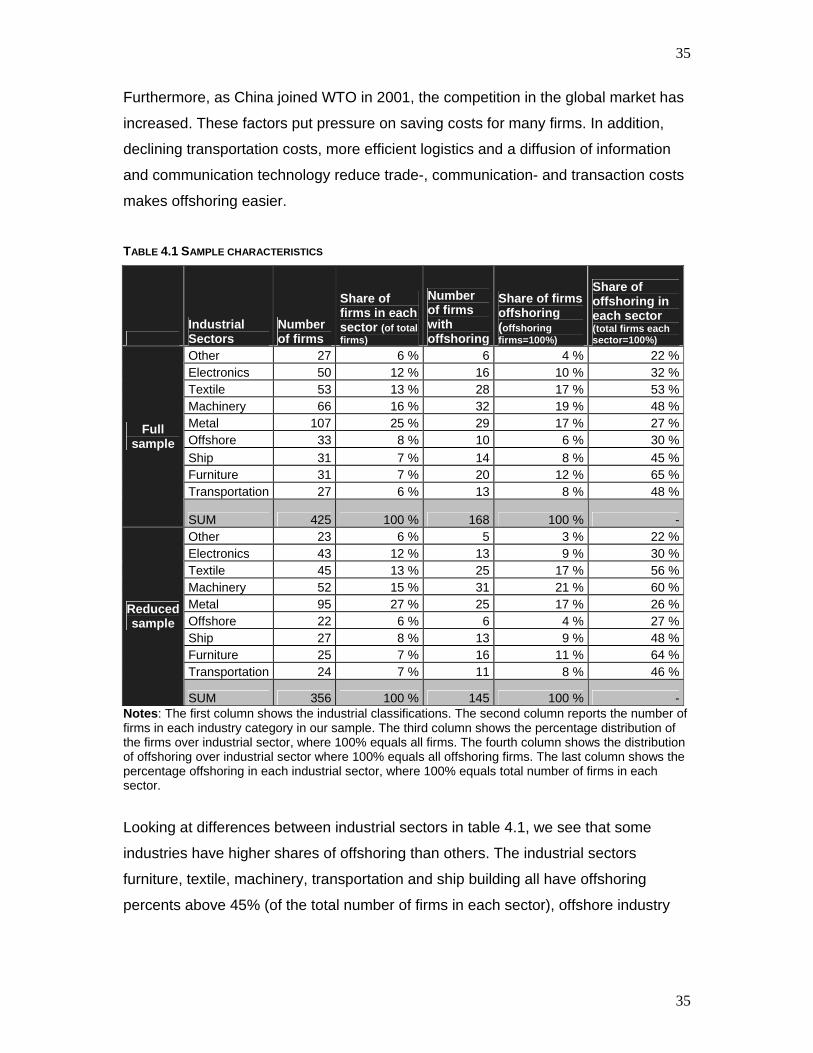
35
35
Furthermore, as China joined WTO in 2001, the competition in the global market has
increased. These factors put pressure on saving costs for many firms. In addition,
declining transportation costs, more efficient logistics and a diffusion of information
and communication technology reduce trade-, communication- and transaction costs
makes offshoring easier.
TABLE 4.1 SAMPLE CHARACTERISTICS
Industrial Sectors
Number of firms
Share of firms in each sector (of total firms)
Number of firms with offshoring
Share of firms offshoring (offshoring firms=100%)
Share of offshoring in each sector (total firms each sector=100%)
Other 27 6 % 6 4 % 22 %Electronics 50 12 % 16 10 % 32 %Textile 53 13 % 28 17 % 53 %Machinery 66 16 % 32 19 % 48 %Metal 107 25 % 29 17 % 27 %Offshore 33 8 % 10 6 % 30 %Ship 31 7 % 14 8 % 45 %Furniture 31 7 % 20 12 % 65 %Transportation 27 6 % 13 8 % 48 %
Full sample
SUM 425 100 % 168 100 % -Other 23 6 % 5 3 % 22 %Electronics 43 12 % 13 9 % 30 %Textile 45 13 % 25 17 % 56 %Machinery 52 15 % 31 21 % 60 %Metal 95 27 % 25 17 % 26 %Offshore 22 6 % 6 4 % 27 %Ship 27 8 % 13 9 % 48 %Furniture 25 7 % 16 11 % 64 %Transportation 24 7 % 11 8 % 46 %
Reduced sample
SUM 356 100 % 145 100 % -Notes: The first column shows the industrial classifications. The second column reports the number of firms in each industry category in our sample. The third column shows the percentage distribution of the firms over industrial sector, where 100% equals all firms. The fourth column shows the distribution of offshoring over industrial sector where 100% equals all offshoring firms. The last column shows the percentage offshoring in each industrial sector, where 100% equals total number of firms in each sector.
Looking at differences between industrial sectors in table 4.1, we see that some
industries have higher shares of offshoring than others. The industrial sectors
furniture, textile, machinery, transportation and ship building all have offshoring
percents above 45% (of the total number of firms in each sector), offshore industry
36
36
has 30% offshoring, while “other” and metal have lower shares of offshoring, 22%
and 27 % respectively.
The explanation for differences in degree of offshoring can be many. One
explanation may that the composition of factors used in production between the
sectors and stages of production may differ. Unfortunately, I have no numbers that
take account for differences in factor intensity between the stages of production. Still,
differences in average labour intensity between the industries in Norway may give us
an indication of which industries that may benefit more from fragmenting production.
Figure 4.1 shows the differences in average labour intensity between industrial
sectors in Norway in 2000 and 2004, calculated as labour compensations share of
value added37. We see that the labour intensity in all sectors has declined from year
2000 to 2004, probably following from increased productivity (and maybe also due to
offshoring of labour intensive stages of production). It is important to note that this
figure does not separate between unskilled labour intensive and skilled labour
intensive.
The graph may support the extent of offshoring over industrial sectors above. Metal
and metal goods, with a relatively low share of offshoring, are relatively less labour
intensive than the “high offshoring industries” textile, machinery and transportation.
Production of metal and metal goods is relatively energy intensive and Norway being
a major producer of hydro electricity creates ideal conditions for these industries38.
Another important factor that might explain low levels of offshoring in the metal
industry is related to the cost of verticality in trade of metal and metal goods.
Disintegration of stages of production may require that metal must be reheated, thus
extra costs of disintegration occurs, making offshoring less likely39.
37 See SSB, 2000, “Manufacturing Statistics” 38 The process industry in Norway has access to cheaper energy due to contracts formed with the government. 39 Barba Navaretti and Venables (2004)
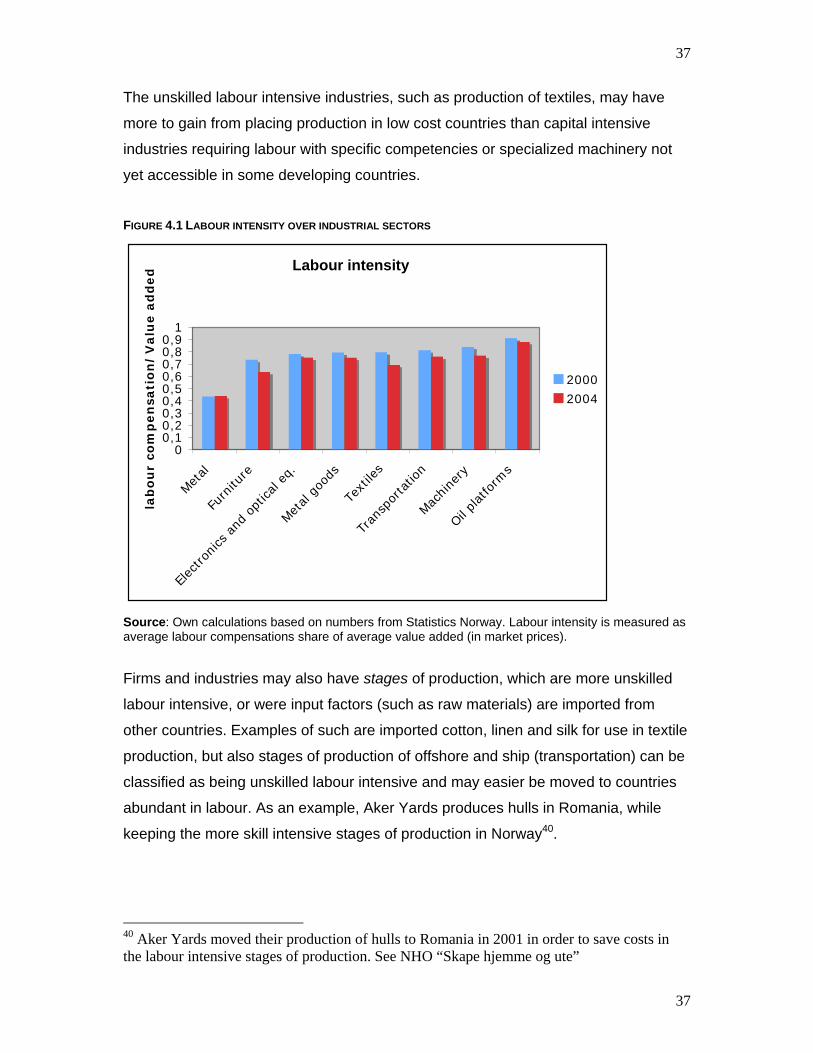
37
37
The unskilled labour intensive industries, such as production of textiles, may have
more to gain from placing production in low cost countries than capital intensive
industries requiring labour with specific competencies or specialized machinery not
yet accessible in some developing countries.
FIGURE 4.1 LABOUR INTENSITY OVER INDUSTRIAL SECTORS
Wage Share
00,10,20,30,40,50,60,70,80,9
1
Metal
Furn
iture
Elec
tronics
and
opt
ical e
q.
Metal goo
ds
Textile
s
Tran
spor
tatio
n
Machine
ry
Oil plat
form
s
lab
ou
r co
mp
en
sati
on
/V
alu
e a
dd
ed
2000
2004
Source: Own calculations based on numbers from Statistics Norway. Labour intensity is measured as average labour compensations share of average value added (in market prices).
Firms and industries may also have stages of production, which are more unskilled
labour intensive, or were input factors (such as raw materials) are imported from
other countries. Examples of such are imported cotton, linen and silk for use in textile
production, but also stages of production of offshore and ship (transportation) can be
classified as being unskilled labour intensive and may easier be moved to countries
abundant in labour. As an example, Aker Yards produces hulls in Romania, while
keeping the more skill intensive stages of production in Norway40.
40 Aker Yards moved their production of hulls to Romania in 2001 in order to save costs in the labour intensive stages of production. See NHO “Skape hjemme og ute”
Labour intensity
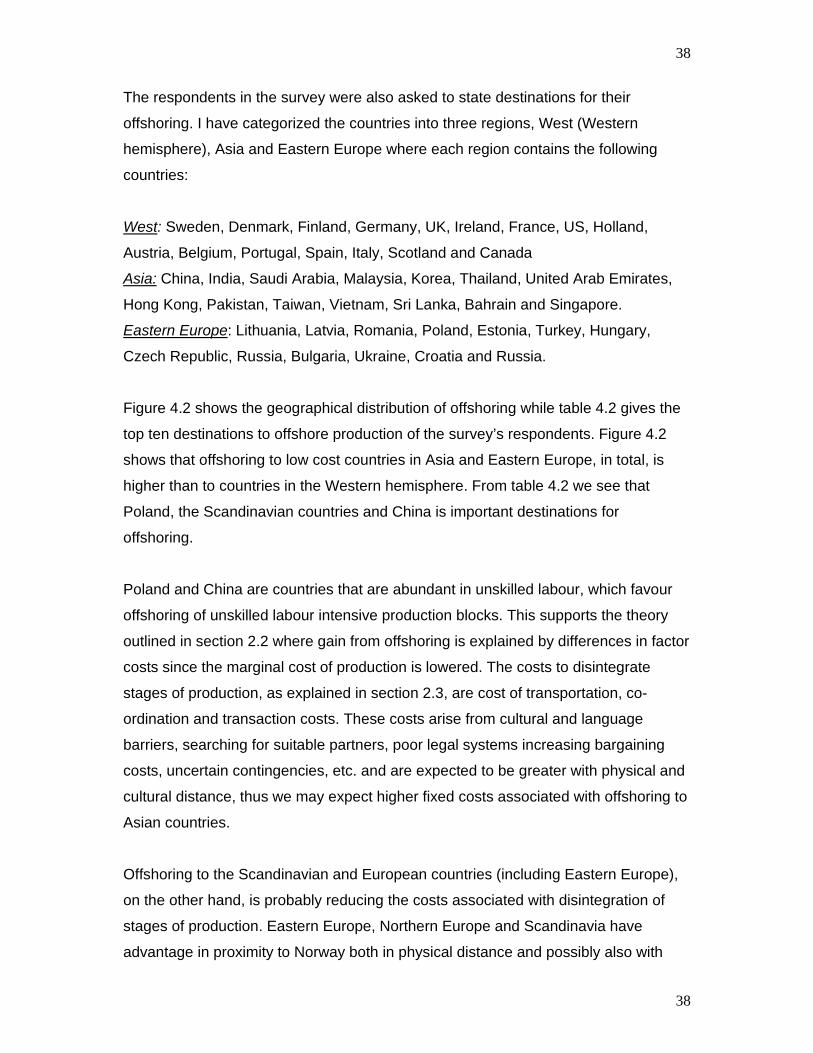
38
38
The respondents in the survey were also asked to state destinations for their
offshoring. I have categorized the countries into three regions, West (Western
hemisphere), Asia and Eastern Europe where each region contains the following
countries:
West: Sweden, Denmark, Finland, Germany, UK, Ireland, France, US, Holland,
Austria, Belgium, Portugal, Spain, Italy, Scotland and Canada
Asia: China, India, Saudi Arabia, Malaysia, Korea, Thailand, United Arab Emirates,
Hong Kong, Pakistan, Taiwan, Vietnam, Sri Lanka, Bahrain and Singapore.
Eastern Europe: Lithuania, Latvia, Romania, Poland, Estonia, Turkey, Hungary,
Czech Republic, Russia, Bulgaria, Ukraine, Croatia and Russia.
Figure 4.2 shows the geographical distribution of offshoring while table 4.2 gives the
top ten destinations to offshore production of the survey’s respondents. Figure 4.2
shows that offshoring to low cost countries in Asia and Eastern Europe, in total, is
higher than to countries in the Western hemisphere. From table 4.2 we see that
Poland, the Scandinavian countries and China is important destinations for
offshoring.
Poland and China are countries that are abundant in unskilled labour, which favour
offshoring of unskilled labour intensive production blocks. This supports the theory
outlined in section 2.2 where gain from offshoring is explained by differences in factor
costs since the marginal cost of production is lowered. The costs to disintegrate
stages of production, as explained in section 2.3, are cost of transportation, co-
ordination and transaction costs. These costs arise from cultural and language
barriers, searching for suitable partners, poor legal systems increasing bargaining
costs, uncertain contingencies, etc. and are expected to be greater with physical and
cultural distance, thus we may expect higher fixed costs associated with offshoring to
Asian countries.
Offshoring to the Scandinavian and European countries (including Eastern Europe),
on the other hand, is probably reducing the costs associated with disintegration of
stages of production. Eastern Europe, Northern Europe and Scandinavia have
advantage in proximity to Norway both in physical distance and possibly also with
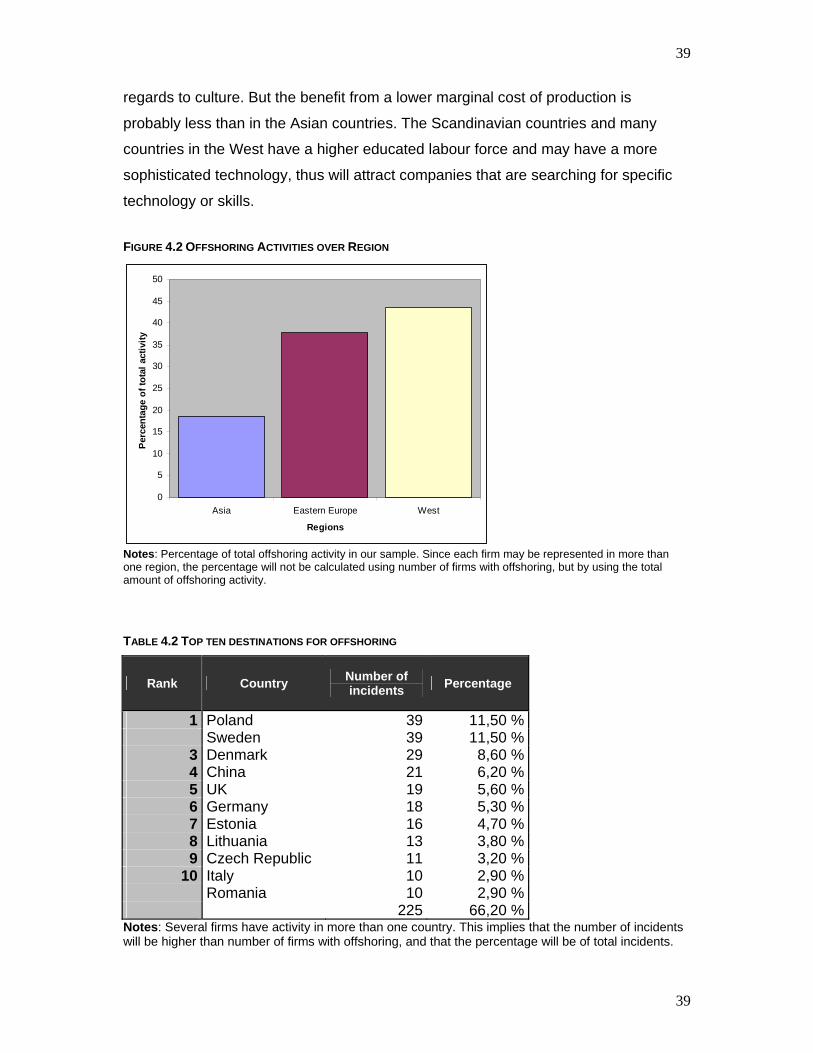
39
39
regards to culture. But the benefit from a lower marginal cost of production is
probably less than in the Asian countries. The Scandinavian countries and many
countries in the West have a higher educated labour force and may have a more
sophisticated technology, thus will attract companies that are searching for specific
technology or skills. FIGURE 4.2 OFFSHORING ACTIVITIES OVER REGION
0
5
10
15
20
25
30
35
40
45
50
Asia Eastern Europe West
Regions
Perc
enta
ge o
f tot
al a
ctiv
ity
Notes: Percentage of total offshoring activity in our sample. Since each firm may be represented in more than one region, the percentage will not be calculated using number of firms with offshoring, but by using the total amount of offshoring activity. TABLE 4.2 TOP TEN DESTINATIONS FOR OFFSHORING
Rank Country Number of incidents Percentage
1 Poland 39 11,50 % Sweden 39 11,50 %
3 Denmark 29 8,60 %4 China 21 6,20 %5 UK 19 5,60 %6 Germany 18 5,30 %7 Estonia 16 4,70 %8 Lithuania 13 3,80 %9 Czech Republic 11 3,20 %
10 Italy 10 2,90 % Romania 10 2,90 % 225 66,20 %Notes: Several firms have activity in more than one country. This implies that the number of incidents will be higher than number of firms with offshoring, and that the percentage will be of total incidents.
40
40
Figure 4.3 shows the distribution of industrial sectors over regions.
We see that companies within the textile and furniture industries mainly offshore to
low-cost countries. While production of textile is more labour intensive than
production of furniture, they have in common that they face fierce competition from
countries that are abundant in labour, or from other companies that offshore
production to these countries. An example of the latter is the Swedish furniture
producer IKEA which use external subcontractors in more than 70 countries,
generally with a lower price of unskilled labour, close proximity to raw materials and
reliable access to distribution channels41, enabling them to charge lower prices on
their goods. The Norwegian furniture and textile companies may be able to
differentiate themselves through specialization and lower the price by producing in
low cost countries. And indeed, both the furniture and textile industry have a relatively
high share of offshoring to Asia.
Companies within the industries transportation, metal and metal goods, and
machinery have high shares of offshoring to western countries. Western countries
are relatively well endowed with capital and skilled labour, in addition to a more
sophisticated technology. Furthermore, companies within the industries metal and
metal goods, transportation and machinery may have a desire to be close to their
customers, as they typically deliver semi-finished products. Also, there may be a
higher share of research and development activity in some countries, depending on
the type of good. For companies that compete in segments with rapid technological
changes, it may be beneficial to be located close to these centres in order to quickly
adapt to new developments and to get access to specialized machinery and services.
41 Barba Navaretti and Venables, 2004
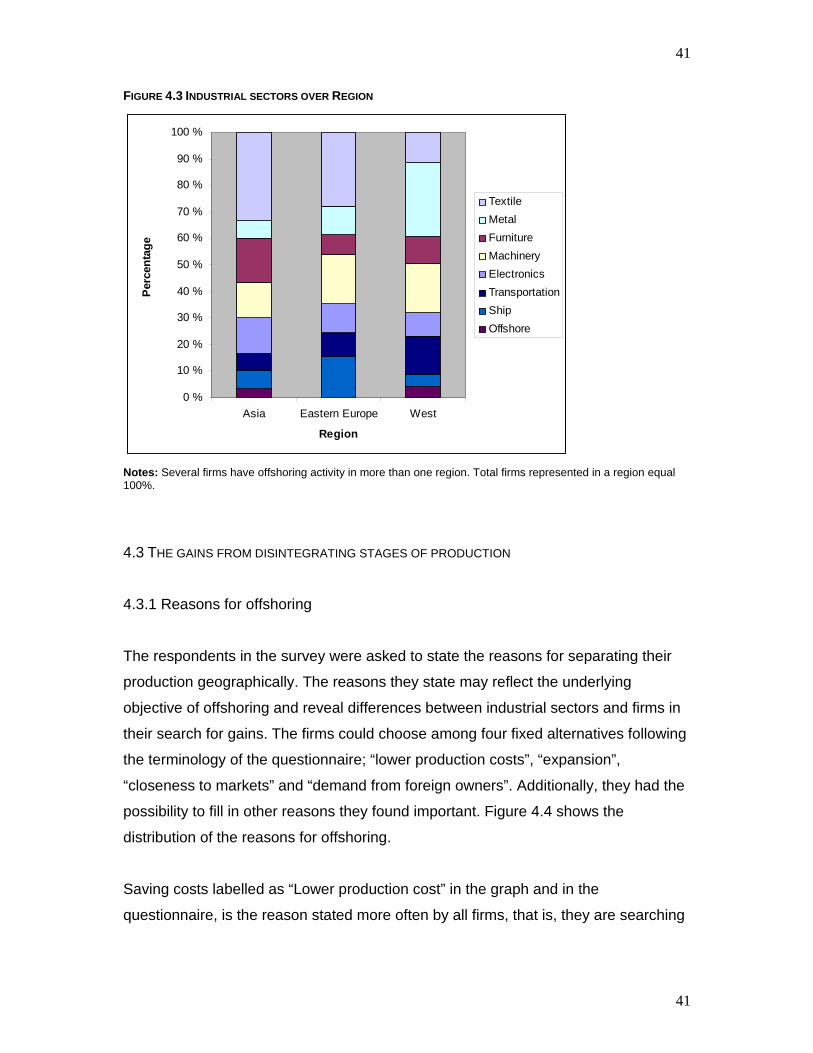
41
41
FIGURE 4.3 INDUSTRIAL SECTORS OVER REGION
0 %
10 %
20 %
30 %
40 %
50 %
60 %
70 %
80 %
90 %
100 %
Asia Eastern Europe West
Region
Perc
enta
ge
TextileMetalFurnitureMachineryElectronicsTransportationShipOffshore
Notes: Several firms have offshoring activity in more than one region. Total firms represented in a region equal 100%.
4.3 THE GAINS FROM DISINTEGRATING STAGES OF PRODUCTION
4.3.1 Reasons for offshoring
The respondents in the survey were asked to state the reasons for separating their
production geographically. The reasons they state may reflect the underlying
objective of offshoring and reveal differences between industrial sectors and firms in
their search for gains. The firms could choose among four fixed alternatives following
the terminology of the questionnaire; “lower production costs”, “expansion”,
“closeness to markets” and “demand from foreign owners”. Additionally, they had the
possibility to fill in other reasons they found important. Figure 4.4 shows the
distribution of the reasons for offshoring.
Saving costs labelled as “Lower production cost” in the graph and in the
questionnaire, is the reason stated more often by all firms, that is, they are searching
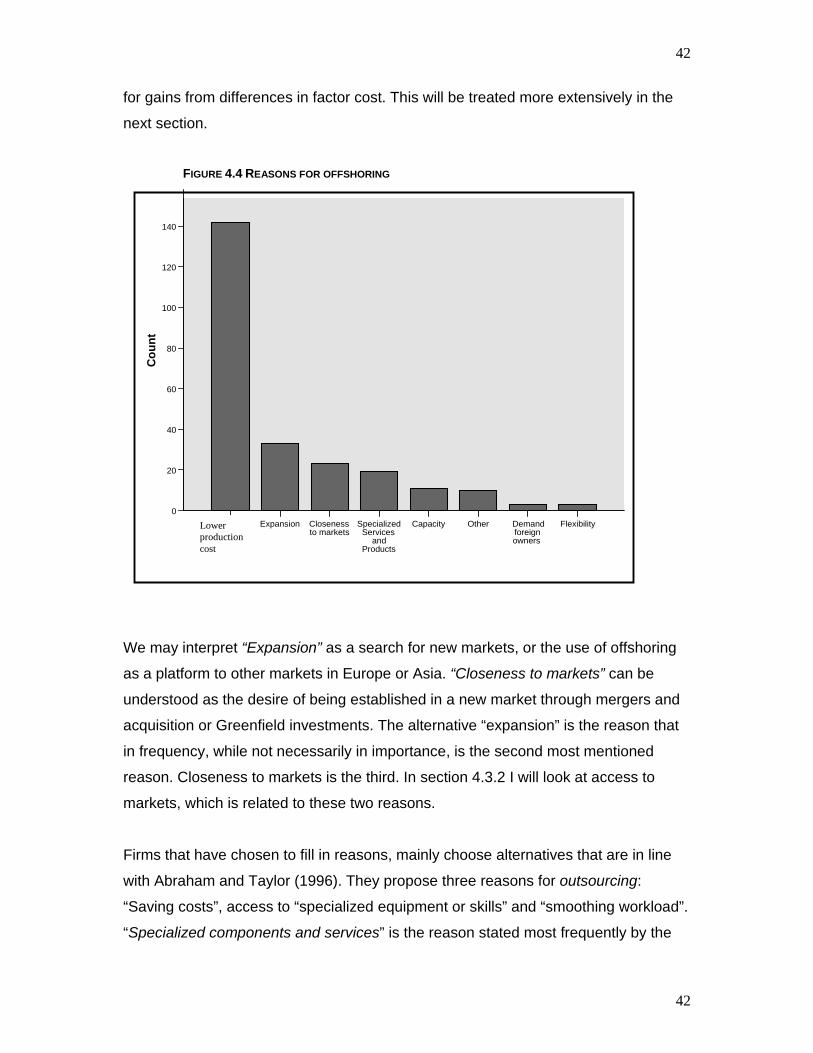
42
42
for gains from differences in factor cost. This will be treated more extensively in the
next section.
FIGURE 4.4 REASONS FOR OFFSHORING
We may interpret “Expansion” as a search for new markets, or the use of offshoring
as a platform to other markets in Europe or Asia. “Closeness to markets” can be
understood as the desire of being established in a new market through mergers and
acquisition or Greenfield investments. The alternative “expansion” is the reason that
in frequency, while not necessarily in importance, is the second most mentioned
reason. Closeness to markets is the third. In section 4.3.2 I will look at access to
markets, which is related to these two reasons.
Firms that have chosen to fill in reasons, mainly choose alternatives that are in line
with Abraham and Taylor (1996). They propose three reasons for outsourcing:
“Saving costs”, access to “specialized equipment or skills” and “smoothing workload”.
“Specialized components and services” is the reason stated most frequently by the
FlexibilityDemand foreign owners
OtherCapacitySpecialized Services
and Products
Closeness to markets
ExpansionPrice
140
120
100
80
60
40
20
0
Cou
nt
Lower production cost
43
43
companies that filled in their own reasons for offshoring42. “Specialized components
and services” may be understood as firms not being able to find the same human
capital, resources or technology in Norway. “Capacity” is also given as a reason for
offshoring and it may be interpreted as letting external firms produce parts of goods
in periods with higher demand rather than expanding the company at home. This
may also be related to flexibility as it might be difficult to adjust the work force or
capital assets when demand is low.
We see that “demand from foreign owner” is a small group of responses. This
disposes the assertion that foreign ownership is equivalent with offshoring. (TBL,
2001)
Looking at the industrial division and the reasons for offshoring given by graph 4.5,
we see that saving production cost is the main reason for offshoring in all industrial
sectors, but that it has a higher score within ship, offshore, textile and furniture (as a
share of the total responses within each category). This is also coherent with the
distribution of labour intensity shown in figure 4.1 above. Metal, the least labour
intensive industry, are also the industrial sector that have a lower share of responses
within “saving production costs” compared with total responses within metal (while
not in number). This, as noted, may be due to domestic access to relatively low cost
energy.
Offshore and Ship building industries have specialized over several years developing
specific competencies. From graph 4.5 we see that neither of these two industries
looks abroad to find specialized services or products, probably because we have the
necessary competencies in Norway. Capacity is mentioned in both industries, which
may be explained by occasional large orders which employ all of the production sites,
equipment and labour, while in times with lower demand, there may be excess labour
and production capacity.
42 It may be that it is easier to tick of the completed alternatives, rather than stating reasons them self, thus the categories may be underestimated.
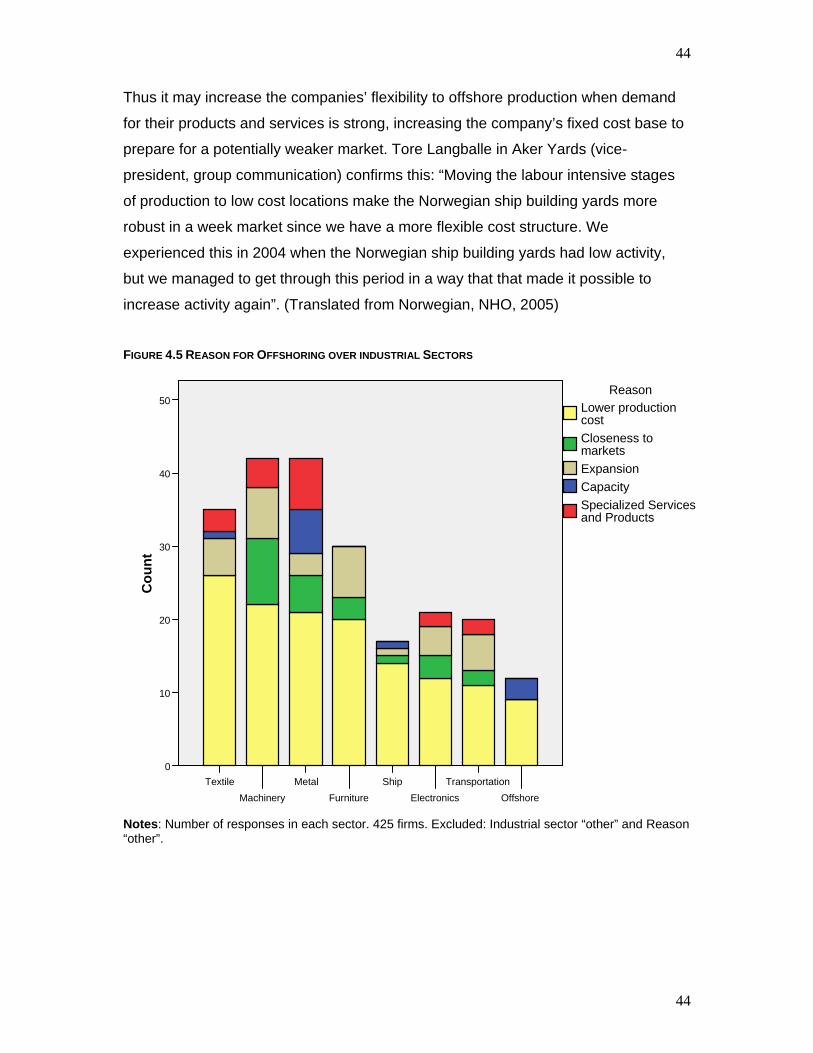
44
44
Thus it may increase the companies’ flexibility to offshore production when demand
for their products and services is strong, increasing the company’s fixed cost base to
prepare for a potentially weaker market. Tore Langballe in Aker Yards (vice-
president, group communication) confirms this: “Moving the labour intensive stages
of production to low cost locations make the Norwegian ship building yards more
robust in a week market since we have a more flexible cost structure. We
experienced this in 2004 when the Norwegian ship building yards had low activity,
but we managed to get through this period in a way that that made it possible to
increase activity again”. (Translated from Norwegian, NHO, 2005)
FIGURE 4.5 REASON FOR OFFSHORING OVER INDUSTRIAL SECTORS
OffshoreTransportation
ElectronicsShip
FurnitureMetal
MachineryTextile
50
40
30
20
10
0
Cou
nt
Specialized Services and Products
CapacityExpansion
Closeness to markets
Lower production cost
Reason
Notes: Number of responses in each sector. 425 firms. Excluded: Industrial sector “other” and Reason “other”.
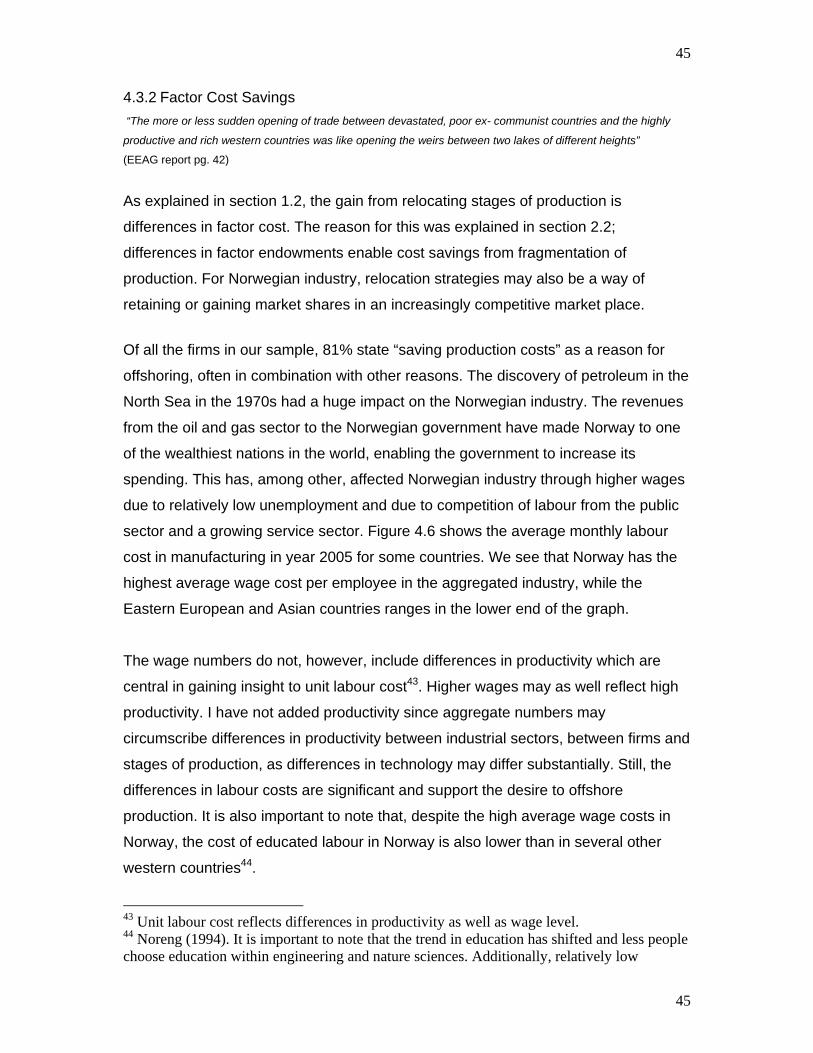
45
45
4.3.2 Factor Cost Savings “The more or less sudden opening of trade between devastated, poor ex- communist countries and the highly
productive and rich western countries was like opening the weirs between two lakes of different heights”
(EEAG report pg. 42)
As explained in section 1.2, the gain from relocating stages of production is
differences in factor cost. The reason for this was explained in section 2.2;
differences in factor endowments enable cost savings from fragmentation of
production. For Norwegian industry, relocation strategies may also be a way of
retaining or gaining market shares in an increasingly competitive market place.
Of all the firms in our sample, 81% state “saving production costs” as a reason for
offshoring, often in combination with other reasons. The discovery of petroleum in the
North Sea in the 1970s had a huge impact on the Norwegian industry. The revenues
from the oil and gas sector to the Norwegian government have made Norway to one
of the wealthiest nations in the world, enabling the government to increase its
spending. This has, among other, affected Norwegian industry through higher wages
due to relatively low unemployment and due to competition of labour from the public
sector and a growing service sector. Figure 4.6 shows the average monthly labour
cost in manufacturing in year 2005 for some countries. We see that Norway has the
highest average wage cost per employee in the aggregated industry, while the
Eastern European and Asian countries ranges in the lower end of the graph.
The wage numbers do not, however, include differences in productivity which are
central in gaining insight to unit labour cost43. Higher wages may as well reflect high
productivity. I have not added productivity since aggregate numbers may
circumscribe differences in productivity between industrial sectors, between firms and
stages of production, as differences in technology may differ substantially. Still, the
differences in labour costs are significant and support the desire to offshore
production. It is also important to note that, despite the high average wage costs in
Norway, the cost of educated labour in Norway is also lower than in several other
western countries44.
43 Unit labour cost reflects differences in productivity as well as wage level. 44 Noreng (1994). It is important to note that the trend in education has shifted and less people choose education within engineering and nature sciences. Additionally, relatively low
46
46
FIGURE 4.6 WAGE COST FOR INDUSTRY WORKERS 2005, NORWAY=100
Source: NHO, “Norge i verden”
The ship building industry in Norway, which is the industry with a higher share of
responses towards saving costs, faces strong competition in building standardized
ships due to a high domestic cost level. Most of the remaining ship builders in
Norway therefore have specialized their ship yards, typically on purpose-built ships
that require technical experience and managerial expertise, such as transport of
gas45 and chemicals, but also cruise vessels (Hammer, 2000). Production of ship
may require machinery and training which can be expensive to implement. In
addition, it may be that the transaction costs are high due to asset specificity if they
use arm-length contracts. Aker Yard, as an example, uses in-house offshoring of hull
to Romania.
Saving costs is the main reason why the offshore industry offshore, partly due to
competition from low cost countries. The Norwegian offshore industry is reliant on a
strong home market with demand for more specialized equipment adapted to the
unemployment in Norway makes labour a scarce resource (see for example NHO, Norge i verden) 45 Here, Norway controls approximately ¼ of the world market.
Norway Denmark Germany Finland Sweden UK USA Ireland S- Korea Portugal Hungary Czech Rep.
47
47
Norwegian continental shelf, since most of the sale has been to oil companies
operating in the North Sea46. It is expected that the exploration in the oil and gas
industry will be higher in other countries than Norway going forward, countries which
have other requirements than Norway47. Thus, the Norwegian offshore industry must
be prepared for shifts in the demand. Aker Kværner has for example emphasized
their expertise in concrete technology and its potential use in the future LNG facilities
abroad. The expertise within Kværner in building large structures in concrete comes
from the construction of large oil platforms made by concrete on the Norwegian shelf
in the early 1980s48.
Production of textiles and furniture are typically unskilled labour intensive industries
with large potential gains from placing production in low cost locations. The high
costs of labour in Norway, as shown by figure 4.6, compared to countries with high
shares of unskilled labour, such as China, makes offshoring likely in the Norwegian
textile industry. In 2006, the wage increase in the Norwegian industry was expected
to be around 10,000 Norwegian kroner for an industry worker. That is approximately
the same as the annual salary for an industry worker in China49, exemplifying the
challenges the unskilled labour intensive industry faces in Norway.
One way of reducing competition is to produce niche products. Specialization, or
making the products unique, allows firms to charge a higher price which is more
compatible with the cost level in Norway50. The demand for knowledge or
competencies in the production increases and many companies choose to produce
niche products rather than standardized goods.
The prediction that factor cost differentials promote vertical investments seems to fit
well with the Norwegian industry. The high costs of unskilled labour in Norway force
firms to relocate the low skilled labour intensive production processes and take
advantage of the comparative advantages of high educated labour and skills.
46 Oljeindustrienes landsforening, Kon-Kraft (2002) 47 See footnote 43 48 Bjørndal, A. (Januar 2007) 49 NHO, ”Norge i verden” 50 See footnote 46
48
48
4.3.3 Access to new markets “The emergence of China, India, and the former communist-bloc countries implies that the greater part of the earth’s population is now engaged, at least potentially, in the global economy. There are no historical antecedents for this development.” - Ben Barnanke, August 25, 2006.
Access to markets in Eastern Europe, increased the additional customer base with
75 million new potential customers. If we include Bulgaria, Romania and Turkey, the
number reaches 170 million new potential customers. These numbers are high, but
adding the potential gain in customer base from China, India and other emerging
economies, these numbers increase substantially. To take advantage in this growth,
companies may relocate downstream stages of production, or duplicate all the stages
of production, into these growing markets. The firms that responded “closeness to
markets” and “expansion” may have this in mind when relocating production
processes, most prominent within machinery, electronics and metal.
The creation of the common market in Europe has not only increased the size of the
market place, it has also reduced trade barriers. This has made Europe more
attractive for foreign investments from the US and Japan in the 1990s51. China joined
WTO in December 2001; giving the country access to important markets around the
world, facilitating the inflow and outflow of investments to China.
As can be seen in figure 4.4 and 4.5, several firms choose “expansion” as a reason
for their offshoring activity. This is particularly true within the furniture, transportation
and electronics industry. But 71% of the firms claiming expansion as a reason for
offshoring also mark “saving production cost” as important. Hence, firms may use
offshoring strategies to save costs but also possibly to evaluate expansion in the
future. Vertical investments can thus be serving as a platform for horizontal
investments into new markets when the firm collects knowledge and experience.
China has ambitions to become the world leader within ship building in year 2015,
and have made considerable investments in new, modern ship building yards. This
has attracted a large amount of Norwegian ship equipment suppliers52 searching for
51 Barba Navaretti and Venables (2004) 52 DnB Nor, https://www.dnbnor.no/bedrift/store/nyheter/kurs_mot_kina.html
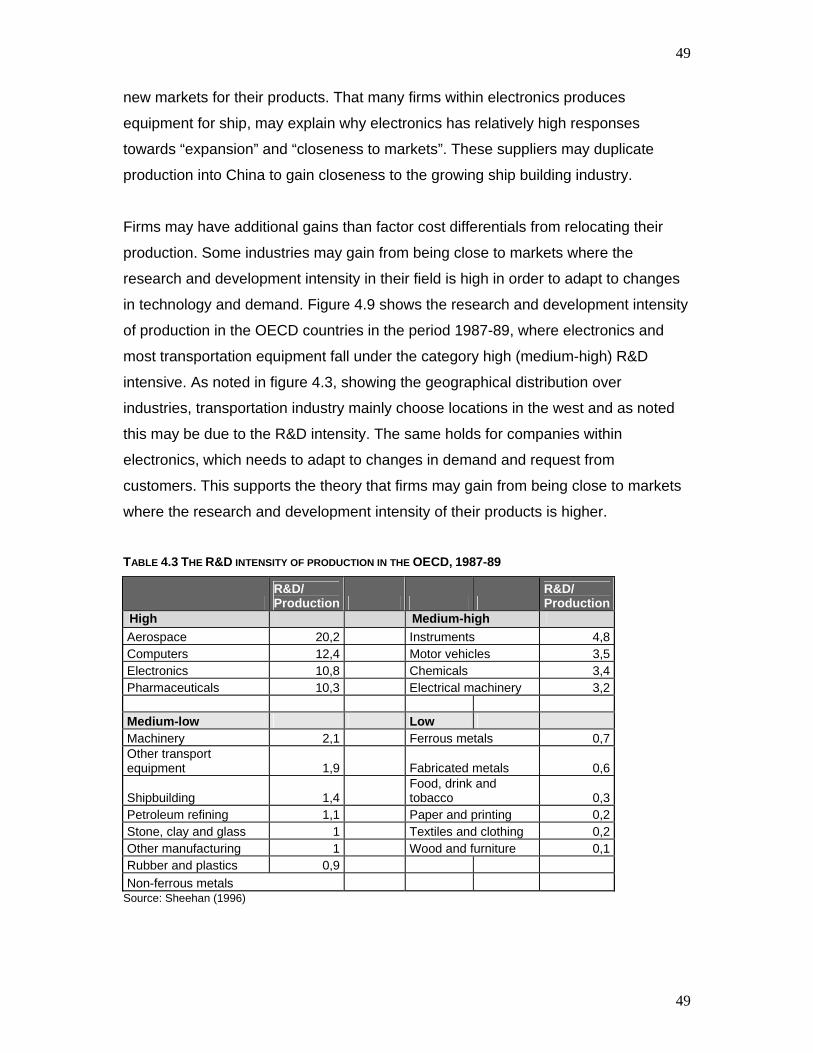
49
49
new markets for their products. That many firms within electronics produces
equipment for ship, may explain why electronics has relatively high responses
towards “expansion” and “closeness to markets”. These suppliers may duplicate
production into China to gain closeness to the growing ship building industry.
Firms may have additional gains than factor cost differentials from relocating their
production. Some industries may gain from being close to markets where the
research and development intensity in their field is high in order to adapt to changes
in technology and demand. Figure 4.9 shows the research and development intensity
of production in the OECD countries in the period 1987-89, where electronics and
most transportation equipment fall under the category high (medium-high) R&D
intensive. As noted in figure 4.3, showing the geographical distribution over
industries, transportation industry mainly choose locations in the west and as noted
this may be due to the R&D intensity. The same holds for companies within
electronics, which needs to adapt to changes in demand and request from
customers. This supports the theory that firms may gain from being close to markets
where the research and development intensity of their products is higher.
TABLE 4.3 THE R&D INTENSITY OF PRODUCTION IN THE OECD, 1987-89
R&D/ Production
R&D/ Production
High Medium-high Aerospace 20,2 Instruments 4,8 Computers 12,4 Motor vehicles 3,5 Electronics 10,8 Chemicals 3,4 Pharmaceuticals 10,3 Electrical machinery 3,2 Medium-low Low Machinery 2,1 Ferrous metals 0,7 Other transport equipment 1,9 Fabricated metals 0,6
Shipbuilding 1,4 Food, drink and tobacco 0,3
Petroleum refining 1,1 Paper and printing 0,2 Stone, clay and glass 1 Textiles and clothing 0,2 Other manufacturing 1 Wood and furniture 0,1 Rubber and plastics 0,9 Non-ferrous metals
Source: Sheehan (1996)
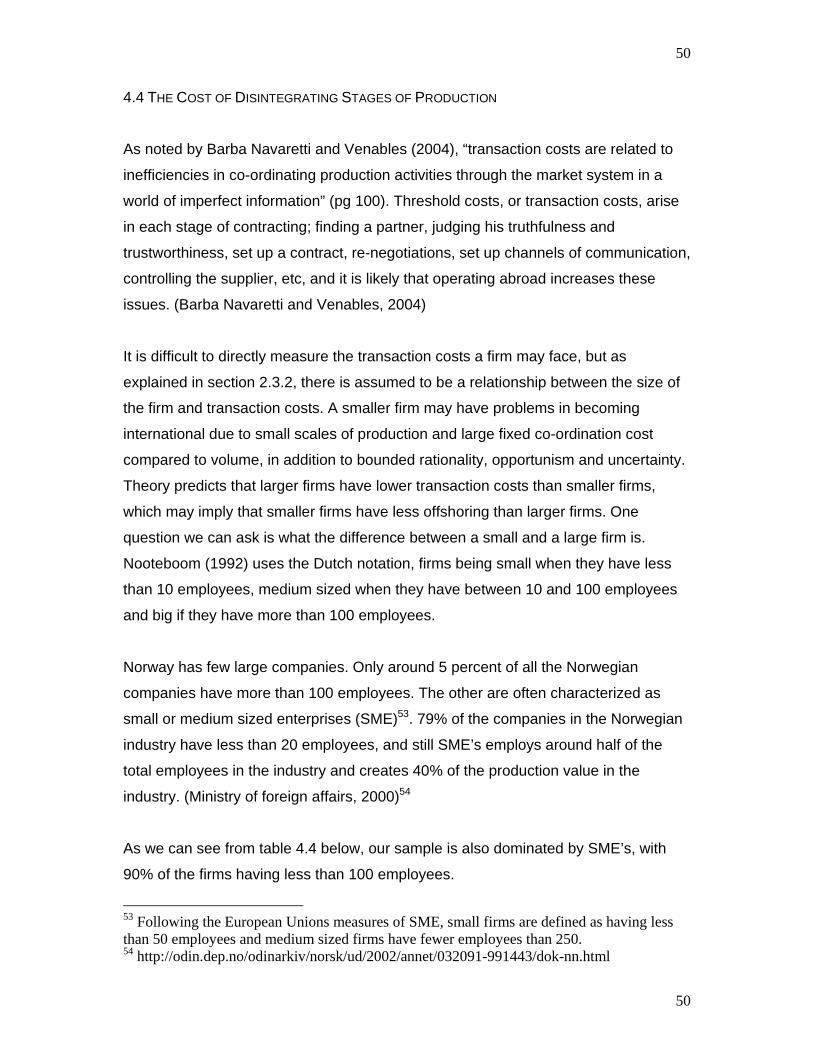
50
50
4.4 THE COST OF DISINTEGRATING STAGES OF PRODUCTION
As noted by Barba Navaretti and Venables (2004), “transaction costs are related to
inefficiencies in co-ordinating production activities through the market system in a
world of imperfect information” (pg 100). Threshold costs, or transaction costs, arise
in each stage of contracting; finding a partner, judging his truthfulness and
trustworthiness, set up a contract, re-negotiations, set up channels of communication,
controlling the supplier, etc, and it is likely that operating abroad increases these
issues. (Barba Navaretti and Venables, 2004)
It is difficult to directly measure the transaction costs a firm may face, but as
explained in section 2.3.2, there is assumed to be a relationship between the size of
the firm and transaction costs. A smaller firm may have problems in becoming
international due to small scales of production and large fixed co-ordination cost
compared to volume, in addition to bounded rationality, opportunism and uncertainty.
Theory predicts that larger firms have lower transaction costs than smaller firms,
which may imply that smaller firms have less offshoring than larger firms. One
question we can ask is what the difference between a small and a large firm is.
Nooteboom (1992) uses the Dutch notation, firms being small when they have less
than 10 employees, medium sized when they have between 10 and 100 employees
and big if they have more than 100 employees.
Norway has few large companies. Only around 5 percent of all the Norwegian
companies have more than 100 employees. The other are often characterized as
small or medium sized enterprises (SME)53. 79% of the companies in the Norwegian
industry have less than 20 employees, and still SME’s employs around half of the
total employees in the industry and creates 40% of the production value in the
industry. (Ministry of foreign affairs, 2000)54
As we can see from table 4.4 below, our sample is also dominated by SME’s, with
90% of the firms having less than 100 employees.
53 Following the European Unions measures of SME, small firms are defined as having less than 50 employees and medium sized firms have fewer employees than 250. 54 http://odin.dep.no/odinarkiv/norsk/ud/2002/annet/032091-991443/dok-nn.html
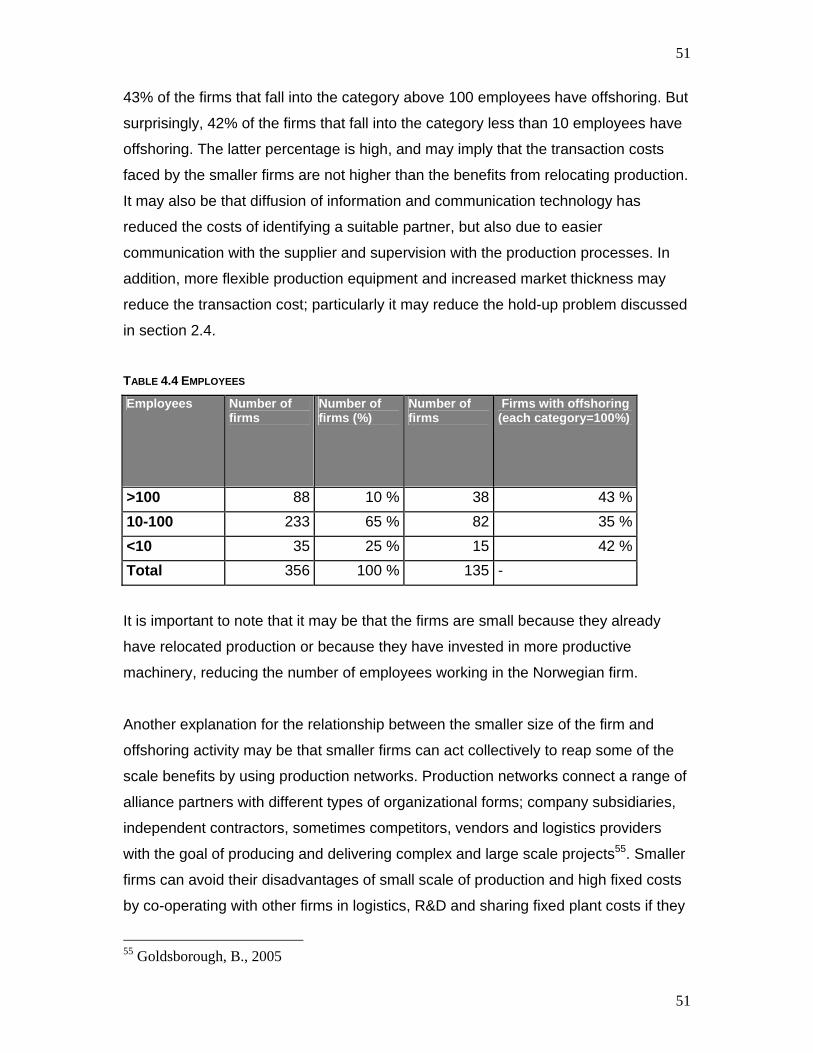
51
51
43% of the firms that fall into the category above 100 employees have offshoring. But
surprisingly, 42% of the firms that fall into the category less than 10 employees have
offshoring. The latter percentage is high, and may imply that the transaction costs
faced by the smaller firms are not higher than the benefits from relocating production.
It may also be that diffusion of information and communication technology has
reduced the costs of identifying a suitable partner, but also due to easier
communication with the supplier and supervision with the production processes. In
addition, more flexible production equipment and increased market thickness may
reduce the transaction cost; particularly it may reduce the hold-up problem discussed
in section 2.4.
TABLE 4.4 EMPLOYEES
Employees Number of firms
Number of firms (%)
Number of firms
Firms with offshoring (each category=100%)
>100 88 10 % 38 43 % 10-100 233 65 % 82 35 % <10 35 25 % 15 42 % Total 356 100 % 135 -
It is important to note that it may be that the firms are small because they already
have relocated production or because they have invested in more productive
machinery, reducing the number of employees working in the Norwegian firm.
Another explanation for the relationship between the smaller size of the firm and
offshoring activity may be that smaller firms can act collectively to reap some of the
scale benefits by using production networks. Production networks connect a range of
alliance partners with different types of organizational forms; company subsidiaries,
independent contractors, sometimes competitors, vendors and logistics providers
with the goal of producing and delivering complex and large scale projects55. Smaller
firms can avoid their disadvantages of small scale of production and high fixed costs
by co-operating with other firms in logistics, R&D and sharing fixed plant costs if they
55 Goldsborough, B., 2005
52
52
are located at the same site. As we will see in the next section, the smaller firm in our
sample offshore more often by using production networks.
Figure 4.7 shows the relationship between the size of the firm and the region to which
it offshore. From the theory of service link cost in section 2.3.2, we may expect that a
smaller company have smaller transaction necessities than a large firm, thus that the
unit cost of coordination is high. Surprisingly, smaller companies seem to be more
inclined to offshore to Asia than larger companies (as share of number of offshoring
firm in each group). The textile industry is typically dominated by small firms and a
high share uses the factor cost advantage by moving production to Asia, as can be
seen from graph 4.3. The small firms undertaking activities in Asia must find it
profitable to do so, thus the benefits from lower marginal costs must be greater than
the co-ordination that arises from offshoring.
FIGURE 4.7 SIZE OF FIRM AND REGION
0 %
10 %
20 %
30 %
40 %
50 %
>100 10 -100 <10
Employees in firm
Perc
enta
ge
West Eastern Europe Asia
Note: Firms may offshore to more than one region. Each category of employees represents 100%.
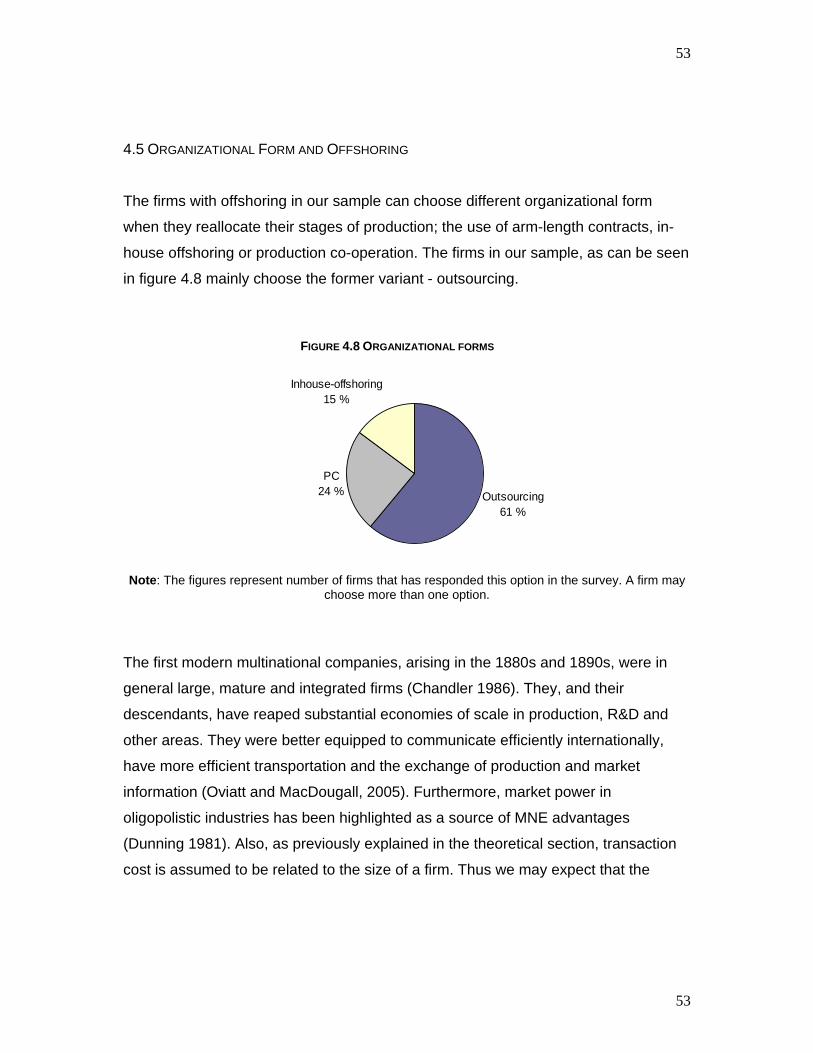
53
53
4.5 ORGANIZATIONAL FORM AND OFFSHORING
The firms with offshoring in our sample can choose different organizational form
when they reallocate their stages of production; the use of arm-length contracts, in-
house offshoring or production co-operation. The firms in our sample, as can be seen
in figure 4.8 mainly choose the former variant - outsourcing. FIGURE 4.8 ORGANIZATIONAL FORMS
Outsourcing61 %
PC24 %
Inhouse-offshoring15 %
Note: The figures represent number of firms that has responded this option in the survey. A firm may
choose more than one option.
The first modern multinational companies, arising in the 1880s and 1890s, were in
general large, mature and integrated firms (Chandler 1986). They, and their
descendants, have reaped substantial economies of scale in production, R&D and
other areas. They were better equipped to communicate efficiently internationally,
have more efficient transportation and the exchange of production and market
information (Oviatt and MacDougall, 2005). Furthermore, market power in
oligopolistic industries has been highlighted as a source of MNE advantages
(Dunning 1981). Also, as previously explained in the theoretical section, transaction
cost is assumed to be related to the size of a firm. Thus we may expect that the
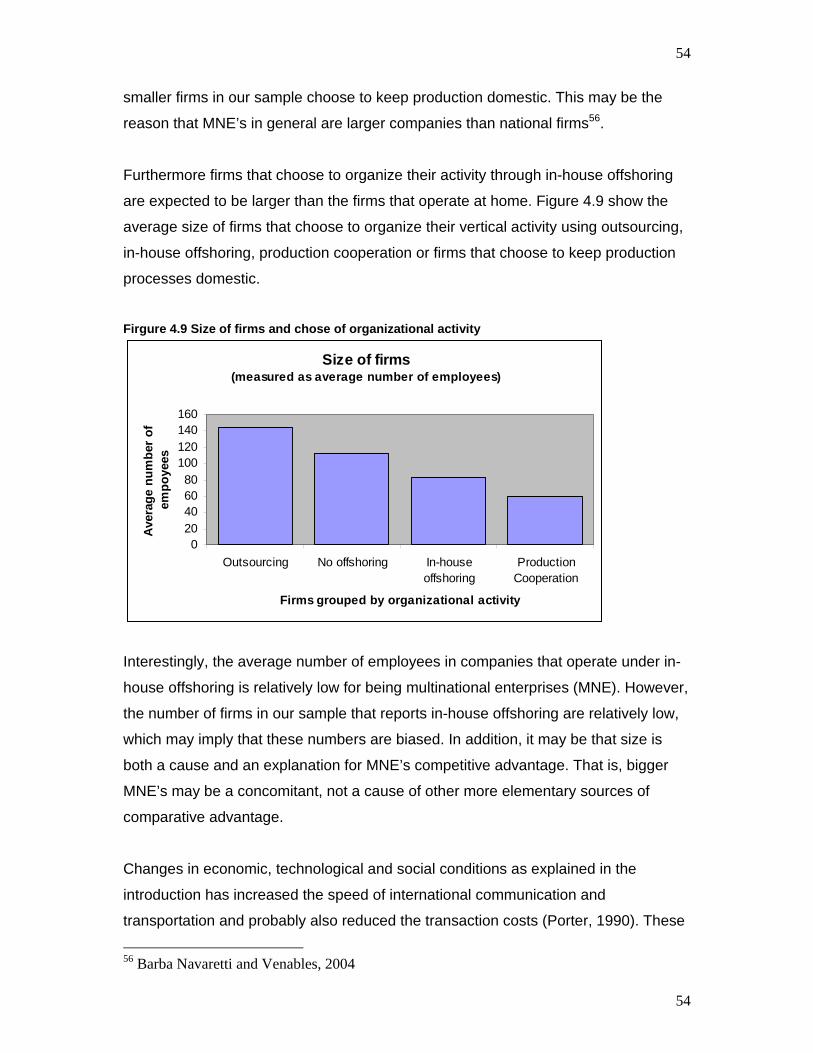
54
54
smaller firms in our sample choose to keep production domestic. This may be the
reason that MNE’s in general are larger companies than national firms56.
Furthermore firms that choose to organize their activity through in-house offshoring
are expected to be larger than the firms that operate at home. Figure 4.9 show the
average size of firms that choose to organize their vertical activity using outsourcing,
in-house offshoring, production cooperation or firms that choose to keep production
processes domestic.
Firgure 4.9 Size of firms and chose of organizational activity
Size of firms (measured as average number of employees)
020406080
100120140160
Outsourcing No offshoring In-houseoffshoring
ProductionCooperation
Firms grouped by organizational activity
Ave
rage
num
ber
of
empo
yees
Interestingly, the average number of employees in companies that operate under in-
house offshoring is relatively low for being multinational enterprises (MNE). However,
the number of firms in our sample that reports in-house offshoring are relatively low,
which may imply that these numbers are biased. In addition, it may be that size is
both a cause and an explanation for MNE’s competitive advantage. That is, bigger
MNE’s may be a concomitant, not a cause of other more elementary sources of
comparative advantage.
Changes in economic, technological and social conditions as explained in the
introduction has increased the speed of international communication and
transportation and probably also reduced the transaction costs (Porter, 1990). These
56 Barba Navaretti and Venables, 2004
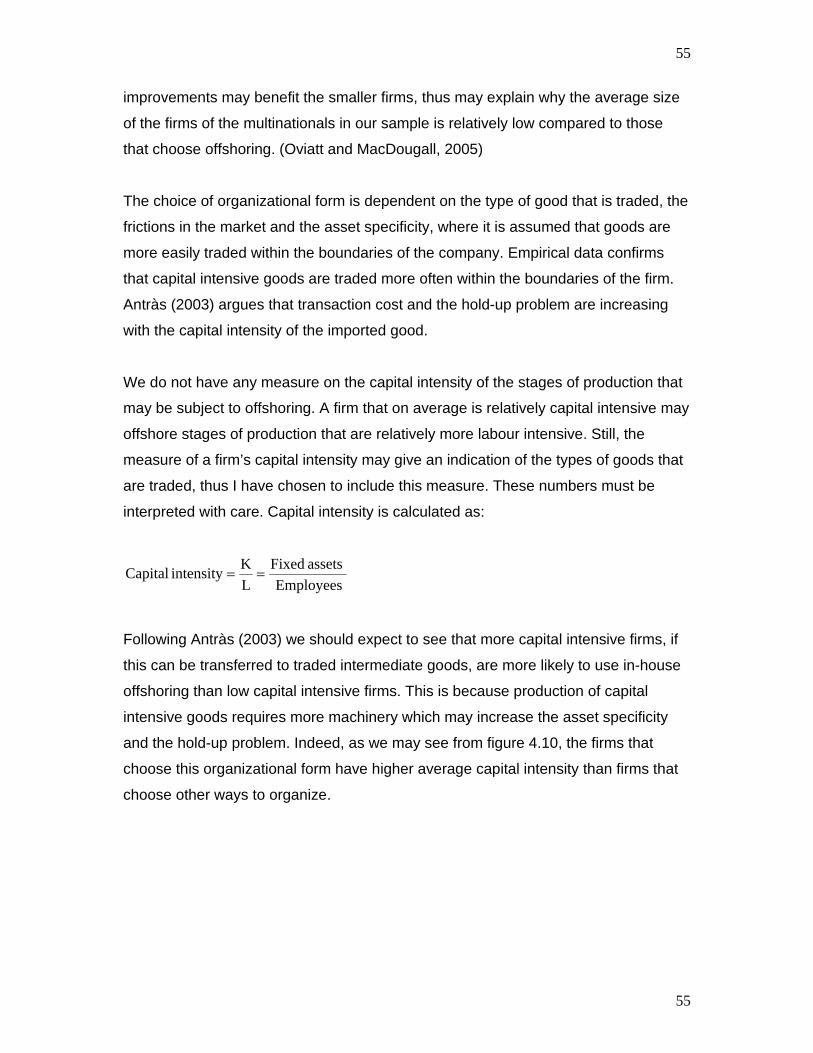
55
55
improvements may benefit the smaller firms, thus may explain why the average size
of the firms of the multinationals in our sample is relatively low compared to those
that choose offshoring. (Oviatt and MacDougall, 2005)
The choice of organizational form is dependent on the type of good that is traded, the
frictions in the market and the asset specificity, where it is assumed that goods are
more easily traded within the boundaries of the company. Empirical data confirms
that capital intensive goods are traded more often within the boundaries of the firm.
Antràs (2003) argues that transaction cost and the hold-up problem are increasing
with the capital intensity of the imported good.
We do not have any measure on the capital intensity of the stages of production that
may be subject to offshoring. A firm that on average is relatively capital intensive may
offshore stages of production that are relatively more labour intensive. Still, the
measure of a firm’s capital intensity may give an indication of the types of goods that
are traded, thus I have chosen to include this measure. These numbers must be
interpreted with care. Capital intensity is calculated as:
Employees assets Fixed
LKintensity Capital ==
Following Antràs (2003) we should expect to see that more capital intensive firms, if
this can be transferred to traded intermediate goods, are more likely to use in-house
offshoring than low capital intensive firms. This is because production of capital
intensive goods requires more machinery which may increase the asset specificity
and the hold-up problem. Indeed, as we may see from figure 4.10, the firms that
choose this organizational form have higher average capital intensity than firms that
choose other ways to organize.
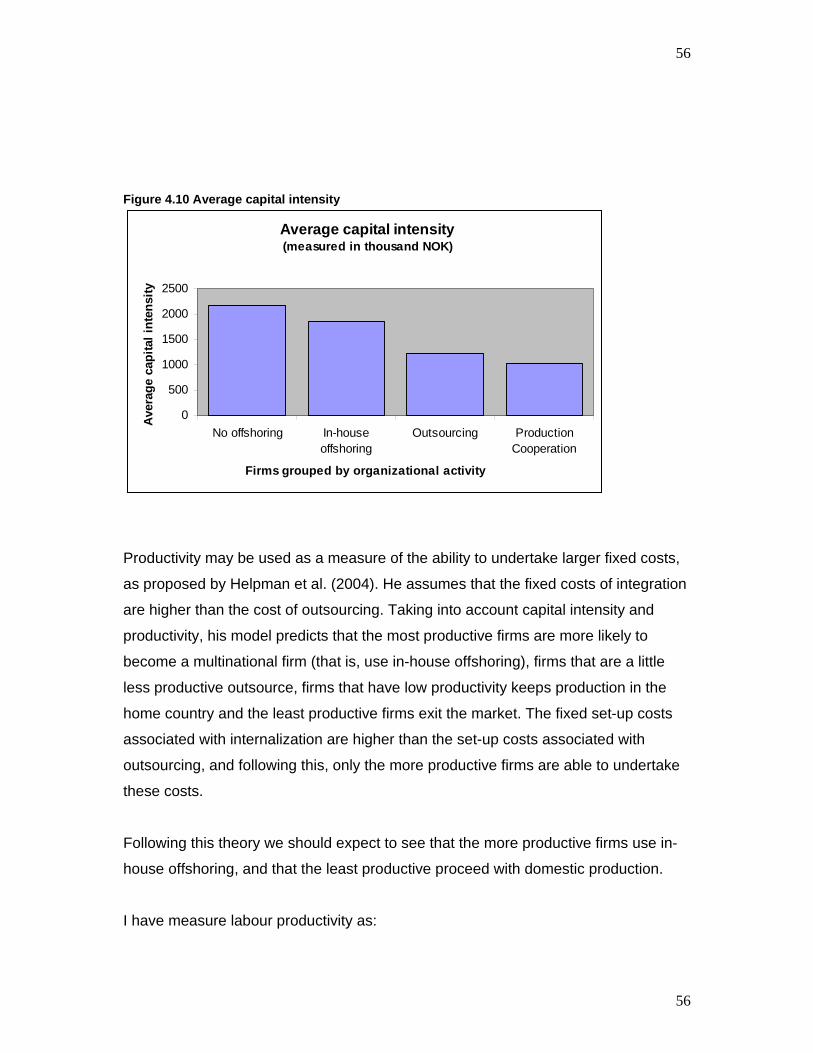
56
56
Figure 4.10 Average capital intensity
Average capital intensity (measured in thousand NOK)
0
500
1000
1500
2000
2500
No offshoring In-houseoffshoring
Outsourcing ProductionCooperation
Firms grouped by organizational activity
Ave
rage
cap
ital i
nten
sity
Productivity may be used as a measure of the ability to undertake larger fixed costs,
as proposed by Helpman et al. (2004). He assumes that the fixed costs of integration
are higher than the cost of outsourcing. Taking into account capital intensity and
productivity, his model predicts that the most productive firms are more likely to
become a multinational firm (that is, use in-house offshoring), firms that are a little
less productive outsource, firms that have low productivity keeps production in the
home country and the least productive firms exit the market. The fixed set-up costs
associated with internalization are higher than the set-up costs associated with
outsourcing, and following this, only the more productive firms are able to undertake
these costs.
Following this theory we should expect to see that the more productive firms use in-
house offshoring, and that the least productive proceed with domestic production.
I have measure labour productivity as:
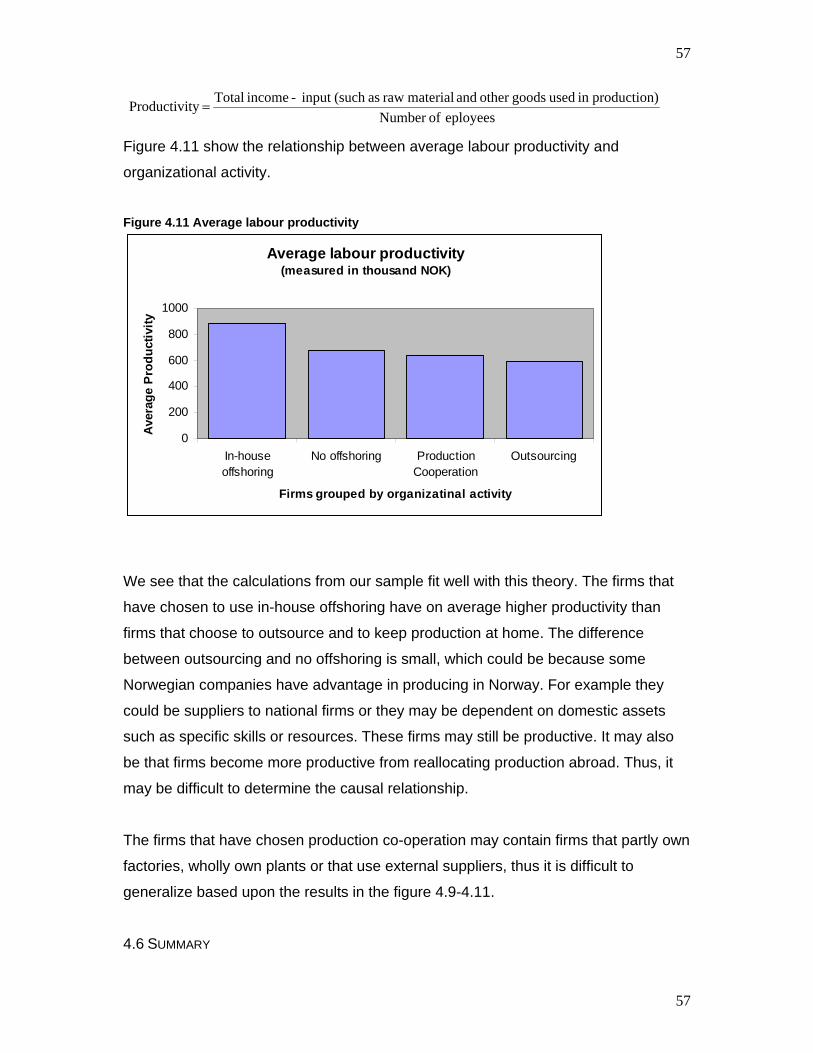
57
57
eployees ofNumber )productionin used goodsother and material raw as(such input - income Totalty Productivi =
Figure 4.11 show the relationship between average labour productivity and
organizational activity.
Figure 4.11 Average labour productivity
Average labour productivity (measured in thousand NOK)
0
200
400
600
800
1000
In-houseoffshoring
No offshoring ProductionCooperation
Outsourcing
Firms grouped by organizatinal activity
Ave
rage
Pro
duct
ivity
We see that the calculations from our sample fit well with this theory. The firms that
have chosen to use in-house offshoring have on average higher productivity than
firms that choose to outsource and to keep production at home. The difference
between outsourcing and no offshoring is small, which could be because some
Norwegian companies have advantage in producing in Norway. For example they
could be suppliers to national firms or they may be dependent on domestic assets
such as specific skills or resources. These firms may still be productive. It may also
be that firms become more productive from reallocating production abroad. Thus, it
may be difficult to determine the causal relationship.
The firms that have chosen production co-operation may contain firms that partly own
factories, wholly own plants or that use external suppliers, thus it is difficult to
generalize based upon the results in the figure 4.9-4.11.
4.6 SUMMARY
58
58
The determinants that trigger Norwegian firms to offshore production are many; some
determinants are dependent on type of industry and firm, while others are determined
by differences between countries. The determinants related to differences between
countries are variations between production costs at home and abroad and
differences in the markets at home and abroad. The determinants that are dependent
on firm and industry characteristics are in particular differences in factors used in
production, the type of good produced, if the production requires closeness to the
customers or if the firm has the potential to expand or not.
Most of the technology industry faces fierce competition in the markets they compete
in, and it is difficult to keep the production costs low as the costs of unskilled labour in
Norway is relatively high. This has lead to increased specialization, i.e. production of
niche goods, reducing the vulnerability with regards to production costs. In addition to
specialization of finished goods, the firms also divide stages of production into
production blocks, where each block may use one factor more intensively. These
blocks may be subject to relocations following patterns of comparative advantage
such as moving labour intensive stages of production to countries abundant in
labour. Relocation of production blocks may be a strategy to save production costs,
following from differences in factor prices. It may additionally be a strategy to get
access to specialized equipment or services, to be close to customers, to take
advantage of R&D in other locations or to take advantage of a growing market.
The descriptive analysis shows that 39% of the firm offshore production. The
furniture, textile, machinery and transportation equipment industries have offshoring
percentages above 45%. This relatively high occurrence of offshoring may be
explained by the relatively high labour intensity within textile, offshore, machinery and
transport equipment industries. There are 81% of the respondents that mention
saving production costs as a reason for offshoring. Thus it is adjacent to assume that
firms are exploiting differences in factor costs to save production costs. A majority of
the firms that relocate production choose to relocate their production in low cost
locations, particularly Poland and China, where the costs of unskilled labour are
relatively low.
59
59
Access to new markets may be an additional reason for offshoring. An increase in the
potential customer base and the likely growth in income per capita from the emerging
markets in Asia and Eastern Europe may attract companies to place downstream
stages of production in these markets. The industries machinery, metal and metal
goods, in addition to electronics have given reasons for offshoring that may imply that
access to markets is important. It may also be that these firms need to be close to
their customers in able to keep up with changes in demand and to maintain their R&D
activity by being close to R&D intensive countries. Furthermore, a firm may have
several strategies at hand when moving abroad. It can be that a firm that relocate
production in order to save costs in the imminent future, also in the long run is
interested in expanding into new markets, or it may wish to gain closeness to markets
through mergers or acquisitions, either by duplicating stages of production,
duplicating whole activities or by moving headquarters.
The costs arising from disintegrating stages of production, such as transportation
costs, co-ordination costs and transaction costs affect the decision to offshore
production. Theory explains that firms of bigger size face relatively less transaction
costs than smaller firms. By grouping the firms by size and viewing their offshoring
activity, we may be able to see whether our findings are consistent with theory. The
results are not clear from the TBL survey as also smaller firms have high shares off
offshoring.
There may also be costs that arise due to co-ordination. I reviewed the relationship
between region and the size of a firm. One could expect that smaller firms would
have lower shares of offshoring to Asian countries, due to distance and likely
increased transaction costs. However, the data from TBL did not indicate such a
relationship.
A firm may choose to relocate stages of production using in-house offshoring or it
may choose to use the external market mechanism to allocate resources. Most of the
firms in our sample choose the latter. There seems to be a relationship between a
firm’s capital intensity and in-house offshoring. It is also assumed that firms that
choose in-house offshoring are more productive. Reviewing average productivity
60
60
within the groups that choose different organizational forms, we find that the
productivity is higher within the group of firms that use in-house offshoring.
5.0 CONCLUSION
The aim of this thesis has been to analyse the determinants that trigger Norwegian
firms to offshore and how these firms choose to organize their offshoring activities;
through in-house offshoring or outsourcing. Surveying the determinants for offshoring
of the Norwegian industry is important for understanding the increasing verticality in
trade, and it can be a starting point of analyzing which industries that may be more
affected, and the consequences this could have for Norway.
The findings of this thesis are that differences in factor costs is the main reason for
offshoring production in the Norwegian industry, and that the benefits from doing so
are higher than the co-ordination costs that arise from disintegrating stages of
production. The choice of organizational form seems to be dependent on the capital
intensity of the final goods produced and on the productivity of the firms. The results
of this survey indicate that there does not seem to be less offshoring activity among
the smaller firms, despite the transactions costs related to offshoring.
Regardless of the large number of international articles and economic papers on the
topic of offshoring, there are a limited number of empirical analyses on offshoring in
the Norwegian industry. The problem may be lack of data, particularly longitudinal
data which may give more insight into how the economic environment affects the
decision to offshore production. This, in my opinion, should be requested for the
future debate about the Norwegian industry.
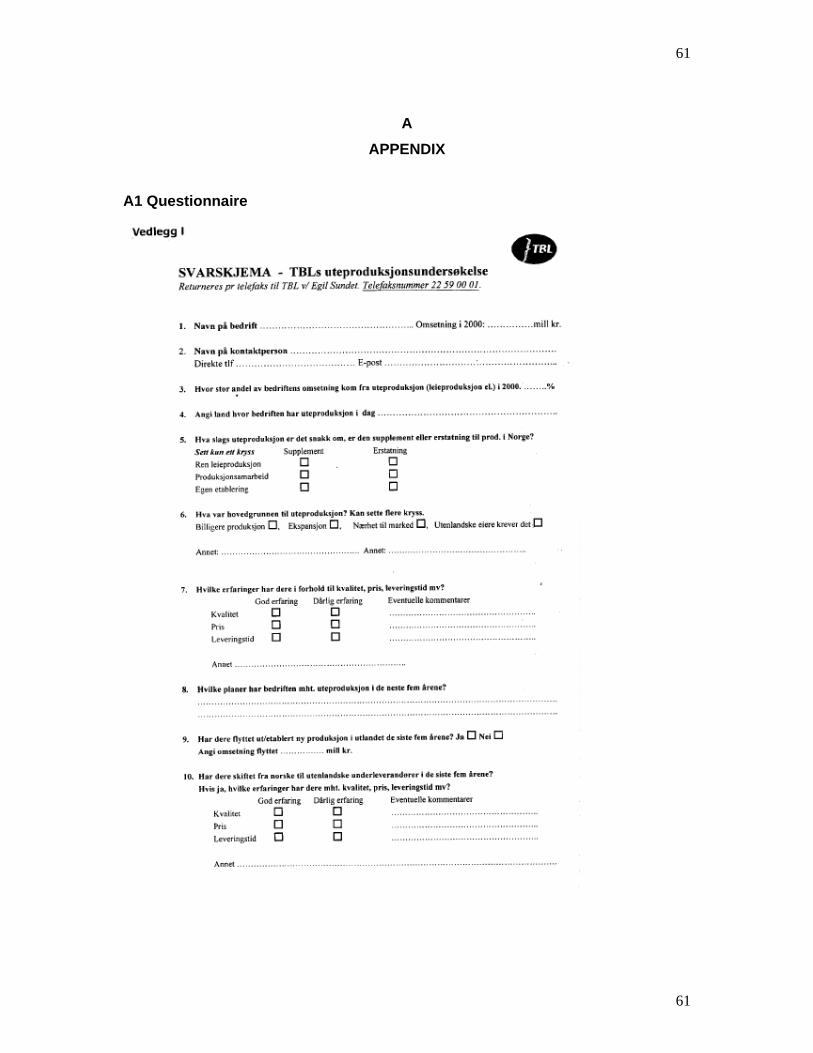
61
61
A APPENDIX
A1 Questionnaire
62
62
References/Literature
Abraham, K. & Taylor, S. (1996): “Firm’s Use of Outside Contractors: Theory and Evidence”, Journal of Labour Economics, Vol. 14: 394-424
Anderson, J. (2005): ”Trade Costs and Border Effects”, Industry Canada: Department of Federal Government
Antràs, P. (2003): “Firms, Contracts and Trade Structure”, Quarterly Journal of Economics, Vol. 118, 1375-1418
Antràs, P. & Helpman, E. (2004): “Global Sourcing”, National Bureau of Economic Research, Working Paper 10082
Arndt, S. W. & Kierzkowski, H. (eds) (2001): ”Fragmentation, New Production Patterns in the World Economy”, Oxford, Oxford University Press
Baldwin, R.E. (1999): “Two Waves of Globalization: Superficial Similarities and Fundamental Differences”, NBER Working Paper No. 6904
Barba Navaretti, G., & Venables, A.J. et al .(2004). ”Multinational Firms in the World Economy”, Princeton and Oxford, Princeton University Press
Bjørndal, A. (January, 2007), “Nordmenn bak gigantisk gassterminal i Algeciras”, Det Norske Magasinet, http://www.norskemagasinet.com/article.1155.html
Blossfeld, H:P et al. (Eds). (2005): “Globalization, Uncertainty and Youth in Society”, London: Routledge
Burda, M.C. & Dluhosch, B. (2000): “Cost Competition, Fragmentation and Globalization”, Review of International Economics, Vol 10(3), 424-441
Chandler Jr, A.D., (1986): “The Evolution of Modern Global Competition”, in M.E. Porter (ed.) Competition in Global Industries, Harvard Business School Press: Boston, 405-448
Clemens, M., Wiilamson, J.G. (2004): “Why did the Tariff-growth Correlation Change After 1950?”, Journal of Economic Growth, Vol. 9(1), 5-46
Coase, R. H. (1937): The Nature of the Firm”, Economica, New Series, Vol. 4(16), 386-405
Dahlman, C. (1979): “The Problem of Externality”, Journal of Law and Economics, Vol. 22(1): 141-162
Deardorff, A. V., (1998): Fragmentation Across Cones”, Papers 98-14, Michigan - Center for Research on Economic & Social Theory
Deardorff, A. V., (2001): “Fragmentation in Simple Trade Models”, The North American Journal of Economics and Finance, 12(2): 121-137
Denice C. et al. (2006): "Globalization: Trends, Issues and Macro Implications for the EU", European Commission., Economic Papers No. 254
DnbNor, https://www.dnbnor.no/bedrift/store/nyheter/kurs_mot_kina.html
Dunning, J. H., (1981): “International Production and the Multinational Enterprise”, George Allen & Unwin: London
63
63
Ekholm, K. & Hakkala, K. (2005): “The Effects of Offshoring on Labour Demand: Evidence from Sweden”, Workin Paper 654, The Research Institute of Industrial Economics
European Commision (2003), “SME Definition”, http://ec.europa.eu/enterprise/enterprise_policy/sme_definition/index_en.htm
European Conference of Ministers of Transportation (2004): “Transport and International Trade”, Conclusions at the Round Table 131, http://www.cemt.org/online/conclus/rt131e.pdf
Friedman, T. (2006): “The World is Flat – The globalized World in the Twenty-first Century”, Penguin Group
Goldsborough, B. *2005: “State Policy, California Exports, and the SME: Supply chain logistics as a tool to increase market share.
Grossman, G. & Rossi-Hansberg. E. (2006): “The Rise of Offshoring: It’s not Wine for Cloth Anymore”, Forthcoming in Conferece Volume: “The New Economic Geography: Effects and Policy Implications”
Groves, R. (1989): “Survey Errors and Survey Costs”, New York, John Wiley & Sons.
Hammer, H. (2000): “The Norwegian Shipping Industry”, The Norwegian Ship Owners’ Association, Ministry of Foreign Affairs
Harrigan, J. & Venables, A. (2004): “Timeliness, Trade and Agglomeration”, CEPR Discussion Paper No. 4294
Hart, O. (1995): “Firms, Contracts and Financial Structure”, Oxford, Clarendon Press
Heberlein & Baumgartner (1978): “Factors Affecting Response Rates to Mailed Questionnaires: A Quantitative Analysis of the Published Literature “, American Sociological Review, Vol. 43: 447-491
Jones, R. & Kierzkowski, H. (2000): “A framework for Fragmentation”, Tindenbergen Institute Discussion Paper, TI 2000-056-2
Jones, R. & Kierzkowski, H. (2003): “International Fragmentation and the New Economic Geography”, University of Rochester, and Graduate Institute of International Studies, Genova
Kvinge, T. (2003): “Direkte investeringer i EU’s nye medlemsland i Øst- Europa”, Fafo Øst Forum, Fafo notat 2005:9
Lydersen, T. (2007): “Slåss mot Kina-kopier”, Aftenposten, January 22nd, 2007. http://e24.no/selskap/EKO/article1612256.ece?service=print
MacLaren, J. (2003): “Trade and Market Thickness”, Journal of European Economic Association, MIT Press, Vol. 1(2-3), 328-336
Markusen, J. (2005), “Modelling the Offshoring White-Collar Services: From Comparative Advantage to the New Theories of Trade and FDI.”, NBER Working Paper No. 11827: 38.
Messerlin, P. (2001): “Measuring the Cost of Protection in Europe: European Commercial Policy in the 2000s”, Wash. DC, Institute for Intenational Economics.
NHO (2005), “Skape hjemme og ute”, http:coreweb.nhosp.no/norgeiverden.no/files/skape_ute_og_hjemme.pdf
NHO, ”Norge i verden”, http://coreweb.nhosp.no/norgeiverden.no/html/files/NHO_Norge_i_Verden_lang.pdf
Nooteboom, (1992): “Firm Size Effects on Transaction Costs”, Small Business Economics, Springer Netherlands, vol. 5(4), 283-295
Noreng, Ø. (1994): “Norge og de nye markedene I Nordøst-Europa”, Oslo, Ad Notam Gyldendal
64
64
Norman, V. (1993): “Næringsstruktur og utenrikshandel i en liten åpen økonomi”, Oslo, Universitetsforlaget
Oljeindustriens landsforening, Kon-Kraft (2002): ”Kapital prosjektet – Verdiskapning, lønnsomhet og finansielle muligheter for petroleumsklyngen”, http://www.olf.no/?12886.doc
Oviatt B.M & McDougall P.P, (2005), “Toward a theory of international new ventures”, Journal of international Business Studies No. 36, 29-41
Porter, M.E., “The competitive advantage of nations”, New York: The Free Press
Sheehan, P. J. & Tikhomirova, G. (1996), “Diverse Paths to Industrial Development in East Asia and ASEAN”, CSES Working Paper No. 6.
Statistics Norway (2000): “Manufacturing Statistics 2000”, http://www.ssb.no/emner/10/07/nos_industri/nos_d284/nos_d284.pdf
Statistics Norway (2004): ”PRODCOM listen for år 2004”. http://www.ssb.no/emner/10/07/prodcom/
Statistics Norway (2006): “Økonomiske Analyser”, 1/2006, www.ssb.no/emner/08/05/10/oa/200601/prod-marked.pdf
Teknologibedriftenes Landsforening (2001): ”Uteproduksjon – Redning eller undergang”
Vernon, R. (1996): ”International Investments and International Trade in the Product Cycle”, The Quarterly Journal of Economics, Vol. 80(2), 190-207
Williamson, O. E. (1985): “The Economic Institutions of Capitalism”, London, Collier Macmillian Publishers
Øyslebø, J. (2000): “Norsk Eksport industri”, Ministry of Foreign Affairs, http://odin.dep.no/odinarkiv/norsk/ud/2002/annet/032091-991443/dok-nn.html
Recommended