Environment & Resources
Technical University of Denmark
Online headspace chromatographic method for measuring VFA in biogas reactors
Kanokwan Boe, Damien John Batstone, Irini Angelidaki
Environment & Resources
Technical University of Denmark
Lyngby, Denmark
Environment & Resources
Technical University of Denmark
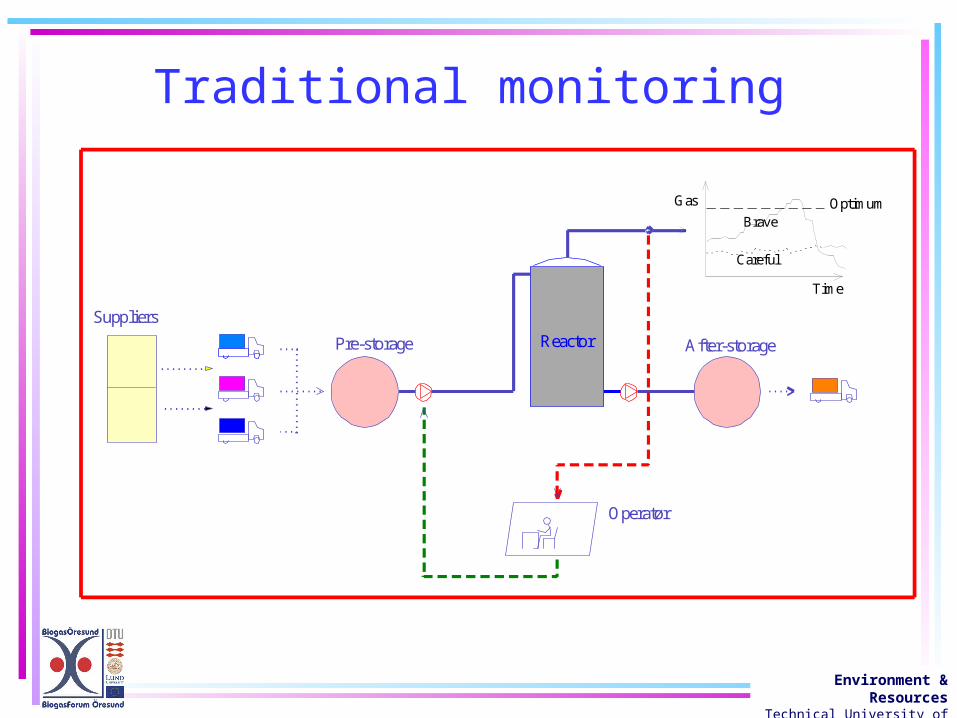
Suppliers
Pre-storage After-storageReactor
Operatør
Time
Gas
Careful
BraveOptimum
Traditional monitoring
Environment & Resources
Technical University of Denmark
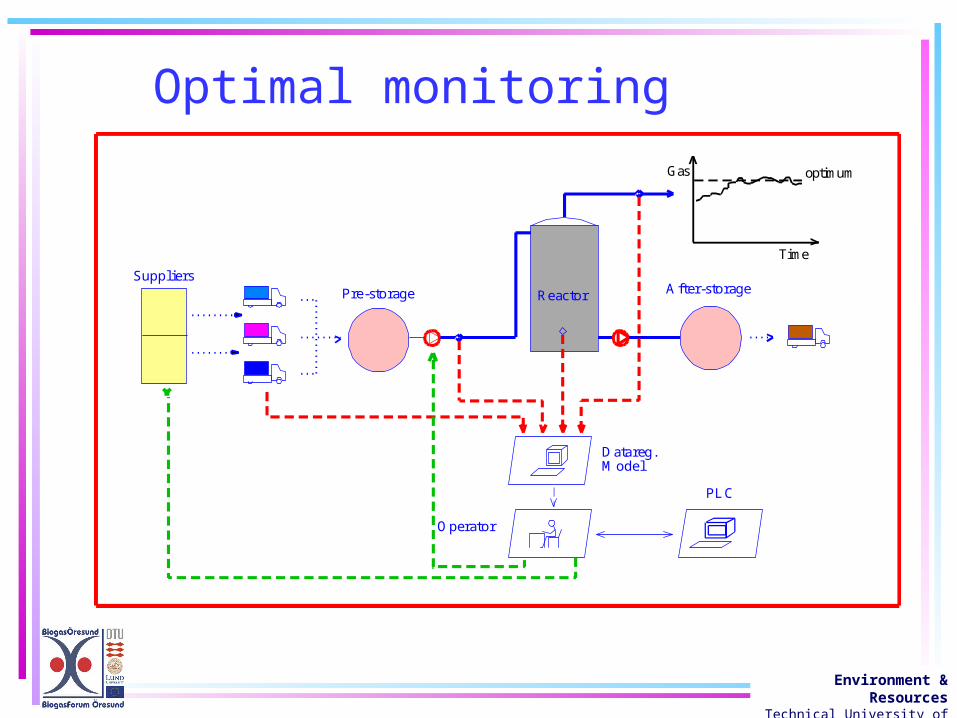
SuppliersPre-storage After-storageReactor
Operator
Time
Gas
Datareg.Model
PLC
optimum
Optimal monitoring
Environment & Resources
Technical University of Denmark
Good indicator
• To indicate the actual status of the process
• To give an early warning
• To give a secure warning
• To always predict imbalance
Environment & Resources
Technical University of Denmark
Types of disturbances• Hydralic overload
• Organic overload
• Toxic compounds
• Temperature changes
• pH change
• New substrates
Environment & Resources
Technical University of Denmark
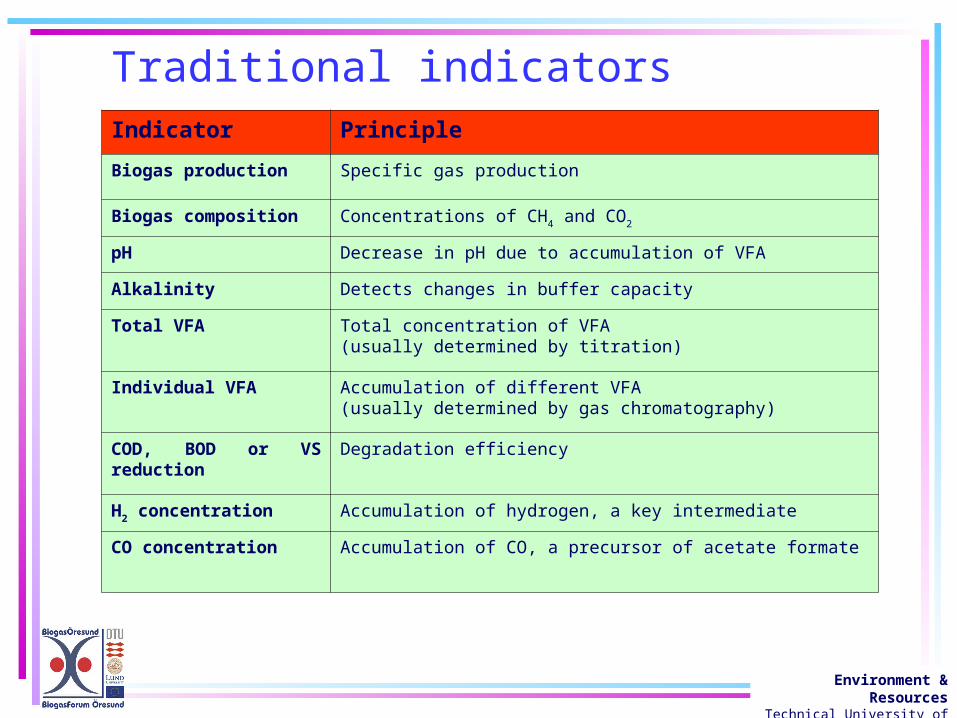
Traditional indicatorsIndicator Principle
Biogas production Specific gas production
Biogas composition Concentrations of CH4 and CO2
pH Decrease in pH due to accumulation of VFA
Alkalinity Detects changes in buffer capacity
Total VFA Total concentration of VFA(usually determined by titration)
Individual VFA Accumulation of different VFA(usually determined by gas chromatography)
COD, BOD or VS reduction
Degradation efficiency
H2 concentration Accumulation of hydrogen, a key intermediate
CO concentration Accumulation of CO, a precursor of acetate formate
Environment & Resources
Technical University of Denmark
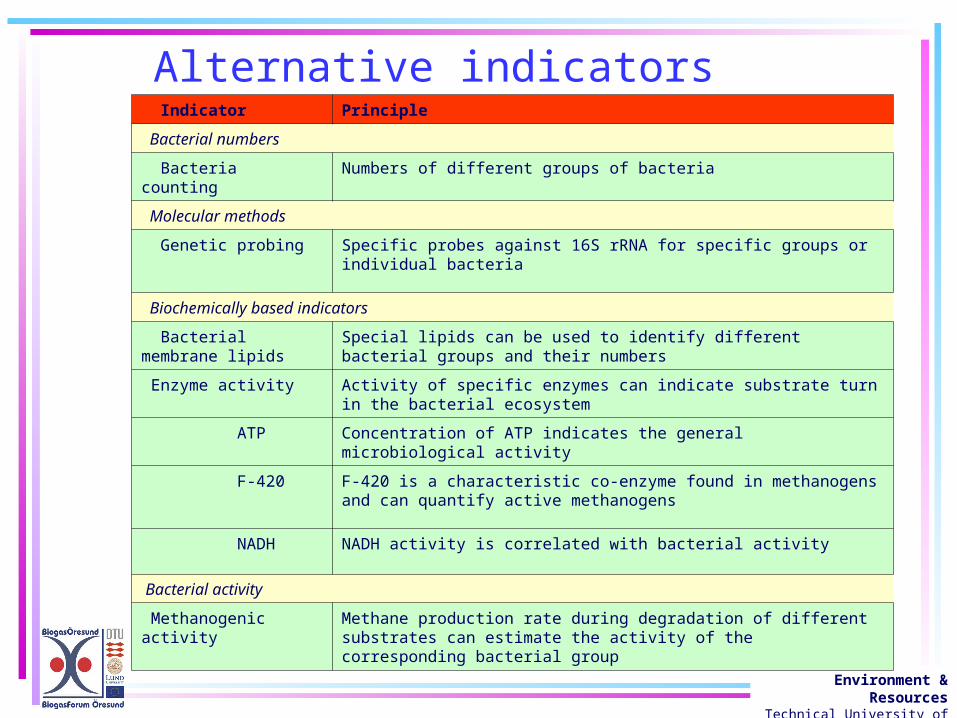
Alternative indicators Indicator Principle
Bacterial numbers
Bacteria counting Numbers of different groups of bacteria
Molecular methods
Genetic probing Specific probes against 16S rRNA for specific groups or individual bacteria
Biochemically based indicators
Bacterial membrane lipids Special lipids can be used to identify different bacterial groups and their numbers
Enzyme activity Activity of specific enzymes can indicate substrate turn in the bacterial ecosystem
ATP Concentration of ATP indicates the general microbiological activity
F-420 F-420 is a characteristic co-enzyme found in methanogens and can quantify active methanogens
NADH NADH activity is correlated with bacterial activity
Bacterial activity
Methanogenic activity Methane production rate during degradation of different substrates can estimate the activity of the corresponding bacterial group
Environment & Resources
Technical University of Denmark
Background
• Co-digestion plants
• Need of on-line monitoring system
• VFA as process indicator
• Digested manure => problem with filtration
Environment & Resources
Technical University of Denmark
Concept
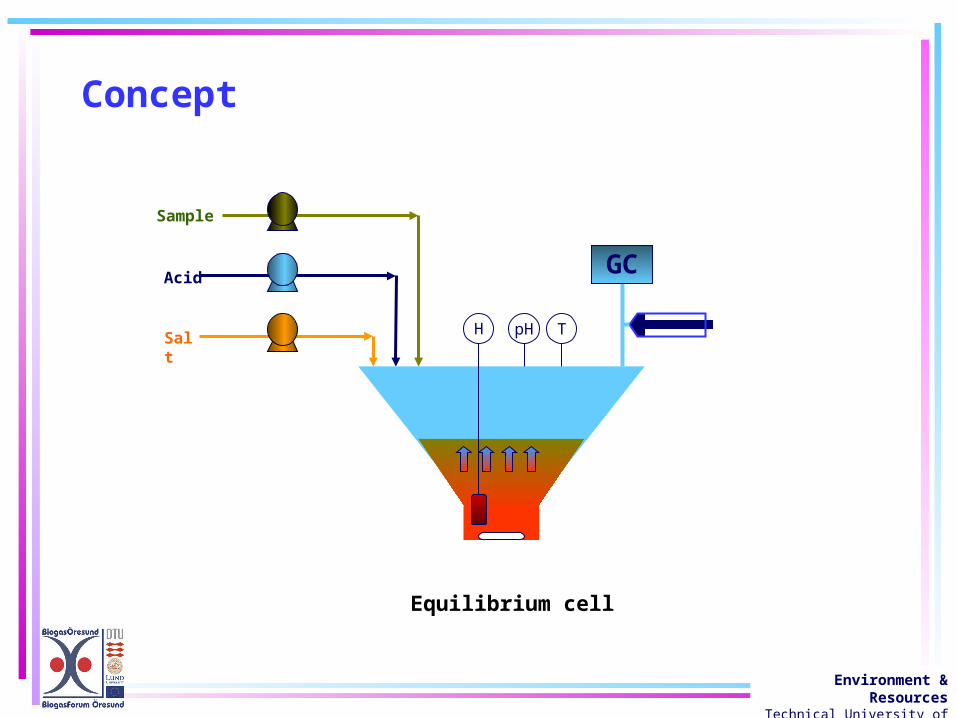
• Gas phase extraction
• Liquid sample => measure in gas phase
• High solid sample / slurry waste
• No pretreatment or filtration needed
• Individual VFA in liquid phase
Environment & Resources
Technical University of Denmark
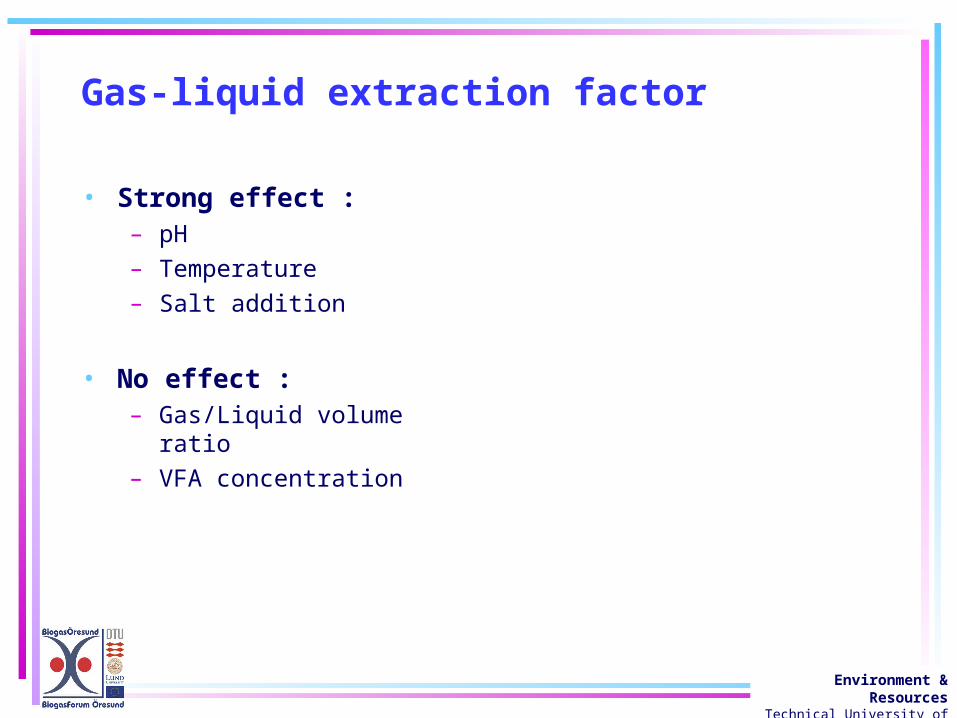
• Strong effect : – pH
– Temperature
– Salt addition
Gas-liquid extraction factor
• No effect :– Gas/Liquid volume ratio
– VFA concentration
Environment & Resources
Technical University of Denmark
Concept
Equilibrium cell
GC
pH T
Acid
Salt
Sample
H
Environment & Resources
Technical University of Denmark
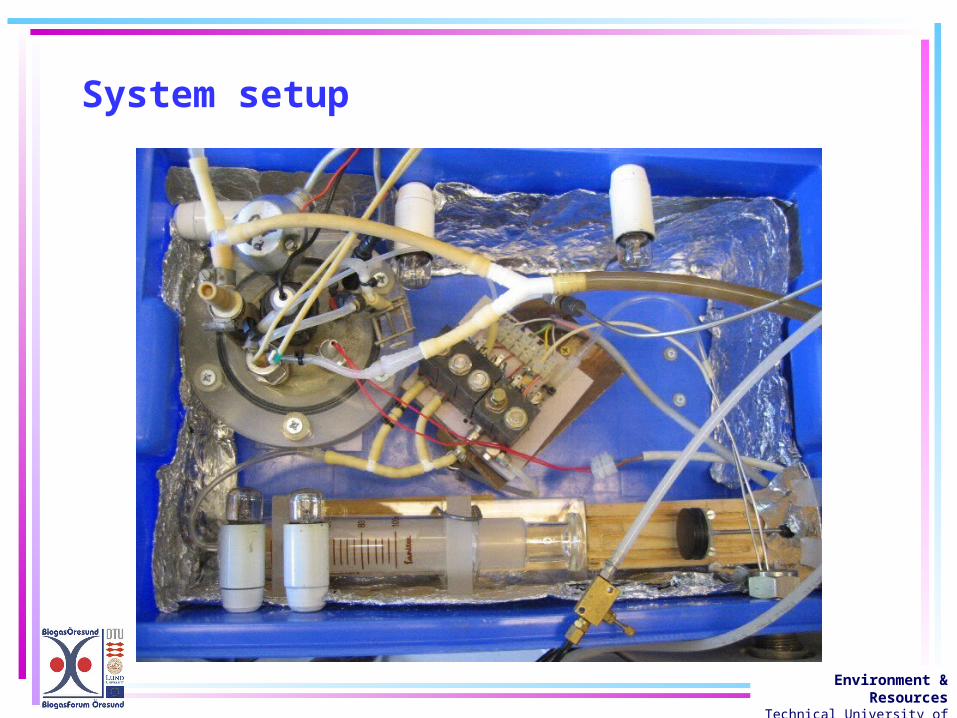
System setup
Environment & Resources
Technical University of Denmark
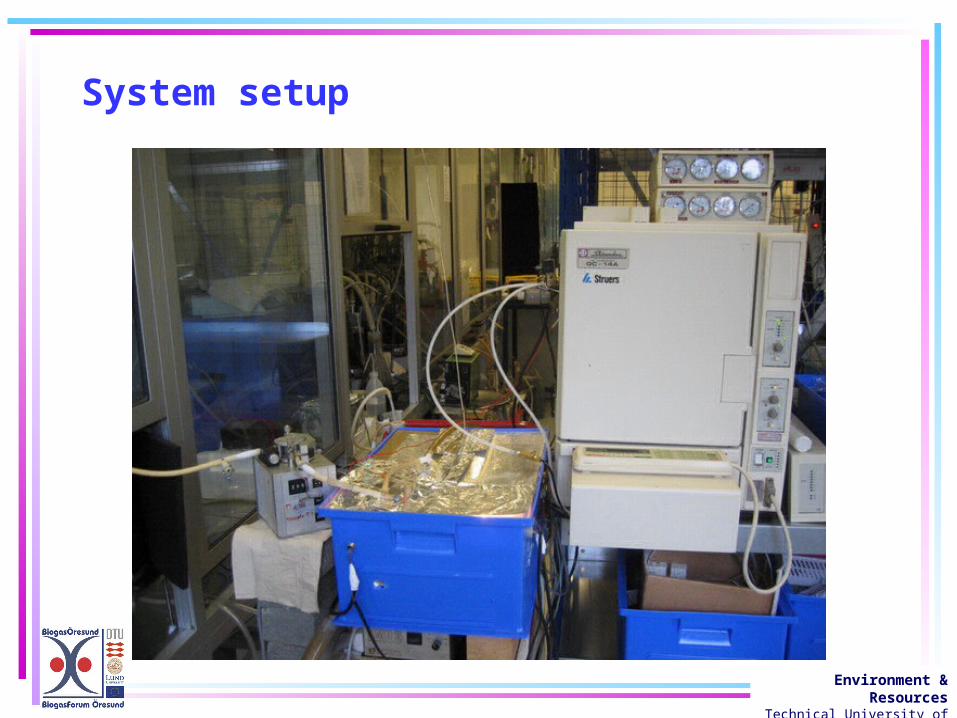
System setup
Environment & Resources
Technical University of Denmark
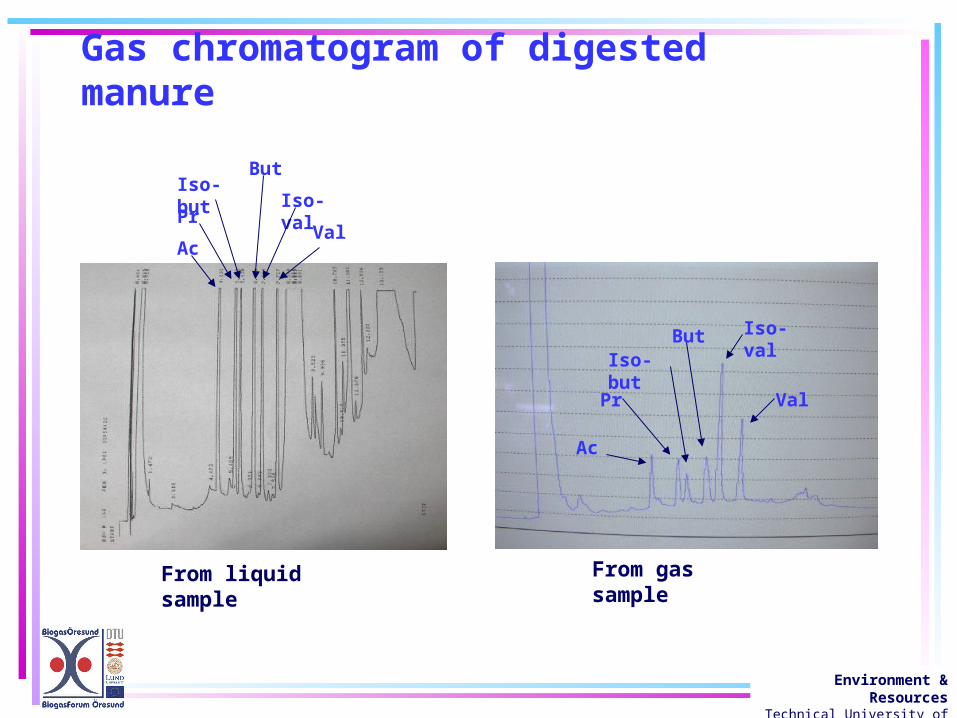
Gas chromatogram of digested manure
From liquid sample From gas sample
Ac
Ac
Pr
Pr
But Iso-val
But
Iso-but
Iso-butIso-val
Val
Val
Environment & Resources
Technical University of Denmark
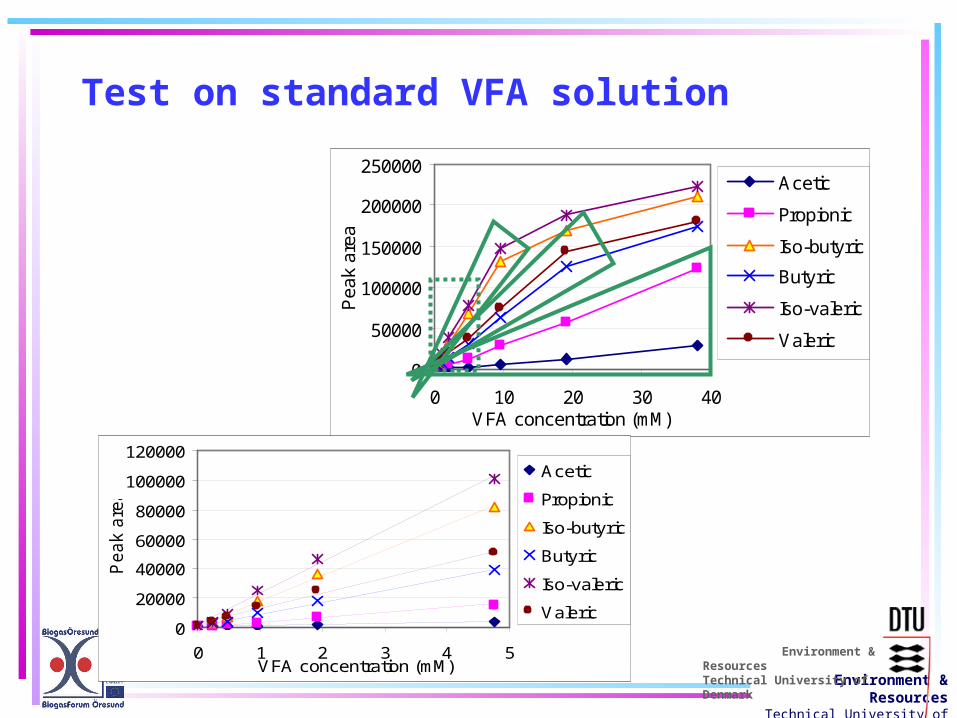
Test on standard VFA solution
0
50000
100000
150000
200000
250000
0 10 20 30 40VFA concentration (mM)
Pea
k ar
ea
Acetic
Propionic
Iso-butyric
Butyric
Iso-valeric
Valeric
0
20000
40000
60000
80000
100000
120000
0 1 2 3 4 5VFA concentration (mM)
Peak a
rea
Acetic
Propionic
Iso-butyric
Butyric
Iso-valeric
Valeric
Environment & ResourcesTechnical University of Denmark
Environment & Resources
Technical University of Denmark
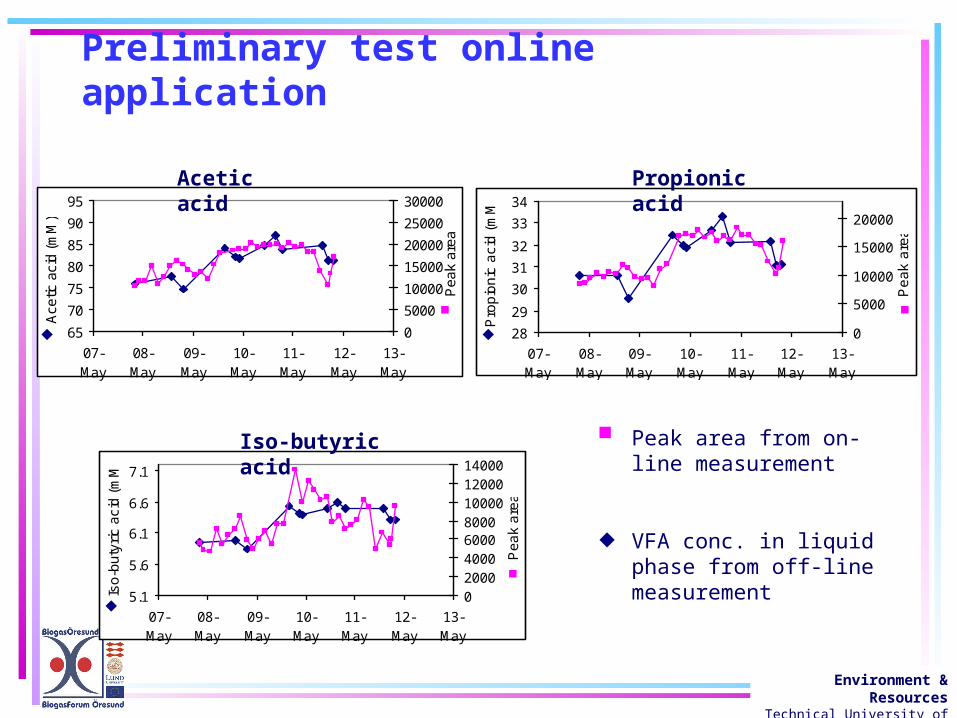
Preliminary test online application
65
70
75
80
85
90
95
07-May
08-May
09-May
10-May
11-May
12-May
13-May
Ace
tic a
cid
(mM
)
0
5000
10000
15000
20000
25000
30000
Pea
k ar
ea
28
29
30
31
32
33
34
07-May
08-May
09-May
10-May
11-May
12-May
13-May
Pro
pio
nic
ac
id (
mM
)
0
5000
10000
15000
20000
Pe
ak
are
a
5.1
5.6
6.1
6.6
7.1
07-May
08-May
09-May
10-May
11-May
12-May
13-May
Iso
-bu
tyri
c a
cid
(m
M)
02000400060008000100001200014000
Pe
ak
are
a
Acetic acid Propionic acid
Iso-butyric acid Peak area from on-line measurement
VFA conc. in liquid phase from off-line measurement
Environment & Resources
Technical University of Denmark
Conclusion
• New online-VFA by gas extraction from liquid sample
• pH < 2, Temperature > 65oC
• Linear calibration curve in application range
• Measure individual VFA
• No pretreatment or filtration needed
Environment & Resources
Technical University of Denmark
Acknowledgement
• Technicians : Uwe Albert WalterMajbrit Staun Jensen
• Students : Elena Fernández OrdázMickael Serres
Recommended